
Abstract
The glutamate uptake transporter GLT-1 is best understood for its critical role in preventing brain seizures. Increasing evidence argues that GLT-1 also modulates, and is modulated by, metabolic processes that influence glucose homeostasis. To investigate further the potential role of GLT-1 in these regards, the authors examined GLT-1 expression in pancreas and found that mature multimeric GLT-1 protein is stably expressed in the pancreas of wild-type, but not GLT-1 knockout, mice. There are three primary functional carboxyl-terminus GLT-1 splice variants, called GLT-1a, b, and c. Brain and liver express all three variants; however, the pancreas expresses GLT-1a and GLT-1b but not GLT-1c. Quantitative real time-PCR further revealed that while GLT-1a is the predominant GLT-1 splice variant in brain and liver, GLT-1b is the most abundant splice variant expressed in pancreas. Confocal microscopy and immunohistochemistry showed that GLT-1a and GLT-1b are expressed in both islet β- and α-cells. GLT-1b was also expressed in exocrine ductal domains. Finally, glutamine synthetase was coexpressed with GLT-1 in islets, which suggests that, as with liver and brain, one possible role of GLT-1 in the pancreas is to support glutamine synthesis.
High-affinity Na+-dependent glutamate transporters play an essential role in preventing neuroexcitotoxicity in the central nervous system (CNS) (Tanaka et al. 1997; Shimamoto et al. 2004). These molecules clear extracellular glutamate by transporting it across cellular membranes via coupled cotransport of Na+, K+, and H+ ions using the energy stored by the Na+/K+/H+ electrochemical gradients (Zerangue and Kavanaugh 1996; Levy et al. 1998; Diamond 2002). The glutamate transporter GLT-1 is of particular interest because it is responsible for clearing the majority of extracellular glutamate in brain regions such as the hippocampus (Lehre and Danbolt 1998; Furness et al. 2008). The significance of GLT-1 is further illustrated by the dramatic phenotype of GLT-1-deficient mice that die shortly after birth (Tanaka et al. 1997), while GLAST, EAAC1, and EAAT4 knockout mice display more subtle phenotypes or appear phenotypically normal until later in life (Peghini et al. 1997; Watase et al. 1998; Huang et al. 2004; Aoyama et al. 2006).
In addition to preventing glutamate-mediated toxicity, GLT-1 plays important roles in coordinating the energy needs of the CNS by modulating activity-dependent glucose utilization (Voutsinos-Porche et al. 2003; Herard et al. 2005). There is also evidence that GLT-1 interacts with elements of the insulin/Insulin-like Growth Factor signaling cascade (Li et al. 2006; Wu et al. 2010). The metabolic significance of GLT-1 is also evident outside the CNS. In liver, as well as brain, regulation of glutamate is closely associated with cellular metabolic states and glutamine cycling (Lieth et al. 2001; Tapiero et al. 2002; Zwingmann and Leibfritz 2003). In liver GLT-1 is expressed exclusively by hepatocytes abutting the hepatic central veins (Cadoret et al. 2002). It is well established that these perivenous hepatocytes, which also abundantly coexpress glutamine synthetase (GS, also called glutamate-ammonia ligase, GLUL), play a key role in synthesizing glutamine (Cadoret et al. 2002; Watford et al. 2002; Braeuning et al. 2006; Haussinger and Schliess 2007 ). The importance of perivenous hepatocytes in synthesizing glutamine is in keeping with their broader roles, which include scavenging potentially toxic metabolic molecules (e.g., ammonia, glutamate) and xenobiotic metabolism (Braeuning et al. 2006).
Since GLT-1 is expressed by a number of organ systems and cell types that can influence, or be influenced by, metabolic glucose homeostasis (Howell et al. 2001; Kim et al. 2003; Berger and Hediger 2006; Fukushima et al. 2010), we sought to examine the detailed expression patterns of GLT-1 in the pancreas. We were particularly interested in understanding the expression of distinct functional splice variants of GLT-1, an issue that has not been addressed.
Materials and Methods
Animals
Brains, livers, and pancreata were obtained from adult (4–6 months old) C57BL6 mice and from weanling (21–25 days old) GLT-1 wild-type and GLT-1 knockout mice (Tanaka et al. 1997) maintained on a C57BL6 background. GLT-1 knockout mice were used at this age because they seldom survive beyond 1 month of age. PCR genotyping was performed as described previously (Tanaka et al. 1997). All animals were housed and handled in accordance with protocols approved by the Veterans Affairs Puget Sound Health Care System’s Institutional Animal Care and Use Committee.
RT-PCR Screening of GLT1 Splice Variants
To detect GLT-1a, GLT-1b, and GLT-1c transcripts, total RNA was prepared by TRIzol (Invitrogen, Grand Island, NY) treatment of adult C57BL6 brain, liver, and pancreas that was ground via a liquid nitrogen–cooled mortar and pestle. Tissue-specific mRNAs were reverse-transcribed into cDNA (RT) using the RT SuperScript III and random primers (Invitrogen). The resulting RT and –RT products were used in a standard PCR reaction (1 µl RT or –RT product in 50 µl final volume). The PCR products were resolved via agarose gel electrophoresis, and splice variant–specific PCR products were visualized using ethidium bromide. The –RT samples lacked PCR product (data not shown). Sequences of the sense and antisense primers were as follows: CTAATGAGATCCAGGA-AGGCA and TTCACGTTTCC–AAGGTTCTTC for GLT-1a, ACTTTGCCTGTCACCT–TCCGTTGC and ATGCAGG-TCTCGATATCCAGG for GLT-1b, ACTTTGCCTGT-CACCTTCCGTTGC and TAA–ACCCACGATTGATAT TCCACA for GLT-1c.
Quantitative Real-Time PCR of GLT-1 Splice Variants
Total RNA was prepared by TRIzol (Invitrogen) treatment of tissue ground via liquid nitrogen–cooled mortar and pestle and again purified using an RNeasy mini spin column (Qiagen). Pancreatic RNA was further purified through an additional cycle of TRIzol/RNeasy treatment. All RNA preparation had a 260 nm / 280 nm ratio > 2. Samples were then treated with DNase I (Invitrogen). Using a High Capacity cDNA Reverse Transcription Kit (Applied Biosystem, Carlsbad, CA), 4 µg of tissue-specific RNA (40-µl reaction mixture) was then reverse transcribed to cDNA. GLT-1a and GLT-1b (NCBI: NM_001077515.2 and NCBI: NM_011393.2, respectively) variant quantities were measured with respect to ribosomal Eukaryotic elongation factor 1α1 (Eef1a1) (NM_010106.2), a ubiquitously expressed internal control, by generation of 100–500 bp intron-spanning amplicons using the following primer pairs: CGGCAGTCGCCTTGGACGTT and GCCCTTTCCC–ATCTCAGCAGCC for Eef1a1, GCAAGGTAACT–CTGGCGGCCA and GCAAAGACACAGCACGGTGCC for GLT-1a, and GTCTGCTGGTGGCGGTGGAC and AGATGGTCTGGGCCCCACAG for GLT-1b. Initial reaction cDNA concentrations were 20, 60, 180 ng and a 0.2µM primer pair concentration. Quantitative real-time PCR (qRT-PCR) monitoring of FastStart Universal SYBR Green (Roche, Indianapolis, IN) reactions were performed on an Applied Biosystems AB7500 Real Time PCR system. The variant quantities, relative to Eef1a1 amplification, were calculated from each amplicon’s instrument-obtained linear amplification threshold cycle counts (CT). With these data, the variant ratios (Ro) with respect to endogenous control (Eef1a1) were derived using the equation Ro = 2 – ΔCT (Schmittgen and Livak 2008). For negative control reactions, we used RNA prepared from each tissue in place of cDNA during real-time reactions. Neither amplification nor Tm profiles were observed in each RNA preparation in the same concentration range of cDNA preparations. Under these conditions, the efficiency of amplification was calculated for each profile and shown to be within 10% (Ramakers et al. 2003; Fujimura et al. 2010). The ratio for each specimen was averaged from three replicate experiments using the three different concentrations of cDNA for each tissue tested. All reagents and procedures were used according to the manufacturer’s instructions.
Immunohistochemistry and Immunofluorescence
Standard immunohistochemical (IHC) methods were used. Briefly, paraffin-embedded adult mouse pancreas sections were deparaffinized and rehydrated through ethanol steps, followed by a quench of endogenous peroxidase activity (30 min, 3% H2O2). These tissues were then rehydrated, antigen recovered (Revealit-Ag ImmunoSolution; 10 min, 85°C), permeabilized (0.25% Triton X-100/PBS, 15 min), and processed with Vector ABC kit (Vector Labs, Burlingame, CA) with the exception that slides were incubated with primary antibody overnight (4C). For double-label confocal studies, we used frozen sectioned p21 GLT-1 mouse pancreas processed for immunofluorescence via M.O.M. kit (Vector Labs). The resulting immunofluorescent (IF) samples were mounted in 50% glycerol/H2O and imaged on a Leica confocal microscope (Leica Microsystems, Buffalo Grove, IL, DMR, Type TCS SP-K). The specificity of anti-N-GLT-1 (referred to as AB12; 1:300 IHC; 1:2000 IF), anti-GLT-1a (1:500 IF), anti-GLT-1a (1:500 IF) has been validated previously comparing immunostaining in GLT-1 wild-type versus GLT-1 knockout tissue (Sullivan et al. 2004; Woltjer et al. 2010). AB12, GLT-1a, and GLT-1b are rabbit polyclonal antibodies generated in the laboratory of D. Pow (University of Queensland). Preimmune serum came from the same animal used to generate the AB12 antibody. The following antibodies were also used: anti-GS (BD Transduction Labs, Franklin Lakes, NJ, 610517, 1:1000 IF), anti-Laminin (Abcam, ab14055, 1:2000 IF), anti-Insulin (Sigma, St. Louis, MO, I2018, 1:2000 IF), anti-Glucagon (Sigma, G2654, 1:1000 IF), and their respective secondary antibodies (anti-Rabbit or anti-Mouse AF-488 or AF-555; 1:1000; Molecular Probes, Grand Island, NY, catalog Nos. A11070 and A21424). To collect images, the confocal microscope first scanned the sample using a 488-nm laser where the emissions from the sample were collected by a photomultiplier tube gated to detect emissions from Alexa 488 (Alexa, Grand Island, NY). The sample was scanned six times, and the resulting “green” figures represent the average of six scans. Following the 488-nm scans, the spectrophotometer gating was reset to correspond with Alexa 555 emissions; then the same z-plane was rescanned six times with a 555-nm laser. The “red” images also represent the average of six sequential scans. All images shown were single z-plane scans with the pinhole set at 1 airy unit. Laser intensity controls and photomultiplier sensitivity settings were held constant for all image acquisitions for a given experiment comparing experimental and control conditions. Merged images were created using the Leica confocal microscope software at the time of acquisition. Figures were prepared using the single z-plane merged red/green images. Figures using these Leica image files were prepared with Photoshop using only linear brightness and contrast adjustments that were applied identically to the appropriate experimental and control images. For some experiments, pancreas and liver sections were prepared by sectioning (20 µm) OCT-embedded frozen tissue. Frozen cut sections were then fixed in 10% neutral buffered formalin, and subsequent immunofluorescent labeling was performed as described above.
Western Blot Analyses
Pancreata were acutely dissected from p21 GLT-1 mice, rinsed in ice-cold PBS, and sonicated (Misonix Sonicator XL ultrasonic processor [Qsonica, Newtown, CT]; Power = 3, 50% duty cycle, 3 pulses) in ice-cold homogenization buffer (20mM TRIS pH 7.6, 1mM EDTA, 0.5mM EGTA, 1%Triton X-100, 250mM sucrose supplemented with Protease Inhibitor Cocktail for Mammalian Tissues [Sigma]). The resulting lysates were centrifuged (14,000 × g for 20 min), and the supernatant was collected. Supernatant protein BCA analysis (Pierce, Rockford, IL) was performed, and the remaining sample volumes were mixed with Laemmli buffer and stored at −20°C until analyzed with standard Western blotting.
Statistical Analysis
Quantitative data are presented as mean ± SEM. Statistical significance between groups was assessed using standard t-tests (two-tailed significance, p< 0.05). Error bars indicate SEM.
Results
Pancreas Expresses Splice Variant–Specific GLT-1 mRNA Species
Functional GLT-1 is expressed as a multimer comprising three noncovalently associated GLT-1 monomers, each approximately 65 kDa (Danbolt 2001; Yernool et al. 2004). Recently, great strides have been made in understanding the structure and function of GLT-1 based on the resolved X-ray crystal structure of a homologous eukaryotic glutamate transporter (Yernool et al. 2004; Qu and Kanner 2008; Reyes et al. 2009). Each GLT-1 monomer spans the membrane eight times (Yernool et al. 2004). Alternative splicing of distal 3′ exons in the GLT-1 gene give rise to three primary functional C-terminal splice variants, termed GLT-1a, GLT-1b, and GLT-1c (Pines et al. 1992; Arriza et al. 1994; Utsunomiya-Tate et al. 1997; Chen et al. 2002; Rauen et al. 2004; Holmseth et al. 2005). These unique intracellular extreme C-terminal domains mediate protein–protein interactions that influence splice variant–specific protein trafficking and cellular localization properties (Sullivan et al. 2004; Bassan et al. 2008).
To investigate which GLT-1 splice variants are expressed in pancreas, we isolated mRNA from whole pancreas (endocrine and exocrine tissue) obtained from adult C57BL6 mice and probed for specific GLT-1 splice variants using primers designed to selectively amplify GLT-1a, GLT-1b, and GLT-1c (Fig. 1A–1C, respectively) and mRNA from brain and liver served as positive controls. Consistent with previous findings (Utsunomiya-Tate et al. 1997; Chen et al. 2002; Kim et al. 2003; Chen et al. 2004; Sullivan et al. 2004; Holmseth et al. 2005; Berger and Hediger 2006), we found that all three C-terminal GLT-1 splice variants are expressed in brain and liver. GLT-1a and GLT-1b were also expressed in pancreas, but unlike brain and liver, GLT-1c mRNA was undetectable (Fig. 1C). Under these experimental conditions, which were optimized for specificity and sensitivity, these data argue that the pancreas does not express GLT-1c. Thus, for the remainder of the studies in this report, we focused on GLT-1a and GLT-1b expression.
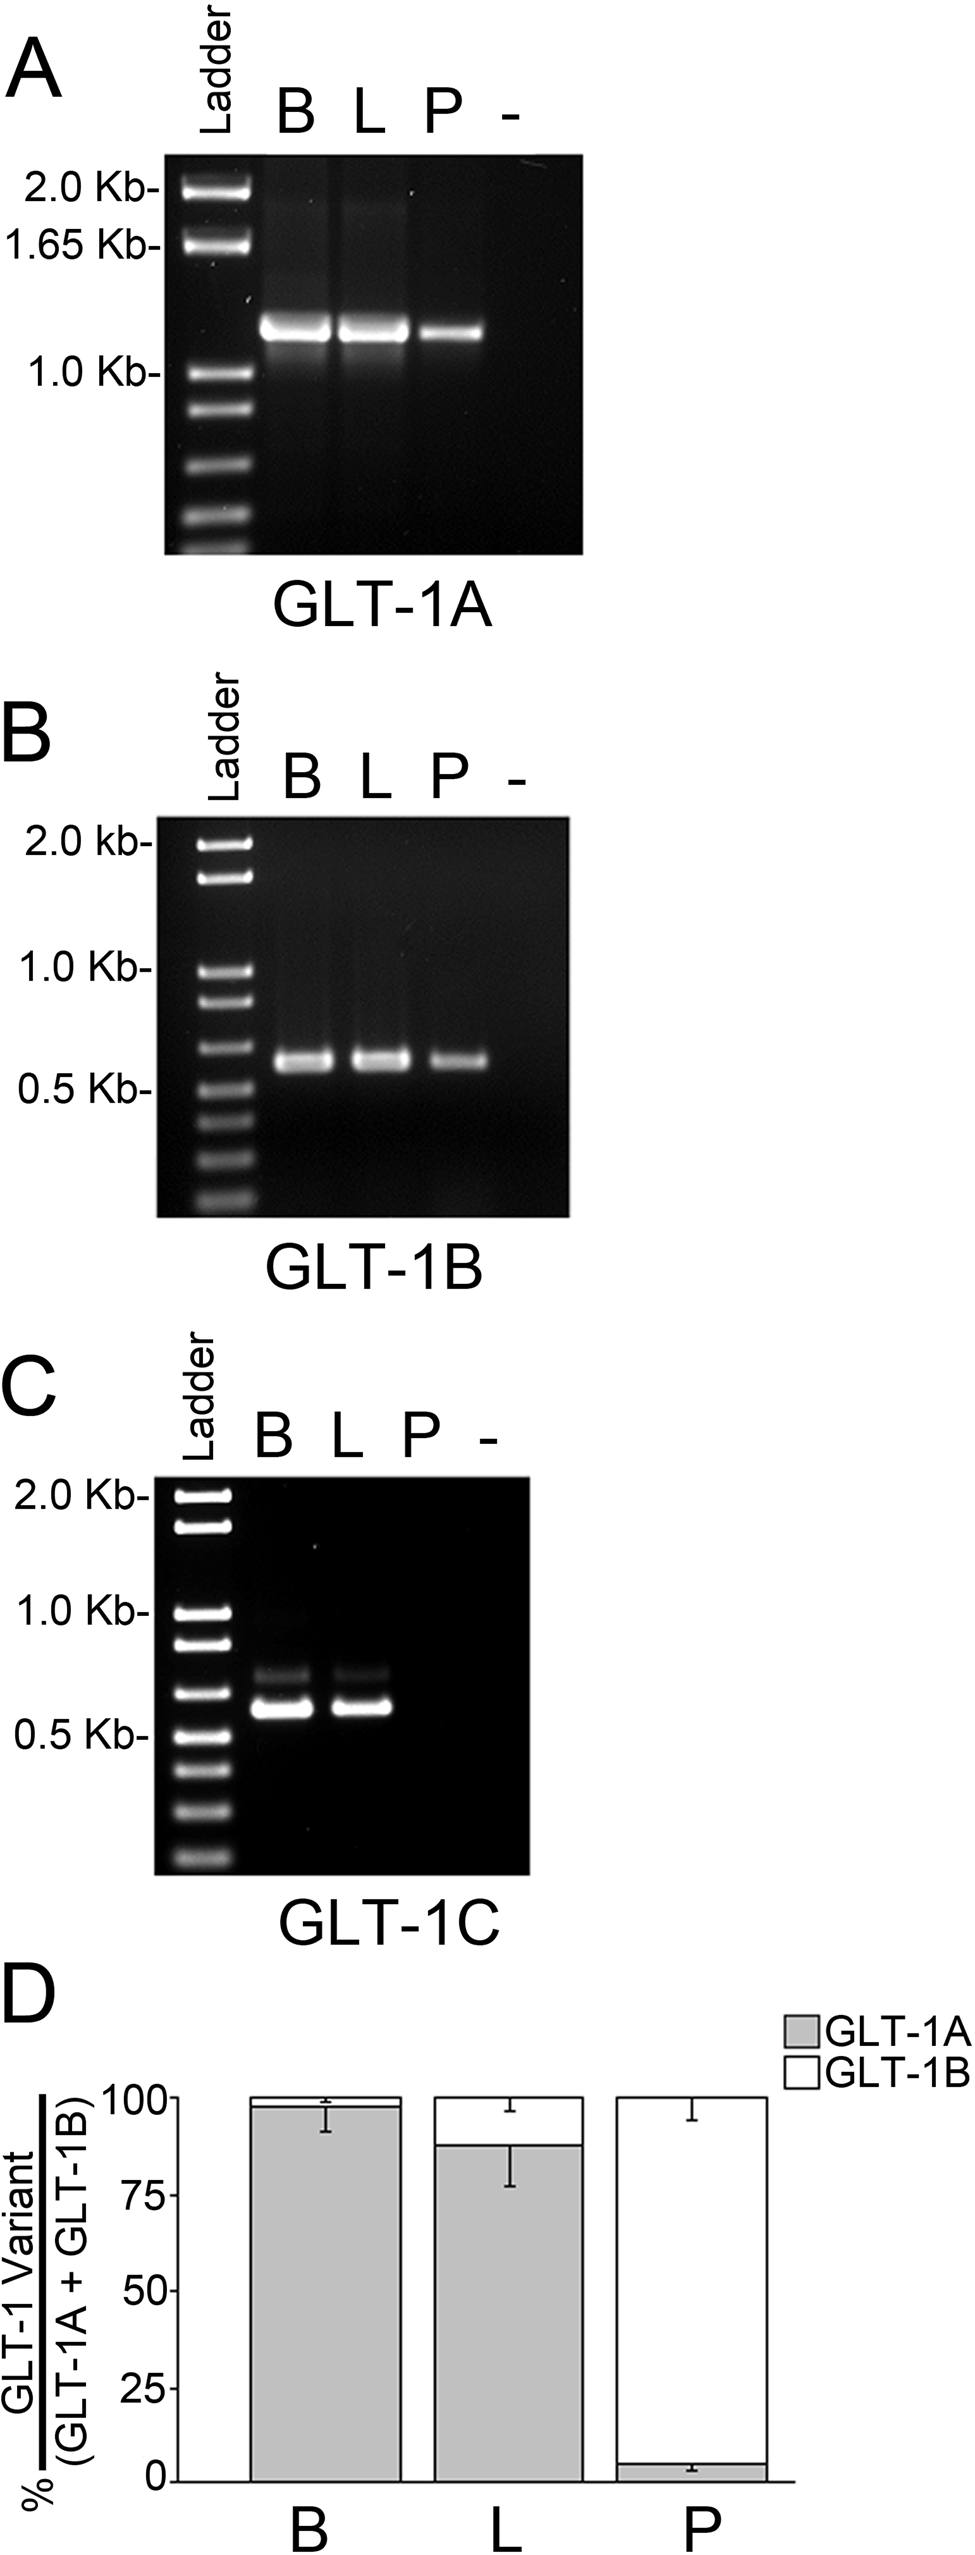
Pancreas selectively expresses GLT-1a and GLT-1b splice variants. Results of RT-PCR reactions using primer pairs that specifically amplify GLT-1a (A), GLT-1b (B), and GLT-1c (C) show that all three C-terminal GLT-1 splice variants are present in brain (B) and liver (L) but that only GLT-1a and GLT-1b are expressed in pancreas (P). (D) GLT-1a and GLT-1b levels were quantified using qRT-PCR. Results are presented in terms of the amount of GLT-1a (gray) or GLT-1b (white) expressed as a percentage of the total (GLT-1a + GLT-1b) that was normalized to 100% for each individual tissue type. Error bars indicate ± SEM of triplicate experiments.
PCR reaction product band intensities (Fig. 1A–1C) are difficult to quantify precisely. Thus, we also performed qRT-PCR (Fig. 1D). For each tissue type, the relative expression levels of GLT-1a versus GLT-1b were measured with reference to ubiquitously expressed ribosomal eukaryotic Elongation Factor 1α (Eef1a1), used as a control to gauge reaction product amplification profile as a function of cycle number (Ramakers et al. 2003; Schmittgen and Livak 2008; Fujimura et al. 2010). In general agreement with previous findings (Holmseth et al. 2005), these data show that GLT-1a is significantly more prominent than GLT-1b in brain (p<0.002). GLT-1a was also significantly more prominent than GLT-1b in liver (p<0.001), although not to the same degree as brain. Figure 1D shows that in pancreas, GLT-1b was significantly more prominent than GLT-1a (p<0.001).
Pancreas Expresses Mature GLT-1 Protein
To determine whether GLT-1 protein is stably expressed in pancreas, we performed Western blots on whole pancreatic tissue lysates from wild-type and GLT-1 knockout mice using a pan-specific antibody (AB12) that recognizes both GLT-1a and GLT-1b. Figure 2A (right panel) shows that GLT-1 is specifically expressed in the pancreas of wild-type but not GLT-1 knockout mice. In keeping with previous reports, AB12 specifically recognized GLT-1 that resolved as a monomer (approximately 65 kDa), as well as SDS-stable multimers that resolved primarily as dimers and trimers (Haugeto et al. 1996; Woltjer et al. 2010). Because GLT-1 is expressed in pancreas at total concentrations that appear to be much lower than the highly abundant GLT-1 protein concentrations found in brain or liver, it was necessary to optimize blotting and exposure conditions individually for each tissue type (see Fig. 2 legend). Thus, relative GLT-1 expression levels among the different tissue types cannot be precisely inferred from these results. Western blots of brain using well-characterized GLT-1a and GLT-1b antibodies (Sullivan et al. 2004; Woltjer et al. 2010) further confirmed their specificity (Fig. 2B). However, the anti-GLT-1a and GLT-1b antibodies were not sufficiently sensitive to cleanly identify either splice variant in total protein lysates from pancreas via Western blot. Nonetheless, these findings (Fig. 2A) indicate clearly that structurally mature, multimeric GLT-1 protein is expressed in pancreas.
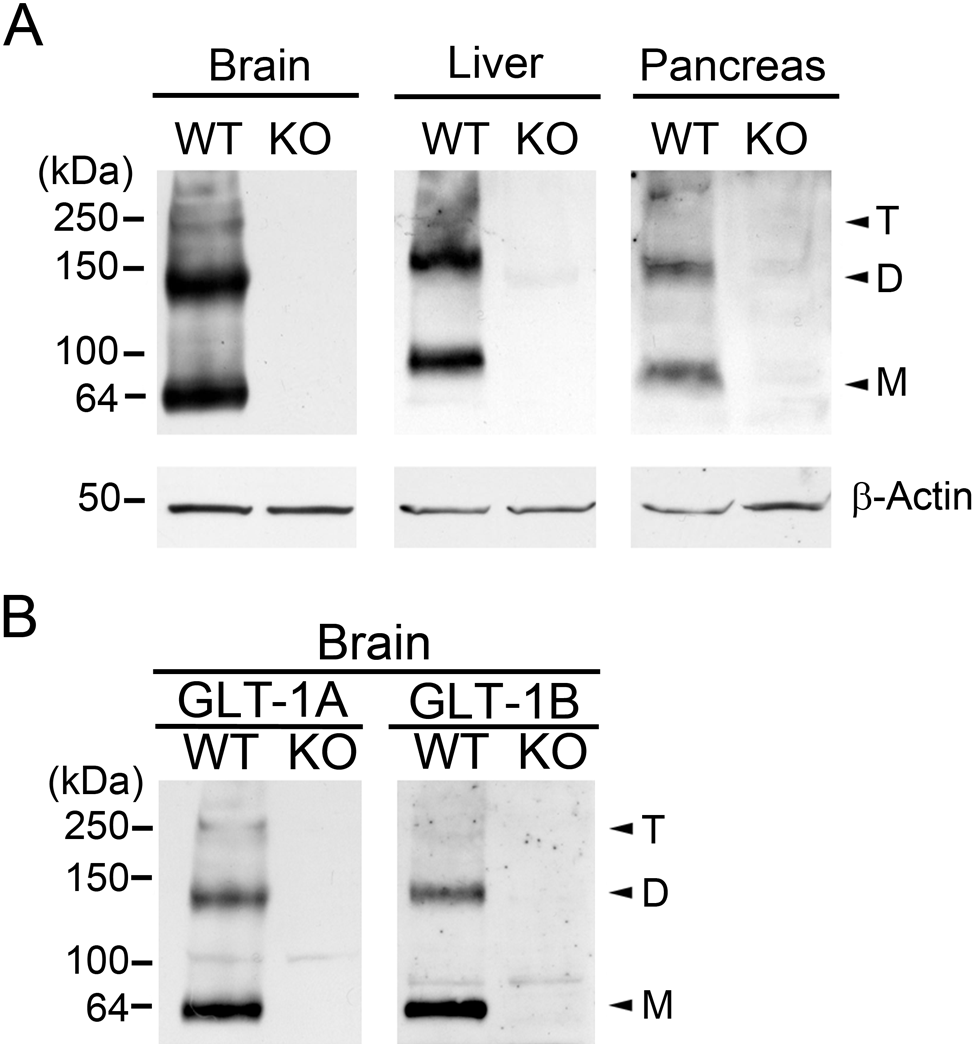
GLT-1 protein is expressed in pancreas. (A) Western blots using a pan-specific GLT-1 antibody (AB12) prove that, as with brain and liver, GLT-1 is expressed specifically in wild-type (WT) but not GLT-1 knock out (KO) pancreas. Native functional GLT-1 is expressed as a trimer. SDS-stable GLT-1 monomers (M) and SDS-stable dimers (D) and trimers (T) are indicated with arrowheads. Because of the low level of GLT-1 expression in pancreas compared with brain and liver, different protein amounts were loaded onto the gels for each tissue (25, 50, 100 µg of total protein per lane; B, L, and P, respectively), and exposure times were optimized for each blot. Thus, relative protein abundance of the different tissue types cannot be inferred. (B) Western blots using antiserum specific for GLT-1A (left panel) and GLT-1B (right panel) further confirm the specificity of these antibodies. Low GLT-1 expression levels in pancreas (compared with brain and liver) and the lower affinities of the GLT-1A and B antibodies compared with AB12 precluded definitive identification of GLT-1A and B by Western blot. All blots were reprobed with antibodies recognizing β-actin to confirm equal protein loading of WT and KO tissues in each gel.
GLT-1 Is Expressed in Exocrine and Endocrine Pancreas
To determine which organ systems and cell types within the pancreas express GLT-1, we carried out double-label confocal microscopy on pancreas from GLT-1 wild-type and knockout mice. Figure 3 shows discrete domains of GLT-1b immunoreactivity (green staining) in association with exocrine ductal cells from wild-type (Fig. 3A, 3C) but not GLT-1 knockout pancreas (Fig. 3D, 3F). Laminin (red staining) is a structural component of islets, ductal, and vascular basement membranes (Jiang et al. 2002; Nikolova et al. 2006) and was used to demarcate exocrine ductal regions in both wild-type and knockout pancreas (Fig. 3B, 3E). Similar results were obtained using pan-specific AB12 to detect GLT-1 (data not shown). We were unable to detect GLT-1a in exocrine pancreas. This suggests either that GLT-1a is not expressed by exocrine pancreas or that GLT-1a expression levels in the exocrine cells were below our detection limits—a possibility consistent with the qRT-PCR findings shown in Fig. 1D.
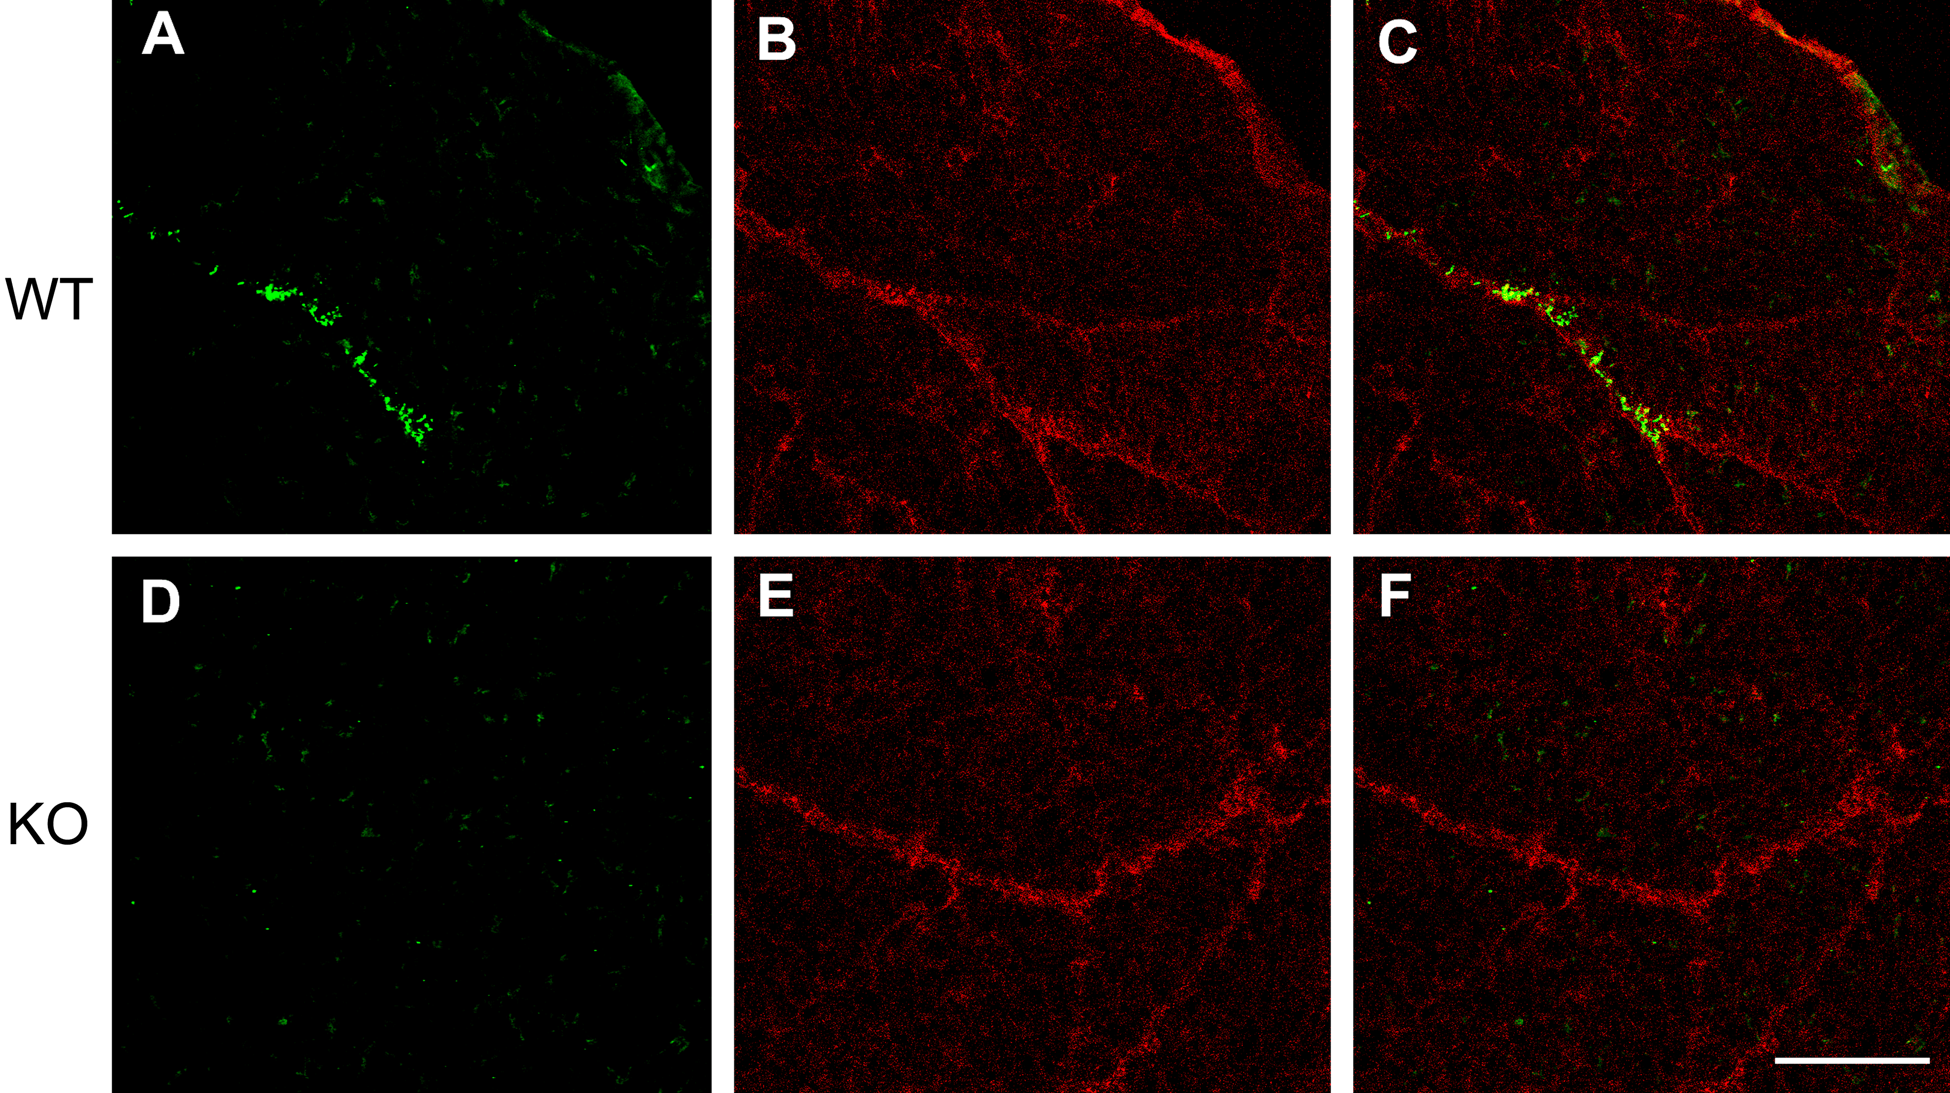
GLT-1b is expressed in exocrine pancreas. Double-label confocal microscopy reveals GLT-1b expression (green) in periductal domains of exocrine pancreas in GLT-1 wild-type (WT) (A–C) but not GLT-1 knockout (KO) pancreas (D-F). Exocrine ductal regions are demarked by laminin immunostaining (red) in panels B and E. Panels C and F are merged images. Scale bars: 100 µm.
Figure 4A shows that low-level GLT-1 immunoreactivity (green staining) colocalized in islets of 21-day-old wild-type mice immunostained with antibodies recognizing insulin (red staining), which is expressed by β-cells (Fig. 4B, 4C) in wild-type (Fig. 4A–4C) but not GLT-1 knockout pancreas (Fig. 4D–4F). Some GLT-1 immunoreactivity was also evident outside the islets in nearby exocrine tissue. However, this extra-islet staining was distinct from the much more robust exocrine periductal GLT-1 immunostaining (Fig. 3) and was observed less reliably. Hence, it was not possible to rigorously conclude whether this staining (Fig. 4A) reflected GLT-1 expression in exocrine cells not associated with periductal domains. In an effort to strengthen these findings, we also performed GLT-1 immunohistochemistry using normal adult mouse pancreas. AB12 staining (Fig. 4G) revealed positive GLT-1 immunoreactivity in islets. Control staining with preimmune serum from the same rabbit that produced AB12 (Fig. 4H), as well as peptide preadsorbed AB12 (Fig. 4I), was immunonegative. In this instance, it was not possible to test GLT-1 knockout mice, because they do not survive to adulthood. Taken together, these findings argue strongly that GLT-1 is expressed in islets and is particularly evident in islets of adult animals.
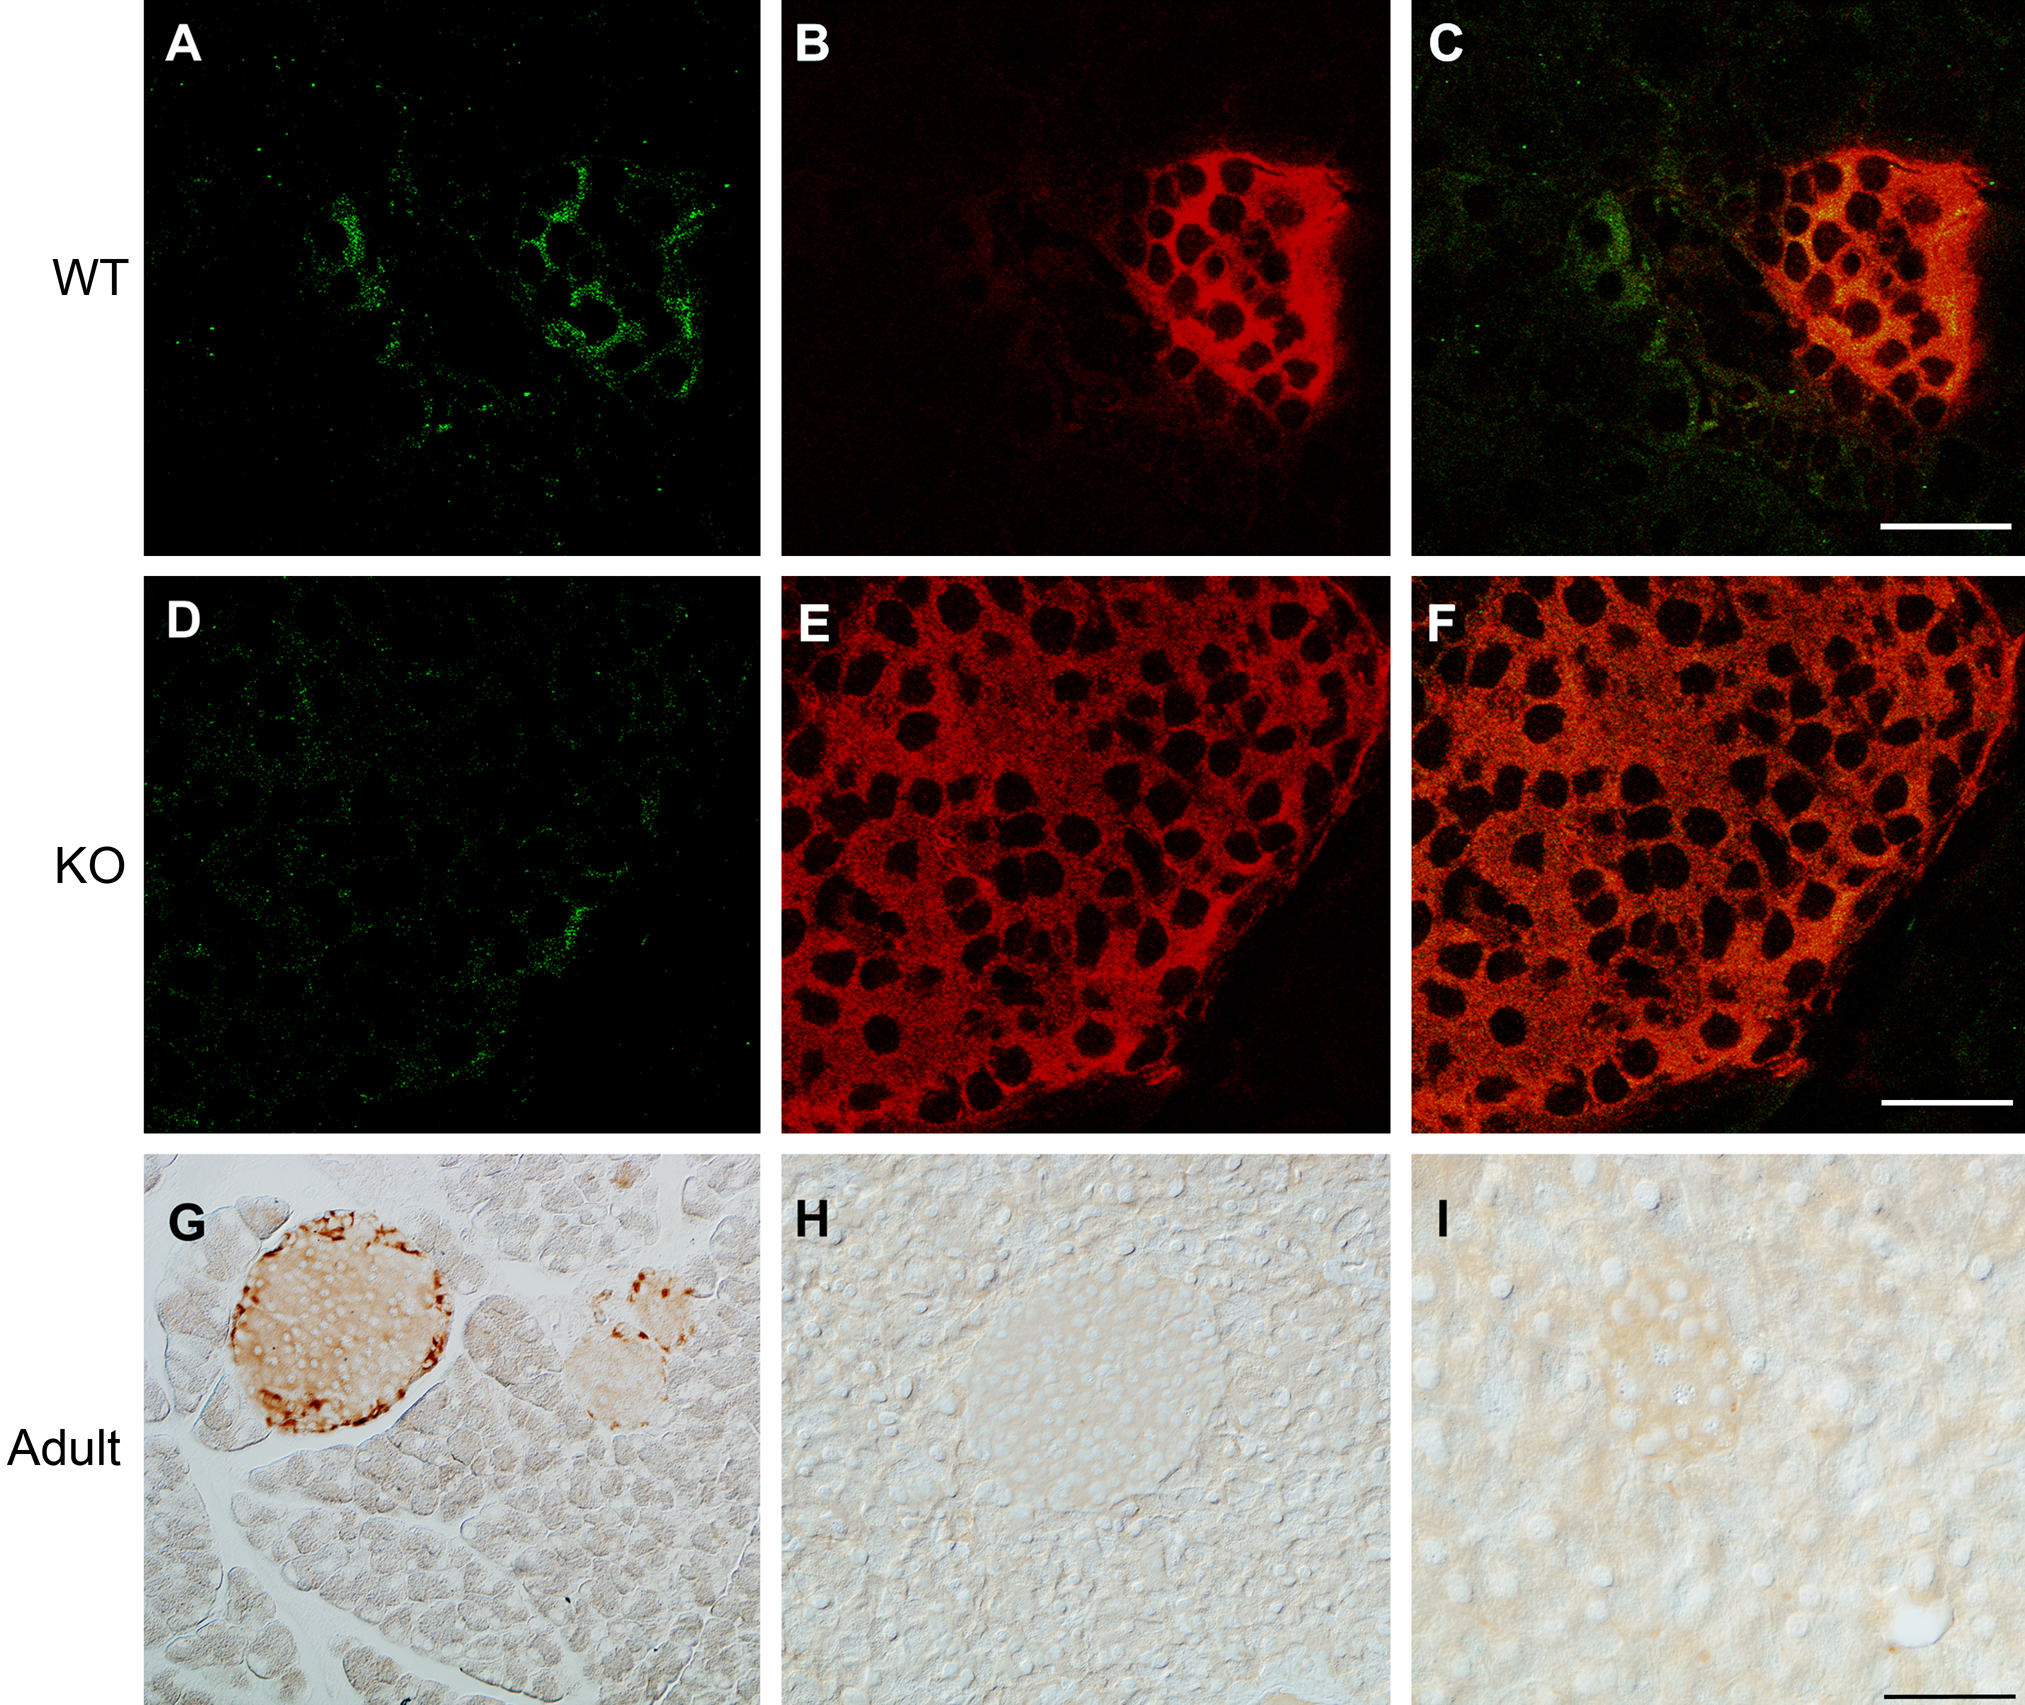
GLT-1 is expressed in pancreatic islet cells. Double-label confocal microscopy reveals low-level GLT-1 expression in pancreas of weanling GLT-1 wild-type (WT) (A–C) but not GLT-1 knockout (KO) (D–F) mice (green: pan-specific GLT-1 immunoreactivity [AB12]; red: insulin-expressing islet β-cells). Merged images (C, F) show that some GLT-1 immunoreactivity appears localized outside the islets. (G) Immunohistochemistry in adult mice using AB12 reveals more robust GLT-1 expression in islets compared to 21-day-old weanling GLT-1 WT mice shown in panels A–C. Lack of islet-related immunoreactivity using preimmune serum (H) and peptide preadsorbed AB12 antibodies (I) further demonstrates GLT-1 immunostaining specificity in islets. Scale bars: 50 µm.
The pattern of islet GLT-1 immunostaining observed in Fig. 4G raised the possibility that GLT-1 is expressed by both β- and α-cells. To address this idea directly, double-label confocal microscopy was performed on normal adult mouse pancreas using mouse anti-insulin and anti-glucagon antibodies (labeling β- and α-cells, respectively), along with rabbit anti-GLT-1a or anti-GLT-1b antibodies. GLT-1a and GLT-1b were both detected in islets and colocalized with β-cells (Fig. 5A–5F). Glucagon-positive α cells also were immunostained positively for GLT-1a and GLT-1b (Fig. 5G–5L).
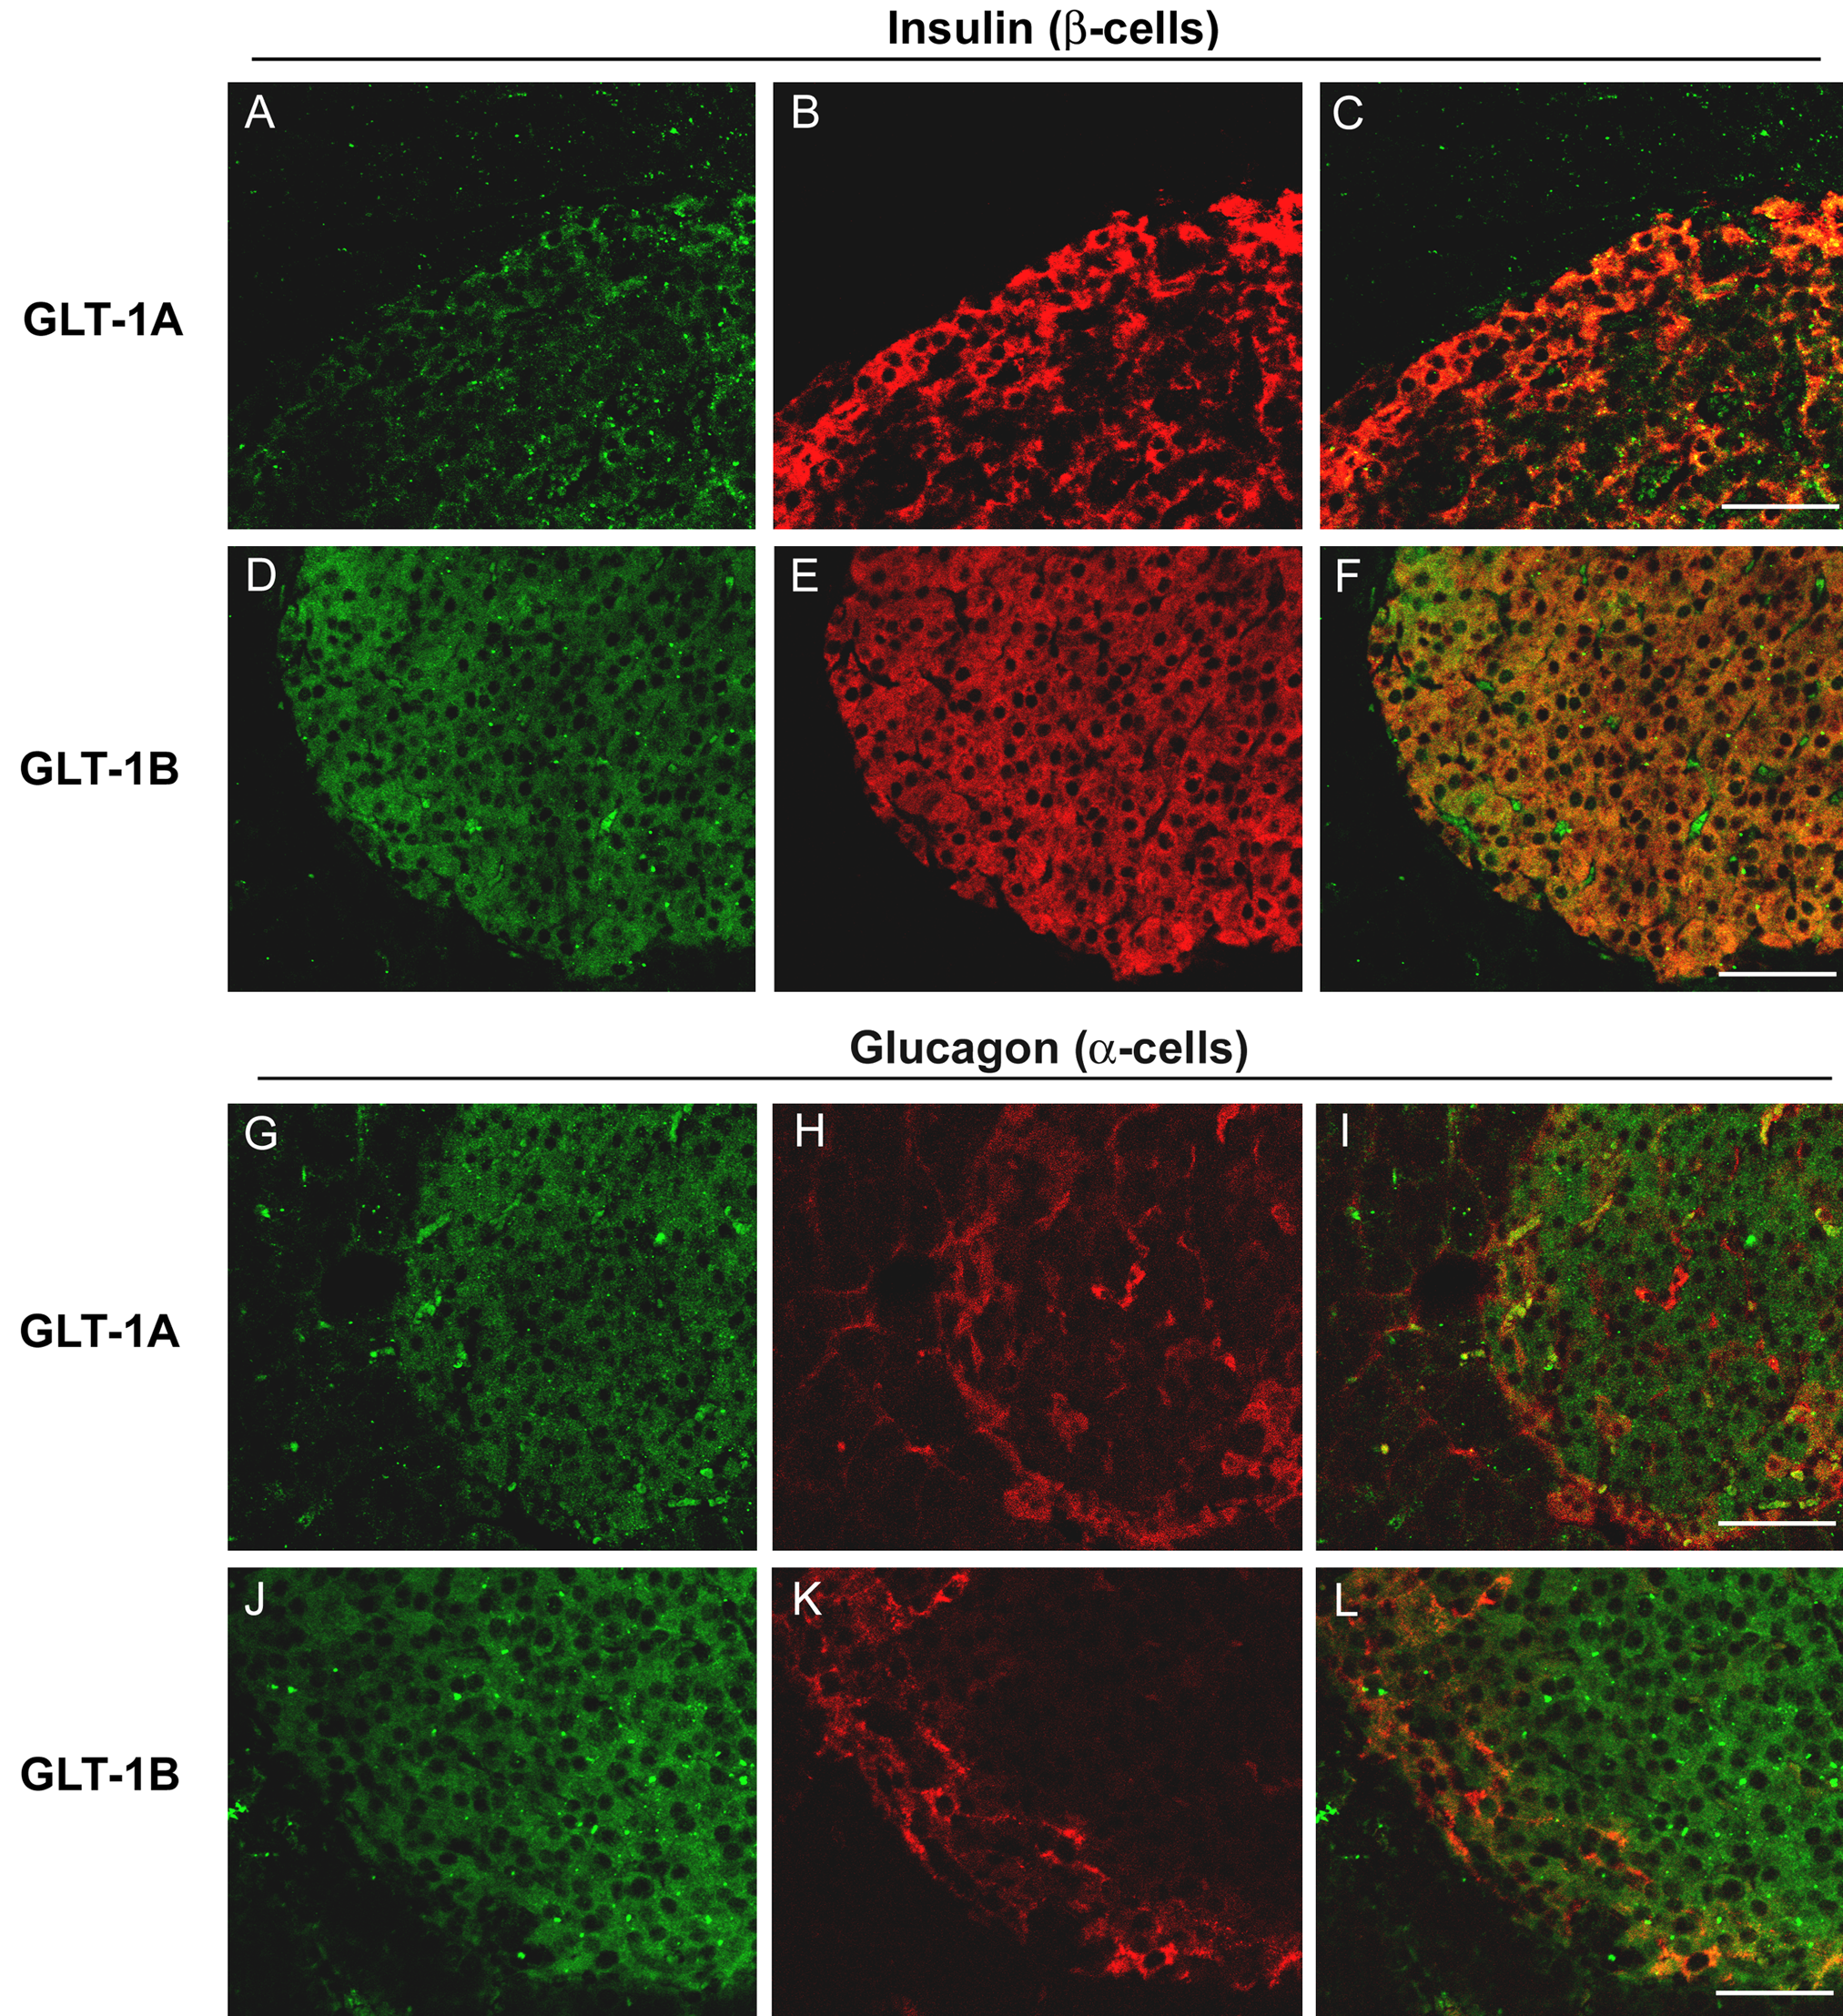
GLT-1 expressed in islet β- and α-cells. Double-label confocal microscopy shows that GLT-1a (A) and GLT-1b (D) expression (green) colocalize with insulin immunoreactivity (B, E) (red) specifically staining islet β-cells (merged images in panels C, F). GLT-1a and GLT-1b (G, J) expression also colocalize with glucagon (red) expressing (H, K) islet α-cells (merged images in panels I, L). Scale bars: 50 µm.
Pancreatic Islet Cells Coexpress GLT-1 and Glutamine Synthetase
As discussed earlier, GLT-1 plays an important role in supporting glutamine cycling (Lieth et al. 2001; Tapiero et al. 2002; Zwingmann and Leibfritz 2003). The uniquely specialized anatomic structure of the liver illustrates this point with particular clarity. Figure 6A shows that, as expected (Cadoret et al. 2002), GLT-1 is expressed exclusively by thin layers of hepatocytes (sometimes only one cell wide) that form the hepatic central veins (red arrowheads) and express GS (Fig. 6B, 6C) (Cadoret et al. 2002; Watford et al. 2002; Braeuning et al. 2006; Haussinger and Schliess 2007). Periportal hepatocytes (white arrowheads, Fig. 6C) preferentially express PEPCK (data not shown)—in keeping with their key role in mediating gluconeogenesis (Braeuning et al. 2006). From this perspective, we therefore hypothesized that if GLT-1 similarly subserves glutamine synthesis in the pancreas, we would expect to find GS expressed in the same cells as GLT-1. To address this, we first confirmed that GS protein is stably expressed in pancreas by Western blotting (Fig. 6D). Using double-label confocal microscopy, we found that GS immunoreactivity colocalized prominently with GLT-1 (immuno-stained with anti-GLT-1b) in pancreatic islet cells (Fig. 6E–6G). GS (Fig. 6F) appeared prominently expressed in islets, in contrast to exocrine parenchyma where the GS immunoreactivity appeared much weaker with sparsely distributed immunopositive puncta, suggesting that GS is not expressed in exocrine tissue or is expressed at very low levels compared to islets.
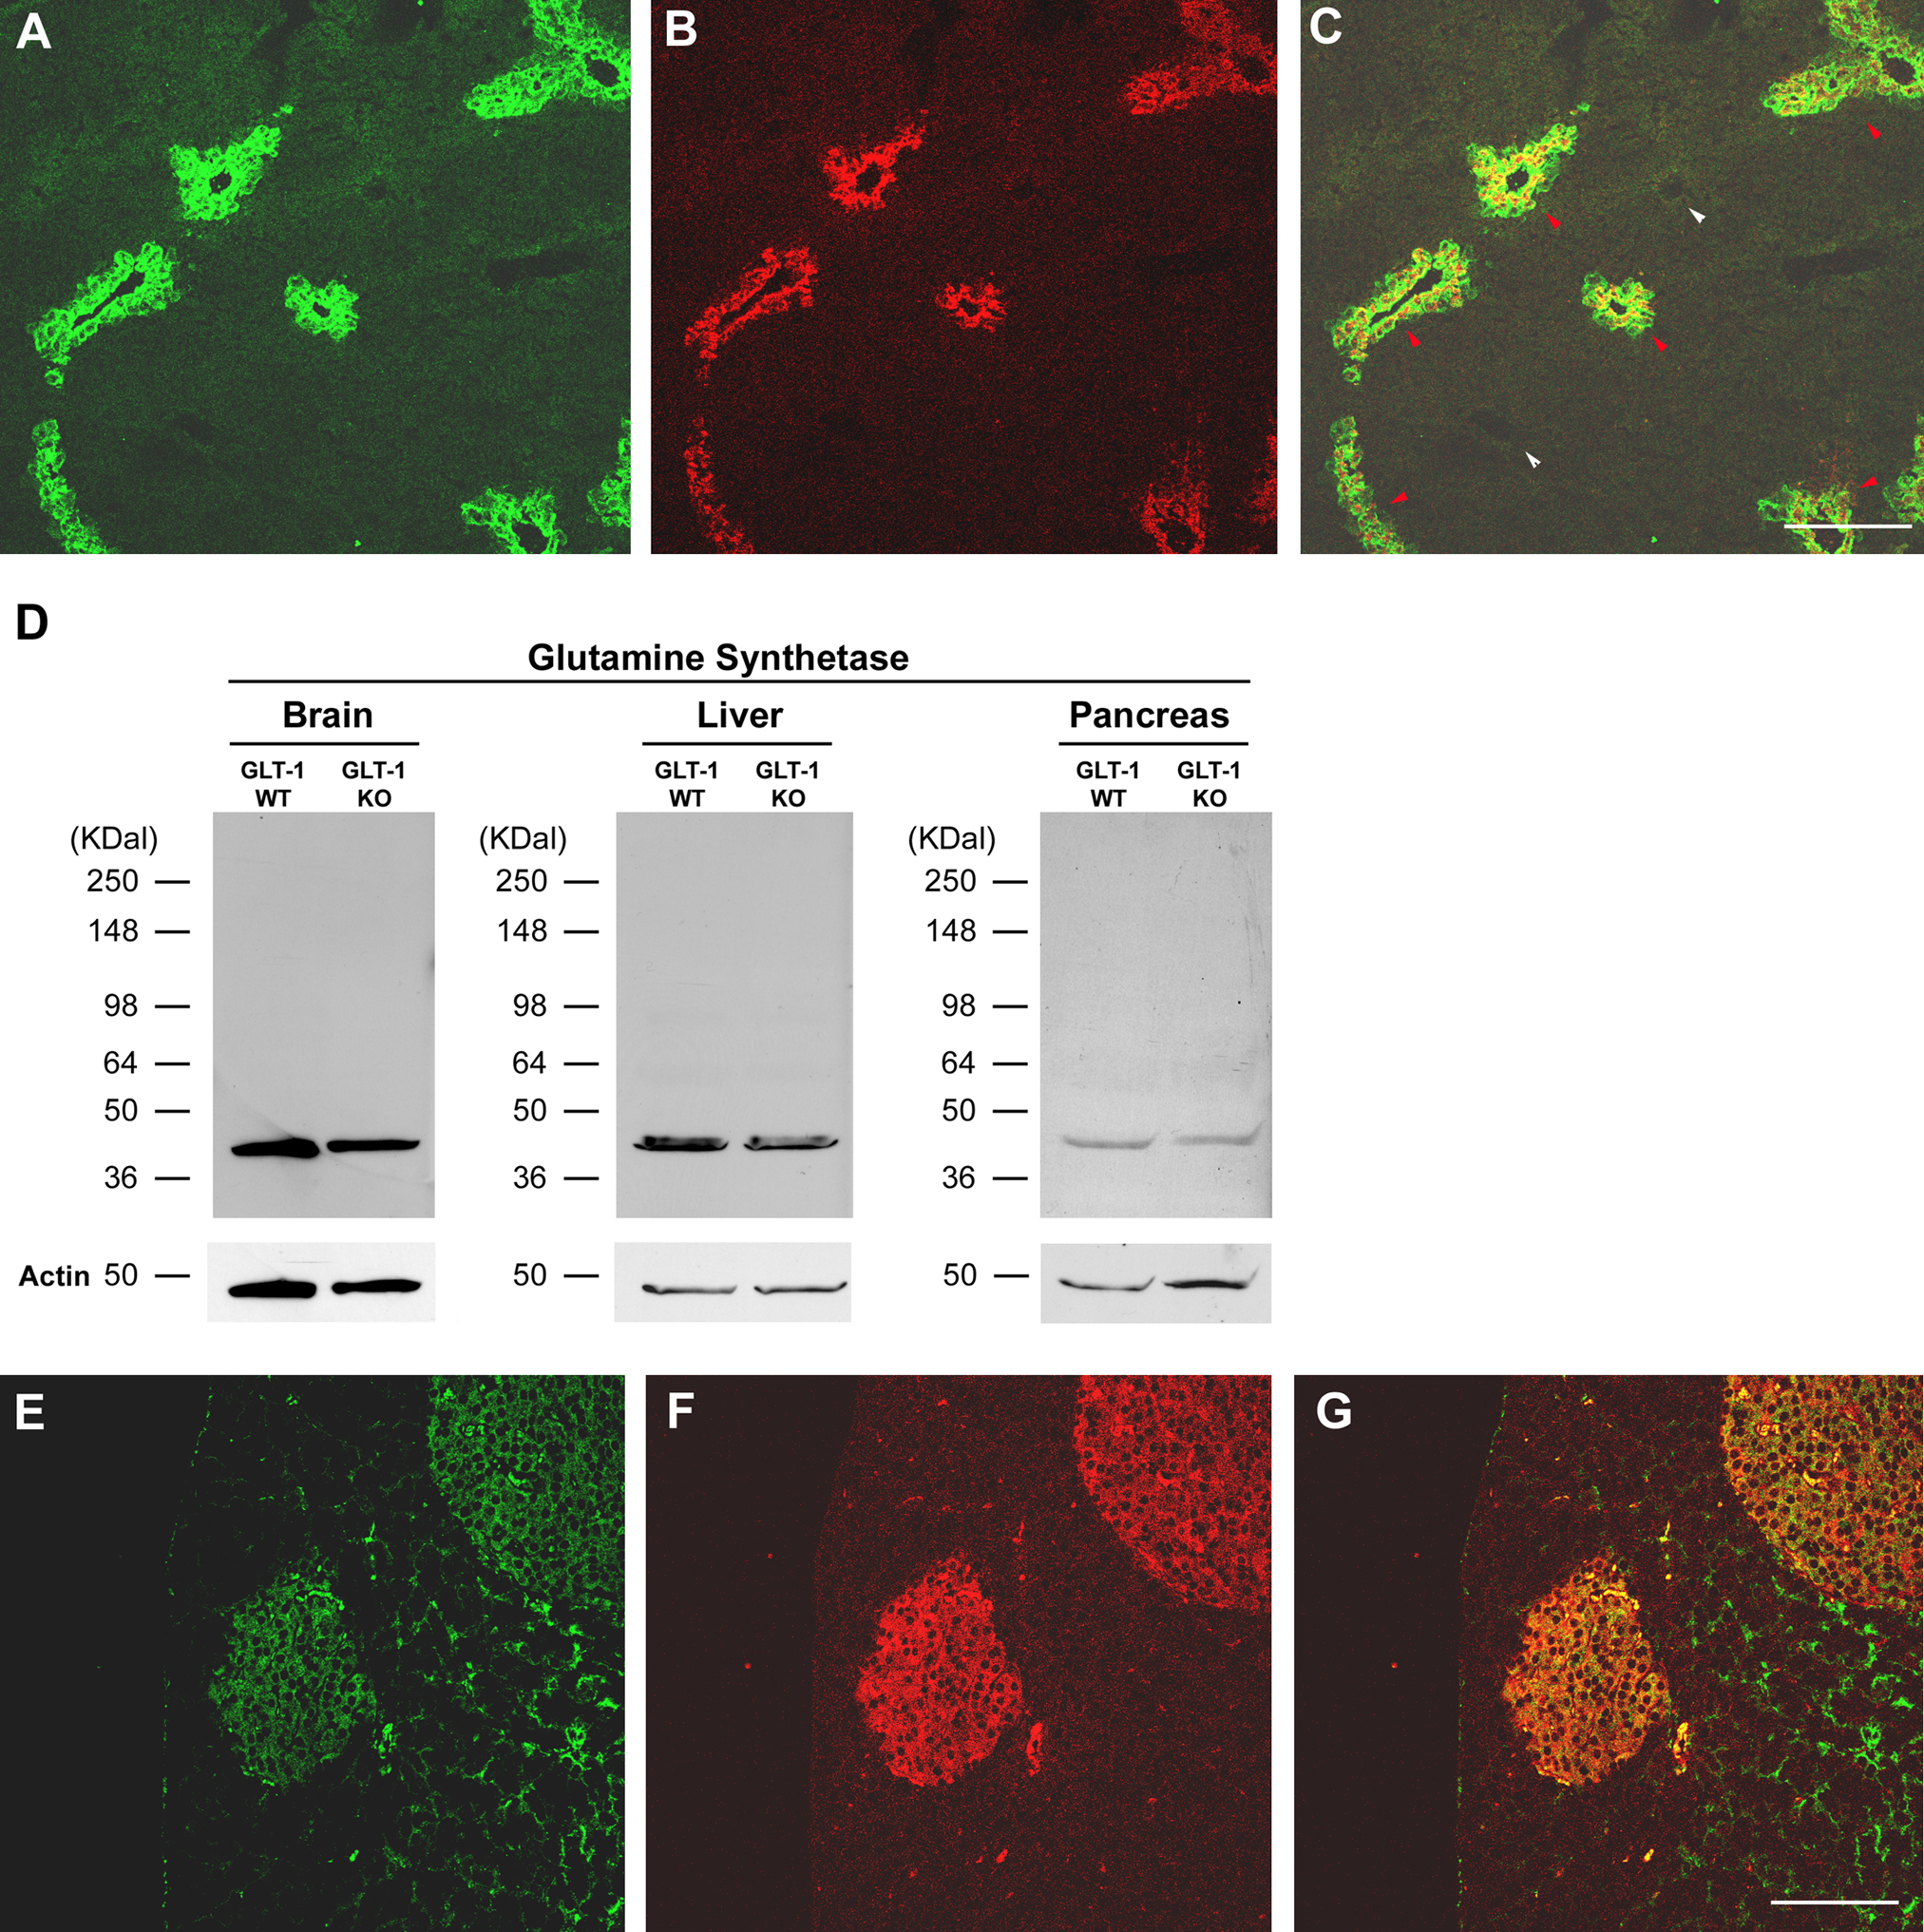
Pancreatic islet cells coexpress GLT-1 and glutamine synthetase. (A) Illustrating the role of GLT-1 in glutamate/ammonia clearance, GLT-1 expression (green) colocalizes with GS (red) (B) selectively in zone 3 perivenous hepatocytes that mediate region-specific glutamine synthesis in liver. In merged image (C) red arrowheads indicate GLT-1/GS-positive central vein zones, and white arrowheads indicate GLT-1/GS-negative periportal zones. (D) Western blot confirms that pancreas (right panel), like brain and liver (left and middle panels, respectively), expresses GS. (E) GLT-1 (green) and (F) GS (red) colocalize in islet cells. (G) Merged image. Scale bars: 100 µm.
Discussion
Glutamate Transporter Expression in Pancreas
GLT-1 is expressed in a number of tissues throughout the body (Berger and Hediger 2006), though most abundantly in the CNS by astrocytes—the main cell type that regulates the glutamate cycling pathways that account for as much as 80% of energy expenditure of the brain (Raichle and Mintun 2006). Astrocytic glutamate uptake has at least three important functions: first, to rapidly buffer (Tzingounis and Wadiche 2007) and transport glutamate to prevent cellular toxicity (Tanaka et al. 1997); second, to support GS-mediated ammonia-glutamate ligation, thus neutralizing free ammonia and contributing to pH control (Haussinger and Schliess 2007); and, third, to regulate signaling cascades that contribute to local vascular flow rates and glucose utilization (Voutsinos-Porche et al. 2003; Petzold et al. 2008). Similarly in liver, GLT-1 expressing perivenous hepatocytes support GS-catalyzed glutamine production, thereby facilitating liver-mediated pH buffering and peripheral ammonia clearance auxiliary to periportal urea production (Haussinger and Schliess 2007). In addition to the liver, GLT-1 has been localized outside the CNS in cell types that include ductal cells of mammary and salivary glands (Berger and Hediger 2006). Such data are compatible with our finding that GLT-1 is expressed by ductal cells in exocrine pancreas (Fig. 3), thus lending support to the idea that GLT-1 may subserve secretory functions in exocrine pancreas.
This report presents evidence based on a variety of complementary approaches that included analyses of specific GLT-1 mRNA splice variants, qRT-PCR, immunohistochemistry, confocal microscopy, and Western blots using several well-characterized antibodies (Sullivan et al. 2004; Woltjer et al. 2010) that specifically recognize GLT-1 in wild-type but not knockout tissue. Taken together, these findings demonstrate that structurally mature GLT-1 protein is expressed by pancreas chiefly in islets and exocrine ductal domains. These findings are in keeping with previous reports examining pancreas in sheep, cattle (Howell et al. 2001), and rat (Fukushima et al. 2010) that drew comparable conclusions, albeit without the aid of knockout animals or control antisera to address specificity.
GLT-1 (also called EAAT2) is a member of a family of five glutamate transporters that include GLAST and EAAC1 (also referred to as EAAT1 and EAAT3, respectively) and EAAT4 and EAAT5 (Danbolt 1994). In this report we focused on GLT-1 because findings from several different glutamate transporter–deficient mice argue that GLT-1 is the most biologically critical Na+-dependent glutamate transporter. In addition, the ready availability of a GLT-1 knockout mouse colony greatly facilitated critical evaluation of our results. Other glutamate transporter– deficient mice were not available to us. Thus, examining the other glutamate transporters in pancreas with similar levels of rigor was not possible. Nonetheless, findings in sheep, cattle (Howell et al. 2001), and rats (Fukushima et al. 2010) suggest that GLAST is also expressed in pancreas. Other cell types (e.g., astrocytes) express both GLT-1 and GLAST, likely as a form of redundant function. Thus, it is reasonable to speculate that such redundancy may be a feature of the pancreas as well, particularly when considering that pancreatic tissue, like nervous tissue, contains metabolically active secretory cells that may be sensitive to the metabolic consequences of glutamate/glutamine cycling. In keeping with this idea, recent data suggest that GLT-1 helps protect cultured βTC3 cells from glutamate-induced toxicity (Di Cairano et al. 2011).
GLT-1 Alternative Splicing in Pancreas
Genomic GLT-1 comprises 12 exons that undergo complex, tissue-specific alternative splicing of several 5′ through 3′ exons to yield a number of functional and nonfunctional variants (Utsunomiya-Tate et al. 1997; Lin et al. 1998; Meyer et al. 1998; Honig et al. 2000; Sullivan et al. 2004; Holmseth et al. 2009; Scott et al. 2011). Of the known functional variants, the C-terminal a, b, and c variants are the best characterized (Utsunomiya-Tate et al. 1997; Rauen et al. 2004; Sullivan et al. 2004; Bassan et al. 2008; Holmseth et al. 2009). There is evidence that some truncated, exon-skipping GLT-1 splice variants lacking critical functional domains (Yernool et al. 2004) can integrate into mature multimeric structures that traffic to the cell surface but display attenuated uptake properties (Gebhardt et al. 2010). Our Western blots revealed no evidence of truncated GLT-1 in pancreas, even though they are expected to possess the epitope recognized by the sensitive AB12 antibody. Thus, it appears likely these exon-skipping variants are not generated in pancreas or are expressed at levels below our limits of detection.
Interestingly, our findings suggest that GLT-1b is the main GLT-1 splice variant expressed in pancreas (Fig. 1). This is in particular contrast to brain where GLT-1a predominates (Fig. 1) (Furness et al. 2008). GLT-1b is notably different from GLT-1a in that it terminates in a consensus PDZ domain–interacting motif (Bassan et al. 2008). PDZ proteins play important roles in anchoring a variety of molecules, including glutamate receptors, to specific cytoskeletal domains within cells (Kornau et al. 1995; Song and Huganir 2002). In this regard, GLT-1b has been shown to associate with the synaptic scaffolding protein PSD-95 and the protein kinase C (PKC)α binding protein, PICK1 (Bassan et al. 2008; Gonzalez-Gonzalez et al. 2008). Consistent with such findings, there is evidence that GLT-1a and GLT-1b localize in distinct peri-/extrasynaptic domains (Sullivan et al. 2004). Beyond this, the functional significance of expressing GLT-1a versus GLT-1b is not understood in any cell type. Such findings raise the interesting possibility that the PDZ-interacting motif in GLT-1b is tailored to associate with particular protein complexes in pancreas that are different from those most commonly found in brain.
Possible Roles of GLT-1 in Pancreas
This report presents findings that demonstrate GLT-1 colocalizes with GS in islets (Fig. 6). As mentioned above, in both liver and brain, GS plays an important role in glutamine synthesis, which is an essential metabolic process that scavenges glutamate and ammonia. The significance of GLT-1 in supporting the role played by GS is especially evident in the liver, where GLT-1 (but not GLAST; Berger and Hediger 2006) selectively localizes with GS in perivenous hepatocytes that are responsible for glutamine synthesis (Cadoret et al. 2002; Gebhardt et al. 2007). The key association between GLT-1 and GS is emphasized further by findings showing that both molecules are coordinately regulated by β-catenin signaling—a pathway that is critical in establishing and maintaining proper specialized functional zones in liver (Cadoret et al. 2002). Such data, as well as other reports that glutamine contributes to a nutrient environment that modulates glucose-mediated insulin secretion (Henquin et al. 2006; Dufrane et al. 2007) from islets, suggest that one possible function of GLT-1 in the pancreas may be to support glutamine synthesis.
Just as GLT-1 mediates a number of distinct yet complementary functions in the brain, it is reasonable to speculate that GLT-1 could serve multiple functions in pancreas. For example, recent data demonstrate that islet α-cells release glutamate along with glucagon. Via a positive feedback mechanism, the released glutamate stimulates further glucagon release by activating glutamate receptors on the same α-cells (Cabrera et al. 2008). This raises the interesting possibility that glutamate transporter expression in the pancreas could help terminate cycles of glucagon release that are potentiated by extracellular glutamate. In addition, there is new evidence that glutamate induces oxidative stress in islets (Di Cairano et al. 2011). Whether GLT-1 protects against oxidative stress by protecting cells in the pancreas against the potentially toxic properties of glutamate (Di Cairano et al. 2011) and/or ammonia (Chan and Butterworth 1999; Butterworth 2002) requires further study.
In summary we report that GLT-1b and, to a lesser extent, GLT-1a are expressed in islet β-, α-cells, and in ductal domains of exocrine pancreas. In addition, GLT-1 is coexpressed with GS in pancreatic islets. Taken together, these findings suggest that GLT-1 may contribute to glutamine synthesis in islets. In addition, these data raise interesting questions as to whether glutamate uptake in pancreas could involve processes that contribute to secretory regulation in islets. Much additional work will be required to test these important ideas.
Footnotes
Acknowledgements
We thank Dr. T. Tanaka for providing the GLT-1 knockout mice and Ning Li and Ping Zhu for important technical support.
The authors declared no potential conflicts of interest with respect to the research, authorship, and/or publication of this article.
The authors disclosed receipt of the following financial support for the research, authorship, and/or publication of this article: This work was supported by the U.S. Department of Veterans Affairs Office of Research and Development Medical Research Service, Biomedical Research Program (DGC), the National Institutes of Health (T32 AG000258) (JSM), the Diabetes Endocrine Research Center Islet Core (DK17047) (IRS), and grants from the National Health Medical Research Council (DVP).