
Abstract
The expression of glutamine synthetase (GS) is confined to a rim of hepatocytes surrounding the efferent hepatic veins in all mammalian species investigated. In rat liver, a two- to three-cell thick layer of GS-positive (GS+) hepatocytes uniformly surrounds the two to four terminal branching generations of the hepatic vein that collect blood from sinusoids (central veins). With increasing diameter of the efferent vessel, this multilayered rim of GS+ hepatocytes becomes confined to patches surrounding the decreasing number of central vein outlets. The remaining part of the wall of these sublobar hepatic veins is bordered by a onecell thick layer of GS+ hepatocytes. Around still larger veins, this single-cell layer of GS+ hepatocytes gradually disappears. The expression pattern of GS is therefore a convenient biological parameter to delimit sinusoidal draining (“collecting”) from nondraining (“conducting”) surfaces in the wall of the efferent hepatic vessels. The hepatocytes surrounding a single tree of central veins together form a compound liver lobule.
Materials and Methods
The livers of male Wistar rats, weighing 300–350 g, were retrogradely perfused under midozalam/hypnorm anesthesia with a mixture of ethanol/acetone/H2O (2/2/1). Retrograde perfusion was applied to distend the drainage sites of the hepatic sinusoids. After perfusion, samples including the larger veins were postfixed overnight in the same fixative. After embedding in paraffin, serial 7-mm sections were incubated alternatingly with a monoclonal antibody against GS (clone GS-6; Transduction Laboratories, Lexington, KY; 1:1000) and a polyclonal antiserum against fibronectin (#AB1942; Chemicon International, Inc., Temecula, CA; 1:6000). Antibody binding was visualized using the indirect unconjugated peroxidase-anti-peroxidase technique (Sternberger 1986). The contours of GS+ pericentral areas surrounding large hepatic veins and their tributaries in serial sections were traced onto acetate sheets, using a camera lucida set-up (Verbeek et al. 1995). Venous wall contours devoid of GS+ hepatocytes, covered by a single layer of GS+ hepatocytes, or covered by two or more layers of GS+ hepatocytes were differentially encoded. The position of sinusoids draining into the hepatic veins was also verified in the fibronectin-stained sections. Between 75 and 100 consecutive sections were used for each graphic reconstruction.
Statistics
The x2 -test was used to test the null hypothesis that the outlets of sinusoids and central veins were randomly distributed over the wall of hepatic veins in areas that were bordered by a multilayer of GS+ hepatocytes, a single layer of GS+ hepatocytes, or by GS− hepatocytes. The chance of finding a particular number of outlets in any of the three areas mentioned was calculated assuming a Poisson distribution.
Results
As observed previously, the central veins were uniformly bordered by two or three layers of strongly GS+ hepatocytes. Outside these very intensely staining cells, the next three to five layers of more upstream hepatocytes displayed a much lower staining intensity (Figure 1). At low magnifications, this weakly positive zone appears as a halo around the intensely positive cells (cf. Christoffels et al. 1999 for a similar expression pattern of GS mRNA). In contrast, a two- or three-cell thick bordering layer of strongly GS+ hepatocytes was only found as isolated patches along the wall of large efferent veins (Ø >500 μm). The remaining part of the wall of these vessels was bordered either by a single, strongly staining layer of GS+ hepatocytes or by GS− hepatocytes. The two- or three-cell thick patches of GS+ hepatocytes on the vessel wall were surrounded by a onecell thick layer of GS+ hepatocytes which, in turn, was surrounded by a GS− layer (Figure 2). The larger the diameter of the vessel, the fewer patches of GS+ hepatocytes were seen (cf. Figure 3 for a schematic representation). Going away from the vessel wall, the single-cell thick layer of GS+ hepatocytes was not bordered by a halo of faintly staining hepatocytes, as was seen when the layer of GS+ hepatocytes was two or three cells thick. The appearance of hepatocytes, including the GS+ hepatocytes, was more compact when they bordered the wall of these larger hepatic veins compared with those just outside, i.e., upstream of this perihepatic limiting plate.
In consecutive serial sections, we observed that multiple layers of GS+ hepatocytes were seen only around the most peripheral efferent veins. To validate this impression, reconstructions containing up to 100 consecutive sections were prepared. To better visualize the draining vessels, the livers were fixed by retrograde perfusion, and the sections were stained, in addition to GS, for fibronectin. As shown in Figure 2, multiple layers of GS+ hepatocytes in the walls of larger hepatic veins were exclusively associated with the presence of draining central veins, whereas such draining vessels were never observed in vessel wall areas with only a single layer or no GS+ hepatocytes. Within the GS− areas, small patches with only a single layer of GS+ cells were seen. In the segment of the hepatic vein shown in Figure 2, we observed 22 outlets in an area that represents 33% of the surface of the vessel, whereas no outlets were observed in the part of the vessel wall that is covered with a single layer of GS+ hepatocytes or with GS− hepatocytes. The chance that this distribution is random, is 2∗ 10−6 (x2 test). Assuming a uniform random distribution of draining vessels, the chance that the areas in Figure 2 with just one layer of GS+ hepatocytes would contain no draining central veins is 0.002 (Poisson test), whereas this chance in areas without a layer of GS+ hepatocytes is 0.0002. A lining with two or three layers of GS+ hepatocytes was seen around the two to four terminal branchings of the hepatic vein (Ø < 150 μm). The draining pattern therefore resembles that described for human liver (Matsumoto and Kawakami 1982). A lining with patches of a multilayer of GS+ hepatocytes surrounded by a single layer of GS+ hepatocytes and a GS− layer was seen when the diameter of the hepatic vein had increased to >500 μm.
Discussion
The reported findings show that, in rats, sinusoidal drainage occurs from the smallest rootlets up to the fairly large hepatic veins, but that the frequency with which this happens decreases with the size of the vessel. The expression pattern of GS proved to be a convenient biological parameter to identify areas in the wall of the larger efferent veins where such drainage occurs. These data therefore modify earlier findings in rodents (Gershbein and Elias 1954; Elias and Popper 1955; Lee et al. 1960) to bring them more in line with the description in baboon, sheep, and rabbits (Elias 1949; Elias and Sherrick 1969; Wendelin 1972; Porto et al. 1989). In fact, we did observe in different mammalian species that portions of the larger hepatic veins were bordered by hepatocytes that express periportal rather than the expected pericentral enzyme markers and that the proportion of these areas increased with the diameter of the vessels (Wagenaar et al. 1994). The absence of pericentral marker enzymes shows that these hepatocytes no longer occupy a downstream portion of the liver lobule. We also observed this “reversed” expression pattern in human liver (Lamers et al. 1989), suggesting that Elias' categorical assertion (Elias and Sherrick 1969) may have to be modified. A simple explanation for the apparent difference between small and large animals that was observed by Elias may be that adult livers of large species contain more than 20 times as many lobules as a rat liver (White 1939; Takahashi 1970; Wagenaar et al. 1994). The main branches of the hepatic vein in such species have therefore gone through four or five times as many branching generations, which makes the contribution of large branches to the tree of hepatic veins equivalently larger. In accordance with this interpretation, we observed hardly any hepatic veins with a GS− lining in mice [not shown; threefold fewer branching generations than rat liver (Wagenaar et al. 1994)]. Furthermore, we have shown that after repeated partial hepatectomy, the remnant liver is characterized by a persisting reduction of the GS+ areas surrounding the draining vessels (Wagenaar et al. 1993). Finally, it has been shown that sinusoids and small central veins are obliterated as their draining hepatic vessels grow (Ekataksin and Wake 1991).
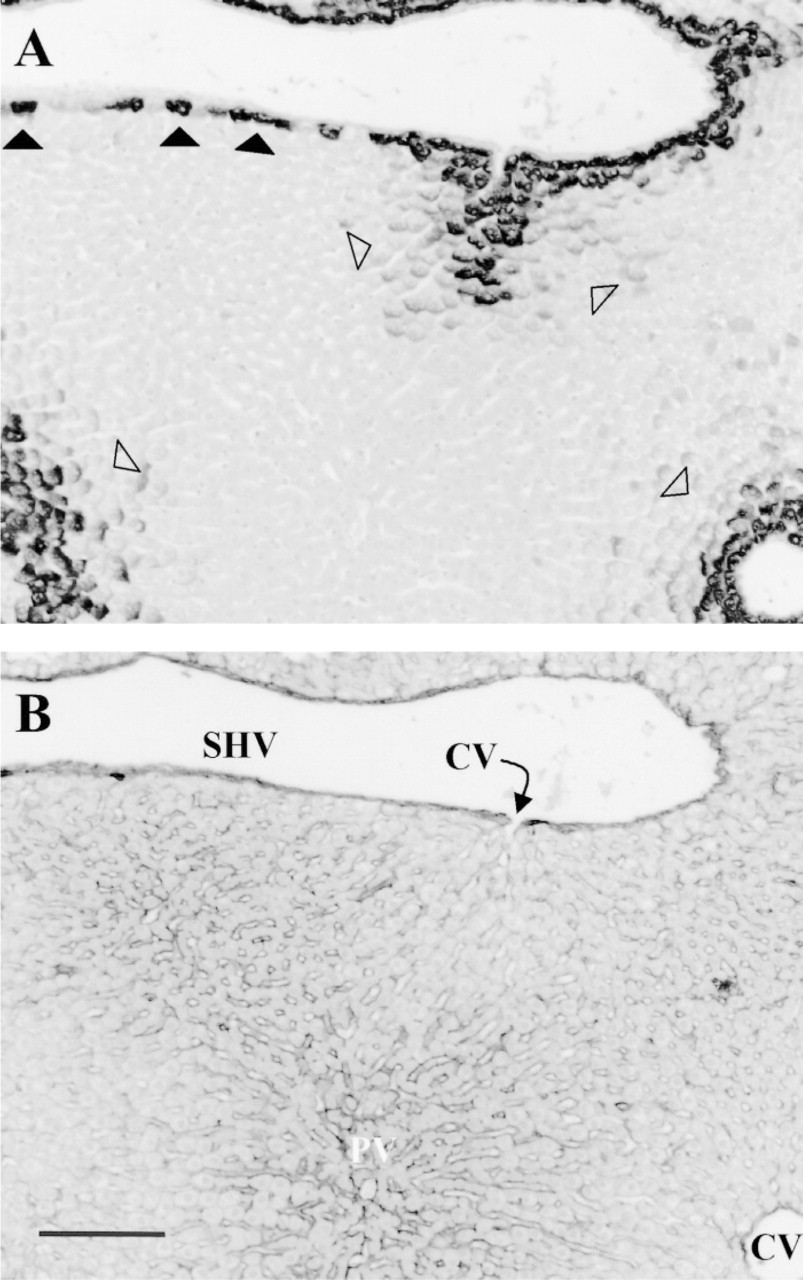
Expression pattern of GS in rat liver. (A) Glutamine synthetase; (B) fibronectin. Note the two- or three-cell thick layer of GS+ hepatocytes surrounding the central veins and their outlets into a sublobar hepatic vein (open arrowheads). Upstream of these strongly GS+ hepatocytes, a more shallow, three- to five-layer thick gradient of faintly GS+ hepatocytes is seen. The remaining part of the wall of the sublobar vein is bordered by a onecell thick layer of GS+ hepatocytes and by hepatocytes that do not express GS (filled arrowheads). The onecell thick layer of GS+ hepatocytes is not associated with a halo of faintly staining GS+ hepatocytes. Note also that the hepatocytes of the perihepatic limiting plate appear more compact than the subsequent, more upstream layers. CV, central vein; PV, portal vein; SHV, sublobar hepatic vein. Bar = 0.2 mm.
Initially, we distinguished only GS+ and GS− areas in the walls of the larger efferent veins. However, a more methodical analysis revealed that the GS+ border of these larger hepatic veins always consisted of a two- or three-cell thick core area that surrounded a draining venule and that itself was flanked by a onecell thick area of GS+ hepatocytes. Reinspection of our previous data showed that both types of GS+ hepatocytes contain GS mRNA (Wagenaar et al. 1994). In contrast to the areas with a multilayer of strongly GS+ hepatocytes, the areas with a single-cell layer of GS+ hepatocytes were not associated with a “halo” gradient in GS expression away from the vessel wall, i.e., in the direction of a neighboring portal vein. Furthermore, these hepatocytes express periportal enzymes (Wagenaar et al. 1994). We conclude that these hepatocytes are no longer subject to an intralobular signal gradient that actively stimulates expression of GS. Similarly, it was observed that hepatocytes of the perihepatic limiting plate retained their GS+ phenotype in carcinogen-treated rats, whereas more upstream hepatocytes became GS− (Gebhardt et al. 1989). Strongly GS+ hepatocytes retain their phenotype, at least in culture, until they divide (Gebhardt et al. 1986). We hypothesize that the hepatocytes in this onecell thick zone of GS+ hepatocytes continue to express GS cells autonomously until they undergo mitosis. If true, this finding implies that the expression pattern of hepatocytes bordering a vessel wall is stabilized at least until the cell passes through mitosis, whereas the phenotype of hepatocytes further away from the vessel wall is adaptively regulated. This interpretation would explain not only the persistence of small patches of GS+ cells within large GS− zones but also the accelerated disappearance of GS from many draining vessels after repeated partial hepatectomy and the associated increase in cell multiplication (Wu 1964; Gebhardt 1990; Wagenaar et al. 1993). In these latter livers, we do find GS+ and GS− hepatocytes side by side, even around relatively small hepatic veins (Ø <500 μm) (Gebhardt 1990; Wagenaar et al. 1993).
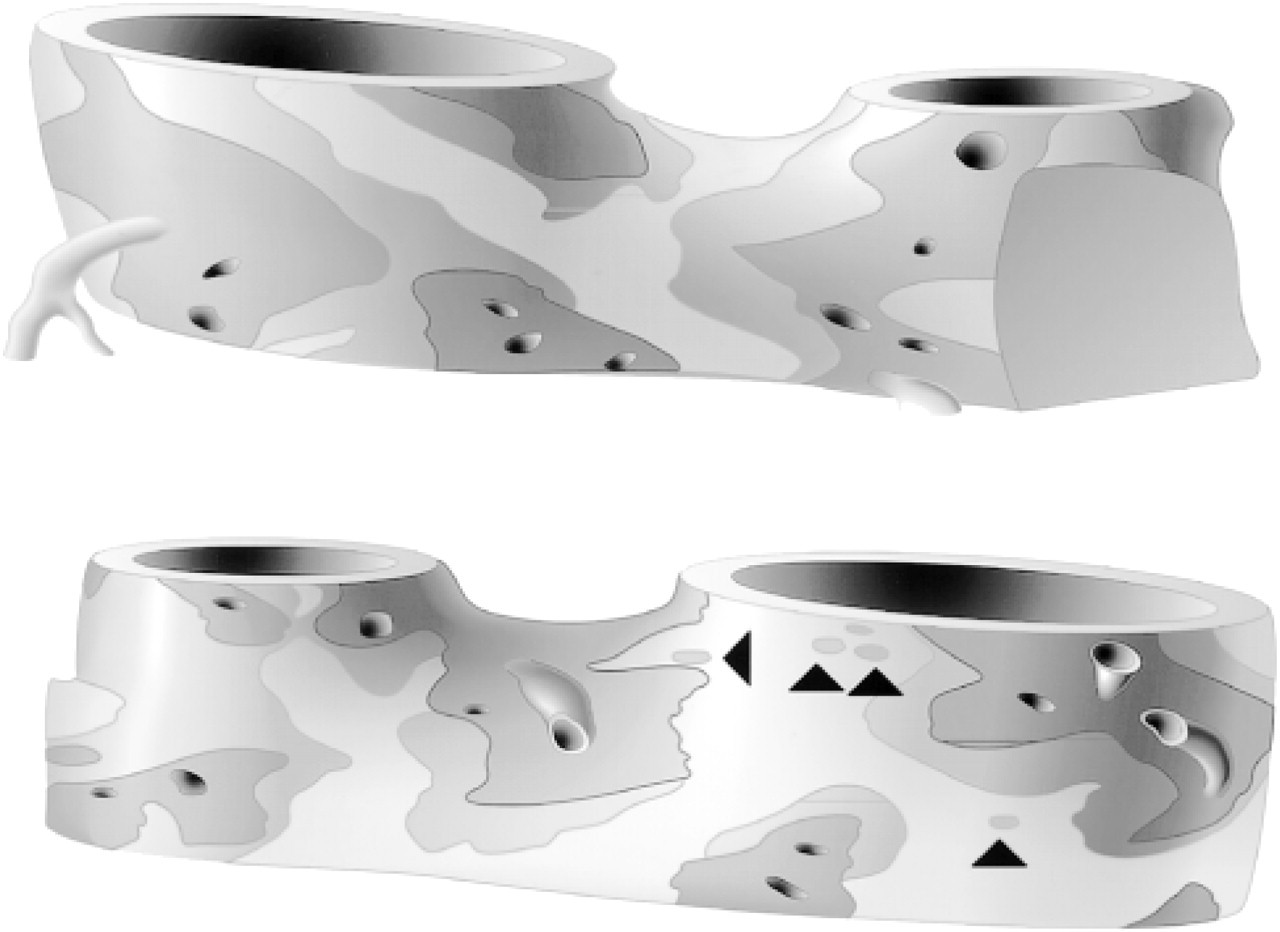
Reconstruction of a portion of two merging sublobar hepatic veins. Two opposite sides of the same vessel structure are shown. Part of the right-sided vessel in the upper panel fell outside the reconstruction. The outlets of unbranched central veins are indicated as holes, whereas those of branched central veins are shown as small vessels. The thickness of the layer of GS+ hepatocytes that borders the collecting veins is either two or three cells (dark gray) or a single cell (intermediate gray). The light gray zone does not contain GS+ hepatocytes. Note the isolated GS+ hepatocytes in the light gray zone (arrowheads).
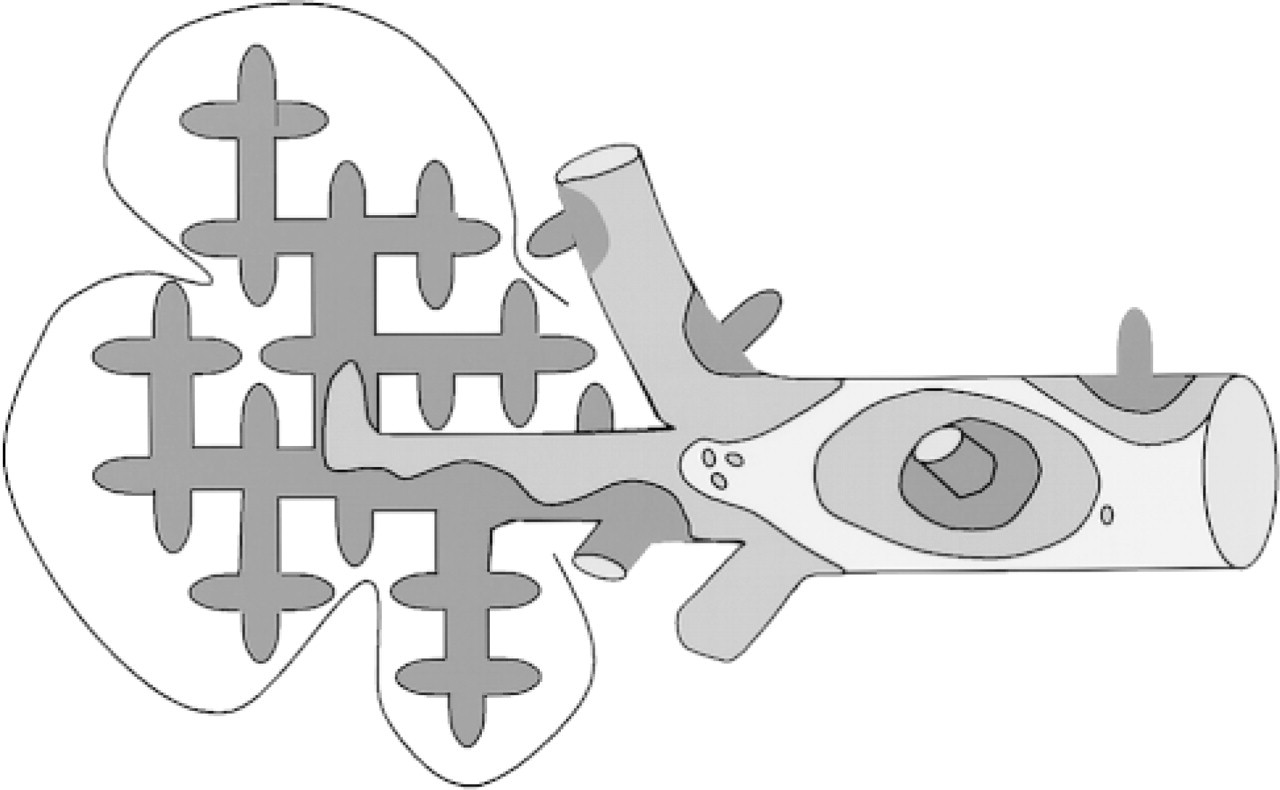
Schematic drawing of the pattern of expression of GS as a function of the size of the efferent hepatic veins. The code for the thickness of the layer of GS+ hepatocytes that border the wall of the efferent vessels is the same as in Figure 2. Note that the twoor three-cell layer thick rim of GS+ hepatocytes surrounds the first two to four generations of efferent veins (central veins) and that a single-cell layer thick rim of GS+ hepatocytes appears locally on larger efferent veins (sublobar veins). GS− hepatocytes line still larger hepatic veins, except where smaller efferent veins merge. Interrupted line, compound liver lobule.
We recently developed a model of the regulation of zonal gene expression in the liver (Christoffels et al. 1999) that is based on the assumption that the phenotype of the upstream periportal hepatocyte is determined by the concentration of regulatory signals in the afferent blood, whereas the phenotype of the downstream, pericentral hepatocytes is, in addition, determined by changes in blood composition due to metabolic and/or biosynthetic activity of the upstream hepatocytes. In support of the “upstream-downstream” signal hypothesis for GS expression, we have now demonstrated that, going downstream along the porto-central axis, hepatocytes accumulate GS, and that this accumulation initially follows a shallow gradient but becomes very steep in the last two or three cells. In fact, such a lining with two or three layers of GS+ hepatocytes was seen only around the two to four terminal branchings of the hepatic vein. This collecting part of the draining central venular tree was repeatedly shown to be associated with the “classical,” “secondary,” or “compound” liver lobule, i.e., with agglomerates of primary lobules that jointly drain into a conducting sublobar hepatic vein (Matsumoto and Kawakami 1982; Ekataksin and Wake 1991; Teutsch et al. 1999). However, a gradient in expression level was not seen in the areas where only a single layer of hepatocytes expresses GS, in accordance with our hypothesis (see above), that these hepatocytes no longer lie in the downstream part of the porto-central axis.
Footnotes
Acknowledgements
We thank Dr J.M. Ruijter for statistical advice and critical reading of the manuscript, Ms I. Oosterling for the rendering of the reconstructions, and Mr C.J. Hersbach for photography.