
Abstract
Capillary network characteristics are invaluable for diagnostics of muscle diseases. Biopsy material is limited in size and mostly not accessible for intensive research. Therefore, especially in human tissue, studies are performed on autopsy material. To approach the problem whether it is reliable to deduce hypotheses from autopsy material to explain physiological and pathological processes, we studied capillarity in pig soleus muscle 1 and 24 hr after death. Capillaries and muscle fibers were immunofluorescently marked, and images were acquired with a confocal microscope. Characteristics of the capillary network were estimated by image analysis methods using several plugins of the Ellipse program. Twenty-four hours after death, the measured characteristics of the capillary network differ by up to 50% when compared with samples excised 1 hr after death. Muscle fiber diameter, the measured capillary length, and tortuosity were reduced, and capillary network became more anisotropic. The main postmortem change that affects capillaries is evidently geometric deformation of muscle tissue. In conclusion, when comparing results from biopsy samples with those from autopsy samples, the effect of postmortem changes on the measured parameters must be carefully considered.
Introduction
An adequate blood supply is essential for the normal functioning of skeletal muscles. The capillary network, which is spatially heterogeneous, reflects the size and metabolic activity of the muscle fibers.1,2 Several analyses have been conducted to ascertain whether the capillary density in the muscle tissue is the decisive factor or whether it is more important how individual muscle fiber types are supplied. However, the spatial heterogeneity within the muscles is also important. 3 In their review, Egginton and Gaffney 4 report that the decisive physiological role is the distribution of the capillaries and their diameter—not their density in the muscle tissues. In our opinion, both the distribution and quantity of the capillaries are important; we therefore decided to conduct measurements using several parameters which characterize the capillary network of the muscle tissue in the domestic pig.
Local capillary supply was found not to be determined by local oxidative capacity (cf. Egginton & Hudlická, 5 Badr et al., 6 and Bosutti et al. 7 ). Muscle fiber size, however, does appear to have an influence.1,7,8
Muscles adapt their capillary supply to changed physiological, pathological, and experimental conditions (see, for example, Hudlická, 9 Hudlická & Price, 10 Lexell, 11 and Harris, 12 for review). Most histomorphometric studies were performed using samples of thin histological sections, where the capillaries were stained and their profiles further analyzed, either number based (see Lexell 11 and Harris 12 for review; Stål et al., 13 Green et al., 14 Porter et al., 15 Charifi et al., 16 and Wüst et al. 17 ) or capillary domain based.2,4,7,18,19
Some recent investigations applied a three-dimensional (3D) approach. Fraser et al.20 –22 analyzed capillary geometry from in vivo–captured videos of perfused rat skeletal muscles, whereas our research focused on stacks of optical images acquired by a confocal microscope from fluorescently stained capillaries in thick muscle sections.23 –25
Fisher axial distribution served as the basis for the first studies conducted on capillary configuration, that is, tortuosity and anisotropy.26 –29
Although every method has its advantages and disadvantages, note should be made that the characteristics of the tissue itself and its behavior during the procedure of fixation, perfusion, staining, cutting, and embedding could also affect the final results. 30 The capillary length obtained also depends on the sampling procedure, image acquisition, segmentation, and measurement. Moreover, most studies encompass the terminal parts of arterioles in addition to the capillaries. Nevertheless, for the sake of simplicity, the term capillaries will be used when referring to microvessels. 16
When human biopsy material is analyzed, the number and size of samples are limited, which reduces the accuracy of results. Therefore, most analyses are performed on autopsy material. Muscle samples are obtained at different postmortem time intervals (from 0 to 48 hr). Despite being depleted of the circulating blood that supplies oxygen and removes metabolic end products, the muscle not only remains functional and metabolically active for several days after death, 31 a series of structural and metabolic changes also occur.32,33 We applied the previously developed method for estimating the characteristics of the capillary network in 3D 25 to check whether the technique applied would provide comparable results if the muscle samples were excised within 24 hr of death. The outcome would help conclusions to be drawn on how reliable the measured characteristics of the capillary network obtained in autopsies are when compared with biopsies.
To approach these problems, the muscle tissue samples of the soleus muscle from domestic pigs were analyzed at time periods of 1 and 24 hr postmortem (before the onset of rigor mortis and after its termination).
Material and Methods
Material
Muscle Samples
Eight fresh female porcine cadavers (Sus scrofa domesticus; each weighing around 20 kg) that had been previously used for another study 34 before being euthanized were then used as approved by Review Board for Animal Research (N°U34401-28/2013/17). The principles and guidelines for scientific experiments on animals and for laboratory animal care were respected in accordance with the 2010/63/EU Directive. The previous protocol had no significant bearing on the cadavers used in this study.
Methods
The pigs were euthanized with T-61 solution (1 ml containing 200 mg of embutramid, 50 mg of mebezonium, and 5 mg of tetracaine hydrochloride; Hoechst GmbH, Munich, Germany) under general anaesthetic. The cadavers were laid out in a prone position to reduce pressure on the muscle in situ. The samples (1 × 1 × 1 cm) were excised from the central part of the right soleus muscle at time periods of 1 and 24 hr after death. They were deep frozen in liquid nitrogen, and a Microtome Leica CM1950 (Leica Biosystems Nussloch GmbH, Nussloch, Germany) was then used to cut 100-µm-thick transversal sections, which were collected into a chilled phosphate-buffered saline (PBS) solution with the addition of 0.2% Triton (PBST); they were then transferred into a chilled fixative, which was composed of a mixture of 7% formaldehyde and 0.1% glutaraldehyde in a 0.1-M phosphate buffer with a pH of 7.4, where they were stored for 3 days. After being thoroughly rinsed in PBST, the sections were incubated in an antigen retrieval solution composed of proteinase K 0.2% (Fermentas, Waltham, MA) in a 0.5-M Tris buffer with a pH of 8.0 with the addition of EDTA (0.5 M) for 5 min at 37C. After being rinsed in PBST, the samples were then incubated in a rabbit polyclonal antibody against collagen IV to visualize basal lamina (1:200 overnight; Abcam, Cambridge, UK), rinsed in PBST, incubated at Alexa Fluor 594 A-11012 (1:100; Invitrogen, Waltham, MA), rinsed in PBST, incubated at Fluorescein Griffonia (Bandeiraea) Simplicifolia Lectin I (FL-1101; Vector Laboratories, Burlingame, CA) to visualize endothelial cells 35 diluted 1:300 in PBS, rinsed in PBST, and mounted in ProLong Gold antifade (Molecular Probes by Life Technologies, Waltham, MA).
Image Acquisition
Images were acquired in the green and red channels simultaneously using a two-channel Zeiss LSM 510 confocal microscope (Carl Zeiss; Jena, Germany) using a Zeiss Plan-Neofluar oil immersion 40× objective (numerical aperture: 1.3). The excitation wavelengths were 488 nm (Argon laser) and 543 nm (He/Ne laser). The emission signal was filtered using a narrow band (505–530 nm) and an LP 560-nm filter. Completely registered stacks of images were captured 1 µm apart at 512 × 512-pixel resolution. At least five fields of view were randomly sampled for each muscle.
Correction for Shrinkage
The axial calibration of individual stacks was corrected for shrinkage so that the apparent distance between the lower and upper surfaces of the thick section matched the original thickness of the sections known from the microtome setting. 30 The reliability of the microtome settings was checked in separate experiments on frozen rat muscles, and a satisfactory result was obtained. Furthermore, we are not aware of any practical method for measuring the muscle fiber shrinkage in terms of length and girth during postmortem changes. We were able to measure only final effects of those changes on the muscle architecture.
Image Analysis
The Ellipse program 2.081 (ViDiTo, Košice, Slovakia), with several plugins, developed by Jiří Janáček, was applied for further analysis.
A Gaussian filter and a Lipschitz filter were used to remove the noise and background, respectively, from the image stacks, which were then segmented by thresholding. The binary image was skeletonized using a 6-pass Palagyi algorithm, and the result was vectorized to a geometric graph composed of line segments of approximately 5 μm in length. The result was manually corrected in virtual reality using a haptic device. The haptic device is a computer interface for 3D interaction with virtual objects. It enables the movement of a 3D cursor in the computer graphic scene with haptic feedback for the perception of touch with virtual objects.
The muscle fiber outlines were interactively drawn on the images at four levels in the stack and further used to calculate the fiber diameter, surface area, and volume, as well as for the assignment of the capillaries to individual fibers and for the visualization of capillaries and muscle fibres. 36
3D Visualization of Capillaries and Muscle Fibers
The muscle fiber surfaces were modeled using triangulated surfaces spanning the outlines of the fibers’ extremal cross-sections. The capillaries were modeled using chains of cylinders of a consistent diameter that were joined by spheres with the same diameter. The capillaries and fiber surfaces were rendered in the Contours plug-in for the Ellipse program using the OpenGL graphic library (Silicon Graphics International Corp., Milpitas, CA).
Parameters Characterizing Capillary Network
The following parameters were estimated (after Janáček et al. 25 ):
Capillary length, estimated as the sum of the line segment lengths in the geometric graph, was defined per unit volume of muscle tissue (LVm) and per muscle fiber length (LL), per fiber surface area (LS), and per fiber volume (LV) within a fiber neighborhood of 15 μm.
To measure the muscle fiber diameter (the average Feret diameter), the muscle fiber surface, and its volume, the muscle fibers were delineated manually on optical sections at four levels within the stack. The muscle fibers were further categorized based on their diameter as small fibers (D < 40 µm) and large fibers (D > 40 µm). We calculated the LL, LS, and LV within a fiber neighborhood of 15 µm. Tortuosity (T) was estimated by the sum of exterior angles (in radians) between successive line segments divided by the total capillary length (Fig. 1).
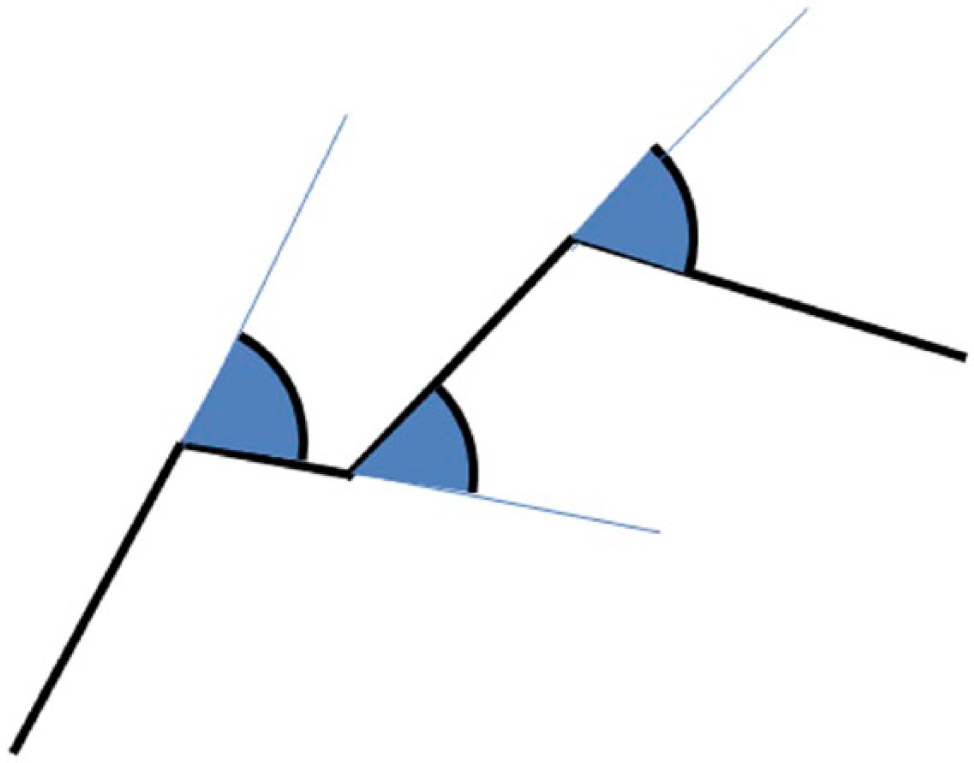
Estimating tortuosity of capillaries. A single capillary is represented by consecutive connected line segments (marked with a thick black line). The external angles between the neighboring segments are represented by arcs between the next segment and the continuation of the previous segment (marked with a thin blue line). The sum of the external angles gives the total curvature of the capillary medial axis, which corresponds to our working definition of tortuosity.
The anisotropy index (A) of the capillaries was calculated on the basis of the eigenvalues of the length-weighted mean of the structural tensors of the line segment directions. The values span from 1 (total isotropy) to infinity (total anisotropy) (Fig. 2).
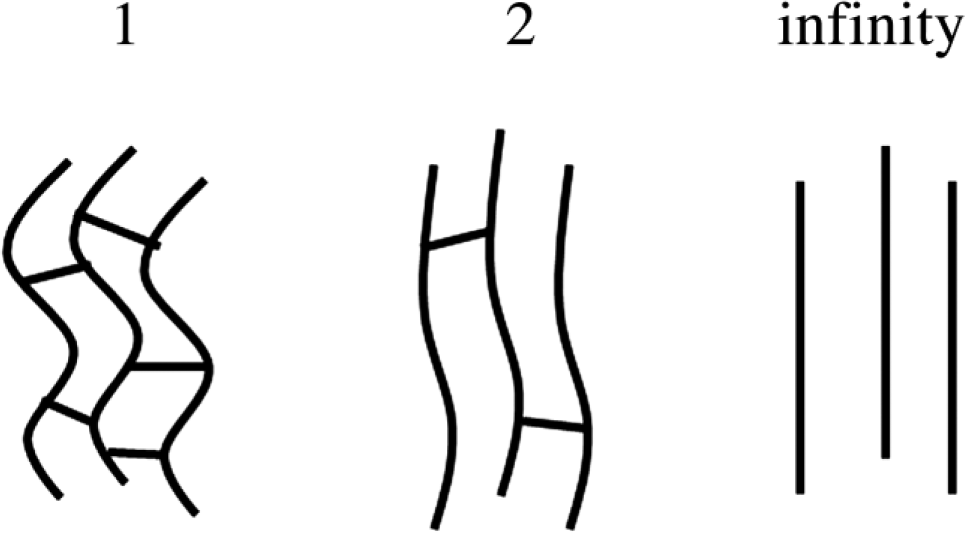
Graphic presentation of the span of the anisotropy factor. The left panel shows the almost isotropic arrangement of the capillaries. The preferential direction is a vertical direction in the middle and right panels, where the different degrees of anisotropy are demonstrated—mild anisotropy in the middle panel and total anisotropy in the panel furthest to the right.
The mean capillary length (capL) was estimated to be 2/3 of the total length divided by the number of branchings.
The capillary branch density (Br) was expressed as the number of branching points per unit volume of muscle tissue.
Statistics
The SPSS 21 statistical package was applied to calculate the mean values and the standard error of the mean (SEM) for the length of the capillaries per muscle volume (LVm), per muscle fiber length (LL) and per fiber surface area (LS), the tortuosity (T), the anisotropy index (A), the mean capillary length (cap L), and the capillary branch density (Br). The differences in the mean values for the above parameters between the samples excised after 1 and 24 hr were tested with a paired sample t-test and a Wilcoxon signed-rank test. Differences among the means were considered statistically significant if p<0.05.
Results
Figure 3 shows that the segmentation method used to detect the capillaries was effective. The traces (in white) cover the immunohistochemically stained capillaries (in green).
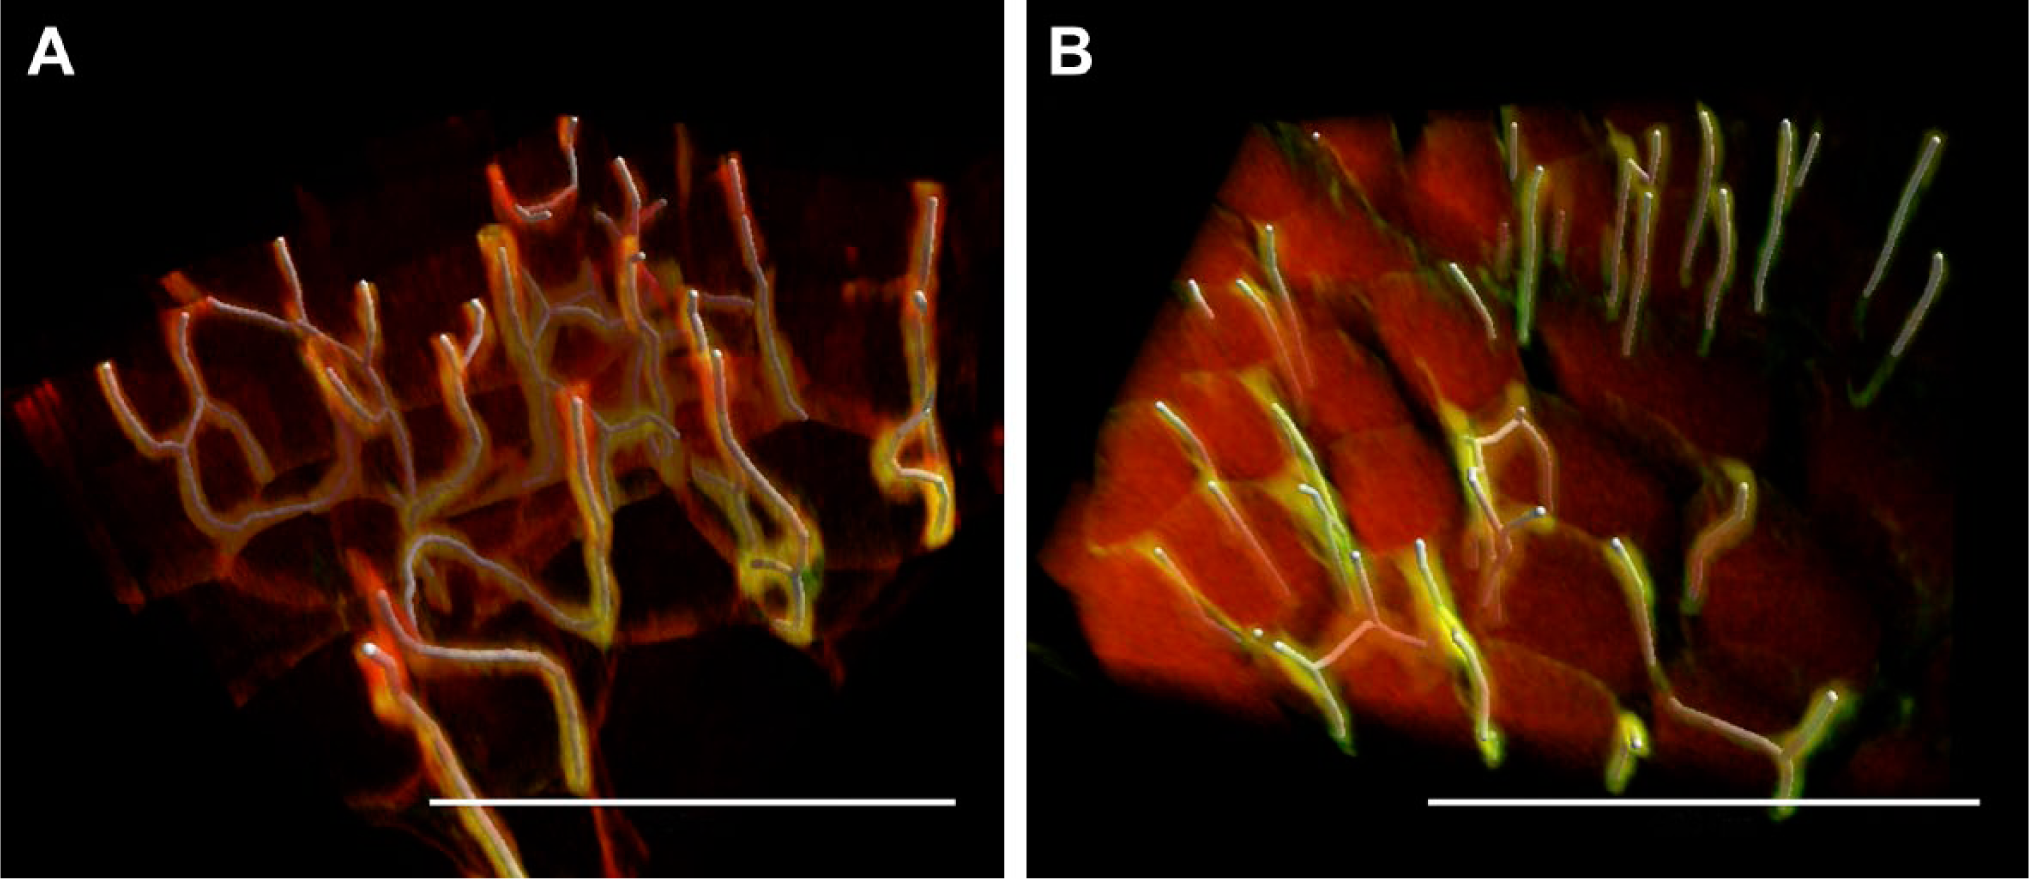
Three-dimensional visualization of capillaries in the pig soleus muscle, excised 1 hr (A) and 24 hr (B) after death. The capillaries were automatically segmented (see the “Methods” section) and traces (in white) superimposed on the immunohistochemically demonstrated capillaries (in green). The scale is 200 µm.
The results of this study indicate that several characteristics of the blood supply in the pig soleus muscle differ significantly, whether excised 1 or 24 hr after death (Figs. 3 and 4 and Table 1).
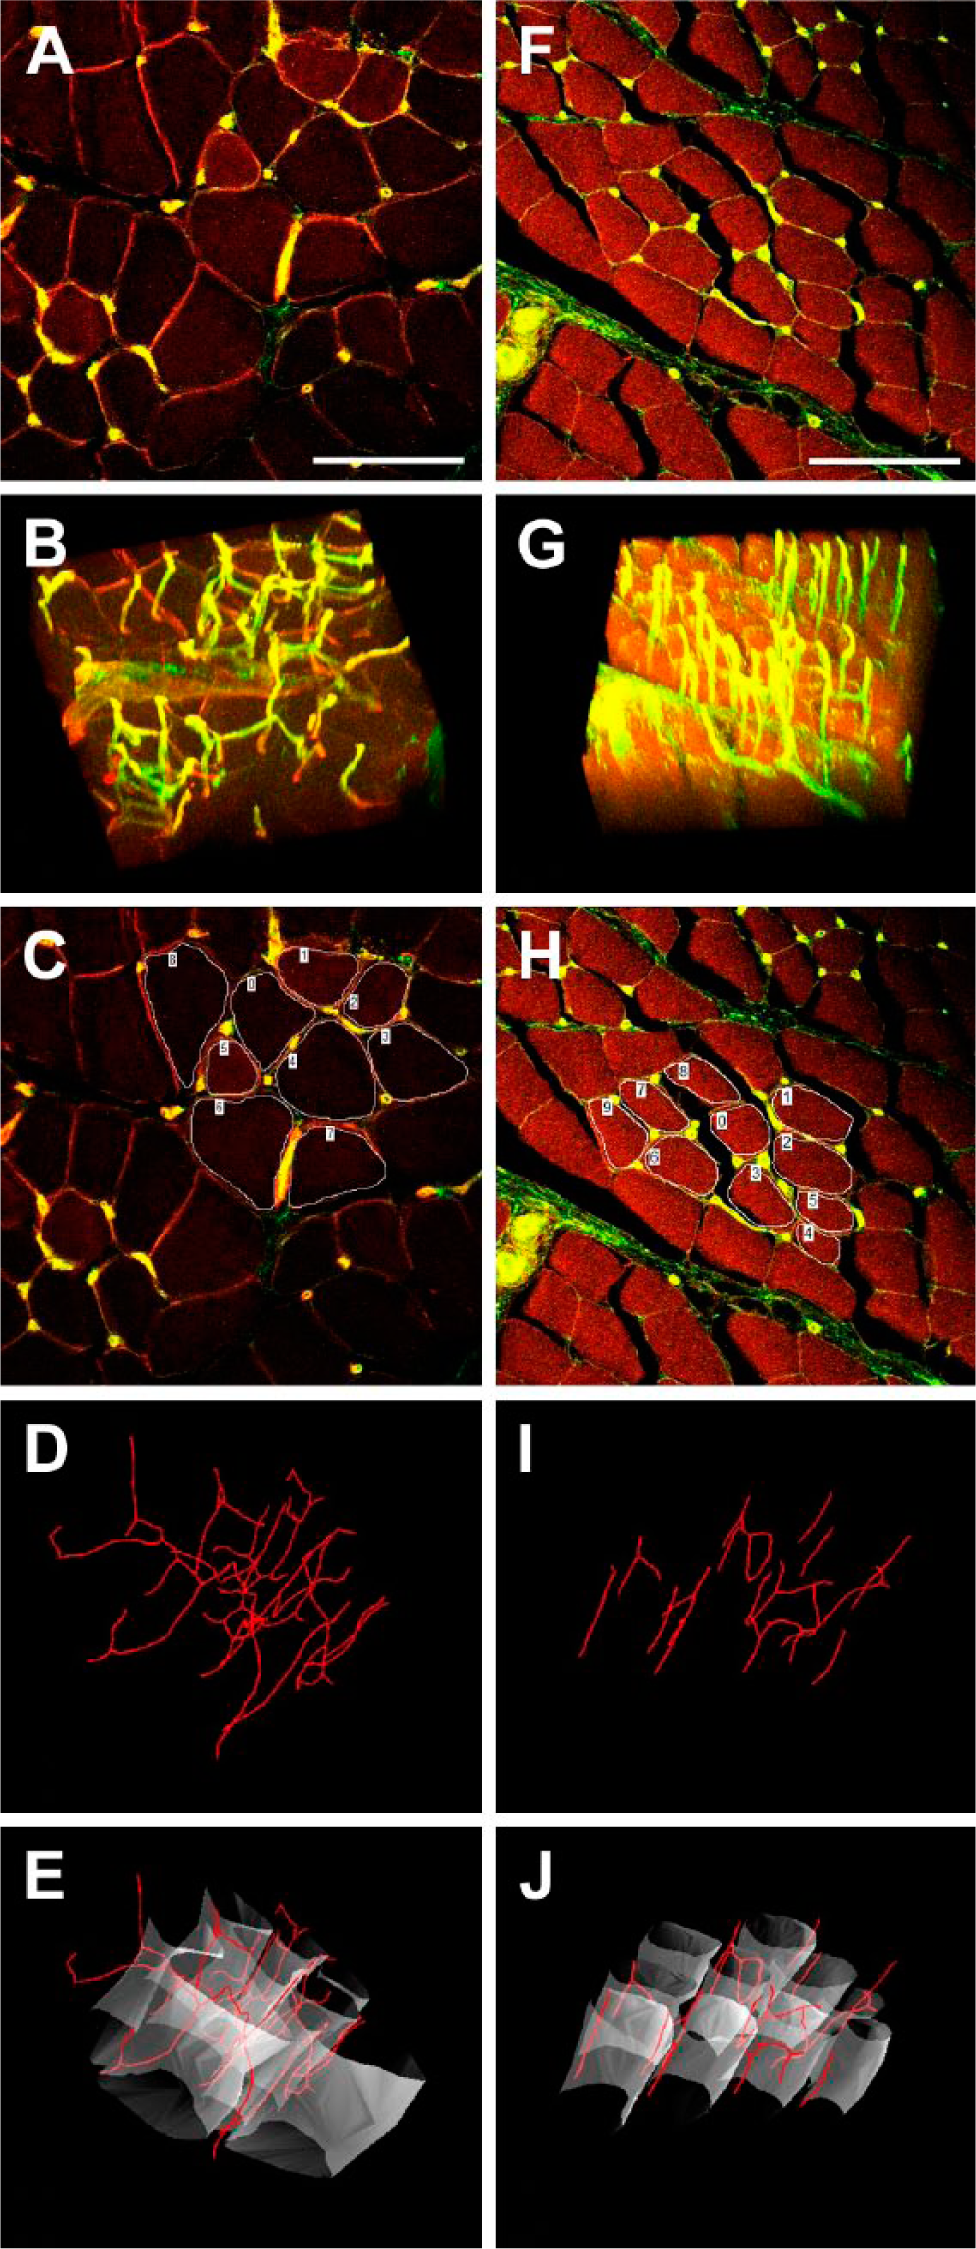
Capillaries and muscle fibers in pig soleus muscle, excised 1 hr (left side) and 24 hr (right side) after death. (A, F) Immunohistochemical staining of capillaries and muscle fibers on a 1-µm-thick optical section; (B, G) volume rendering of capillaries; (C, H) optical section with marked selected muscle fibers, processed further in D, E, I, J; (D, I) contours of capillaries—see that the geometry is changed 24 hr after death—the tortuosity is 0.04 (D) and 0.01 (I), while the anisotropy is 1.23 (D) and 4.01 (I); (E, J) muscle fibers with supplying capillaries. The scale is 100 µm.
Characteristics of the Capillary Network in Pig Soleus Muscle 1 and 24 hr After Death.
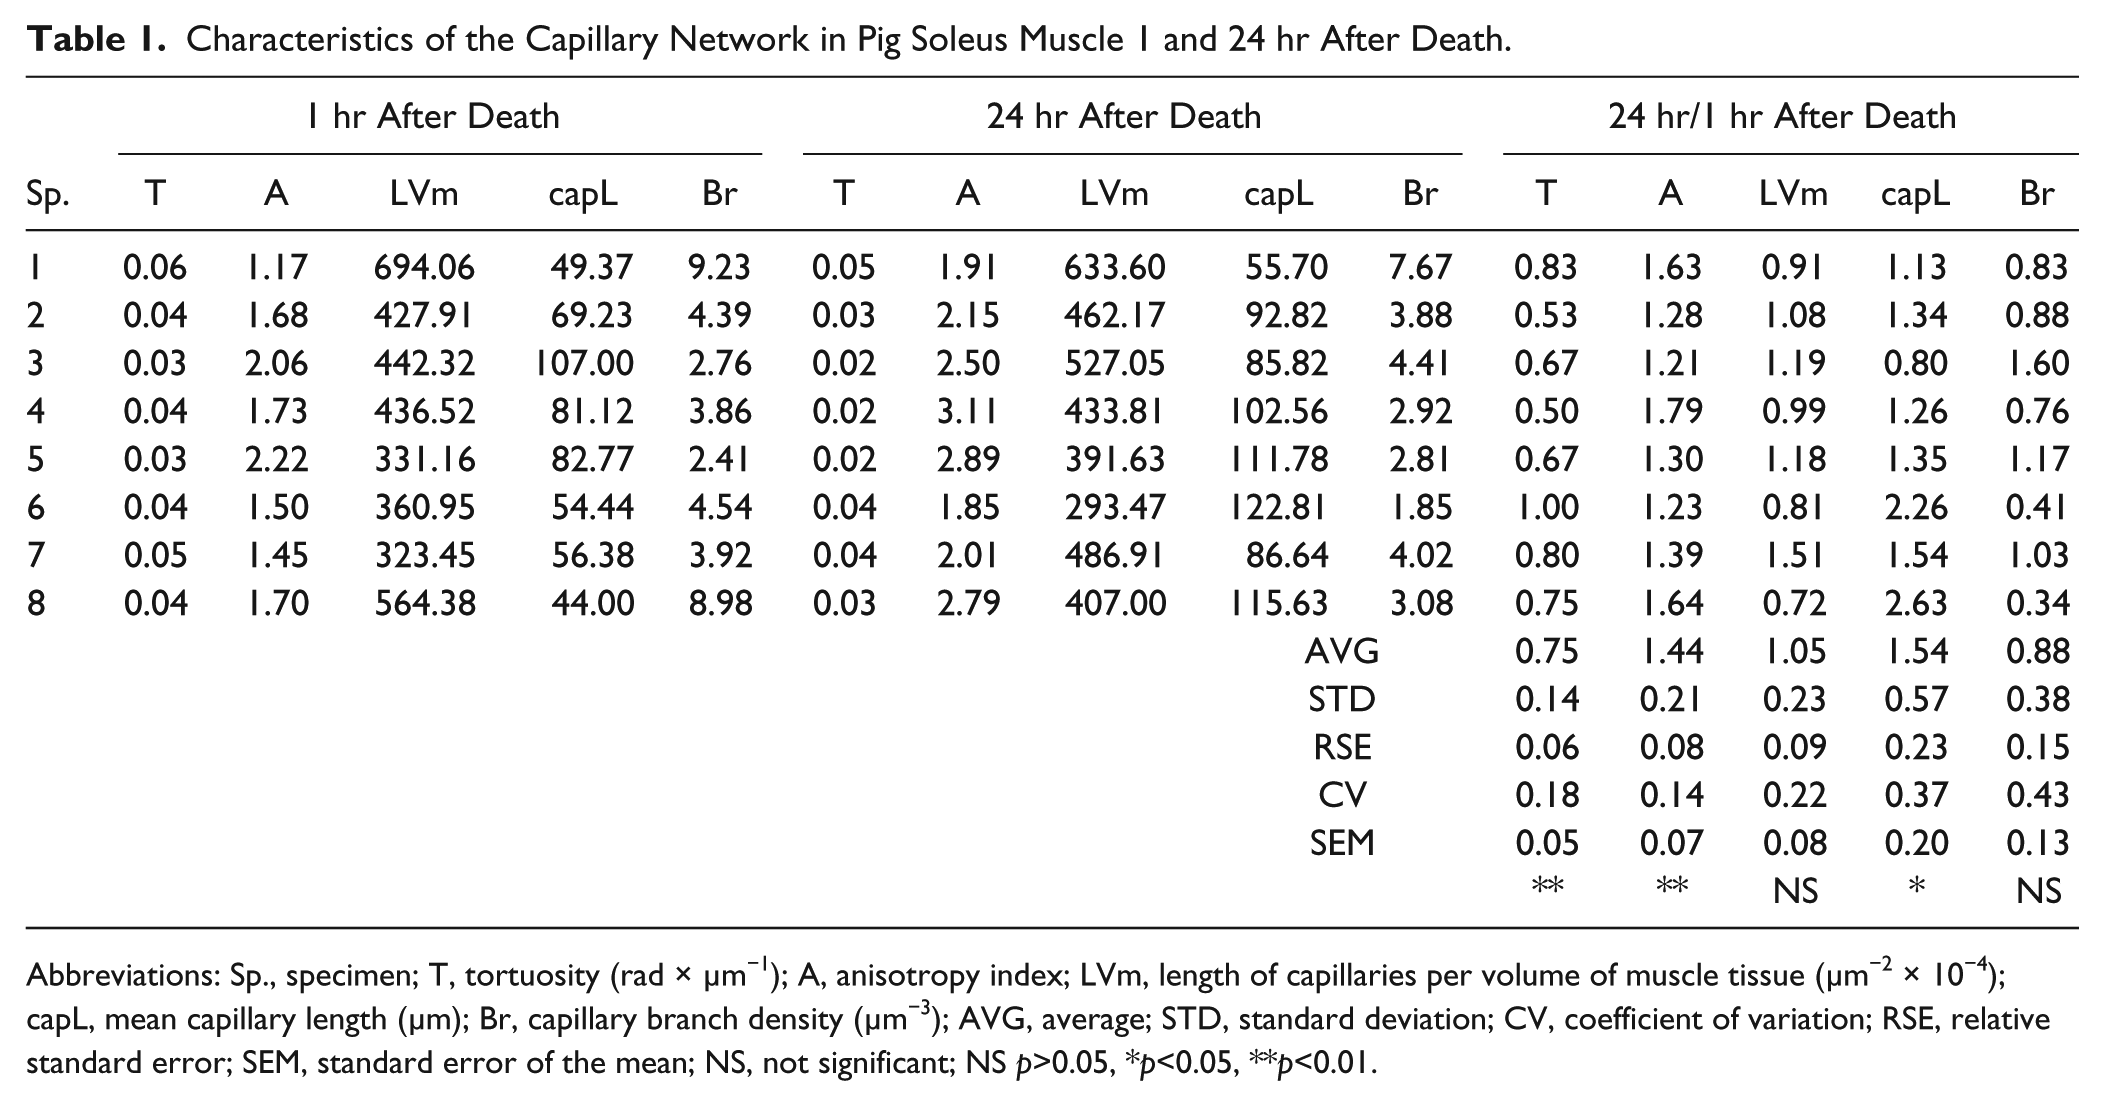
Abbreviations: Sp., specimen; T, tortuosity (rad × µm−1); A, anisotropy index; LVm, length of capillaries per volume of muscle tissue (µm−2 × 10⁻⁴); capL, mean capillary length (µm); Br, capillary branch density (µm−3); AVG, average; STD, standard deviation; CV, coefficient of variation; RSE, relative standard error; SEM, standard error of the mean; NS, not significant; NS p>0.05, *p<0.05, **p<0.01.
In the samples excised after 24 hr, tortuosity was reduced and anisotropy enlarged significantly by about 25% and 40%, respectively, while the mean capillary length was approximately 50% larger. The capillary length per volume of muscle tissue did not change.
Detailed analysis of the geometric parameters related to the blood supply of individual muscle fibers shows that the fiber diameter shrinks by about 20% and the capillary length per fiber length (LL) by about 25% at a time interval of 24 hr postmortem. There are significant changes, proven by both statistical tests, in the large fibers, and similar though non-significant trends are seen also in the small fibers. The length of the capillaries per fiber surface (LS) and per fiber volume (LV) did not change significantly (Table 2).
Capillary Supply of Muscle Fibers in the Pig Soleus Muscles (N=6) 1 and 24 hr After Death.
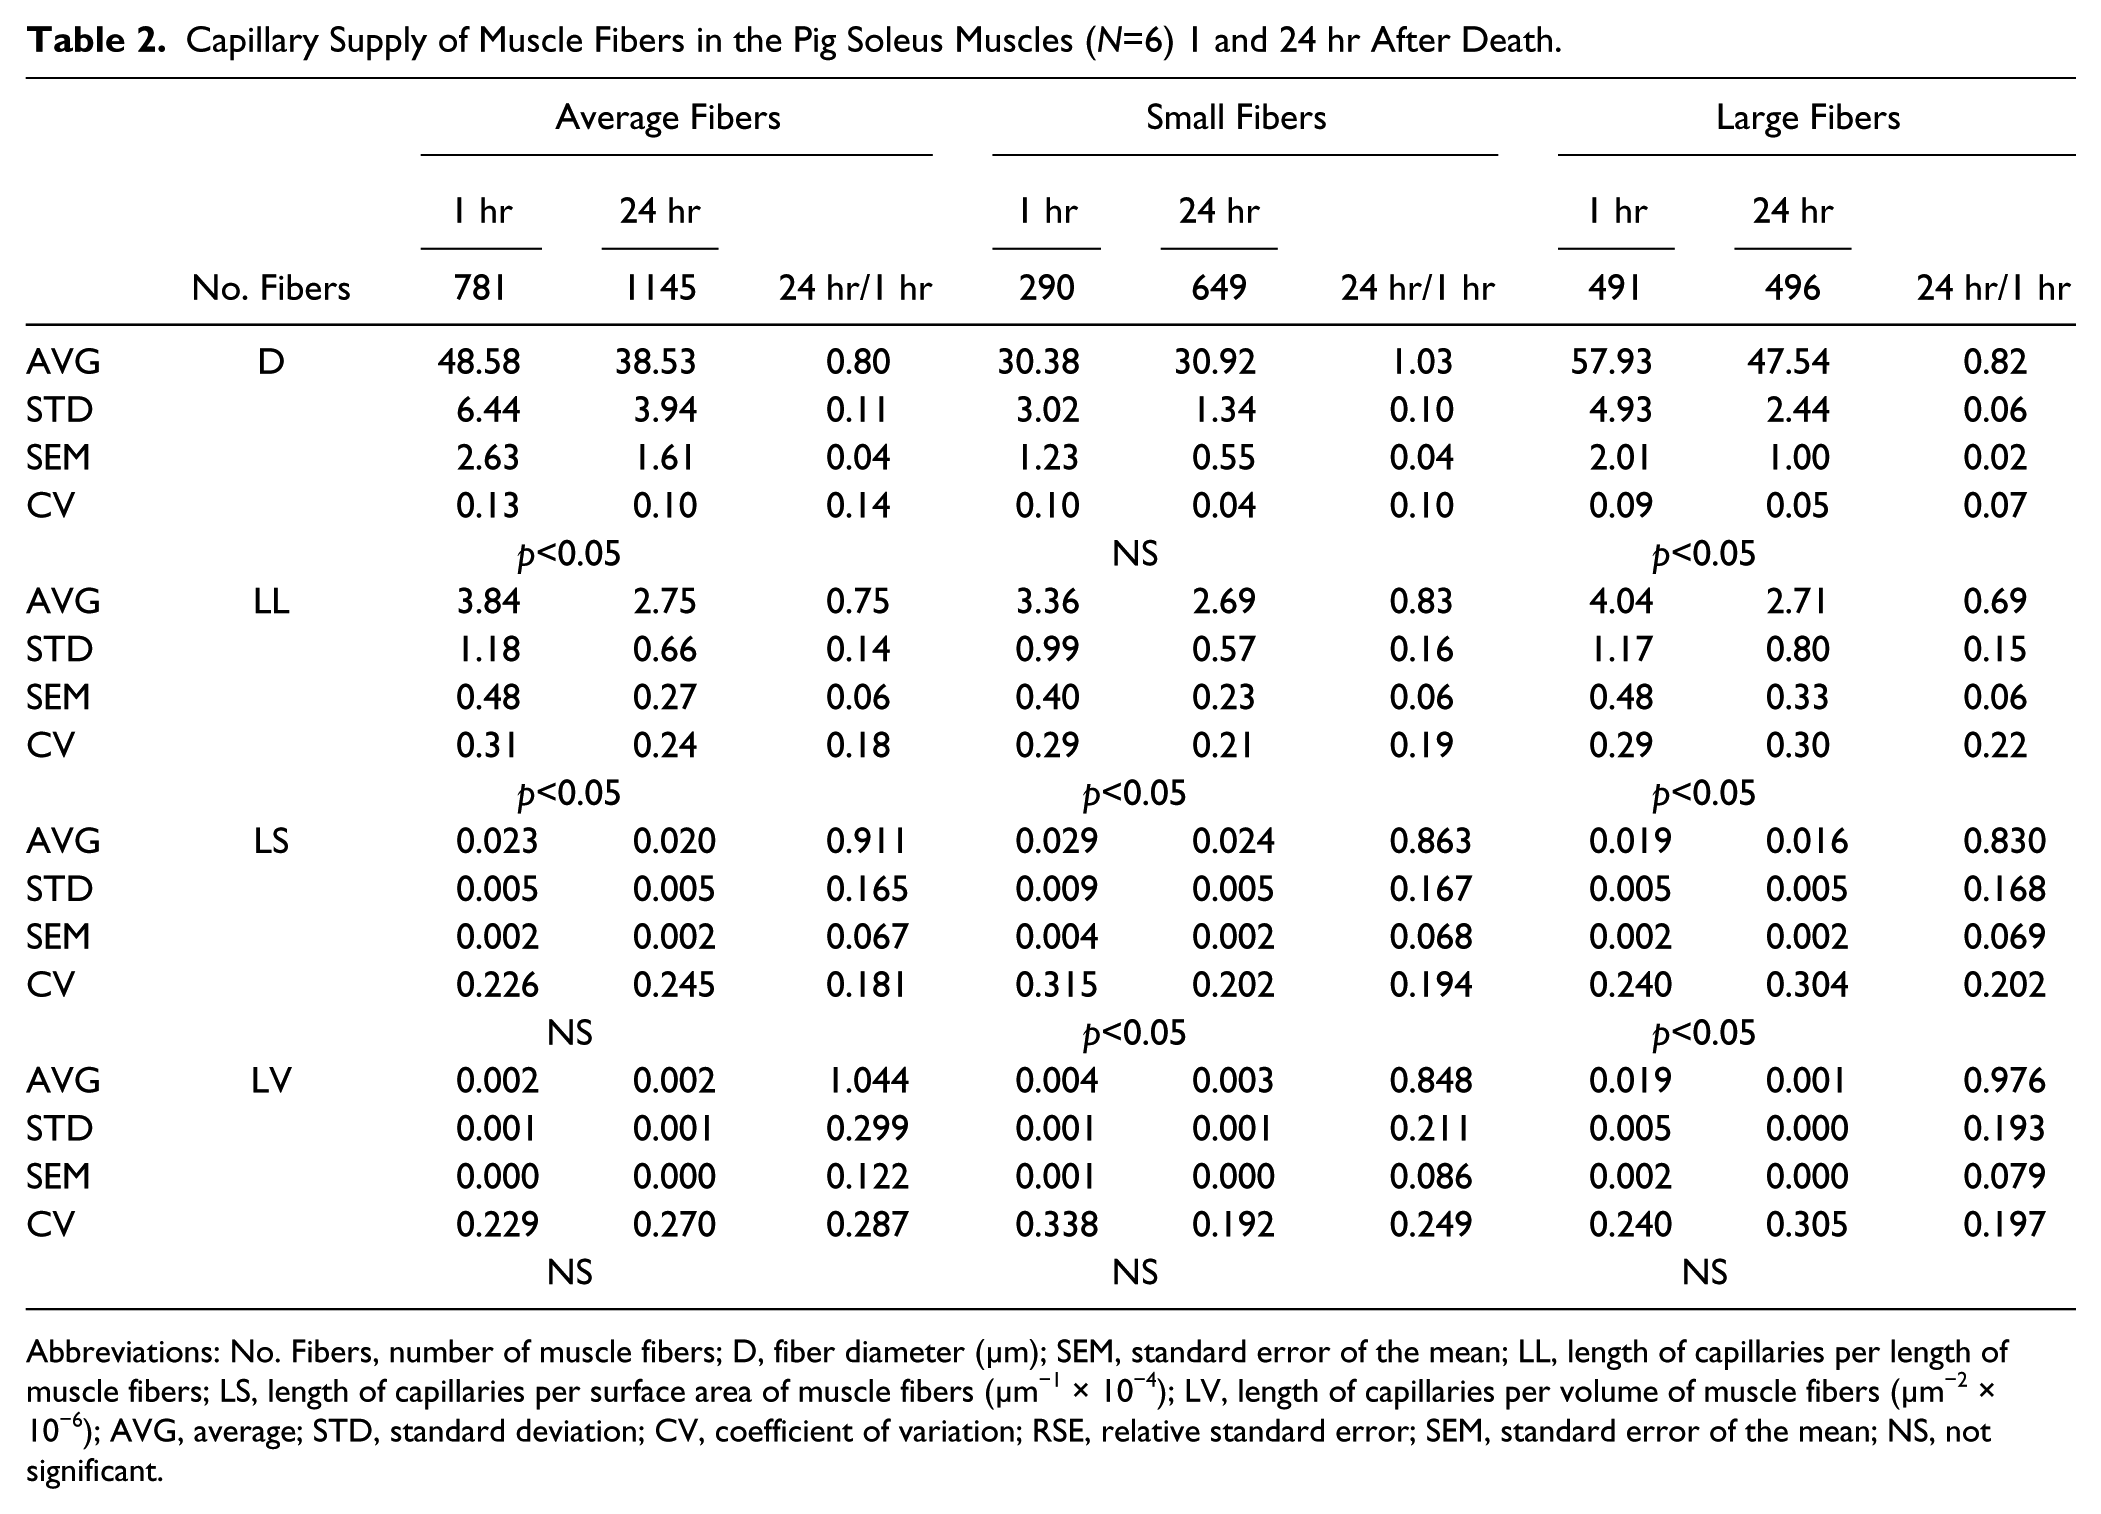
Abbreviations: No. Fibers, number of muscle fibers; D, fiber diameter (µm); SEM, standard error of the mean; LL, length of capillaries per length of muscle fibers; LS, length of capillaries per surface area of muscle fibers (µm−1 × 10⁻⁴); LV, length of capillaries per volume of muscle fibers (µm−2 × 10⁻⁶); AVG, average; STD, standard deviation; CV, coefficient of variation; RSE, relative standard error; SEM, standard error of the mean; NS, not significant.
Discussion
This study addressed the morphometry of the capillaries and terminal arterioles in the soleus muscle of domestic pigs. It is the first study of its kind to demonstrate changes to the capillary pattern in postmortem skeletal muscle, excised 1 and 24 hr after death. The 3D approach applied to quantify changes in the characteristics of the capillary network detected significant alterations within 24 hr of death: The capillary length and tortuosity were reduced and the anisotropy enlarged. Moreover, the muscle fiber diameter shrank. The reported changes are explained as follows.
The reduced capillary length measured may have resulted from protein degradation and the consequently weak or missing capillary staining. Moreover, it could have resulted from a presumably passive adaptation of the capillary network to changes in muscle fiber form and size during rigor mortis. Sanoudou et al. 37 report that skeletal muscle undergoes a highly active transcriptional and possibly translational phase during the initial 46 hr postmortem, presumably in response to hypoxia and oxidative stress, and describe large-scale differences in gene expression between human skeletal muscle obtained in an autopsy and biopsy.
Some key changes include ischemia or anoxia, pH changes, membrane damage with diffusion, disruption of homeostasis, and eventually cessation of cellular biosynthetic activity. Anoxia leads to the accumulation of lactic acid; it decreases the tissue pH which is important in determining the level of activity of specific proteases and consequently the level of protein degradation. 38 Lactic acid accumulation and consequently muscle acidification is a process that causes loss in water holding capacity, which can also partly explain the reduction in muscle fiber diameter.
Rigor mortis produces a slow contraction in skeletal muscle fibres 39 which appears to cause twisting or kinking of the fibres. 40 Bendall 41 categorized straight fibers as “actively contracting” and irregular or kinked fibers as “passively shrinking” although they are not completely inactive. 42 Bendall 41 suggested that the irregular shape of the passively shrinking fibers was due to the shortening of neighboring actively contracting fibers.
The rate of rigor onset 43 and its termination 44 differs greatly between skeletal muscles within a species. In this study, it appeared within a time interval of 6 to 12 hr in all animals, while after 24 hr, when the second round of our samples were excised, the process was already terminated.
The results of this study indicate that primary changes in muscle samples taken 24 hr after euthanasia are likely to cause geometric deformation of muscle tissue.
On average, the muscle fiber diameter shrank by 20%. Consequently, the same volume of muscle tissue contained more muscle fibers. As the length of capillaries per volume of muscle tissue (LVm) remained unchanged, the reduction in the capillary length per fiber length is in agreement.
The reduced muscle fiber diameter is mostly due to the changes occurring in the large fibers, and is likely to result from the loss of water in the muscle fibers caused by muscle acidification. In contrast, the diameter of the small fibers remained unchanged. The small-diameter fibers appear to be more resistant to postmortem modifications than large-diameter fibers and are likely to be actively contracting fibers.
During and after rigor mortis, the resistant fibers have a phase shift in their ability to contract. In contrast to larger fibers, resistant fibers are better able to preserve their limited ability to contract. This is achieved by the length of resistant fibers being shorter than for larger fibers, which are elongated and kinked (Table 1). This falls into line with the relationship between the tortuosity and muscle fiber shortening, as reported by Mathieu-Costello 45 and Mathieu-Costello et al. 46 When tortuosity is reduced, capillary length density is also reduced, as both tortuosity and branch density contribute to the capillary length density. 45
It is clear from the results of this study that capillary length per fiber length (LL) was reduced significantly in large fibers. In small fibers, the difference in LL was not found to be statistically significant (Table 2). As the fiber surface area and volume correlate with the changes of the muscle fiber diameter, the length of capillaries per fiber surface area (LS) and volume (LV) did not change significantly. In this study, the sarcolemma remained unstained in samples of two animals out of eight, excised 24 hr after death, which meant that the muscle fiber outlines could not be identified within the stack of images. Therefore, the data for capillary length per fiber length (LL), per fiber surface area (LS), and per fiber volume (LV) is provided for six pigs only.
Samples excised 24 hr after euthanization of animals contain more muscle fibers in the same volume of muscle tissue. Consequently, the nonsignificant changes in branch density actually suggest a reduction in branch density, which also leads to larger average capillary length, ostensibly because some of the capillaries become disconnected or their branches disappear or become invisible due to the unstained parts of the capillaries.
This study provides further evidence that the characteristics of the capillary network strongly depend on muscle fiber diameter,1,7 which is prone to differential postmortem modifications: Smaller fibers, which usually correspond to fibers with stronger oxidative potential, are more resistant to shrinkage; therefore, at least during the first hours, they preserve the characteristics of their blood supply longer than larger fibers, which are presumably less oxidative.
To conclude, the 3D imaging method applied to study the characteristics of the capillary network has many advantages over 2D methods, as it gives possibility to estimate and visualize more parameters. However, the results from the autopsy samples cannot be directly compared with those from the biopsy samples: Eventual postmortem changes occurring during the time interval between the moment of death and accompanying morphometric changes, described above, should be taken into account. The muscle fiber type pattern and percentage of individual muscle fiber types ostensibly also play an important role. The reported morphometric changes occurring within 24 hr after death provide an important baseline for proper interpretation of the skeletal muscle capillary pattern in studies using autopsy specimens.
Footnotes
Acknowledgements
The authors appreciate the technical assistance of Ivan Blažinovič, Majda Črnak-Maasarani, Stanko Kristl, Nataša Pollak Kristl, Marko Slak, Friderik Štendler and Milan Števanec. The authors express their gratitude to the anonymous reviewers for their valuable comments.
Competing Interests
The author(s) declared no potential conflicts of interest with respect to the research, authorship, and/or publication of this article.
Author Contributions
IE performed the analysis and wrote the manuscript; JJ programmed the plugins for the Ellipse program and assisted with analysis, writing, and explanations; MK assisted with the image acquisitions and writing; LK assisted with writing the manuscript; and EC designed the experiment and assisted with the explanation of the results and writing the manuscript.
Funding
The author(s) disclosed receipt of the following financial support for the research, authorship, and/or publication of this article: The authors acknowledge the financial support of the Slovenian Research Agency (P3-0043) and the Ministry of Education, Youth and Sports of the Czech Republic (MEYS; LM2015062 Czech-BioImaging).