
Abstract
Determination of lipid droplet (LD) volume has depended on direct measurement of the diameter of individual LDs, which is not possible when LDs are small or closely apposed. To overcome this problem, we describe a new method in which a volume–fluorescence relationship is determined from automated analysis of calibration samples containing well-resolved LDs. This relationship is then used to estimate total cellular droplet volume in experimental samples, where the LDs need not be individually resolved, or to determine the volumes of individual LDs. We describe quantitatively the effects of various factors, including image noise, LD crowding, and variation in LD composition on the accuracy of this method. We then demonstrate this method by utilizing it to address a scientifically interesting question, to determine the density of green fluorescent protein (GFP)–tagged Perilipin-Adipocyte-Tail (PAT) proteins on the LD surface. We find that PAT proteins cover only a minority of the LD surface, consistent with models in which they primarily serve as scaffolds for binding of regulatory proteins and enzymes, but inconsistent with models in which their major function is to sterically block access to the droplet surface.
Keywords
Introduction
Lipid droplets (LDs) are the primary storage organelle for triglycerides (TGs) and cholesterol esters (CEs) in eukaryotic cells (reviewed in Fujimoto and Parton, 1 and Thiam et al. 2 ). Storage of lipids in LDs, and removal from LDs are tightly regulated by numerous pathways. Lipid storage is accelerated upon acquisition of fatty acids or cholesterol in excess of cellular needs, and also by activating signaling pathways that favor nutrient storage (e.g., upon treatment with insulin). Lipids are removed from LDs upon cellular starvation and also by activation of signaling pathways indicating increased need for metabolic precursors or energy (e.g., activation of lipolytic enzymes by cAMP). There are many pathways and enzymes involved, and not all are well understood. However, the Perilipin-Adipocyte-Tail [PAT] interacting protein of 47 kDa family of proteins, found on the LD surface, clearly plays an important role in coordinating these processes.
Mathematical modeling, combined with quantitative light microscopy, 3 has assisted in the understanding of other complex systems, including the secretory pathway,4,5 trafficking of proteins within the nucleus, 6 and analysis of signaling pathways. 3 Quantitative analysis of pathways implicated in lipid storage or removal of lipids would be facilitated by the ability to quantify the mass of lipid in LDs. This is difficult to do on a single-cell basis. In contrast, quantitative light microscopic analysis of intracellular transport of proteins is aided by the use of in vivo fluorescent tagging techniques, including the widespread use of tags consisting of green fluorescent protein (GFP). Accurate quantitation of GFP is routine, and with some care, it is even possible to estimate the number of molecules in a particular compartment of interest. 7 However, light microscopic quantitation of LDs currently requires that the major proportion of lipid is stored in large and well-separated LDs. This is feasible when the LDs are large enough their diameter can be directly measured from the microscope image, such as in adipocytes, which contain one very large LD, 8 and in cell types that contain a small number of large and well-separated LDs. 9 These approaches fail when cells contain poorly resolved LDs (e.g., when they are small or crowded together), leaving no viable light microscopic approach for estimating LD mass in the majority of cell types. 10
A potential application for measurement of LD volume would be to determine the density of PAT proteins on the LD surface. This is important because there is evidence that PAT proteins regulate both removal and storage of LD lipids. The PAT protein family is named after the first three members of this family to be discovered: Perilipin A (PLIN1A), adipocyte differentiation–related protein (ADRP), and tail interacting protein of 47 kDa (Tip47). PAT proteins function, in part, as scaffolds to recruit cytoplasmic proteins, including the lipolytic enzymes Hormone Sensitive Lipase (HSL) and Adipose Triglyceride Lipase (ATGL), to the LD surface in a regulated manner.11,12 In one well-characterized example of regulation of lipid hydrolysis, phosphorylation of HSL and PLIN1A by protein kinase A leads to binding of cytoplasmic HSL to LD-associated PLIN1A. This leads to localization of activated HSL to LD membranes and consequent hydrolysis of TGs and release of free fatty acid. 13 However, paradoxically, overexpression of PAT proteins increases total intracellular lipid storage, but the mechanisms are currently unclear. One model has been proposed in which PAT proteins play a barrier role in which they form a high-density coat that sterically blocks binding of hydrolytic enzymes when catabolic pathways are not activated. 14 This model predicts that enhancement of lipid storage by PAT proteins requires that they cover a large portion of the LD surface, functioning as a structural component analogous to the role of apolipoproteins in lipoprotein particles. Alternatively, PAT proteins could modulate lipid storage via other mechanisms including undiscovered signaling roles or signaling roles already supported by direct experimental evidence, 15 or as a looser “dynamic scaffold” 14 that does not physically restrict access to the full LD surface. Roles that do not require formation of a physical barrier could require lower densities of PAT protein on the cell surface. The enhancement in lipid storage upon increased PAT protein expression 14 would then result from activation of (perhaps uncharacterized) signal transduction pathways or modulation of PAT-interacting proteins. Because most LDs are approximately spherical, these models could be differentiated by measuring the density of PAT protein molecules on the LD surface. This requires both estimating the number of PAT protein molecules on an individual LD, and determining the surface area of the LD.
In this study, we describe and validate a new two-step methodology to estimate LD volume in tissue culture cells using fluorescence microscopy and digital image analysis. In this methodology, we take advantage of the fact that LDs can be homogeneously stained with hydrophobic fluorescent dyes that partition uniformly from the aqueous phase surrounding the LD. A novel aspect of our strategy utilizes this fact to determine a calibration factor that relates volume to fluorescence from automated image analysis of samples specially prepared to contain large LDs. The total volume of LDs in experimental samples in which LDs are not necessarily large or well-resolved can then be determined from measuring fluorescence of LD-associated dyes and dividing this value by the calibration factor. The same method can additionally be used to identify and determine the volume of individual well-resolved LDs in the experimental cells.
Using this method in combination with existing methodologies that can determine the number of GFP molecules on intracellular structures, we estimate the volume and surface area of LDs associated with GFP-tagged PAT proteins in transfected HeLa cells. Using existing methodologies to determine the number of tagged molecules on the LD, we estimate the density of GFP-tagged PAT proteins on the surface of these LDs. We conclude that GFP-tagged PAT proteins significantly increase total LD volume in transfected HeLa cells at densities of 100–400 molecules GFP per µm2 on the LD surface. This is a surprisingly low density, and suggests PAT proteins need occupy only a small proportion of available surface area on the LD surface to exert biological effects.
Materials and Methods
Reagents
Nile Red, Bodipy 493/503, and paraformaldehyde were obtained from Sigma-Aldrich (Oakville, Ontario, Canada). High-content screening (HCS) LipidTOX Red was obtained from Molecular Probes (Eugene, OR). Oleic acid (OA) was obtained from Calbiochem (La Jolla, CA). Also, 1,6-diphenyl-1,3,5-hexatriene (DPH) was obtained from Thermo-Fisher Scientific (Waltham, MA). Unless otherwise stated, reagents were obtained from Sigma-Aldrich.
Cell Culture, LD Induction, and Staining
HeLa and HepG2 cells obtained from the American Type Culture Collection (Manassas, VA) were grown as described 16 in DMEM supplemented with 10% fetal calf serum, 2 mM glutamine, 150 mg/ml penicillin, and 100 U/ml streptomycin (Invitrogen; Burlington, Ontario, Canada). Cells were grown in an incubator at 37C with 5% CO2. HeLa and HepG2 cells were grown in MatTek dishes (MatTek Corp.; Ashland, MD) for imaging. Unless otherwise stated, LD formation was induced by adding OA dissolved in ethanol (100 mM) as described in Martin and Parton 17 to give a final concentration of 100 µM in media (1:1000). For combination loading, palmitic acid (PA) was also prepared as a 100 mM stock in ethanol and diluted into media to give a 60 µM final concentration. OA stock solution was then added to the medium to give a 40 µM concentration of OA. Usage of less OA in combination with PA resulted in failure to form large LDs and extensive cell death as reported previously by others.18,19 Cholesterol loading was done using a cyclodextrin conjugate essentially as described in Hsieh et al. 20 for a final concentration of 40 µM cholesterol. Cells were fixed at the indicated times after lipid addition in 4% formaldehyde/PBS (pH 7.2) for 10 min. Cells were then washed with PBS, and stored at 4C immersed in PBS. Before imaging, cells were stained with the indicated dyes to visualize LDs. Nile Red was dissolved in DMSO and stored as a 1 mg/ml stock. The Nile Red stock solution was diluted in PBS to a final concentration of 100 ng/ml Nile Red. Bodipy 493/503 was prepared as a 1 mg/ml stock in DMSO, and diluted in PBS immediately before staining to a final concentration of 1 µg/ml. DPH was stored as a 1 mg/ml stock in DMSO, and diluted in PBS immediately before staining to a final concentration of 2 µg/ml. HCS LipidTOX Red solution from the manufacturer was diluted directly in PBS at a ratio of 1:10,000 (1 µl/10 ml PBS). Cells in MatTek dishes were stained after fixation by addition of 2 ml solution of dye in PBS. To reduce the effects of temperature variation on staining efficiency, we incubated the fixed cells in staining solution for 30 min at 37C. They were then immediately transferred to 4C for storage and warmed to room temperature 10–15 min before transfer to the microscope for image acquisition.
PAT Protein Creation and Transfection
Tip47-GFP was a kind gift from Nat Wolins (Washington University; St. Louis, MO). Human ADRP (accession #NM_001122.3) was obtained from GE Dharmacon Open Biosystems (Lafayette, CO), cloned into the EcoRI and SacII sites of the Clontech enhanced green fluorescent protein (EGFP)-N1 vector using the primers GATCAGAATTCGCCACCATGGCATCCGTTGCAGTTGATCC and GATCACCGCGGTCCACCTCCATGAGTTTTATGCTCAGATC. Mus musculus Perilipin 1 (accession #BC025137) was obtained from GE Dharmacon and cloned into the BglII and KpnI sites of the Clontech EGFP-N1 vector using the primers GATCAAGATCTGCCACCATGTCAATGAACAAGGGC and GATCAGGTACCGATCCACCTCCGCTCTTCTTGCGCAGCTGG.
Plasmid DNA was purified using kits from Qiagen (Hilden, Germany) and transfected into HeLa or HepG2 cells using FuGene HD reagent (Promega; Madison, WI) according to manufacturer’s instructions.
Image Acquisition
Unless otherwise stated, image z-stacks were taken using a Zeiss LSM510 confocal microscope (Zeiss; Toronto, Ontario, Canada) using a numerical aperture (NA) 1.4 63× Plan-Apochromat oil immersion objective lens, and a pixel size of 0.1 µm. Nile Red was visualized using the 543 nm line of a He-Ne laser, and a 560–615 nm bandpass filter. Bodipy 493/503 was visualized using the 488 nm line of an Argon laser and a bandpass (BP) 505–530 nm emission filter. The pinhole was set for a slice thickness of 1 µm, with an interval between slices of 0.5 µm, and a total thickness for the z-stack accounting for all fluorescence within the cell. Line averaging of 4–8× was used to minimize noise that could interfere with the analysis. Images were exported as 12-bit tagged information file format (TIFF) using the microscope software. For the datasets analyzed in Figs. 6 and 7, images were acquired with a Quorum WaveFX spinning disk confocal system on a Leica DMI6000B inverted microscope, equipped with a Hamamatsu EM-CCD camera. Images were acquired from cells stained with HCS LipidTOX Red with a 63× NA 1.4 objective or a 100× NA 1.4 objective (Leica Microsystems; Concord, Ontario, Canada). HCS LipidTOX Red was visualized using a 561 nm line from a diode laser and a 624/40 nm bandpass filter. EGFP was visualized using the 491 nm line from a diode laser and a 520/35 nm bandpass filter.
For analysis, TIFF images were converted to portable gray map (PGM) or portable pixmap (PPM) using the program convert in the open-source ImageMagick package, or using ImageJ, which also supports these formats. PGM (for grayscale) and PPM (for color images) are simple formats specialized for ease of reading of image data by computer programs. 21 PGM and PPM files contain a simple American Standard Code for Information Interchange (ASCII) header containing the maximum pixel value allowed, and the x and y size of the images in pixels followed by the image data. In PPM images, each pixel is a triplet of red, green, and blue values, whereas in PGM images, each pixel has a single value. Further image processing for the purpose of determining LD volume is described in other sections of the “Materials and Methods,” in the “Results,” and in Supplemental Methods.
Determination of Number of GFP Molecules Associated With LDs
The number of GFP molecules per cell was estimated using the procedure described in Piston et al. 7 A 6-His-EGFP standard was purified using nickel columns (Thermo-Fisher; Burlington, Ontario, Canada). Protein concentration of the standard was determined using the BioRad assay (Thermo-Fisher). A drop of the standard was then placed on a MatTek chamber, and confocal slices acquired within 5 µm of the coverglass using settings identical to those used for acquisition of EGFP fluorescence from cells. Fluorescence was then background-corrected by subtracting a similar measurement from a confocal slice in a blank consisting of PBS. This allowed converting measurements of fluorescence intensity from the experimental cells into concentrations expressed as number of molecules/voxel under the z-sectioning conditions used as described in Piston et al. 7 Number of GFP molecules in a cell could be determined by integrating the concentration over the cell volume. 7 To determine the number of molecules associated with single LDs (Fig. 7), circular isolated LDs were selected by the same algorithm used to select LDs for calibration. A mask image was then made in which the boundaries of the circular isolated LDs were expanded by 2 pixels (200 nm), and total fluorescence associated with the expanded LD in the green channel was summed and converted to number of molecules. Surface area in square microns was determined from the volume of the LD (determined from HCS LipidTOX Red fluorescence as described in the main text) by first determining the radius (r; r = (3/(4π) V))1/3) and then determining the surface area through the formula 4πr2. Molecular density was then determined separately for each circular LD in the image by dividing the number of molecules of GFP associated with the LD by the surface area calculated for that LD.
Fluorescence Resonant Energy Transfer (FRET)
We used the acceptor photobleach FRET method 22 to determine if there was significant loss of fluorescence from EGFP-tagged PAT proteins to HCS LipidTOX Red that could impact our estimate of number of molecules of PAT protein per LD (Supplemental Fig. 1). HeLa cells in MatTek chambers were transfected with EGFP-tagged PAT proteins for 24 hr and then loaded with OA at 100 µM in media for 24 hr as described above before fixation. Cells were then stained with HCS LipidTOX Red and imaged on a Leica SP8 confocal microscope. A series of 8 images were taken using illumination with the 552 nm laser line (HCS LipidTOX Red) and 488 nm laser line (EGFP). HCS LipidTOX Red in a region of interest including LDs was bleached between images 4 and 5 using the 552 nm laser line at maximum intensity. The value of EGFP fluorescence in the region of interest was measured in image 4 (EGFPprebleach) and image 5 (EGFPpostbleach) using the ImageJ program. The ratio EGFPpostbleach/EGFPprebleach was calculated, and values in excess of 1.0 indicated potential FRET. The remainder of the images in the sequence were controls for focus drift.
Software and Image Analysis
Before analysis, z-stacks of confocal images were converted to PGM format and then projected and background-corrected using the project program described previously. 10 Projection and background correction were not performed on simulated images. Two programs, calibrate_volume and sum_volume, were written in the D programming language 23 and designed to be run from a Unix command line. These programs were compiled using the freely available dmd compiler 23 and run using the command-line interface under Mac OS 10.6.8 (Snow Leopard). They should be compilable under most Unix-based systems.
The program calibrate_volume is used to determine the relationship between measured fluorescence and LD volume through identification of large, circular LDs to serve as calibration standards. The program calibrate_volume takes one or more images as input. It then identifies circular LDs (<15% deviation of LD perimeter from best-fit circle) using the algorithm described in detail in our previous work. 10 This algorithm thresholds each candidate droplet locally at 50% of the brightness of its brightest pixel. The circle is fit to the boundary pixels (the adjacent fluorescent and non-fluorescent pixels) after thresholding as previously described. For a circular object, the best-fit circle will enclose approximately the region within the Full Width Half Maximum (FWHM). This measured radius is divided by 0.866 to estimate the actual radius before processing. This correction is to account for the difference between the FWHM and the actual diameter of the LD. The calculation and rationale is explained in detail in Supplemental Methods. The program then quantitates fluorescence for each candidate droplet fitting the criterion for circularity. Except for Fig. 1, LDs with a measured radius <4 pixels were excluded from the analysis. This program outputs the result as a comma-delimited text file suitable for import by any standard spreadsheet or graphing programs. To obtain calibration values, and make calibration plots, this output file was loaded into KaleidaGraph (Synergy software), volume was plotted against fluorescence, and the calibration value calculated as the slope of the best-fit line determined by linear regression. An additional program, sum_volume, was used in the analyses in Figs. 4–6. This program takes as input an image and a previously calculated fluorescence/volume calibration value determined as above. It then identifies objects by first applying a global threshold of 10% of the brightest value in the image. This is followed by iterative thresholding of each identified object to a fixed fraction of its brightest point, first 10% of the brightest point, and repeating in 10% steps to 50%, so that the boundary of each object is its FWHM, identically to calibrate_volume. 24 However, sum_volume does not test if the detected objects are circular. The fluorescence values are then converted by sum_volume to estimated volumes, normally in units of cubic microns, by dividing by the user-input calibration value (computed previously as described above). The program also calculates an ad hoc approximate correction for fluorescence trimmed from non-circular objects. It basically replaces the non-circular object by a uniform grid of LDs having the same fluorescence, and calculates the fluorescence that would have been trimmed from such a uniform grid by FWHM thresholding. The actual loss of fluorescence by thresholding is likely to be greater, because the actual non-resolved LDs may not be uniform in size, and trimming by thresholding will in fact be larger than predicted. The correction method, thus, may undercorrect but is biased against an overcorrection. The procedure involves the following steps: (1) An average thickness is calculated for the non-circular fluorescent object using the input calibration value, which relates the total fluorescence of the object to its volume, to compute the volume. The thickness the volume would have if spread uniformly over the area of the object it occupies is calculated by dividing the volume by the area that the pixels representing the object occupy; (2) The object is assumed to be made of a grid of packed LDs of identical size with the same mean calculated thickness as the object; (3) After thresholding, the object is assumed to have lost along its edges a margin of the same width as the distance from the FWHM of the calculated size of one of the identical LDs to the edge of the droplet. That is, a radius r1, which is assumed to be the radius before processing of the uniformly sized LDs, is calculated by multiplying the diameter calculated in step 2 by 0.5. A second radius r2, which represents the expected radius after local thresholding, is calculated as r1 × 0.866 as described in Supplemental Methods. The margin width is determined as r1–r2. This margin width is converted to units of pixels, and a linear ramp of fluorescence is applied to the edge of the structure, and adjacent pixels outside the structure “filled in” as follows: First, the value at the edge of the object is set to the mean fluorescence of the object (fm), then, the value at a distance from the object of the margin width is set to 0, and finally, pixel values in between are determined by linear interpolation between fm and 0. The program produces as output a text file containing both the raw values for volume and values for volume that have been corrected using the ad hoc procedure. A simple program to manually identify cells (CellOutline) using a graphical user interface was written in Objective C/Cocoa and compiled using Xcode (Apple Computer; Cupertino, CA). A Ruby script was written to assign objects quantitated by sum_volume to individual cells and to sum the total volume for each cell. Both uncorrected output and output to which the ad hoc correction has been applied are written, and both values are available to the user after each run.
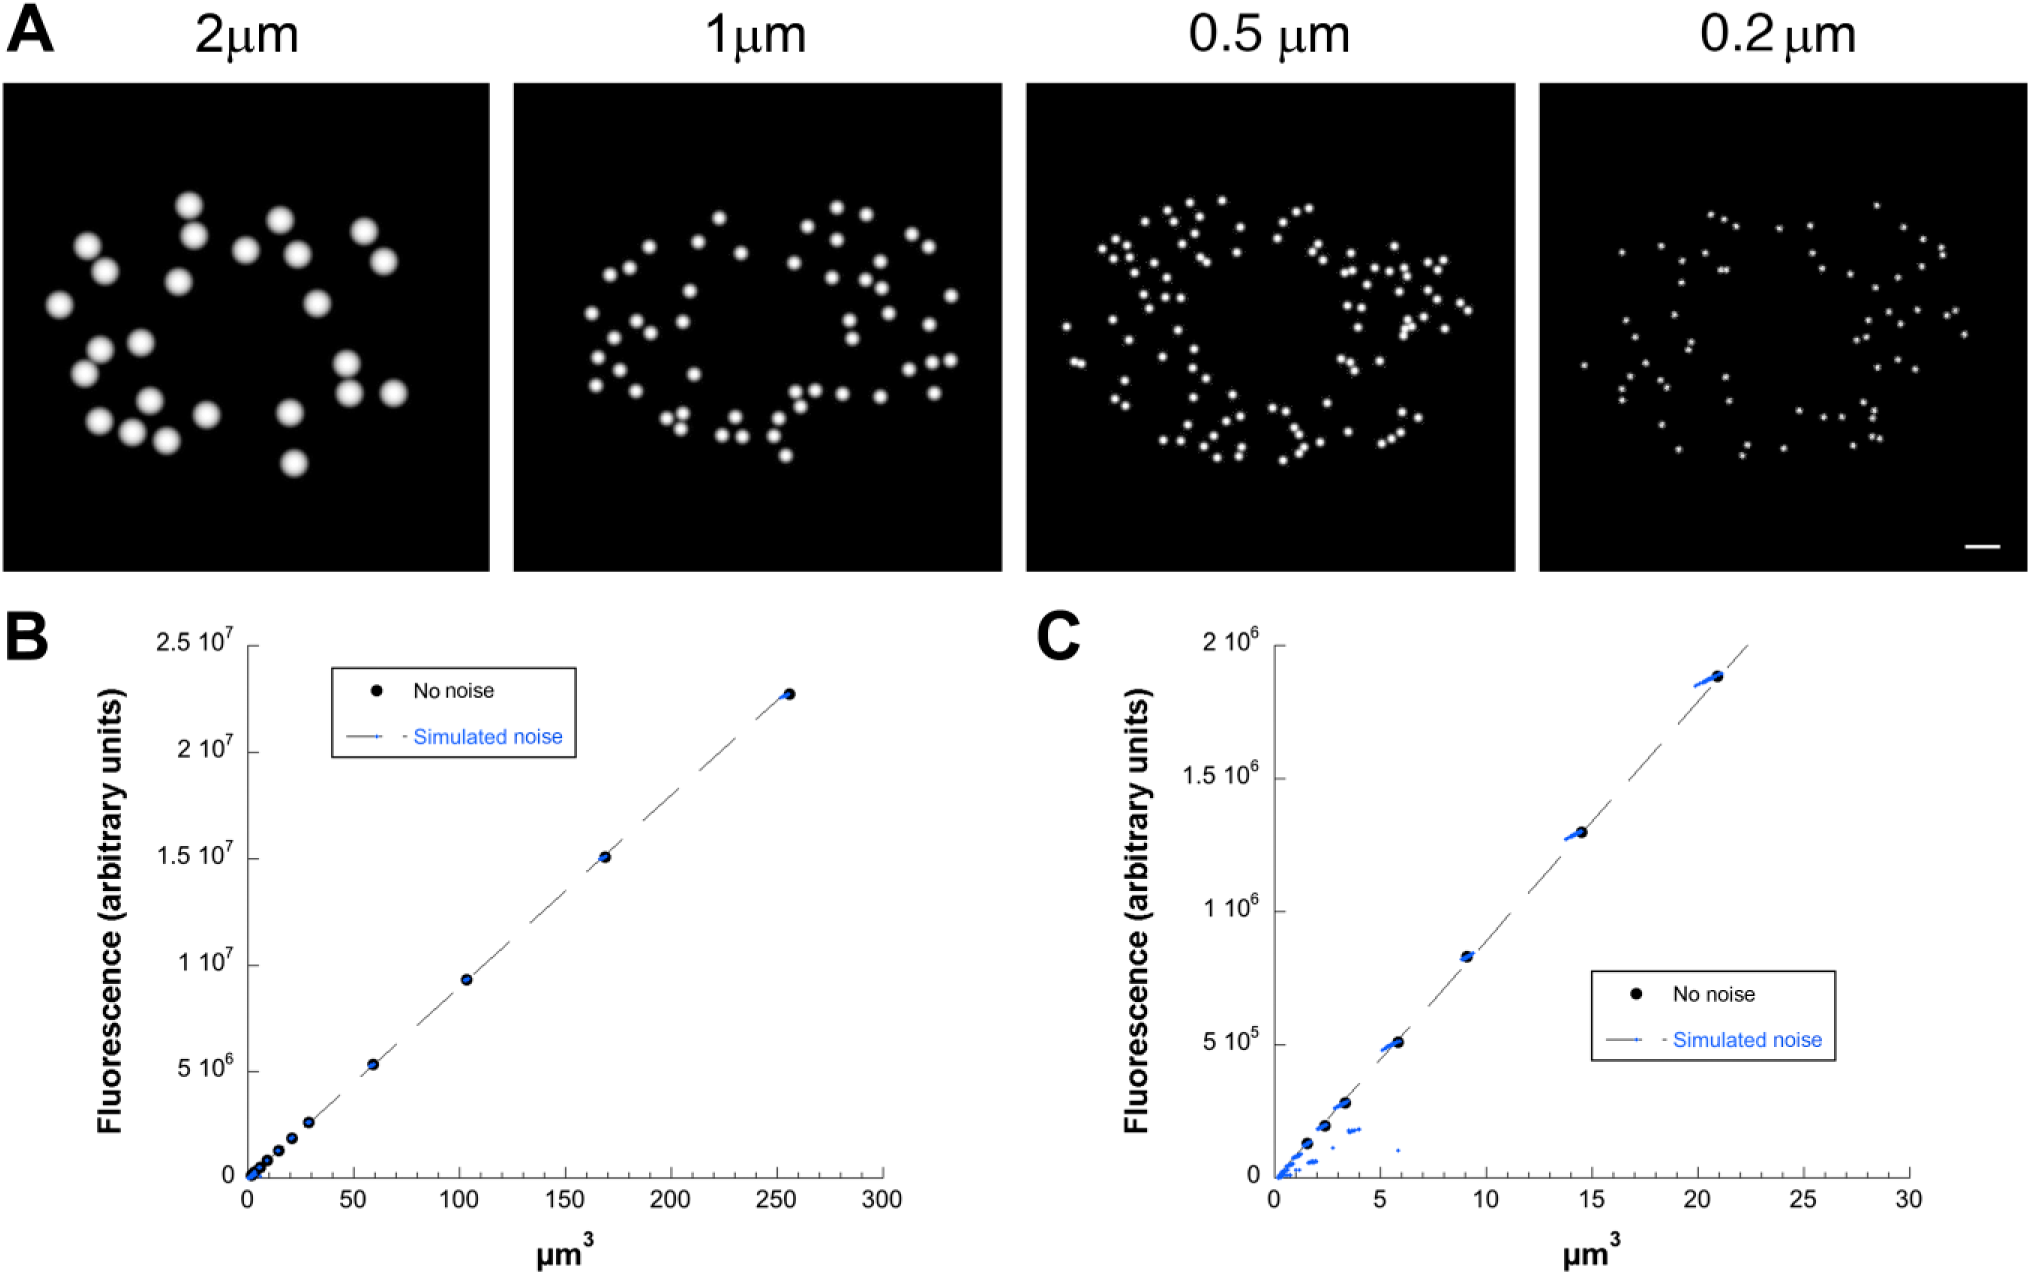
Strategy for calibration of LD volume/fluorescence ratio applied to simulated images. (A) Simulated images created as described in the “Materials and Methods” section. LDs of the indicated size (10 pixels/simulated µm) were placed randomly within an ellipse representing a cell and constrained to not overlap. A central circular region was excluded to represent the nucleus. Noise was then added to images and a Gaussian blur applied as described in the “Materials and Methods” section. Representatives of a range of sizes are shown, taken from a series of images with simulated LD radius ranging from 0.2 µm (2 pixels) to 4 µm (40 pixels) with five images synthesized for each size. For display purposes, all images are scaled to use a full range of grayscales, as otherwise small LDs would be faint or invisible. Images were analyzed as generated without rescaling. Bar = 50 pixels. (B) Plot of fluorescence against volume using the entire image set as input for the calibrate_volume program. “No Noise” points represent control images in which noise was not added, that is, all LDs within the image are identical. Note that relationship between volume and fluorescence is linear over most of the range, and that simulated noise has little effect. Values are slightly below the true values calculated using the input radii due to the FWHM clip. (C) Enlargement of B showing that at low LD volume, degradative effects of the applied noise and Gaussian blur are apparent. Abbreviations: LD, lipid droplet; FWHM, Full Width Half Maximum.
Statistical Analysis
Significance was assessed using a Student t-test assuming unequal variance for experiments including only two samples. In experiments containing three or more samples, significance was assessed using ANOVA with a Bonferroni post hoc test.
Code Availability
Source code for these programs as well as further documentation can be found at https://github.com/jfpresley2/sy-dejgaard-lipid-droplet-volume. Program code is written in D, C, and Ruby. The CellOutline program is written in Objective C/Cocoa; hence, it can only be compiled on a system running Mac OS X. Because the function of CellOutline is to allow user input of cell outlines, and conversion of these cell outlines into a simple text format, this program can be easily substituted with a user-written alternative on other systems. An alternative to CellOutline written in HTML/JavaScript is also supplied, which can be run using any HTML5-compliant web browser. Code for all programs used in this study are freely available under the terms of the GNU General Public License.
Results
Strategy for Calibration of Relation Between LD Fluorescence and Volume
As an initial step to create and validate a procedure for estimating LD volume from measurements made in calibration images, we created simulated images in which spherical simulated LDs were projected and subjected to a Gaussian blur with an SD of 2.576 pixels to simulate blurring by the microscope of a confocal image with pixel size of 0.1 µm taken with an NA 1.4 objective, and then subjected to simulated image noise exactly as described for simulated images in Dejgaard and Presley. 10 Representative images are shown in Fig. 1A. We then processed the images with the calibrate_volume program (see the “Materials and Methods” section), which calculated the volumes as described in the “Materials and Methods” section, and plotted the results. We found that the volume/fluorescence ratio could be well-fitted by linear regression (Fig. 1B) so long as the simulated LDs did not approach the resolution limit too closely (<4 pixel or 0.4 simulated µm diameter; Fig. 1C). Thus, simulated LDs over a physiologically plausible size range showed a linear relationship between measured size and measured brightness. A computationally expensive direct fit to the two-dimensional projected LD images was not required.
Calibration Measurements in Stained Cells Tested Using Multiple Dyes
To further validate that our calibration method resulted in a linear relationship between volume and fluorescence over a reasonable range, we loaded HeLa cells (Fig. 2A) and HepG2 cells (Fig. 2C) with OA (100 µM) for 48 hr, conditions that we found reliably produced a subset of large LDs that appeared suitable as calibration standards. We stained loaded cells with DPH, Nile Red, HCS LipidTOX Red, or Bodipy 493/503 and acquired complete confocal z-stacks as described in the “Materials and Methods” section. Z-stacks were then projected by summation as described in the “Materials and Methods” section to obtain images suitable for quantitative analysis. Z-series were initially acquired twice for each dye under standard conditions and brightness compared with control for potential adverse effects of photobleaching on the quantitative analysis. The two z-stacks should be equal in brightness. If the second z-series shows reduced fluorescence intensity, this indicates photobleaching during image acquisition. We found that DPH showed substantial (>30%) photobleaching during z-series acquisition, while we found no detectable photobleaching for Nile Red, HCS LipidTOX Red, or Bodipy under our imaging conditions. Therefore, we excluded DPH from further analysis.

Creation of volume/fluorescence calibration curves using the calibrate_volume program on images from cells. (A) (left) Representative projected z-stack obtained from HeLa cells loaded with 100 µM OA for 48 hr and stained with Bodipy 493/503. The staining and image acquisition procedures are described in detail in the “Materials and Methods” section. (A) (right) Same image after processing by the calibrate_volume program. LDs considered circular by the program are identified by green circles. (B) Calibration graph obtained from the image shown in (A) in which the volume calculated by the calibrate_volume program is plotted against measured fluorescence. Plotted line shows a least-squares linear regression fit. (C) (left) Representative projected z-stack of HepG2 cells loaded, stained, and imaged as described for HeLa cells in (A). (C) (right) Same image after processing by the calibrate_volume program. LDs considered circular by the program are identified by green circles. (D) Calibration graph produced by analysis of the image in (C) by the calibrate_volume program. Line shows least-squares linear regression fit. Scale bar = 5 µm. Abbreviations: OA, oleic acid; LDs, lipid droplets.
For each remaining dye (Nile Red, Bodipy 493/503, HCS LipidTOX Red), we obtained five calibration images each from triplicate dishes stained together (15 images total) and processed them to identify circular LD profiles. Our software calculated for each profile both the volume and the total integrated fluorescence, as previously described for Fig. 1. Sample calibration data obtained from the frames shown are illustrated in Fig. 2B (HeLa) and Fig. 2D (HepG2). Bodipy (shown), HCS LipidTox Red, and Nile Red showed a large range over which the volume/fluorescence relationship was linear, suggesting that our approach was viable for a range of dyes. As expected, at the low end of measured volumes (LD radius <0.2 µm), the relationship between volume and fluorescence was weak. Large LDs could potentially have their fluorescence altered by various factors not testable in our simulations including inner filter effects, 25 physical distortion of shape, or optical effects resulting from the change in refractive index. 26 However, the fluorescence/volume relationship was generally linear up to at least 10 µm3. Larger LDs were rare in HepG2 and HeLa cells under the loading conditions used (see Fig. 2C). Thus, in these cells, LDs of interest were generally within the linear range.
Effect of LD Composition on Volume Calibration
The samples just described were labeled uniformly with similar concentrations of a single lipid species (OA). However, LDs may have different compositions depending on experimental conditions,17,19,27 and have been reported to have different compositions within the same cell. 20 LDs can contain TGs or CEs. TGs can be created by the conjugation of glycerol to various mixtures of saturated or unsaturated fatty acids.
To determine the effect of LD composition on the fluorescence/volume ratio, HeLa cells were loaded with cholesterol/cyclodextrin (40 µM cholesterol), with OA (100 µM), or with a mixture of PA (60 µM) and OA (40 µM; PA + OA). They were then stained with Nile Red (Fig. 3A) or Bodipy 493/505 (Fig. 3B). For each dye, samples were processed together as a set, that is, the staining and image acquisition for the different lipid loading conditions were carried out together to ensure consistent treatment. HeLa cells were used because they contain very few LDs in the absence of intentional lipid loading. Thus, the LD composition is likely to be strongly influenced by the loading material.
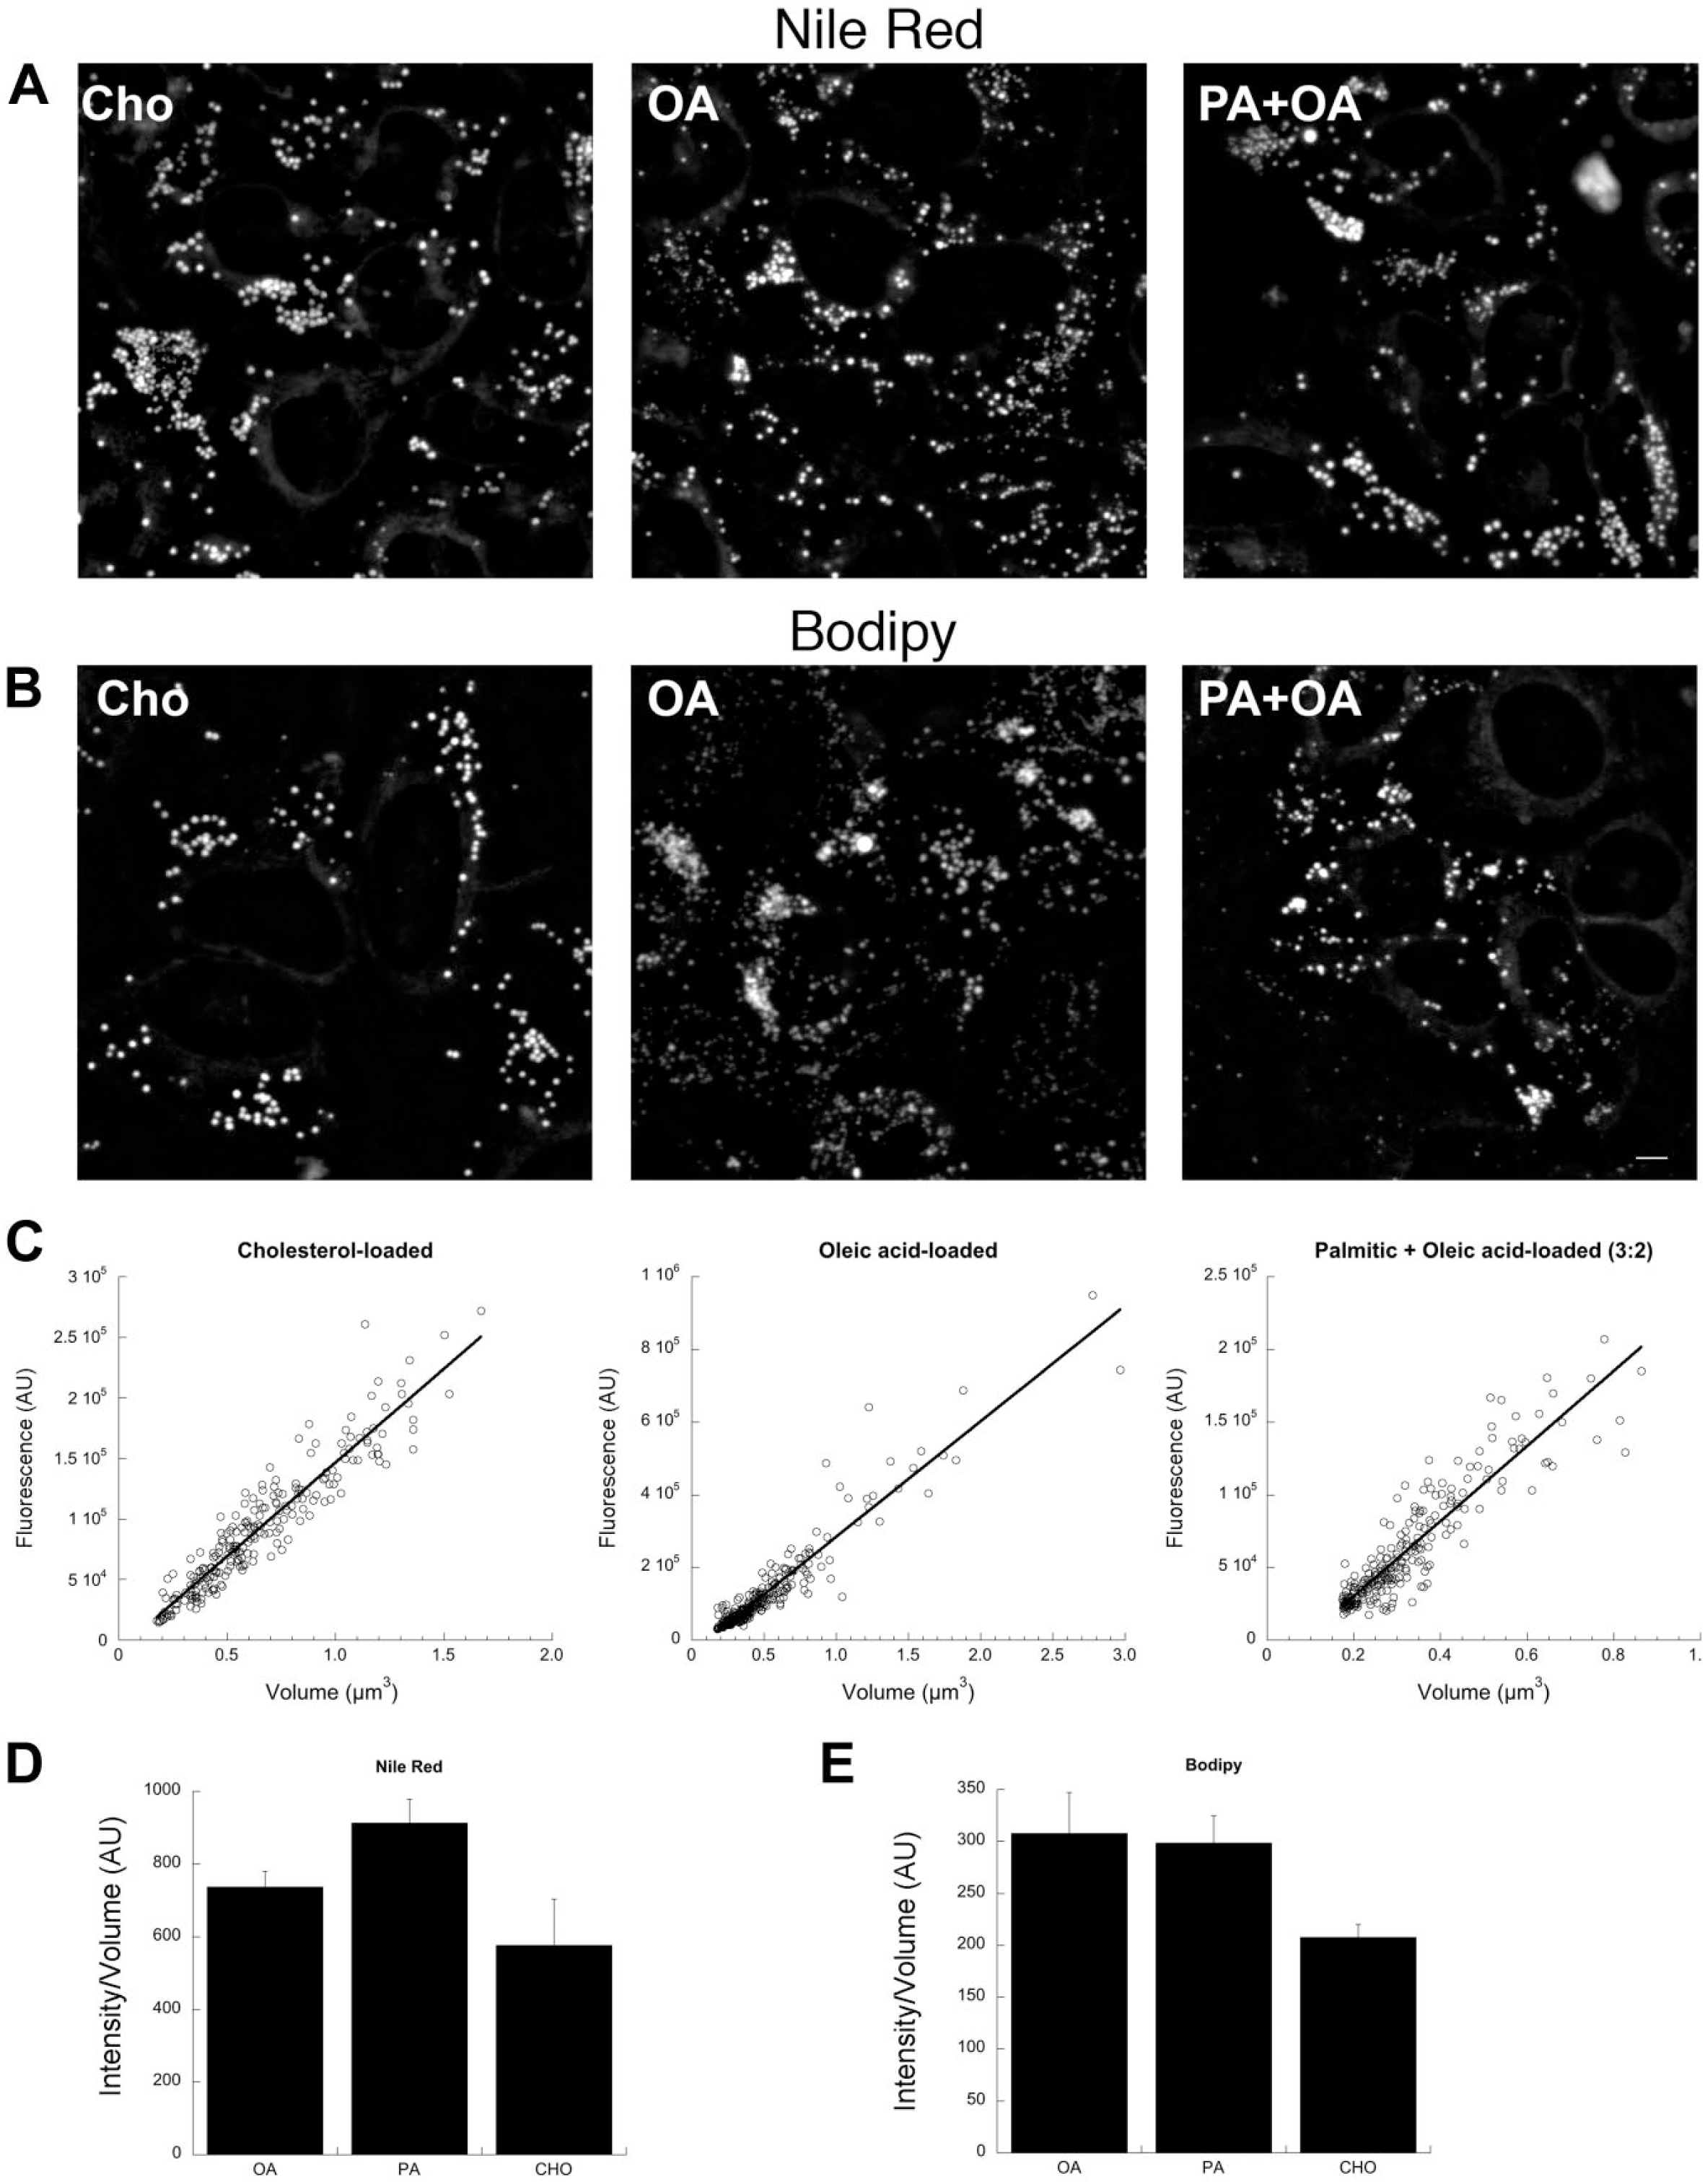
Effect of LD composition on the fluorescence density of LD staining. (A) Projected z-stacks showing HeLa cells loaded for 24 hr with 50 µM cholesterol (left), 100 µM OA (middle), or 60 µM PA + 40 µM OA (right) and stained with Nile Red. (B) Projected z-stacks showing HeLa cells loaded for 24 hr with 50 µM cholesterol (left), 100 µM OA (middle), or 60 µM PA + 40 µM OA (right) and stained with Bodipy 493/503. (C) Calibration plots created from the Bodipy 493/503 images shown in (B) using the calibrate_volume program. (D) Mean calibration values obtained from averaging least-squares fits from multiple image acquisitions from cells loaded as in (A) with the indicated lipids and stained with Nile Red. Each bar shows an average from three dishes (five fields/dish) ± SD. (E) Mean calibration values obtained from averaging least-squares fits from multiple image acquisitions from cells loaded as in (A) with the indicated lipids and stained with Bodipy 493/503. Each bar shows an average from three dishes (five fields/dish) ± SD. Scale bar = 5 µm. Abbreviations: LD, lipid droplet; OA, oleic acid; PA, palmitic acid.
Calibration plots were generated, plotting fluorescence versus volume of circular LDs for stained cells. We used a linear least-squares fit to determine the slope (volume/fluorescence) for each of the three lipid loadings in Bodipy stained cells (see Fig. 3C) for representative fits for each loading condition. Each graph in Fig. 3C was determined from analysis of a single field. Slope was similarly determined for Nile Red-stained cells with each of the three lipid loadings (not shown). For each experimental condition, the volume/fluorescence relationship was determined separately from five fields from three separate dishes (i.e., 15 values per condition) using the calibrate_volume program and the procedure described in the “Materials and Methods” section. Averages and SDs are shown for the volume/fluorescence relationships determined for the indicated lipid loadings for Nile Red (Fig. 3D) and for Bodipy 493/503 (Fig. 3E). Small (Nile Red) or no difference (Bodipy 493/503) were found between OA and OA + PA loading. These differences were not statistically significant. However, in cholesterol-loaded cells, a slight but statistically significant reduction in staining compared with OA + PA loading was found when cells were stained with Nile Red (Fig. 3D; p=0.0097) or Bodipy 493/503 (Fig. 3E; p=0.0235; Cholesterol vs. OA, p=0.0147). These results suggest that large variations in LD composition can measurably influence staining density. Thus, for optimal accuracy, calibration samples should be matched in composition to experimental samples when possible.
Effect of LD Crowding on Estimation of LD Volume in Simulated Images
The preceding work establishes a procedure for estimating the LD volume/fluorescence ratio from circular LDs measured in calibration samples.
However, if experimental images were processed using the same procedures as the calibration images, measurement of fluorescence could be affected by preprocessing. In particular, the procedure for local thresholding of objects to their FWHM assumes they are projections of single spheres, which should have a single fluorescence peak. Clusters of unresolved LDs would have more complicated distributions of fluorescence, and therefore local thresholding could potentially introduce errors to the volume measurement.
To estimate empirically the magnitude of the effect of random LD distribution and LD crowding on measurement of fluorescence and estimation of volume, we created simulated images in which an elliptical zone simulating a cell was filled to various degrees with simulated LDs of known volume (Fig. 4). In one set of simulations (Fig. 4A), LDs were added to various densities from 5% to 95% in 5% increments, expressed as total area of LD projections as a percentage of total available cell area, with LDs allowed to overlap no more than 20%. In a second set of otherwise identical simulations (Fig. 4B), the LDs were located completely at random to simulate a projection image of a highly three-dimensional cell. In both simulations, the mean radius (r) of the LDs was 5 pixels (0.5 simulated µm) with an SD of 0.4r to produce a wide variety of LD sizes. The relationship between fluorescence and volume of the synthetic LDs and volume was set at 100 fluorescent units/pixel3. We determined a value of 89.66 fluorescence units/pixel3 from the slope of a calibration curve derived from simulated images by linear regression (Fig. 4C), which was reasonably close to the true (input) value (100 fluorescent units/pixel3).
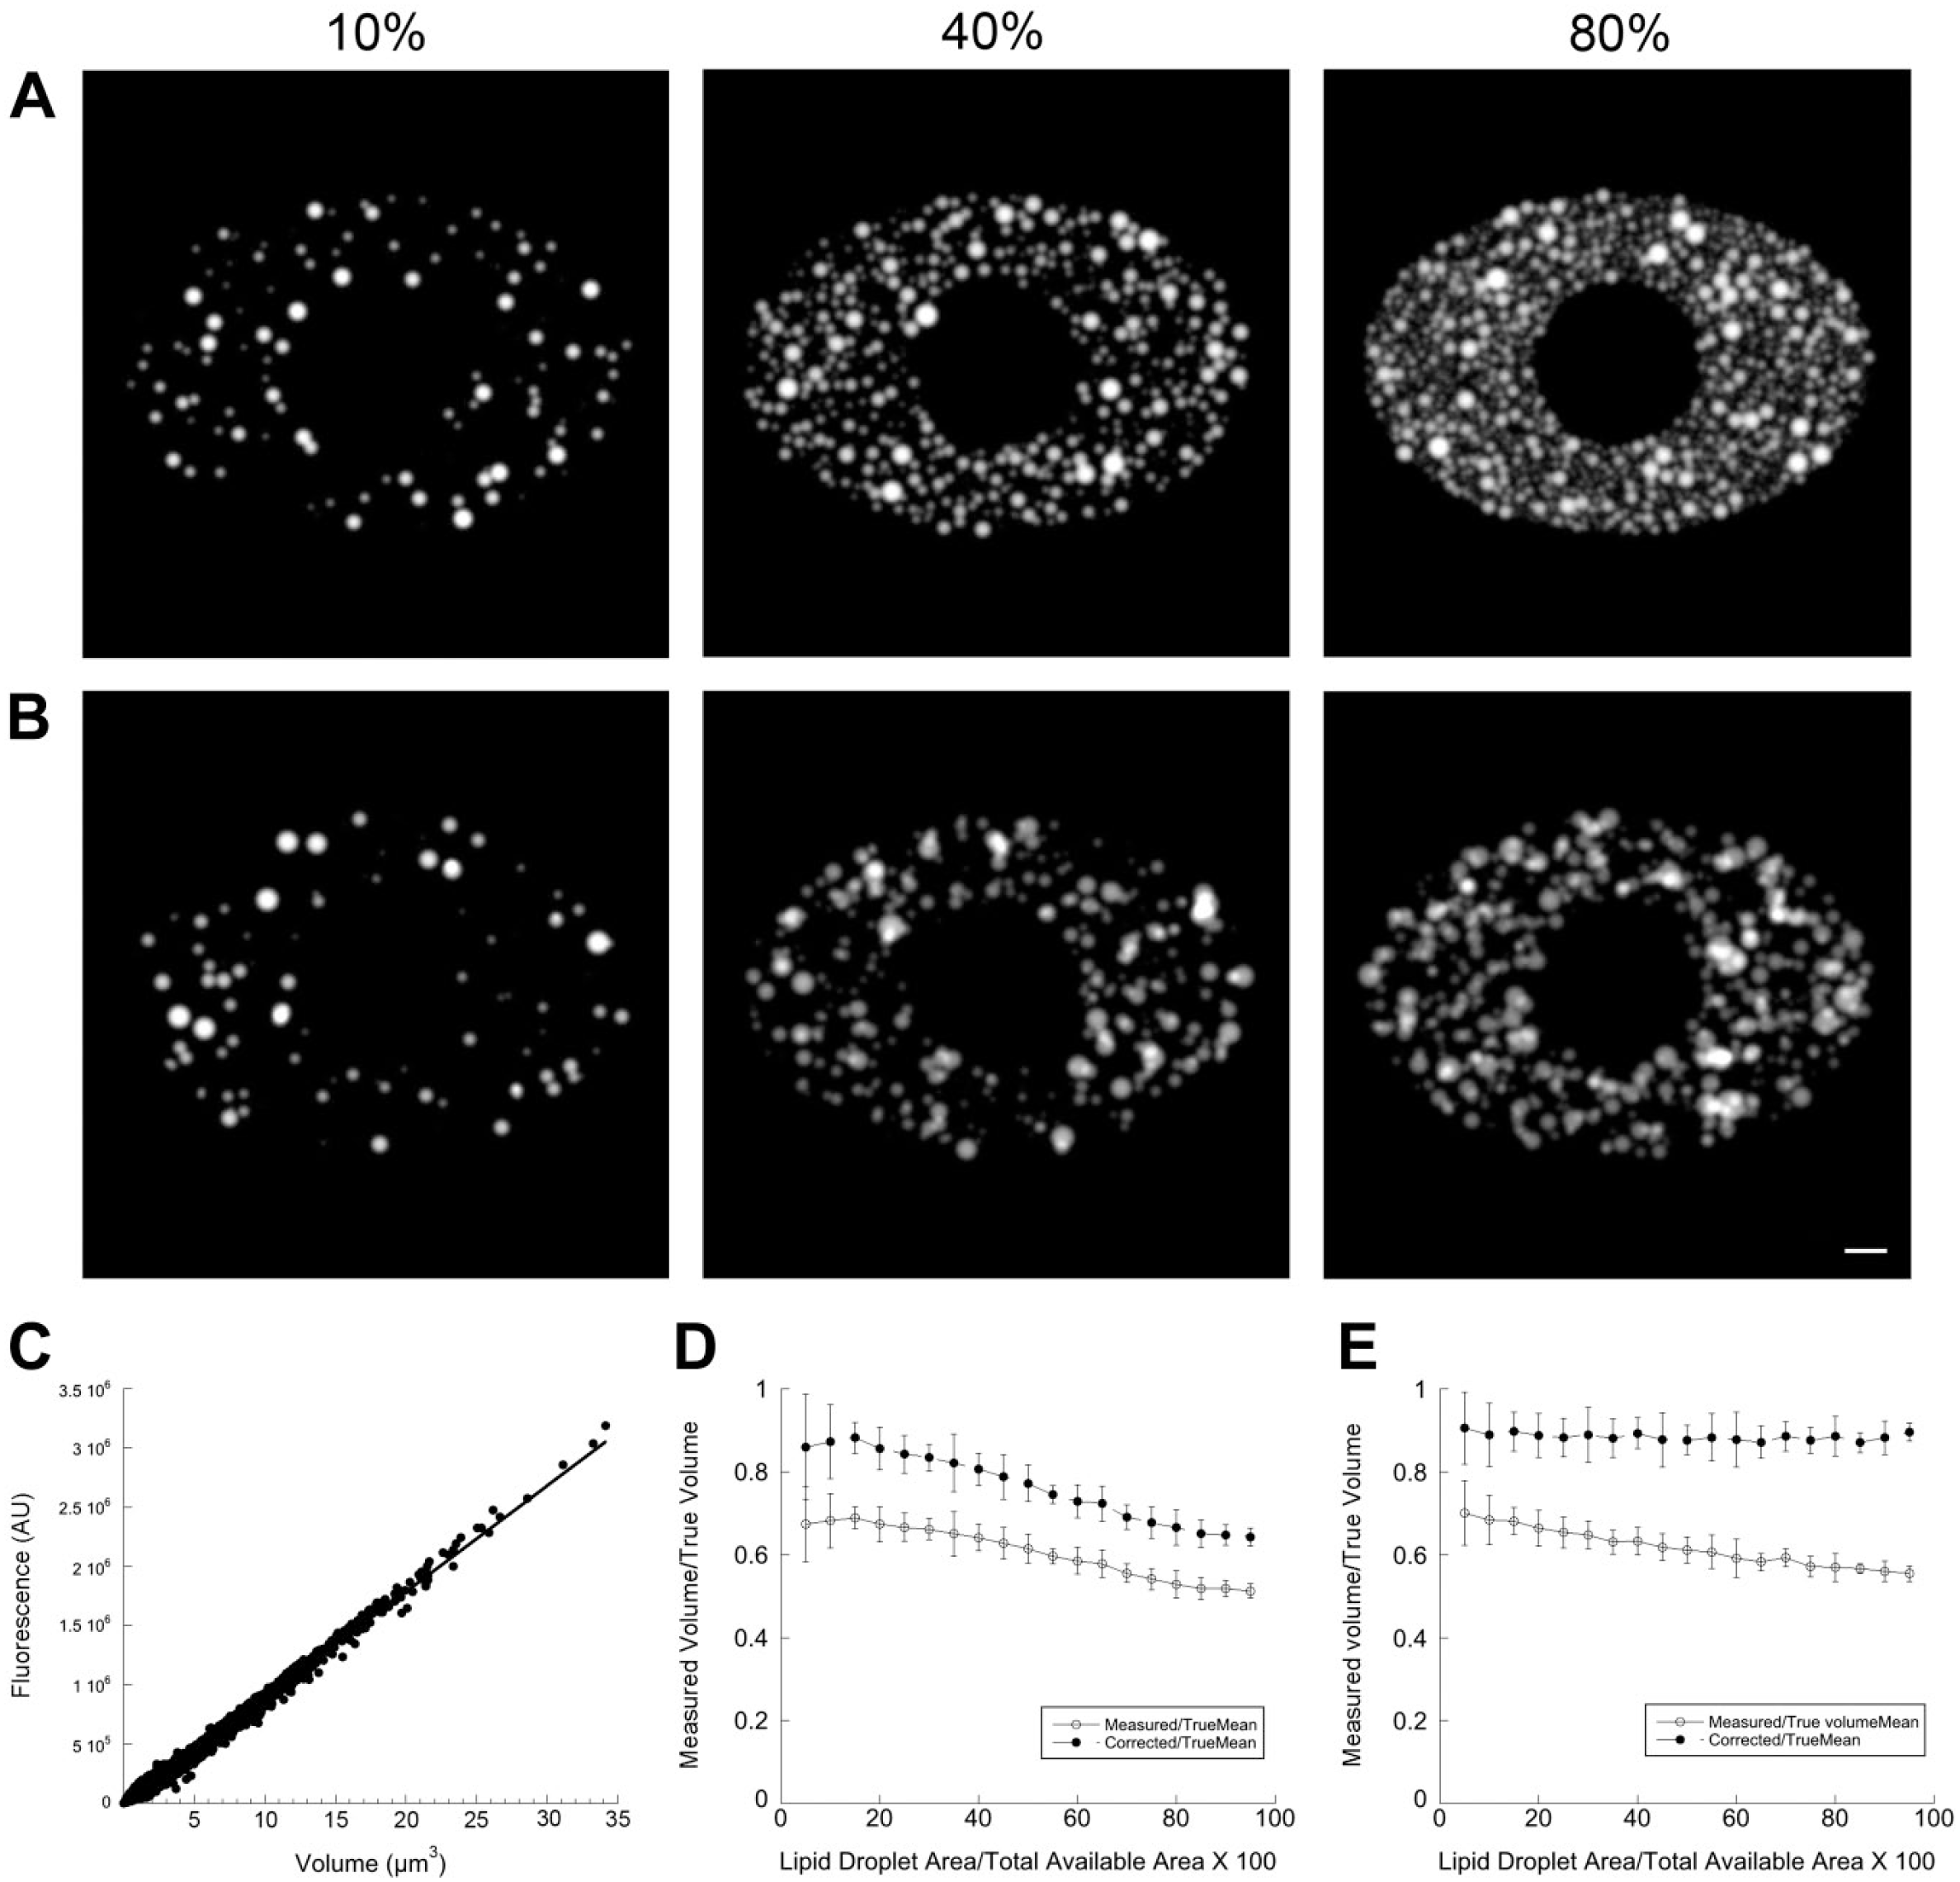
Effect of LD packing on estimation of volume in simulation images. (A) Images generated by placing randomly generated LDs into a simulated cell, as described in Fig. 1, except that the radius was randomly varied. The mean radius was kept constant for each image set at 5 pixels or 0.5 simulated µm with an SD of 2 pixels. Spherical LDs were generated and projected until the summed area of their projections equaled a fixed fraction of the available space. This fraction was varied from 5% to 95% available space in 5% increments. In total, 10 images were generated for each increment, and noise was added as in Fig. 1 to simulate characteristics of realistic images. LDs were constrained to not overlap more than 20% of their radii. Representative images are shown at 10%, 40%, and 80% available space. (B) Images generated exactly as in (A) except that LD positions were completely random, that is, positions were not tested for overlap. (C) Result of running the calibrate_volume program using the entire set of images generated for (A). Least-squares fit line has a slope of 89.660 fluorescence units/pixel3, while the true value input in the simulation was 100 fluorescence units/pixel3 (100,000 units/simulated µm3). (D) Volume determined for images by the sum_volume program on the image set in (A), in which LD overlap was constrained to a maximum of 20%, using the calibration value determined in (C) divided by the true cumulative LD volume, which was recorded by the simulation program. “Measured” (empty circles) shows the raw values (no correction for thresholded fluorescence) divided by the true volume, while “Corrected” shows the volume including an estimated correction (described in the “Materials and Methods” section) for margin fluorescence removed by thresholding divided by the true value. Each point shows analysis of 10 images ± SD. (E) Analysis of the image set described in (B) in which no constraints existed on LD overlap. The analysis procedure was exactly as described for (D). Scale bar = 50 pixels (5 simulated µm). Abbreviation: LDs, lipid droplets.
Fluorescence was then quantitated from all simulation images. Total fluorescence was determined from all objects after an initial global threshold (10% of maximum value in image) followed by iteratively thresholding each object to its FWHM, as described previously. 10 The summed fluorescence of the quantitated objects was expected to underestimate the true fluorescence because (1) trimming the objects to their FWHM would result in the loss of peripheral fluorescence, as described previously, and (2) objects could represent two or more overlapping LDs of unequal fluorescence intensity, leading to excess trimming of fluorescence. Thus, we devised an ad hoc method to estimate a correction for this removal of fluorescence from non-circular objects (see the “Materials and Methods” section for a detailed description), and we computed total fluorescence both with and without this correction applied. Corrected or uncorrected fluorescence was then converted to volume (pixels3) by division by the calibration factor. This calculated volume was then divided by the true combined volume of the LDs, as recorded by the simulation program when the images were created, to give a measure of the accuracy of the analysis (with 1.0 representing a perfect estimate). The measurement was repeated for a range of LD densities. As expected, the non-corrected values underestimated the true values (60%–70% of true value) both in the case where LD overlap was limited (Fig. 4D) and where LD overlap was unconstrained (Fig. 4E). When the correction factor was added, total volume was still underestimated, but ranged between 80% and 90% of the true value (Fig. 4D and E). Increasing LD density from 5% to 95% of the available area resulted in a gradual drop from the higher to lower parts of the described ranges. Overall, the simulation results suggested that the approach used is likely to systematically underestimate LD volume under conditions of LD crowding or overlap, but that this underestimation can be partially corrected using the ad hoc correction we defined.
Estimation of Total LD Volume in HepG2 Cells
We then applied our method to a simple experiment in cells. We compared total per-cell lipid volume in HepG2 cells in two conditions. In the first condition, three sets of cells were maintained in MatTek dishes in normal growth media without additional lipid supplementation (Fig. 5A, right). In the second condition, three MatTek dishes were supplemented with 100 µM OA (Fig. 5A, left). A third set of cells was supplemented with 100 µM OA for 48 hr to provide calibration standards (two MatTek dishes). After fixation, the MatTek dishes were stained together with Bodipy 493/503 and imaged on a Zeiss 510 confocal microscope, with five z-stacks acquired from each dish. All images were acquired in a single microscope session with identical settings. A calibration factor of 367.89 arbitrary fluorescence units/pixel3 was determined by the slope of the linear regression line-fitting fluorescence/volume. This value was an average of independent determinations from 10 calibration images (see Fig. 5B and C for representative examples). Experimental images from loaded and unloaded HepG2 cells were then background-corrected and thresholded as described in the “Materials and Methods” section. They were then analyzed as described for the simulation images in Fig. 4 using the calibration factor just determined. As the simulation images contained one “cell” per image, segmentation had not previously been an issue. However, the fields acquired for this experiment contained multiple cells/field (Fig. 5A). As we wished to determine total volume/cell, we hand-segmented the image using a simple program to outline cell boundaries with a mouse (as in Dejgaard et al. 16 ), and then used a Ruby script to assign objects within cell boundaries to the enclosing cell. Volume/cell was computed on the processed images using the two approaches described in the previous section, that is, with and without the “ad hoc correction.” Experimental images were background-corrected and subjected to local and global thresholding as previously described, and all fluorescent objects identified and assigned to cells. An uncorrected volume (Fig. 4D) was computed by summing the fluorescence from all identified objects within each cell, and dividing by the calibration factor. The ad hoc correction was also applied (Fig. 4E). Using this assay, we estimated OA-loaded cells contained a mean of 45.5 µm3 (uncorrected) or 54.6 µm3 (corrected) of total LD volume (Fig. 5D and E). Although LDs were found in non-loaded cells (Fig. 5A, right), the measured volume was much less (2.6 µm3/cell uncorrected, and 2.8 µm3/cell corrected). These differences were significant (Fig. 5D and E). Similar results were obtained in HeLa cells (data not shown). Notably, these estimates were made without the need to identify individual LDs or to segment clusters in the analyzed experimental images.
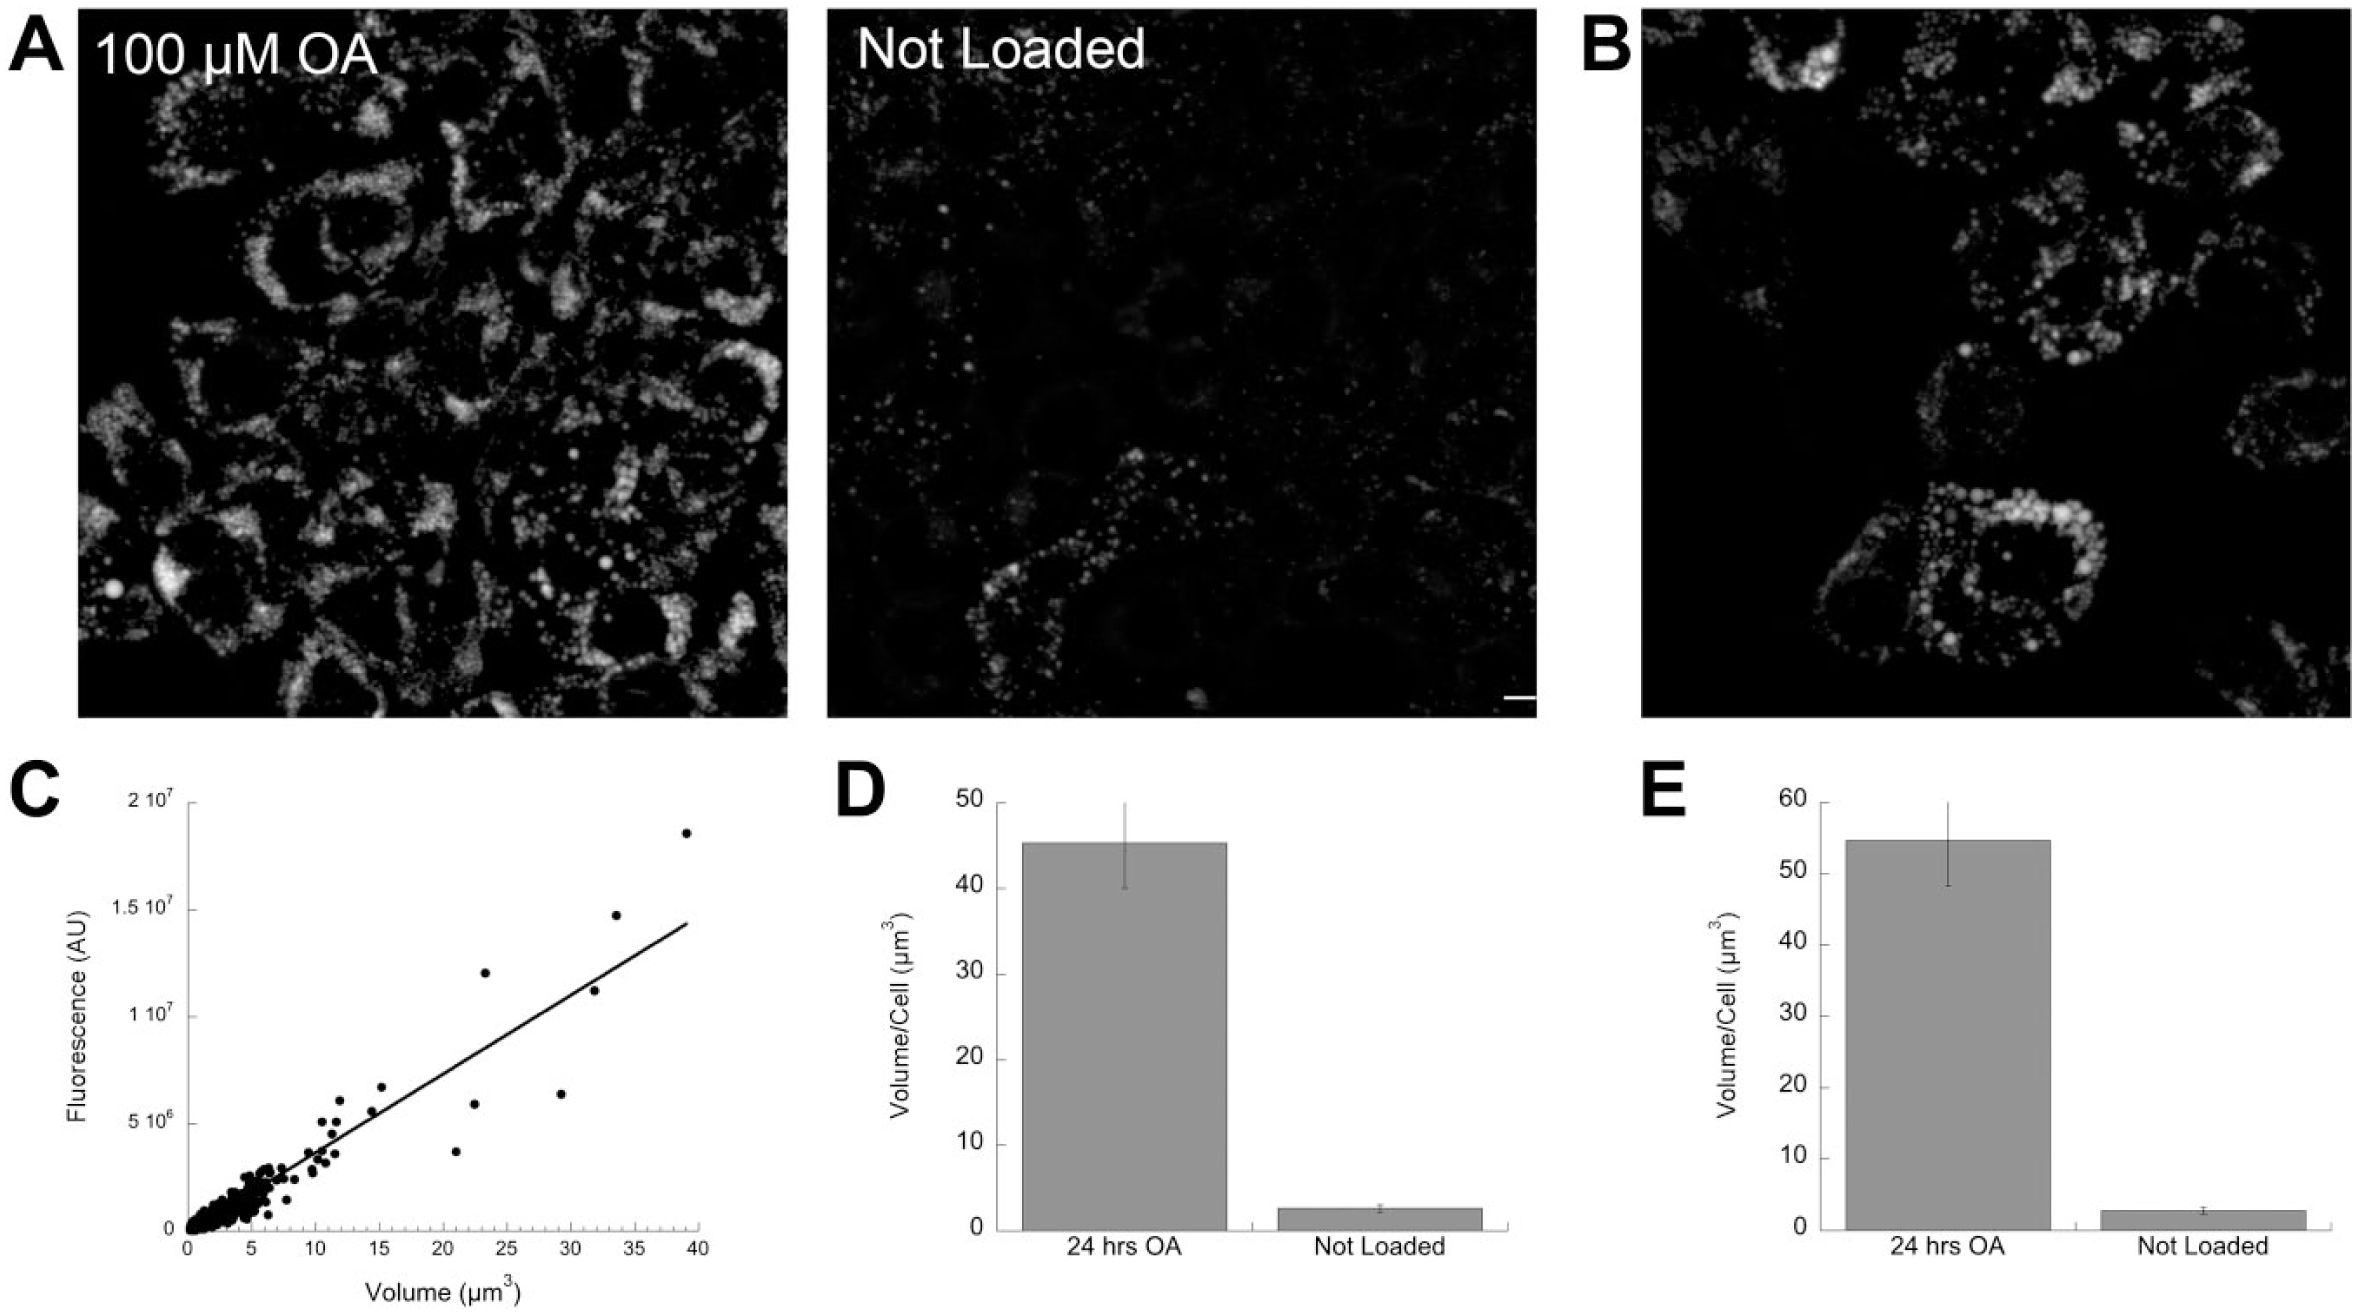
Estimation of total LD volume per cell in HepG2 cells using LDs in a separate identically stained population of cells as calibration standards. (A) Representative images of HepG2 cells loaded with 100 µm OA for 24 hr or not loaded (as indicated), with images acquired and stained with Bodipy 493/503 as indicated in the “Materials and Methods” section. (B) Representative image of calibration sample (100 µm OA for 48 hr). (C) Representative calibration fit. (D) Volume/cell calculated by sum_volume program using raw fluorescence and calibration value determined in (B) for loaded and unloaded samples ± SEM (n=78 for OA-loaded sample; n=91 for non-loaded sample). SDs were 47.08 for cells loaded for 24 hr, and 4.44 for non-loaded cells. Cells were identified and measured fluorescence assigned to cells as described in the “Materials and Methods” section. Difference is significant by Student’s t-test for p<0.001. (E) Volume/cell calculated by sum_volume program with the same dataset as described for (D) except that an estimated correction was added to the calculated volume. SDs are 56.5 for 24-hr loaded cells, and 4.78 for non-loaded cells. Difference is significant by Student’s t-test for p<0.001. Scale bar = 5 µm. Abbreviations: LD, lipid drop; OA, oleic acid.
Effect of Expression of Exogenous PAT Proteins on Total LD Volume
To determine if expression of GFP-tagged PAT proteins would increase LD volume in cells, we transfected HeLa cells grown on coverslip bottom dishes with ADRP-EGFP, PLIN1A-EGFP, or Tip47-EGFP. EGFP vector without insert, that is, there is no attached protein, was used as a control. HeLa cells were chosen as they are readily transfectable and have low levels of endogenous PAT proteins. After transfection, 24 hr were allowed for expression of fluorescent proteins. Subsequently, transfected cells and an additional untransfected control were loaded for 24 hr with 100 µg/ml OA and fixed. Untransfected calibration dishes were labeled with 100 µg/ml OA for 48 hr before fixation. Dishes were stained, and images were acquired from all dishes (Fig. 6A). Calibration and experimental images were analyzed and total LD volume in the experimental images was estimated on a per-cell basis from transfected cells exactly as described for Fig. 5. Mean LD volume/cell is shown for two representative experiments (Fig. 6B and C). EGFP transfection did not significantly increase total LD volume compared with untransfected control (Fig. 6B). However, LD volume was consistently increased by transfection of tagged versions of the three PAT proteins tested (ADRP, PLIN1, or Tip47; Fig. 6B), especially at increased expression levels (Fig. 6D–F).
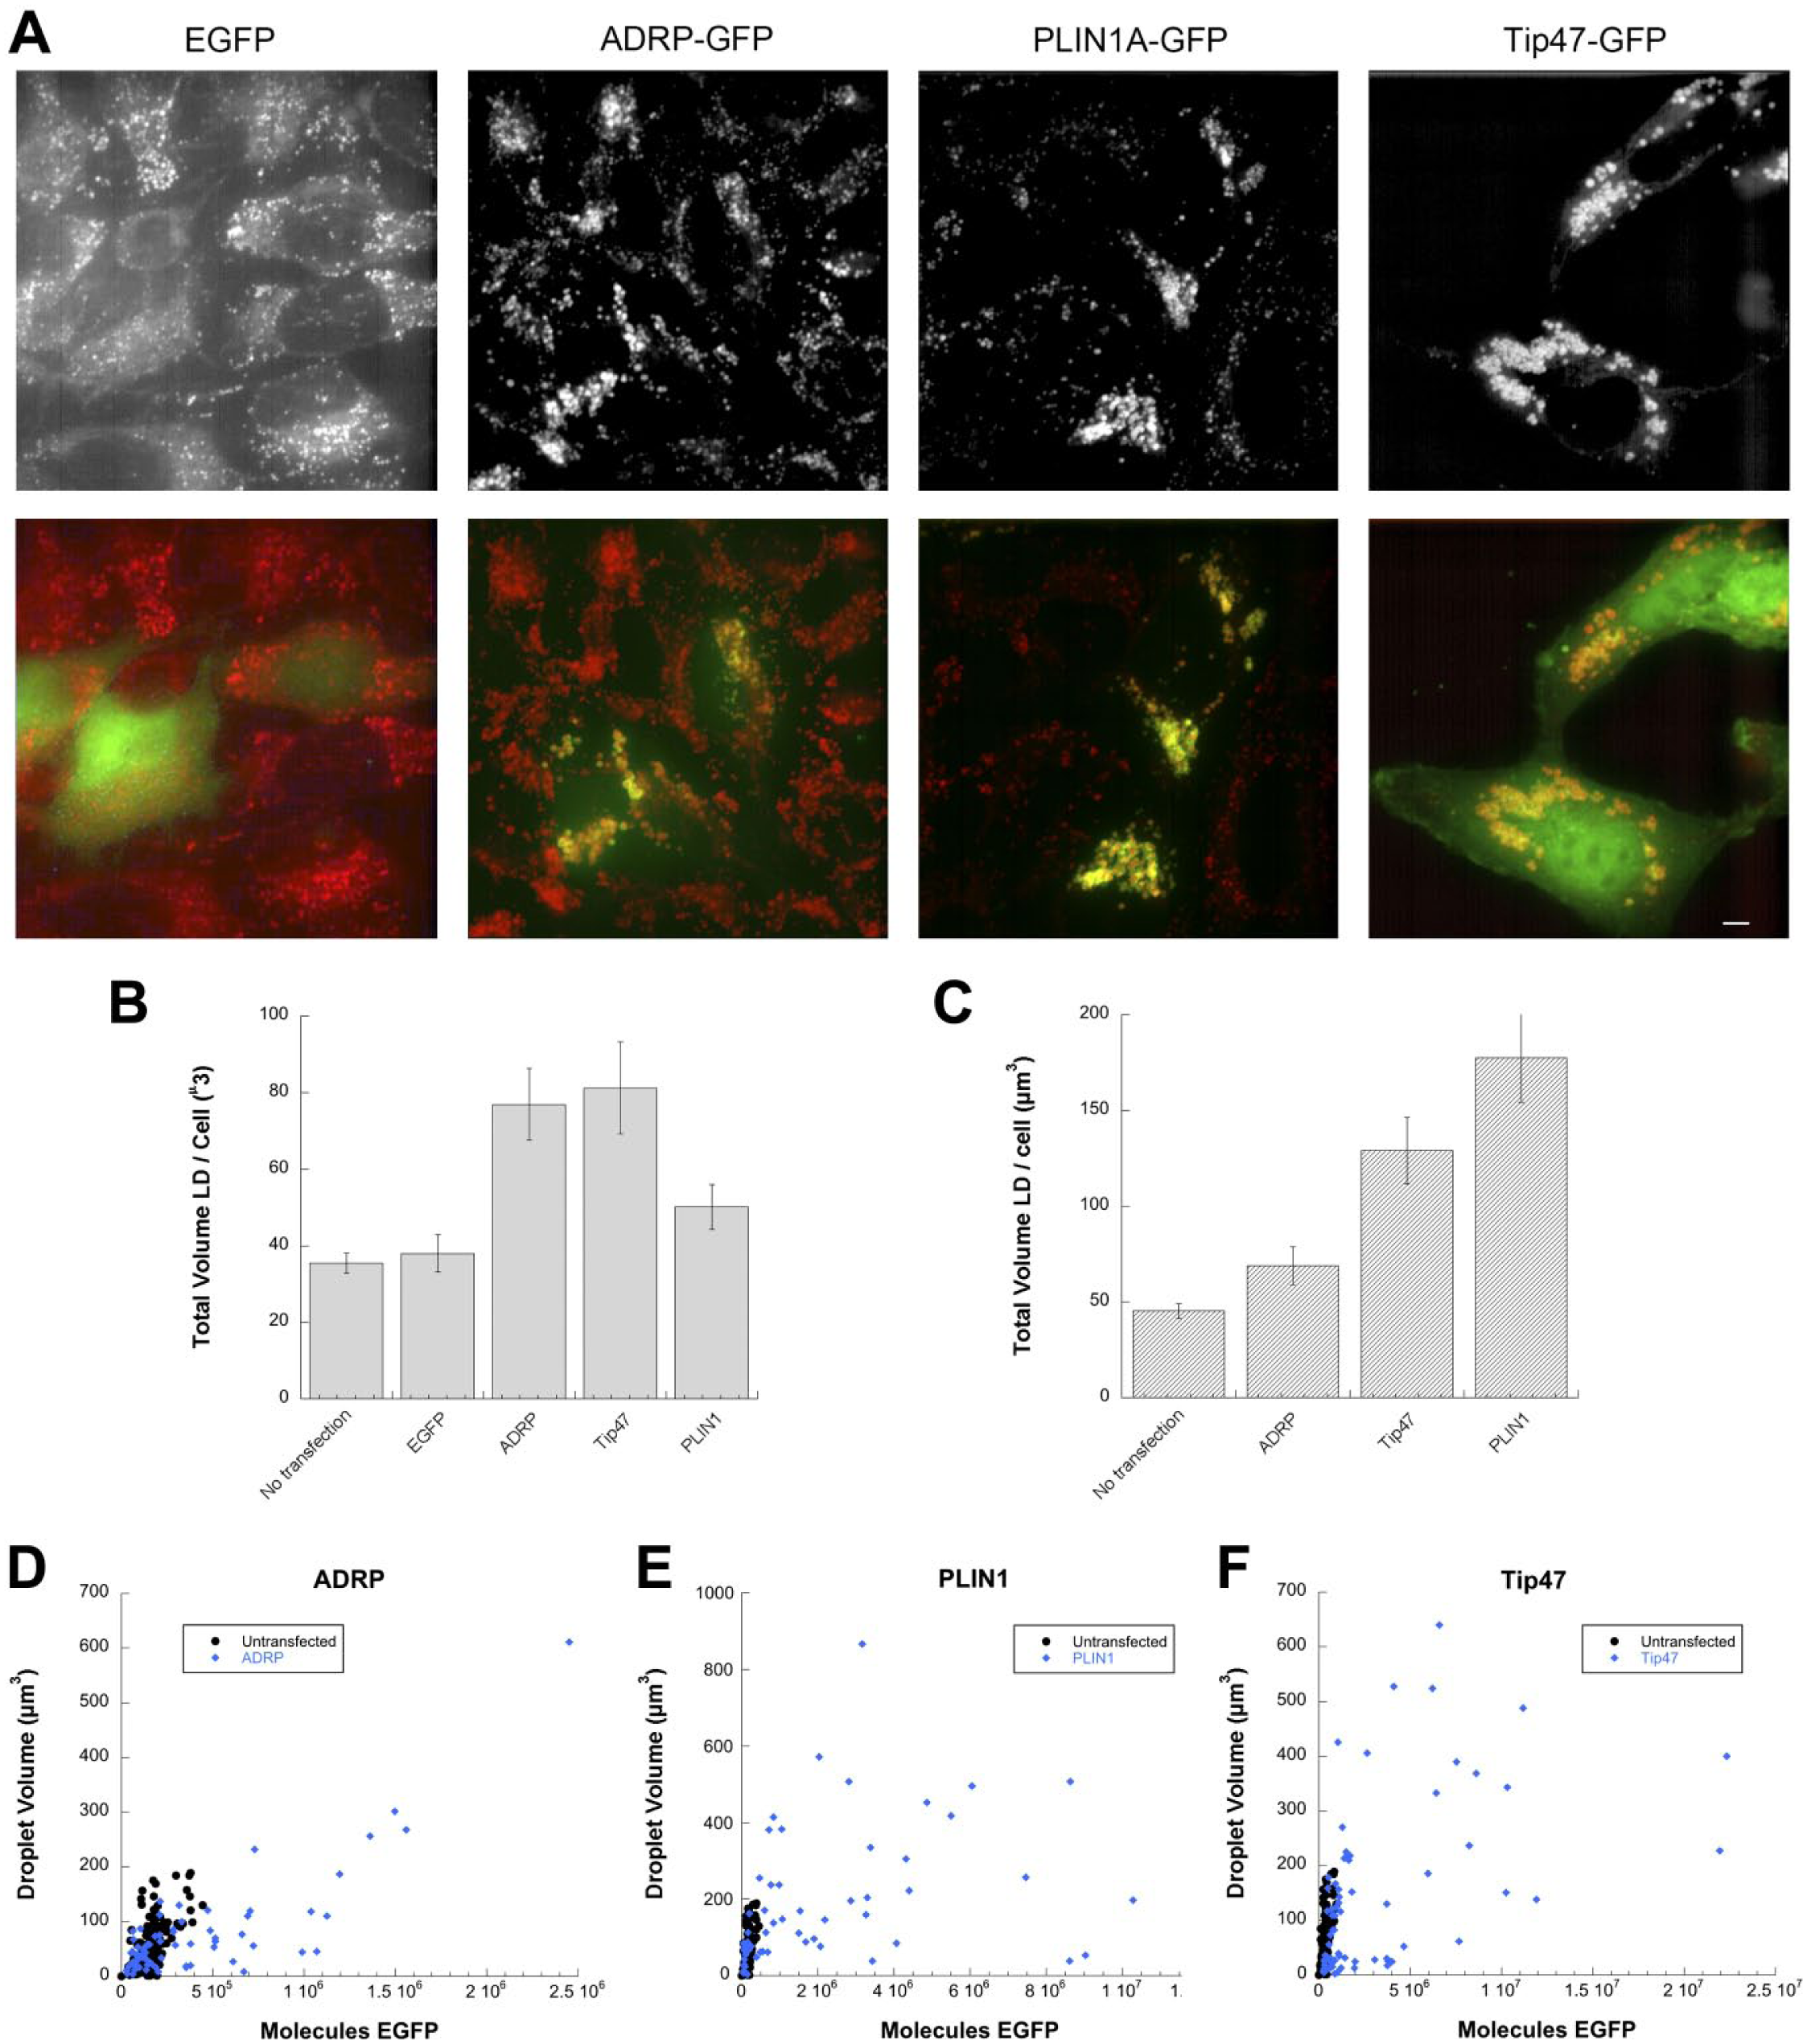
Effect of expression of GFP-tagged PAT proteins on total lipid volume in HeLa cells. (A) Representative images of HeLa cells transfected with the indicated constructs and then loaded with 100 µM OA for 24 hr. LDs were stained with HCS LipidTox Red as described in the “Materials and Methods” section. Scale bar = 5 µm. (B–C) Two representative experiments comparing total lipid volume/cell between non-transfected cells or cells transfected with the indicated constructs. In (B), non-transfected is significantly different from ADRP (p=0.0291) and Tip47 (p=0.0012). In (C), non-transfected is significantly different from PLIN1 (p<0.0001) and Tip47 (p<0.0001). (D–F) Scatterplots showing the relationship between LD volume and GFP fluorescence for HeLa cells transfected with ADRP-EGFP (D), PLIN1A-EGFP (E), or Tip47-EGFP (F). Each point represents fluorescence and total LD volume from a single cell. Data shown are the same as in (C). Untransfected cells (from C) show background fluorescence from quantification of GFP channel in untransfected cells. Abbreviations: EGFP, enhanced green fluorescent protein; GFP, green fluorescent protein; OA, oleic acid; LDs, lipid droplets; HCS, high-content screening; ADRP, adipocyte differentiation–related protein; PLIN1, Perilipin A; Tip47, tail interacting protein of 47 kDa.
Density of PAT Protein on LD Surface
To determine the density of PAT proteins on the surface of LDs, the dishes of HeLa cells transfected with GFP-tagged PAT proteins (ADRP-EGFP, PLIN1A-EGFP, and Tip47-EGFP) and loaded with 100 µM OA for 24 hr were re-examined. Images of transfected cells were acquired using a 100× NA 1.4 objective at maximal resolution (100 nm pixels) to visualize LDs and GFP-tagged surface PAT proteins. Images were acquired of calibration dishes with stained LDs, and of a 6-his-tagged EGFP standard solution of known concentration, using identical microscope settings to the experimental images (see the “Materials and Methods” section). Image stacks were background-corrected and projected, and circular LDs identified in the experimental images as had been done previously on calibration images.
Volumes of circular LDs were then estimated as described previously using conversion factors determined from the calibration images (see the “Materials and Methods” section). EGFP fluorescence co-localizing within the isolated LDs or within 2 pixels of the LD boundary was summed, and volume and fluorescence for each LD written to a data file. The methods described in Piston et al. 7 were then applied to images of the EGFP standards to convert EGFP fluorescence to number of molecules. For each circular LD, surface area in µm2 was calculated from the estimated volume as described in the “Materials and Methods” section. Because the major portion of the PAT proteins appeared to be on the LD surface, the density of PAT proteins (ADRP-EGFP, PLIN1A-EGFP, or Tip47-EGFP) could be calculated by dividing the total number of measured LD-associated GFP molecules by the calculated surface area. For this analysis, images were preferentially collected from cells with higher transfection levels to assure that the overexpressed PAT proteins would show accumulation of excess lipid.
Results were typically in the range of 100–400 molecules/µm 2 on the surface of LDs for the three PAT proteins (see scatterplots in Fig. 7A for representative results). Densities higher than 600 molecules/µm2 were rare (Fig. 7A). Although only circular separated LDs were assayed in this experiment, PAT protein fluorescence on the rim of these LDs appeared representative of other more crowded LDs in the same cell (data not shown).
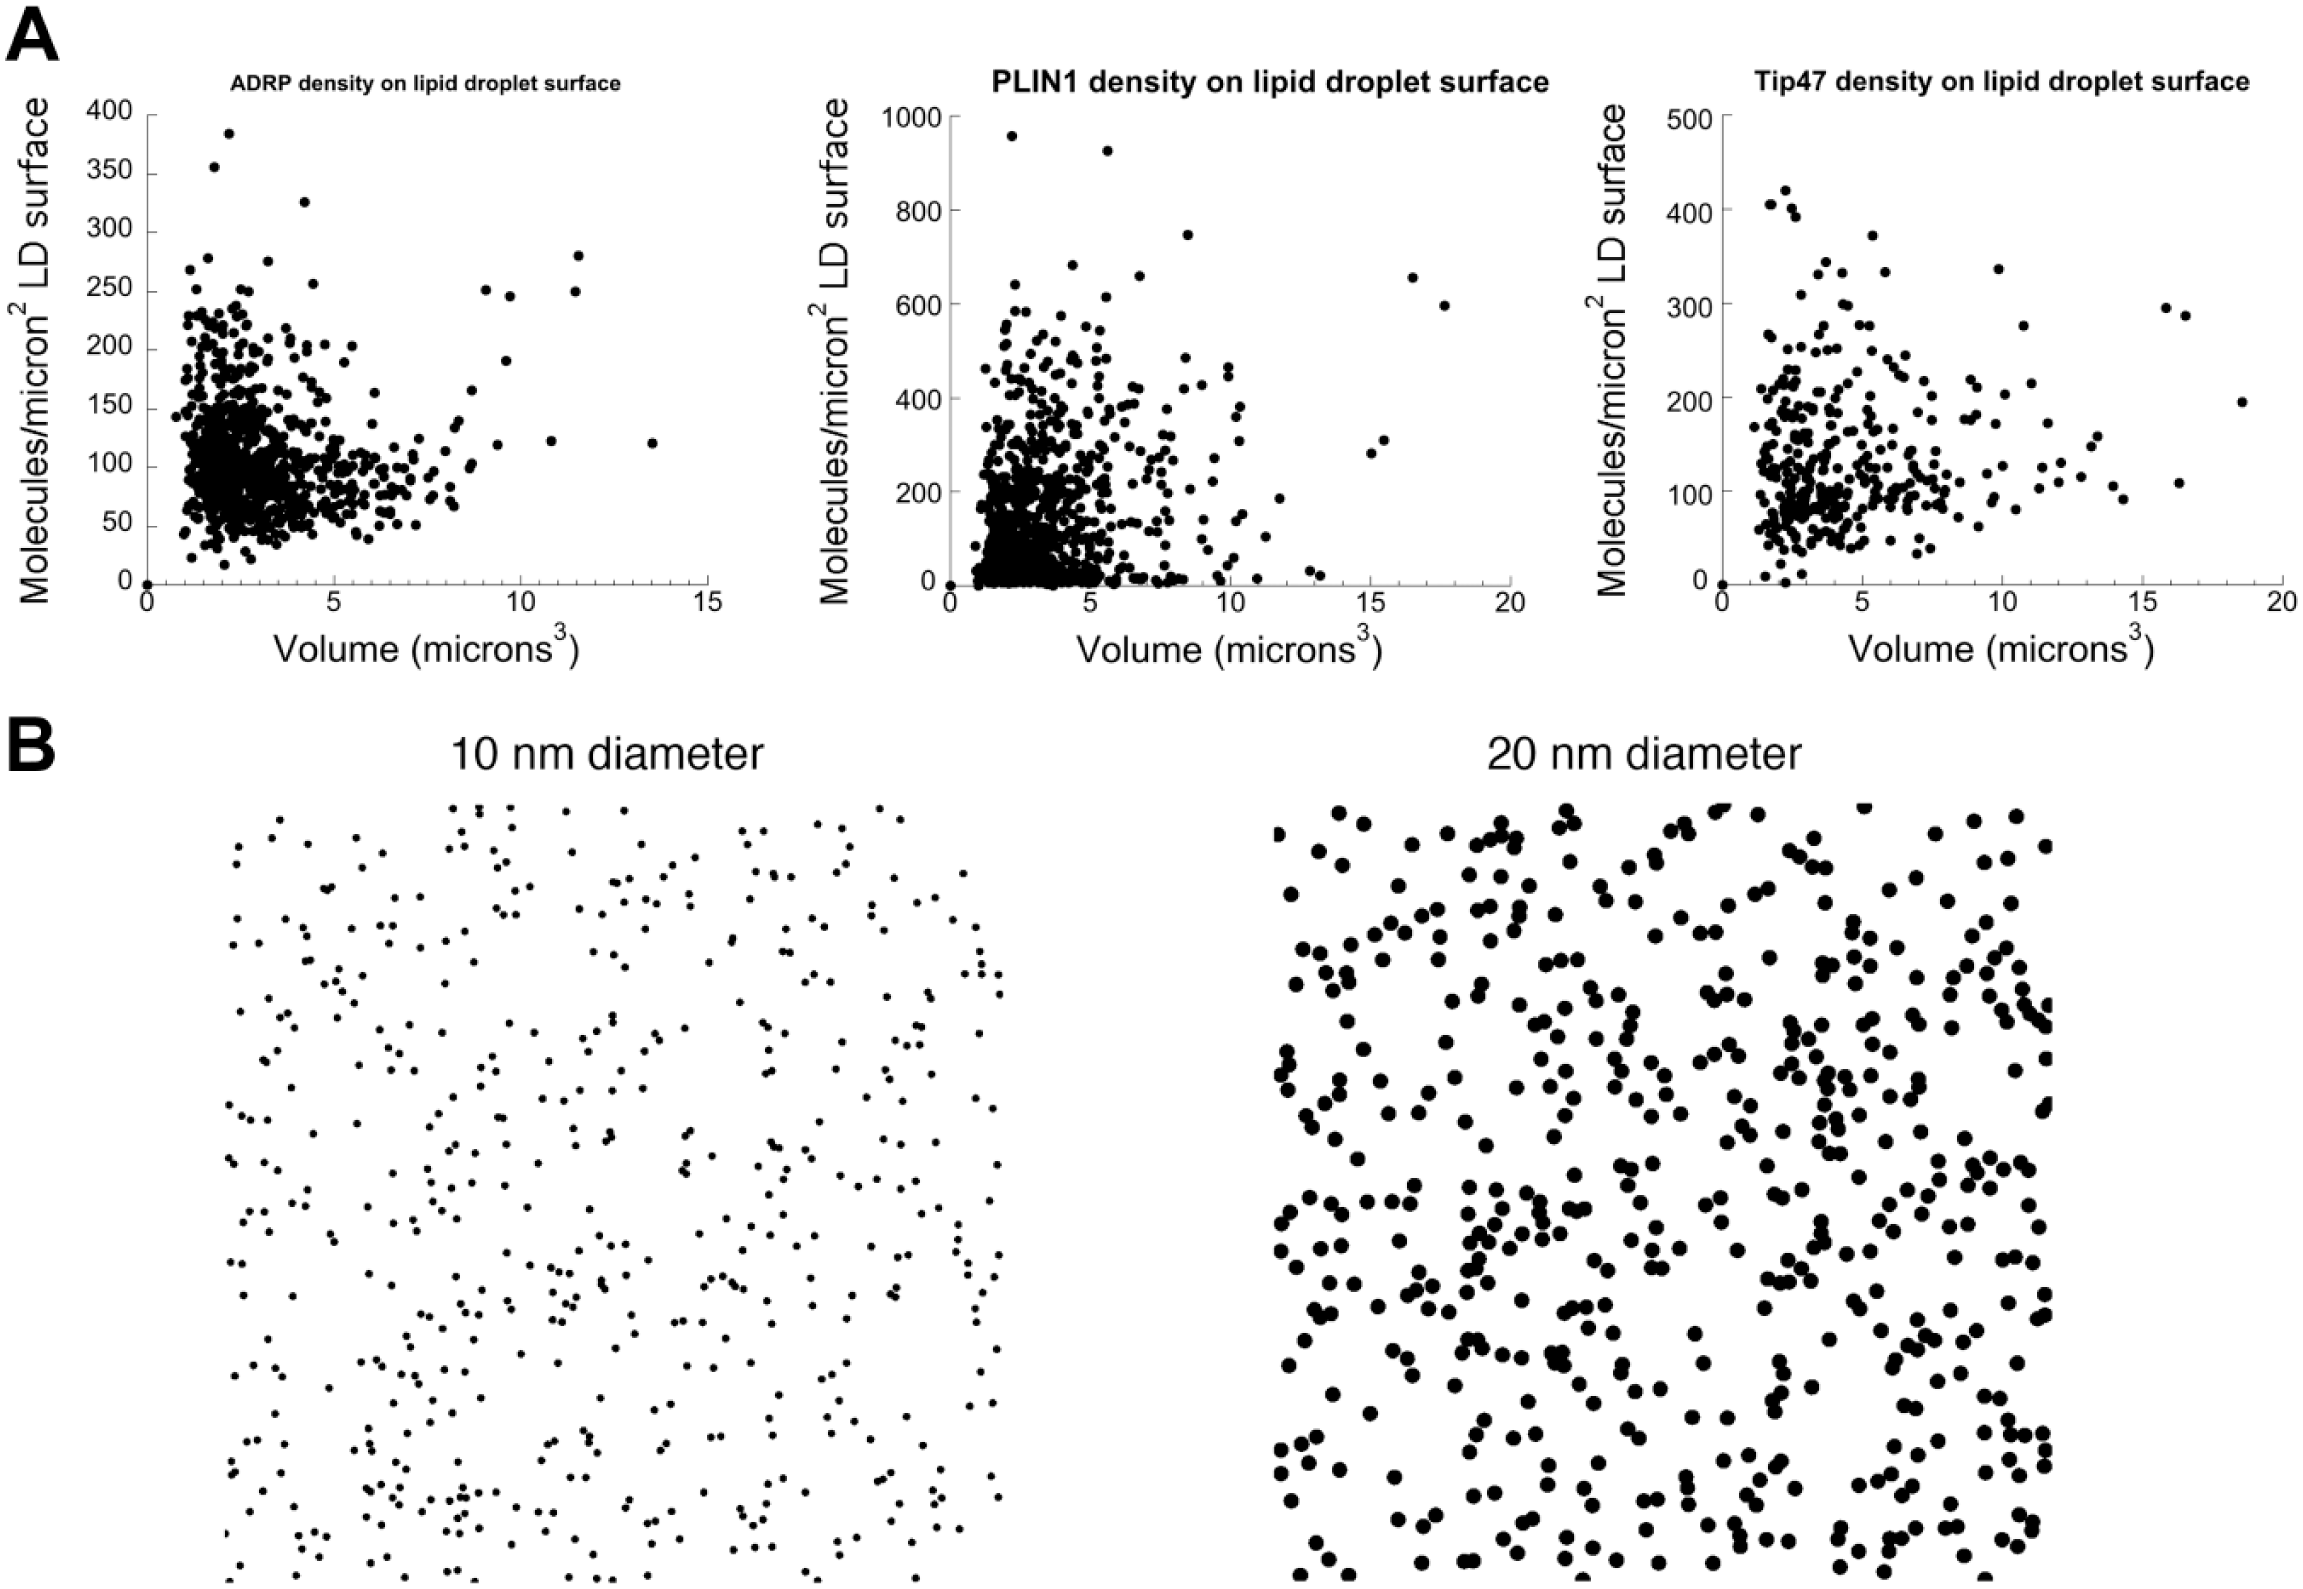
Density of tagged PAT proteins on the surface of LDs in HeLa cells. (A) Scatterplots showing calculated density of tagged PAT proteins (ADRP-EGFP, PLIN1A-EGFP, or Tip47-EGFP as indicated) on the surface of LDs. Each dot represents a measurement from a single circular isolated LD identified as described in the text. Scatterplots each show pooled data from 10 microscope fields (normally 1–2 cells/field) acquired with a 100× NA 1.4 objective. Note that densities >500 molecules µm2 are rare. (B) Membrane coverage of 500 spherical particles each of 10 nm diameter (left), or 20 nm diameter (right) scattered randomly over 1 µm2 in simulated image. The 10 nm diameter particles each cover a greater surface area than the expected size of the largest tagged protein examined in this study (PLIN1A; 57,000 Da). Abbreviations: ADRP, adipocyte differentiation–related protein; EGFP, enhanced green fluorescent protein; PLIN1, Perilipin A; Tip47, tail interacting protein of 47 kDa; NA, numerical aperture; LDs, lipid droplets.
We considered whether FRET from EGFP to HCS LipidTOX Red could result in a loss of EGFP fluorescence, and thus an underestimate of the number of tagged molecules. We measured FRET efficiency directly by measuring dequenching of EGFP fluorescence after photobleach of HCS LipidTOX Red (see the “Materials and Methods” section). We did not see substantial dequenching of EGFP fluorescence after photobleach (Supplemental Fig. 1). Our results were consistent with either a complete absence or minimal FRET, and suggested that FRET did not interfere in the measurement.
Detailed structural information exists only for Tip47, for which the C-terminal portion has been crystallized. However, for proteins in the general size range of the PAT proteins (~500 AA residues, 45,000–56,000 Da), the diameter of the protein would be expected to be well under 10 nm. 28 Fig. 7B (left) shows the membrane coverage achieved by 500 particles, scattered randomly over an area of 1 µm2, each 10 nm in diameter. Even if the proteins were highly flattened, and covered a circular area with a diameter of 20 nm (implying an unrealistic average thickness of <1 nm), only a small fraction of the total membrane would be covered (Fig. 7B; right). Thus, under these conditions, fluorescently tagged PAT proteins can cover only a small portion of the LD membrane.
Discussion
This study describes a new and rapid light microscopic method for estimating the total volume of lipid stored in droplets in tissue culture cells. The key innovation is a technique for automated identification of LDs suitable for use as calibration standards in specially created calibration samples. A virtue of the method is that it does not require the LDs to be individually resolved in the experimental cells. Thus, it is suitable for use in many tissue culture cell lines, which can possess numerous small LDs. We apply this method to a problem of biological interest, determining that expression of fluorescently tagged PAT proteins can drive increase in total LD volume in HeLa cells at surface densities of transfected PAT protein (molecules/µm2) sufficiently low to rule out that the PAT proteins form a continuous barrier on the LD surface. 14 This finding favors alternative models in which the positive effect of PAT protein expression on lipid storage is related to recruitment of other proteins to LDs as part of their role as a dynamic scaffold, 14 or to modulation of signaling pathways.
Automated Measurement of LD Volume
Previous light microscopic measures of LD volume in cells have depended on direct measurement of the volume of each LD using either manual measurement of each LD 29 or automated measurement of its diameter. 30 Direct measurement of the diameter of LDs is an appropriate strategy in some cases where most of the total LD volume is in structures of sufficient size that a disk can be clearly resolved by light microscopy, for example, in cultured or in vivo adipocytes, or in cells in which lipid metabolism has been perturbed, resulting in unusually large LDs. 31 However, direct measurement fails in many cell types in which lipid loading produces a large number of LDs that may be tightly clustered, or of a size comparable with or smaller than the point-spread function of the microscopes used. To our knowledge, no light microscopic method has been previously described to measure LD volume under conditions where individual LDs are not resolved. The methodology described here shows that calculating LD volumes indirectly by converting from measured fluorescence is feasible. This is important because total fluorescence produced by LDs is independent of their detailed distribution or morphology. Preparation of a calibration sample with large LDs is required for our method but can be achieved with standard conditions (i.e., HeLa or HepG2 cells loaded with OA for 48 hr). The key step is identifying round LDs of a variety of sizes in the calibration sample. Our software supplies a rapid solution to identifying LDs suitable for calibration within a mixed population; however, in principle, this could be done manually or using different object identification algorithms. Regardless of the approach used, the calibration plots should be examined to determine a useful linear range. In contrast to the calibration samples, the LDs in the experimental samples do not need to be well-resolved, that is, efficient segmentation is not required, so long as LD fluorescence is bright enough to be identified in discrete regions of the image. LD mass is given in units of volume, which permits direct comparison of microscopy-obtained and biochemical data (e.g., direct measure of lipid mass in a large cell population). Microscopy measurements, in contrast to biochemical measurements, produce data on cell–cell variability, and have the potential to deal easily with a mix of cell types growing together.
To our knowledge, the only proven alternate single-cell approach that has the general potential to measure LD volume is the combination of electron microscopy with stereology. Techniques for the analysis of electron micrographs such as the point-grid method are reasonable estimators of LD volume 32 but would need to be applied to serial sections to get per-cell data. As is well known, electron microscopy (EM) requires labor-intensive sample preparation and image acquisition. 33 It is also not available to all researchers. 34 Although EM may be the most accurate technique available, the application of light microscopic techniques is much faster, as fluorescence staining of LDs can be carried out in minutes, and image acquisition of a sufficient dataset can be carried out in a single light microscopic session. Total computer processing time for a realistic experiment containing a calibration sample and multiple experimental samples should be less than 5 min.
The software described here is limited in dealing with three-dimensional data. Cellular fluorescence is projected, and the images are then treated as two-dimensional. This approach is reasonable in flat tissue culture cells such as HeLa cells, but thick, highly three-dimensional samples might require modifications to the approach. LD object identification should be trivial in three dimensions, but fitting the boundary of each LD might be more challenging. While fitting a three-dimensional spherical surface to potential calibration LDs could be costly in computer time, projection of the images of individual LDs post-segmentation could allow use of the existing software, including the circle-fit algorithm, with small modifications.
The methodology described here requires some care in use. The entire set of samples to be analyzed, including calibration and experimental samples, must be stained together using a single staining solution, consistent temperature, and times. Images must be acquired with identical microscope settings in a single session. We recommend that two sets of calibration images be acquired, one at the beginning of the confocal session, and one at the end, and calibration values computed independently and compared with control for accidental changes in microscope setting, instrument drift, or illumination drift. Another issue that needs to be considered is the range of sizes of usable LDs in calibration images. Some cell types (e.g., adipocytes) can contain much larger LDs than were tested in our study. As LDs will be composed of material with a refractive index different from the surrounding primarily aqueous cytoplasm, optical effects could potentially render the fluorescence/volume ratio nonlinear for very large LDs. Examination of calibration fits should therefore be conducted to determine a reliably linear range.
The images in this study were acquired using scanning and spinning disk confocal microscopes. We have not tested this method with deconvolved images from conventional epifluorescence microscopes. It would be necessary to verify that the deconvolution algorithms used preserve a linear relationship between LD size and fluorescence.
Implications for Role of PAT Proteins
One role of PAT proteins is the recruitment of catabolic enzymes. However, multiple studies have shown that increased expression of PAT proteins, including PLIN1A, Tip47, or ADRP, enhance LD formation in tissue culture, while reduction of PAT protein expression (e.g., by siRNAs) reduces total LD formation (reviewed in Brasaemle 14 ). Mice in which PLIN1 is knocked out have reduced lipid loading of adipocytes, as would be predicted from the studies in cultured cells, and are lean. 35 However, they show abnormalities in lipid metabolism, exhibiting enhanced β-oxidation, 36 and a variety of pathologies including insulin resistance 35 and cardiomyopathy. 37 PLIN2 (ADRP) knockout mice show protection from hepatic steatosis (e.g., reduced formation of LDs in liver) consistent with the data from tissue culture. 38
Although the mechanism behind these common effects has not been determined, it has been proposed that PAT proteins form a barrier on the LD that blocks access of hydrolytic enzymes to the LD surface. In this model, removal of the barrier would result in increased hydrolysis, and this could be responsible for reduced LD size at low levels of PAT protein expression (reviewed in Brasaemle 14 ).
Recent studies suggest as an alternate possibility that PAT protein expression can have a broad impact on both catabolic and anabolic pathways involving lipids via signaling pathways regulating gene transcription. One study has provided evidence that the PAT protein PLIN5 can migrate to the nucleus when phosphorylated by protein kinase A, and there forms transcriptional complexes with PGC-1α and SIRT1, genes that regulate mitochondrial function and lipolytic pathways. 15 Another study provides evidence that expression of the PAT protein ADRP (PLIN2) favors activation of genes involved in de novo lipogenesis and biosynthesis of cholesterol. 39 These include the sterol regulatory element–binding protein (SREBP).
There is also strong evidence for another subclass of signaling models in which PAT proteins sequester regulatory proteins and function as a “dynamic scaffold.” 14 In addition to direct recruitment of hydrolytic enzymes, the PAT protein PLIN1A was reported to sequester the protein Abhd5 (CGI-58), which is an activator of ATGL. 40 Abhd5 would be released when perilipin was phosphorylated on serine 492 or serine 517, making it available to recruit ATGL to LDs. 40 There may be other similar interactions. Thus, PAT proteins could potentially coordinate a complex network of interacting proteins. As with models in which PAT proteins regulate signaling pathways, effects on lipolysis via interaction with regulators of lipolytic enzymes may not require a dense coat of PAT proteins.
A distinguishing characteristic is that models in which PAT proteins play a barrier role 14 require a very high density of PAT protein on the LD surface, while there is no such restriction if PAT proteins primarily regulate LD mass in their function as a dynamic scaffold 14 or via signaling pathways.15,39 Our data suggest that, at least in HeLa cells, only a small proportion of the LD surface is covered with PAT protein at expression levels at which lipid storage is actively upregulated. A caveat is that HeLa cells express some endogenous untagged ADRP and Tip47. However, if the level of untagged protein were much greater than the level of transfected protein, it is unlikely that the additional tagged protein would have been sufficient to increase LD storage. Thus, based on these data, we favor models in which modulation of lipid storage by increased expression of PAT proteins occurs by modifications of signaling pathways affecting the overall metabolic state of the cell or by their regulation of the function of other LD proteins via their activities as a dynamic scaffold.
PAT proteins are generally assumed to be evenly distributed over the surface of the LD. One study suggests this may not be the case, at least in some cell types, as 41 provided data from a combination of immunogold and freeze-etch that ADRP and PLIN1 were found not only on the LD surface but also on adjacent endoplasmic reticulum (ER) membranes. Furthermore, some portion of PAT proteins have been reported to be internal to the LD in some cases. 42 In our analysis, these non-surface pools of PAT proteins would have been assigned to the LD surface. However, our conclusion that PAT proteins on the LD surface cover only a small proportion of its area would be unaffected even if a substantial portion of the PAT protein we measure is not on the LD surface.
Robenek et al. 41 also reported evidence for clustering of ADRP on LD surfaces. If PAT proteins are restricted to subdomains of the LD surface, such as contact sites with other organelles, our data would not preclude competitive inhibition of binding of other molecules (e.g., lipolytic enzymes) to the same restricted domains. In such a case, PAT proteins, particularly those that, like PLIN5, have been shown to make contacts with other organelles, 43 might coat the LD continuously in localized “gateway” domains. This should be experimentally observable using super-resolution light microscopic techniques such as photo-activated localization microscopy (PALM) / stochastic optical reconstruction microscopy (STORM).
Models in which Tip47 or other PAT proteins form a coat that facilitates budding of nascent LDs from ER (as proposed by Wolins and coworkers 44 ) are also not excluded by our current data. Such small LDs would be dim, and there could be background staining in ER, which would impair visualization and quantitation of these small LDs. Nevertheless, directly testing such models (which would predict a high density of PAT proteins on nascent LDs) may be feasible in the future. In conclusion, we demonstrate here a practical methodology for light microscopic estimation of total LD volume in single cells. It does not require LDs to be independently resolvable in the experimental cells, in contrast to previously described methods. As it is rapid and fully automated, it may be suitable for a range of cell biological applications including high-content and high-throughput screening when per-cell estimates of lipid loading are required. Although the methodology as described is suitable for confocal microscopy, extension to deconvolution or even super-resolution microscopy may be possible.
Our measurement of the density of tagged PAT protein on the LD surface at biologically important concentrations provides important constraints on the possible models for the function of PAT proteins, and demonstrates the utility of devising quantitative techniques capable of making such determinations.
Footnotes
Acknowledgements
We wish to acknowledge the Advanced BioImaging Facility in the McGill University Cell Imaging and Analysis Network for access to the Quorum WaveFX spinning disk confocal system. We are grateful to Alan Ehrlicher for use of a Leica SP8 confocal microscope.
Competing Interests
The author(s) declared no potential conflicts of interest with respect to the research, authorship, and/or publication of this article.
Author Contributions
All authors have contributed to this article as follows: JFP and SYD designed and performed the experiments, analyzed the data, and wrote the manuscript. JFP wrote the computer software used in this study.
Funding
The author(s) disclosed receipt of the following financial support for the research, authorship, and/or publication of this article: This work was funded by the National Science and Engineering Research Council of Canada (RGPIN 262240-11, RGPAS 412298-11).
References
Supplementary Material
Please find the following supplemental material available below.
For Open Access articles published under a Creative Commons License, all supplemental material carries the same license as the article it is associated with.
For non-Open Access articles published, all supplemental material carries a non-exclusive license, and permission requests for re-use of supplemental material or any part of supplemental material shall be sent directly to the copyright owner as specified in the copyright notice associated with the article.