
Abstract
Because diabetes causes alterations in hepatic membrane fatty acid content, these changes may affect the Na+, K+-ATPase. In this study we documented the effects of streptozotocin (STZ)-induced diabetes on hepatic Na+, K+-ATPase catalytic α1-subunit and evaluated whether these changes could be normalized by fish oil supplementation. Two groups of diabetic rats received fish oil or olive oil supplementation. Both groups had a respective control group. We studied the localization of catalytic α1-subunit on bile canalicular and basolateral membranes using immunocytochemical methods and confocal laser scanning microscopy, and the Na+, K+-ATPase activity, membrane fluidity, and fatty acid composition on isolated hepatic membranes. A decrease in the α1-subunit was observed with diabetes in the bile canalicular membranes, without changes in basolateral membranes. This decrease was partially prevented by dietary fish oil. Diabetes induces significant changes as documented by enzymatic Na+, K+-ATPase activity, membrane fluidity, and fatty acid content, whereas little change in these parameters was observed after a fish oil diet. In conclusion, STZ-induced diabetes appears to modify bile canalicular membrane integrity and dietary fish oil partly prevents the diabetes-induced alterations.
Keywords
T
Among various changes induced by diabetes on Na+, K+-ATPase in different tissues, alterations in lipid composition and the physical state of liver microsomal membranes have been shown (Clandinin et al. 1985; Dang et al. 1989). These changes may affect the Na+, K+-ATPase catalytic α1-subunit expression that has been shown to be decreased or increased by diabetes depending on the organ (Ng et al. 1993; Barada et al. 1994). However, the hepatic Na+, K+-ATPase distribution in STZ-induced diabetes has not been studied. Furthermore, the activity of Na+, K+-ATPase may be influenced by diet, such as fish oil (Gerbi et al. 1993b,1994). Dietary polyunsaturated fatty acids of the series n-3, present in fish oil, can have a potential beneficial effect in various diseases (Simopoulos 1991) and particularly in diabetes (Gerbi et al. 1997). In this work we studied the localization of Na+, K+-ATPase catalytic α1-subunit using immunocytochemical methods and confocal laser scanning microscopy in diabetic and nondiabetic control rat hepatocytes and quantified the staining with an image analysis method. We checked the effects of STZ-induced diabetes by measuring the Na+, K+-ATPase membrane activity, membrane fluidity, and fatty acid content. We then evaluated the effect of a fish oil (n-3 fatty acids) diet on these parameters.
Materials and Methods
Animals
Five-week-old male Sprague-Dawley rats weighing approximately 200 g were randomly divided into four groups of six each. In two groups, diabetes was induced by IV injection of streptozotocin (STZ) at 60 mg/kg (Sigma; L'Isle d'Abeau, Chesne, France) diluted immediately before injection in citric acid buffer (0.01 mol/liter, pH 5.5). One group of diabetic animals (DM) was fed the standard rat chow diet supplemented with n-3 fatty acid-enriched fish oil concentrate (MaxEPA; Pierre Fabre Santé, Castres, France) administered over 8 weeks at a daily dose of 0.5 g/kg by gavage. This supplement is rich in eicosapentaenoic acid [EPA, C20:5 (n-3)] and docosahexenoic acid [DHA, C22:6 (n-3)]. The other group of diabetic animals (DO) was fed a standard rat chow diet supplemented with olive oil. The rats were fed with fish oil or olive oil after induction of diabetes with STZ. Diabetic rats were not treated with insulin. The nondiabetic control groups were also fed a standard rat chow diet supplemented with olive oil (CO) or with n-3 fatty acid-enriched fish oil (CM). Olive oil was chosen as the placebo because it does not contain n-3 fatty acids. Water was given ad libitum to all groups. All animal treatments adhered strictly to all institutional and national ethical guidelines. Blood samples were collected regularly from the tip of the tail, and blood glucose was measured with a reagent strip (Reflolux; Boehringer Mannheim, Mannheim, Germany). The results confirmed that all rats treated with STZ were diabetic. After 8 weeks, at the age of 13 weeks, animals were sacrificed by decapitation. The mean body weights were measured before IV injection of STZ and at the end of the study (Table 1). After 8 weeks of STZ treatment, body weight gain of diabetic animals (DO, DM) was greatly reduced compared with that of control animals (CO, CM).
Effects of STZ-induced diabetes and dietary fish oil supplementation on body weight and plasma glucose levels a
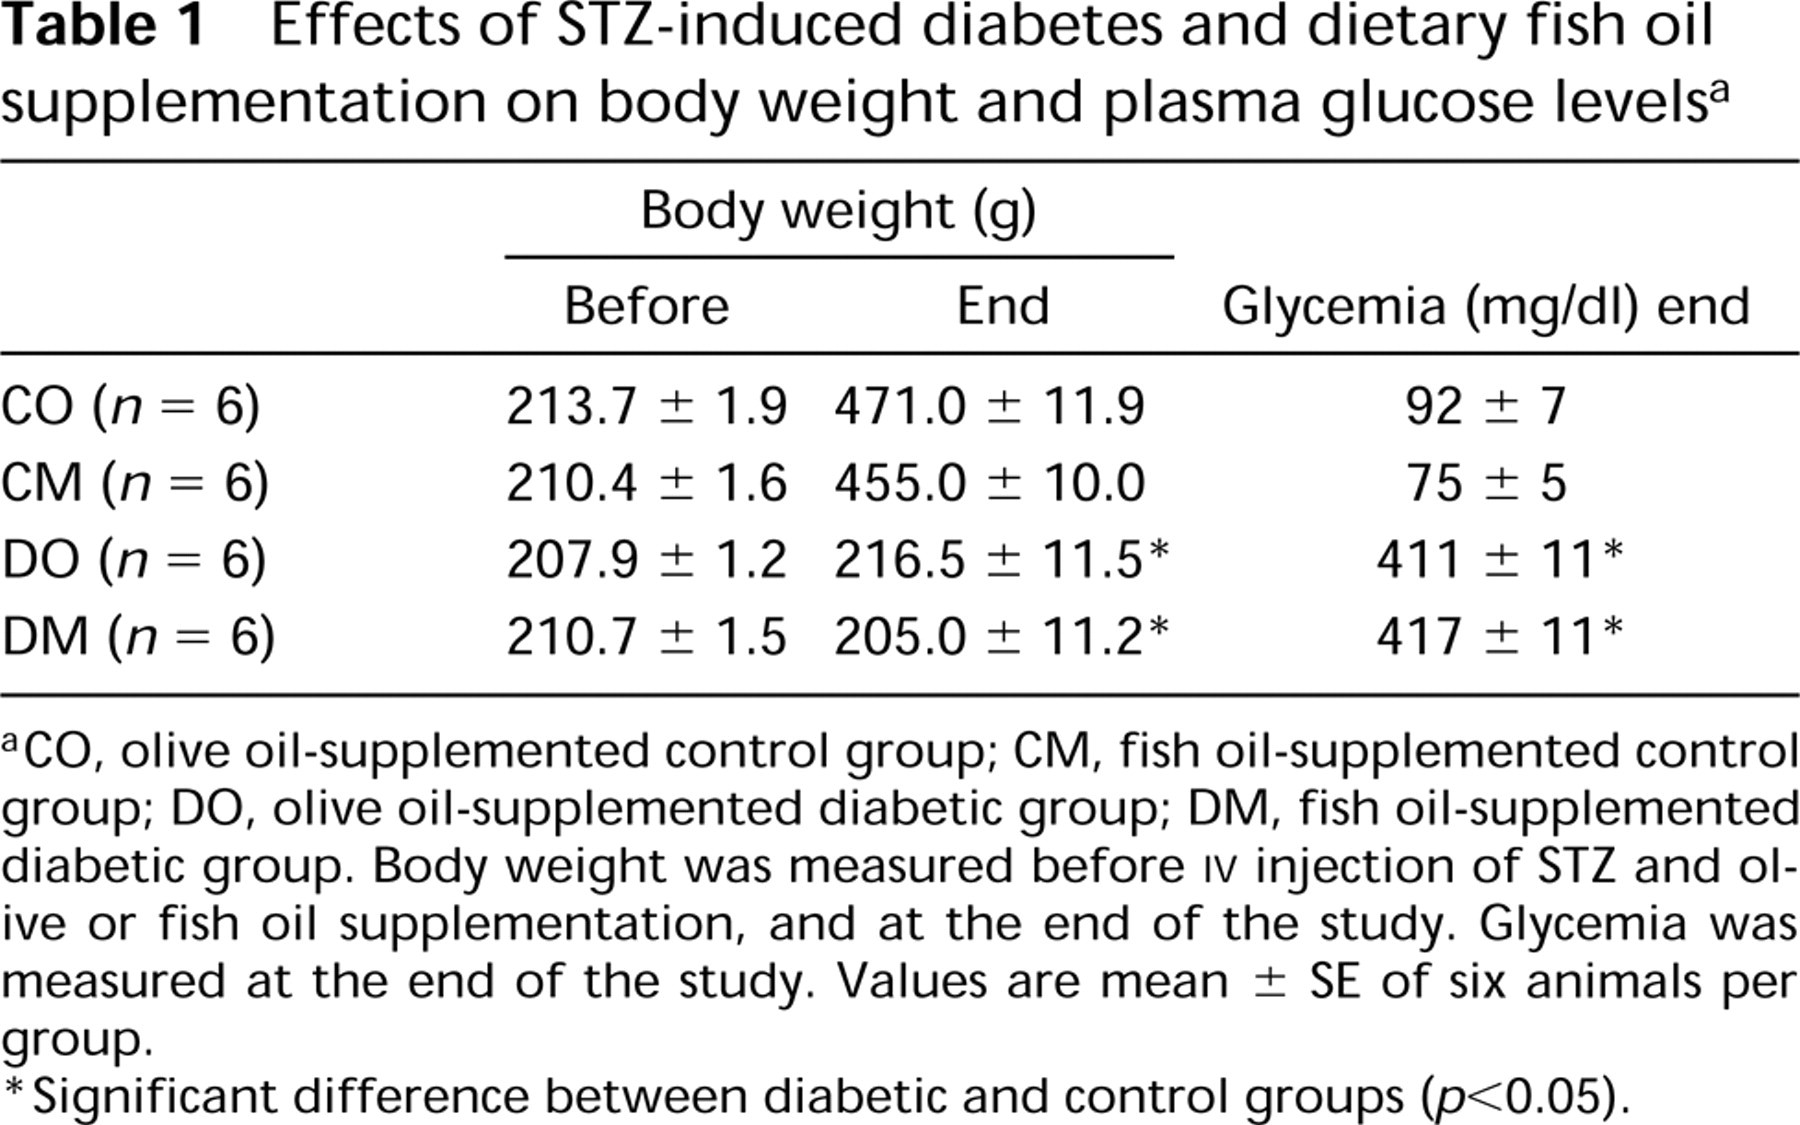
aCO, olive oil-supplemented control group; CM, fish oil-supplemented control group; DO, olive oil-supplemented diabetic group; DM, fish oil-supplemented diabetic group. Body weight was measured before IV injection of STZ and olive or fish oil supplementation, and at the end of the study. Glycemia was measured at the end of the study. Values are mean ± SE of six animals per group.
∗Significant difference between diabetic and control groups (p<0.05).
Immunocytochemical Analysis
Liver specimens were obtained immediately after death, rapidly rinsed with ice-cold physiological serum for less than 30 sec, frozen in liquid nitrogen, and stored at —80C until required. Samples of liver were cut into 5-μm sections at — 20C using a cryostat. Liver sections were dried, fixed with 100% acetone for 10 min at 4C, and rapidly rehydrated in PBS, pH 7.2, for 2 min. Unspecific binding sites were blocked for 10 min at 37C with undiluted normal goat serum (Immunotech; Marseille, France). Liver sections were then incubated for 2 h at 37C with the primary antibody, a rabbit polyclonal antibody F against the Na+, K+-ATPase α1-subunit, provided by Dr E. Feraille (Nephrology Laboratory, Hôpital Cantonal; Geneve, Switzerland), diluted 1:100 in PBS and 2% bovine serum albumin (BSA) (Sigma; Saint-Quentin Fallavier, France). The sections were washed twice with PBS (5 min each) and incubated for 1 hr at room temperature (RT) with the secondary antibody, biotin-conjugated F(ab')2 fragment goat anti-rabbit IgG (H + L) (ref. O830; Immunotech) diluted 1:50 in PBS and 2% BSA. Sections were then washed twice with PBS (5 min each) and treated for 1 hr at RT with streptavidin-fluorescein (ref. 0307) diluted 1:50 in PBS, and mounted in aqueous permanent mounting medium. For control experiments, in each case a slide was incubated with nonimmune rabbit serum (ref. HK117-5R; BioGenex, San Ramon, CA) diluted 1:100 in PBS, instead of anti α1-subunit antibody. The rabbit polyclonal antibody F against the Na+, K+-ATPase α1-subunit was evaluated for its isoform specificity by Western blotting with cerebral and kidney membranes (not shown). The sections were observed with a confocal laser scanning microscope (Leica; Heidelberg, Germany) with a × 40 objective. Immunolocalization of hepatic α1-subunit in control and diabetic groups is shown in Figures 1A, 1B, 2A, and 2B.
Image Processing Analysis
Images were transferred to an IBM-compatible computer by real-time digitization of the video output of the confocal microscope with a PC Vision + card (Imaging Technology; Bedford, MA) allowing 8-bit accuracy (i.e., 256 gray levels). The linearity of the acquisition was checked by digitizing artificial images constructed with the confocal microscope computer and spanning the entire range of intensities (Kaplanski et al. 1994). Images were then processed with a previously described analysis system developed by the same laboratory (André et al. 1990). The background fluorescence always comprised between levels 20 and 30. The brightness of extracellular pixels was then set to zero to allow direct display of cellular areas. The contour of labeled areas was then constructed with a standard boundary-follow algorithm, using a threshold 16 units higher than the background. The staining was calculated as the ratio between total fluorescence of the area (total specific fluorescence) and the surface of this area (mean specific fluorescence, MSF). Area was expressed in pixels (a pixel represented a rectangular area of 0.25 × 0.25 μm2). Mean values of six bile canaliculi and basolateral membranes for each rat were then calculated.
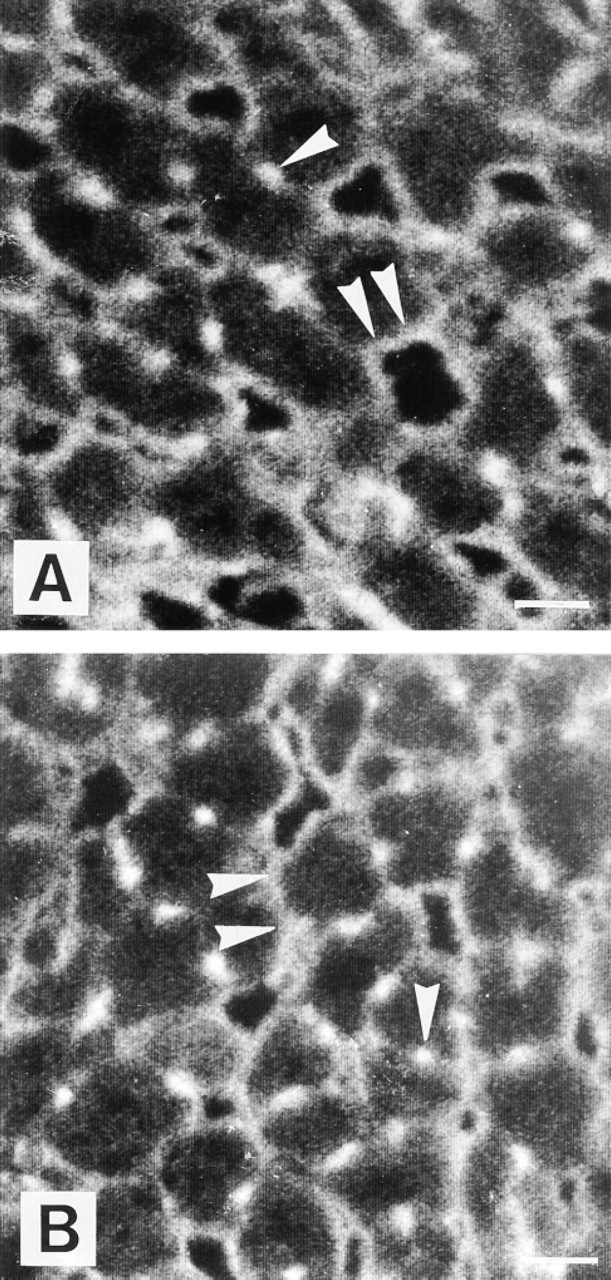
Immunocytochemical localization of Na+, K+-ATPase α1-subunit in rat hepatocytes from control groups CO (
Liver Plasma Membrane Isolation
Livers were removed, rapidly rinsed with ice-cold physiological saline for less than 30 sec, frozen in liquid nitrogen, and stored at — 80C until required. Frozen pieces of liver (300 mg) were homogenized directly in ice-cold buffer containing 8% saccharose, 0.1 mM phenylmethane sulfonyl fluoride, 1 mM EDTA, and 30 mM imidazol-HCl, pH 7.4, at 25C with a polytron PT 10 (20 sec, setting 5) (Maixent et al. 1991). The homogenate was subfractionated by three sequential differential centrifugations at 120 × g for 5 min, 6800 × g for 15 min, and 48,380 × g for 30 min, using a JA.20 rotor in the Beckman J2.21 centrifuge (Beckman Instruments; Gagny, France). The final pellet was resuspended in 8% saccharose and 30 mM imidazol-HCl, pH 7.4, at 25C and stored at — 80C until use. These preparations consisted of a membrane fraction highly enriched in Na+, K+-ATPase.
Enzyme Activity Measurements
Na+, K+-ATPase was determined using the coupled assay method as previously described (Gerbi et al. 1993a). The activity was measured in an ATP-regenerating medium by continuously recording NADH (reduced form of nicotinamide adenine dinucleotide) oxidation using a UNICAM 8700 spectrophotometer. Enzyme activities were measured at 37C. Each cell contained (final volume 1 ml) 50 mM KCl, 20 mM MgCl2, 500 mM NaCl, 10 mM phosphoenolpyruvate, 20 mM ATP, 150 mM imidazol-HCl, pH 7.4, 2 mMNADH, 3.5 units pyruvate kinase, and 5 units lactate dehydrogenase. The enzymatic reaction was initiated by the addition of protein (10 μ g). Enzyme activities are expressed as μmol Pi/hr/mg of protein. Protein content was determined by the method of Lowry et al. (1951), using BSA as a standard.
Membrane Fluidity
The hepatocyte membranes were labeled with DPH (diphenylhexatriene), a fluorescent probe (Sigma) known to enter cell membranes, by incubating equal volumes of a hepatocyte suspension containing 100 μ g/ml protein in phosphate buffer (5 mM NaH2Po4), 5 mM KCl, 145 mM NaCl, pH 7.4, and 2 μ M DPH suspension in the same buffer. The DPH suspension was prepared just before use by vigorous shaking from a 2 mM stock solution in dimethylformamide. Incubation lasted for 30 min at 37C, with gentle stirring in the dark. Fluorescence measurements were performed at 37C. Fluorescence polarization (p) and anisotropy (r) measurements were done on a model SLM 4800 polarization spectrofluorometer as described previously (Chautan et al. 1990). Excitation and emission wavelengths were 365 and 428 nm, respectively.
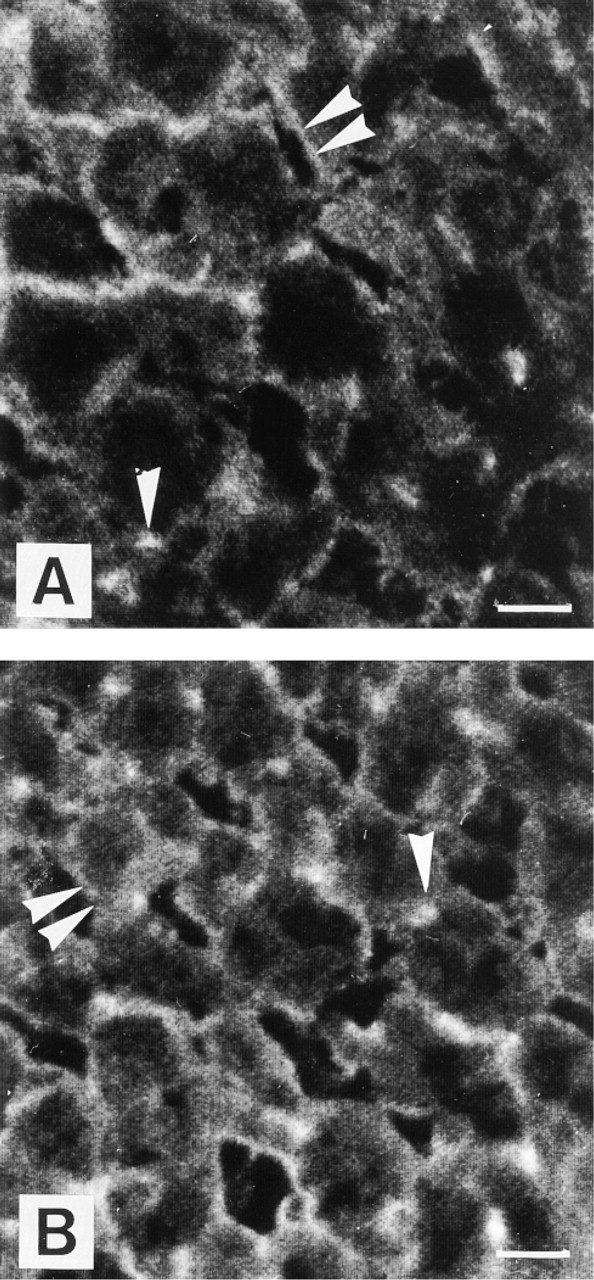
Immunocytochemical localization of Na+, K+-ATPase α1-subunit in rat hepatocytes from diabetic groups DO (A), DM (B) (DO, diabetic + olive oil; DM, diabetic + fish oil). The staining is localized along basolateral (double arrowheads) and bile canalicular membranes. Bile canaliculi appear as bright dots in cross-sections (arrowheads). In DM hepatocytes, the staining appears stronger than in DO hepatocytes. In DO hepatocytes, bile canaliculi are very slightly or not stained. Bars = 5 μm.
Fatty Acid Composition
Membrane lipids were extracted with methanol and chloroform according to the method of Bligh and Dyer (1959). Fatty acid composition was determined after methylation with BF3-methanol (Sigma) according to Ohta et al. (1990). The fatty acid methyl esters were quantified by gas chromatography (Perkin-Elmer AUTOSYSTEM XL, Norwalk, CT) using a flame ionization detector and a fused silica capillary (length 60 m, internal diameter: 0.22 mm) column (BP × 70; SGE, Villeneuve St Georges, France). Assays were carried out with a programmed oven temperature rise of 1C/min from 160 to 205C. Hydrogen was used as carrier gas under a pressure of 0.6 bar. Fatty acids were identified by comparing their retention times on the column with respect to appropriate standards.
Statistical Analysis
All results are expressed as mean ± SE. Results of immunocytochemical quantitative analysis were performed by using analysis of variance (ANOVA). The significant differences were determined by Fisher's post hoc least significant difference test and the Scheffé F-test at a probability value of 95%. Statistical evaluation of other results utilized an ANOVA procedure with Tukey test for multiple comparisons of normal distributions and the Kruskal-Wallis ANOVA with Dunn's test for multiple comparisons of nonparametric distributions (Sigmastat Statistical Software). Values of p<0.05 were considered statistically significant.
Results
Plasma glucose levels of STZ-treated rats were significantly elevated (Table 1). Daily supplementation with fish oil at 0.5 g/kg had no effect on the hyperglycemia.
Immunocytochemical Qualitative Analysis
The α1-subunit was localized to the BM and the BCM in control (CO, CM) and diabetic (DO, DM) groups. BCM appeared as fluorescent spots in cross-sections. The BCM and BM Na+, K+-ATPase α1-subunit localization was maintained in experimental diabetes groups (Figures 2A and 2B). In both diabetic groups, the staining was lower than in control groups at the level of bile canaliculi (Figures 2A and 2B). The fluorescence intensity observed in the DO group was lower than in the DM group. All the control studies using nonimmune rabbit serum were entirely devoid of staining.
Immunocytochemical Quantitative Analysis
Confocal images were studied quantitatively by measuring the intensity of the staining of BCM and BM α1-subunit. Figures 3 and 4 show the results of quantitative analysis performed on the BCM and BM Na+, K+-ATPase catalytic α1-subunit. Quantitative determination of bile canaliculi mean specific fluorescence (MSF) of control and diabetic rat hepatocytes revealed significant differences (Figure 3). Our qualitative results were corroborated by the comparison of MSF of diabetic groups to MSF of control groups, showing a significant decrease (p<0.05) in the staining of Na+, K+-ATPase α1-subunit. A decrease of 53% and 26% was observed in DO and DM groups, respectively. No significant differences of Na+, K+-ATPase α1-subunit between diabetic and control groups were observed in the BM (Figure 4). The n-3 fatty acid supplementation did not change the density of the catalytic subunit of Na+, K+-ATPase in control groups in either membrane. However, the decrease in bile canaliculi MSF observed in the DO group was partly prevented in the DM (DO vs DM, p<0.05). A significant restoration in the BCM by 27% was specifically associated to the n-3 fatty acid supplementation in the diabetic state. The changes induced by diabetes were limited to BCM. The BM was not modified by diabetes or by n-3 fatty acid supplementation.
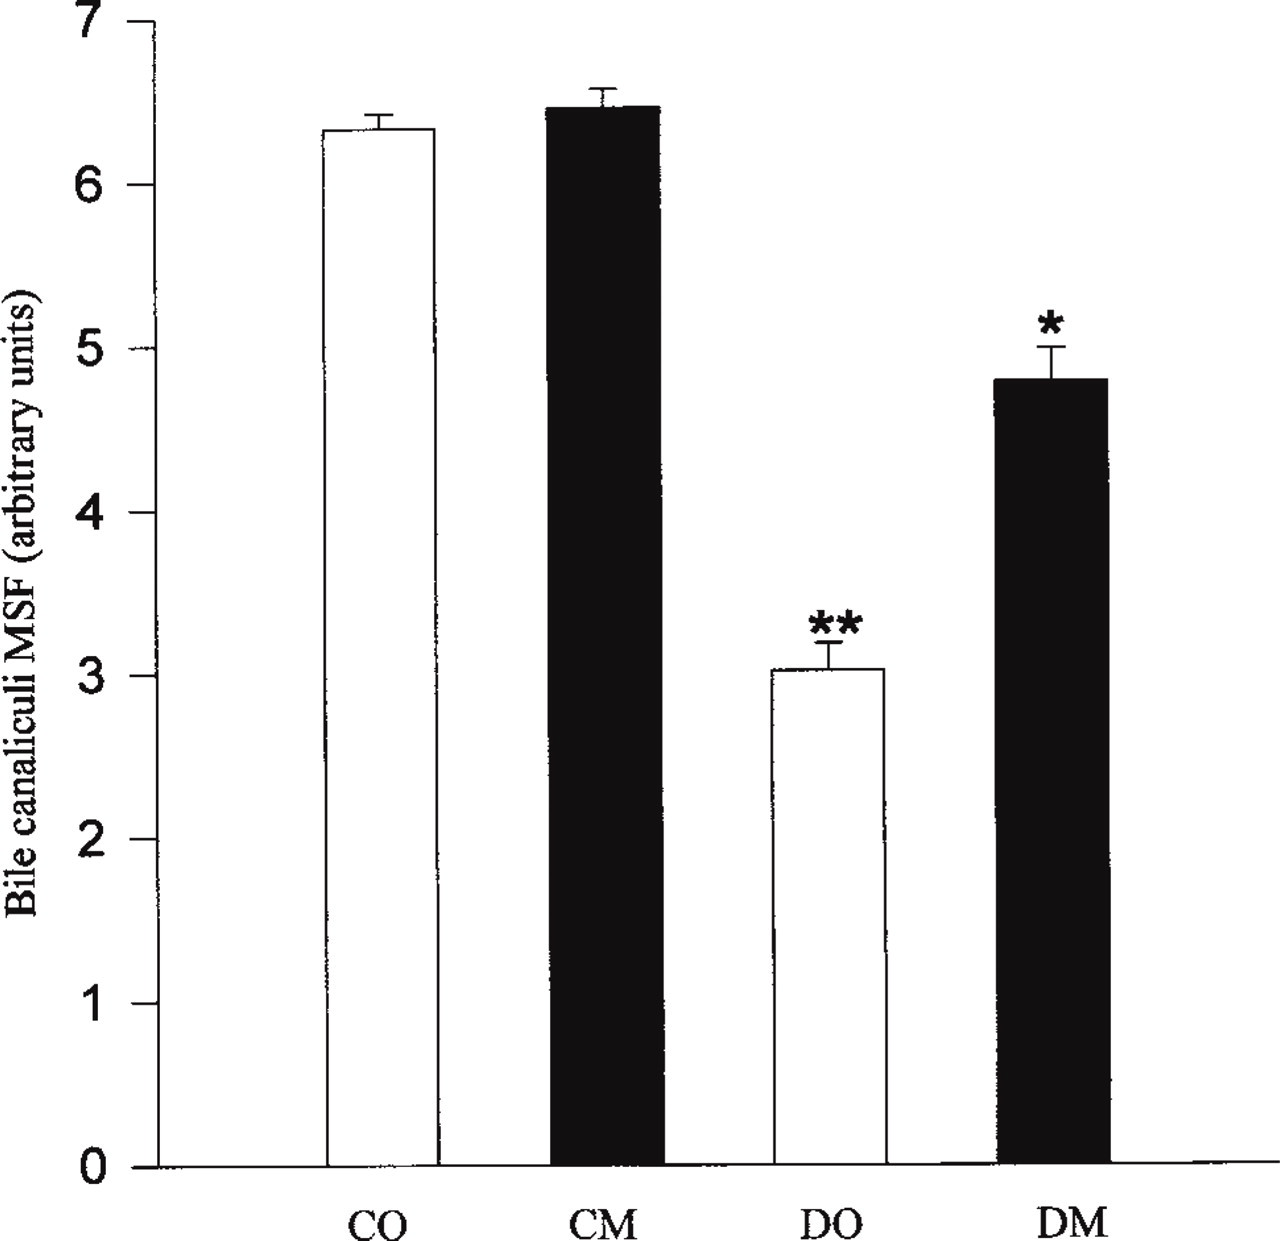
Quantitative determination of bile canaliculi α1-subunit mean specific fluorescence (MSF) from control (CO, CM) and diabetic (DO, DM) rat hepatocytes (CO, control + olive oil; CM, control + fish oil; DO, diabetic + olive oil; DM, diabetic + fish oil). Mean values of six samples in each group were pooled. Values are means ± SEM. ∗∗ Significant differences between DO and controls, DO and DM (p<0.05). ∗ Significant differences between DM and DO, DM and controls (p<0.05).
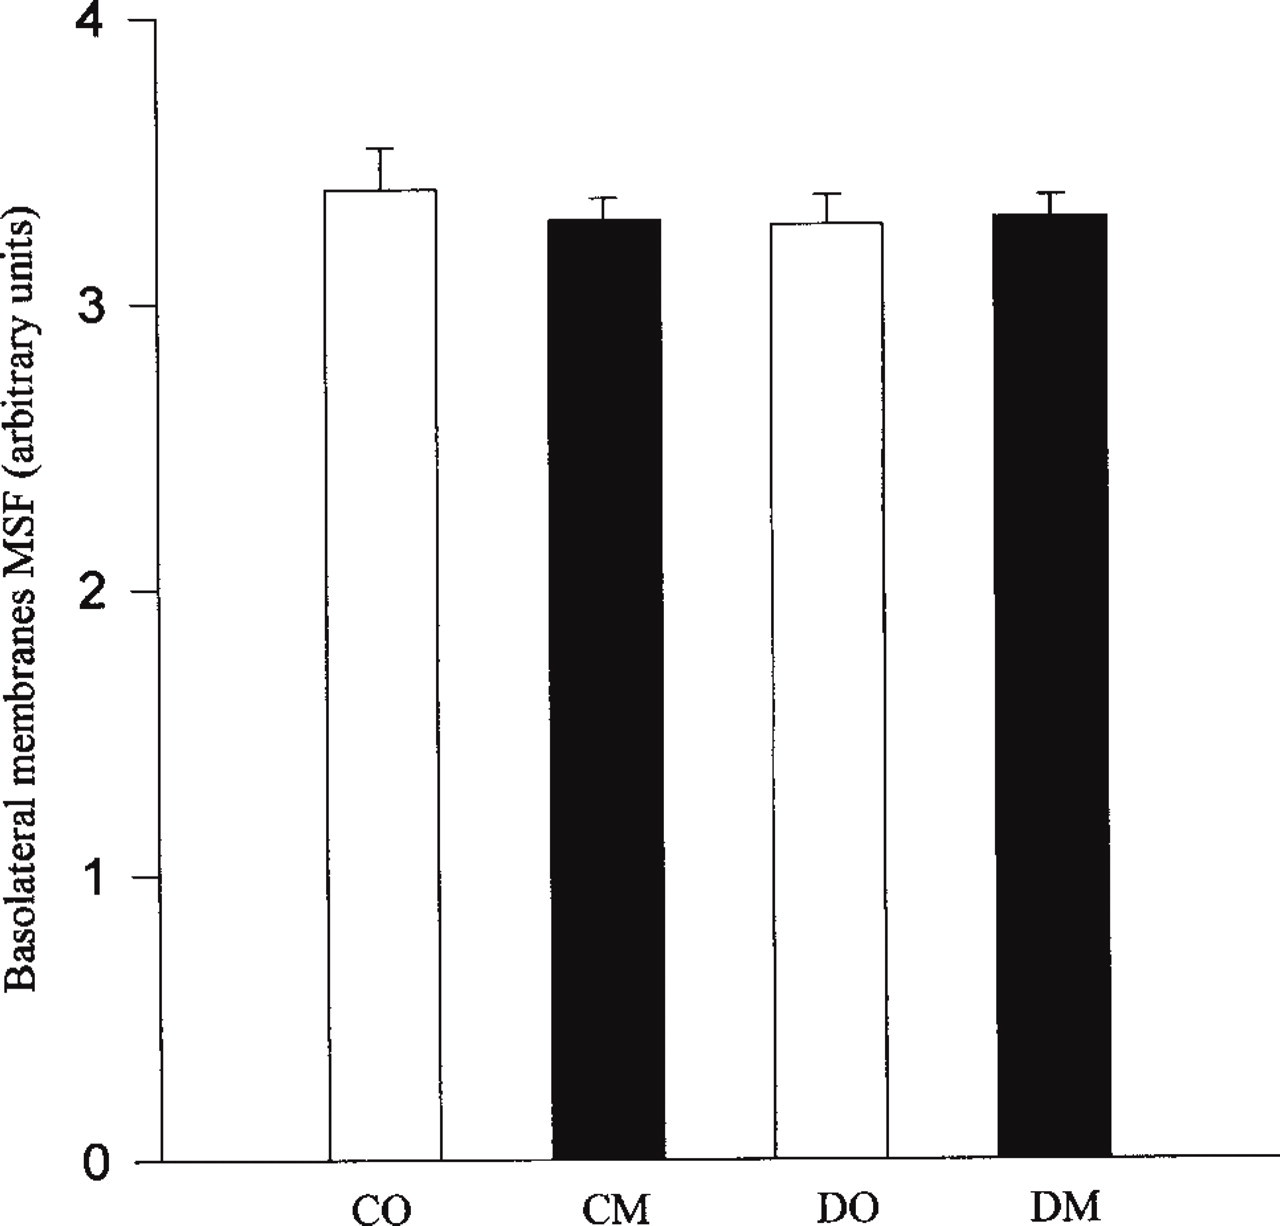
Quantitative determination of basolateral membrane α1-subunit mean specific fluorescence (MSF) from control (CO, CM) and diabetic (DO, DM) rat hepatocytes (CO, control + olive oil; CM, control + fish oil; DO, diabetic + olive oil; DM, diabetic + fish oil. Mean values of six samples were pooled in each group. Values are means ± SEM.
Liver Membrane Na+, K+-ATPase Activities
Figure 5 shows Na+, K+-ATPase activity in liver microsomal membranes from control (CO, CM) and diabetic rats (DO, DM). The enzyme activities were significantly increased by diabetes compared to their respective control groups (Figure 5). In STZ-induced diabetic rats, the Na+, K+-ATPase activity increased by 89% and 60%. Dietary fish oil (n-3 fatty acids) treatment had no effect on Na+, K+-ATPase activity. The activity in the CM and DM groups appeared higher than in the CO and DO groups, respectively (Figure 5), but the difference was not statistically significant.
Liver Membrane Lipid Fluidity
The fluorescence polarization (p) and anisotropy (r) were measured. Polarization and anisotropy values were higher in both diabetic groups than in control groups (Table 2), indicating that the membranes from diabetic groups were less fluid than those from control groups. These results were significant only in the DO group relative to the CO group (p<0.05).
Fatty Acid Composition of Liver Membranes
The composition of fatty acids in purified membranes from liver from rats with STZ-induced diabetes, with or without fish oil treatment, was determined and compared with that of the nondiabetic groups (Table 3).
The effect of diabetes (CO vs DO) in rats was a significant decrease in palmitoleic [16:1 (n-7)], oleic [18:1 (n-9)], arachidonic [20:4 (n-6)] and eicosapentaenoic [EPA, C20:5 (n-3)] acids, whereas the percentage of linoleic [C18:2(n-6)] and docosahexenoic [DHA, C22:6 (n-3)] acids was increased. This effect was not significant for polyunsaturated fatty acid (PUFA) amounts, but the total amount of monounsaturated fatty acids (MUFA) decreased significantly.
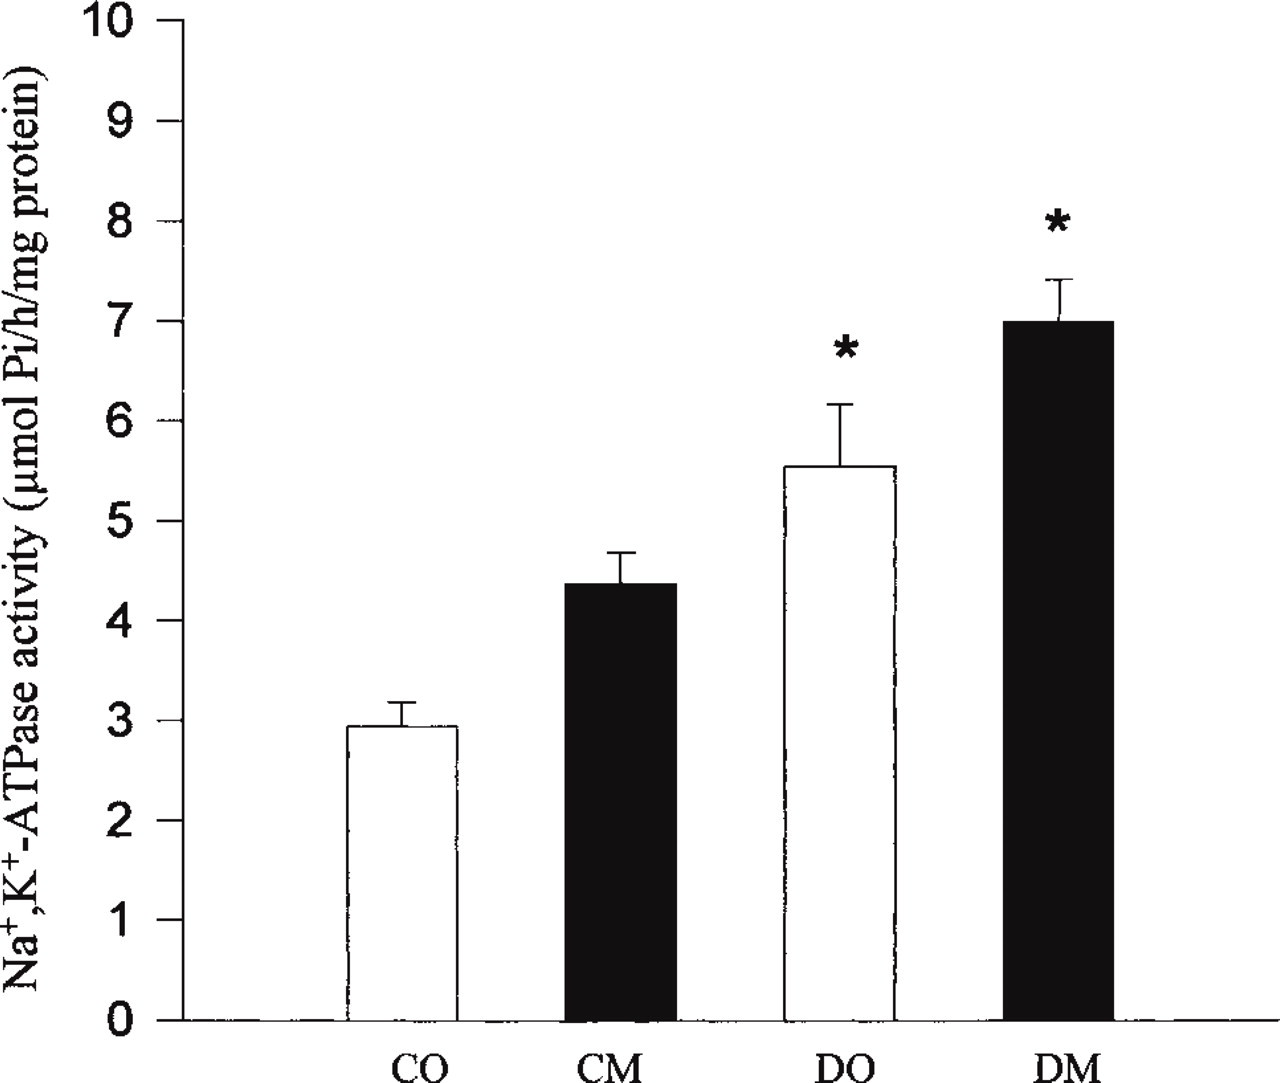
Na+, K+-ATPase activities were assayed in hepatic microsomal membranes from control (CO, control + olive oil; CM, control + fish oil) and STZ-treated diabetic rats (DO, diabetic + olive oil; DM, diabetic + fish oil) sacrificed at 8 weeks after onset of diabetes. Na+, K+-ATPase was measured as the difference between ATPase values in the absence and presence of 2 × 10⁻³ M ouabain. Data are presented as means ± SE of activities done in triplicate with six animals per group. ∗ Na+, K+-ATPase activity in diabetic groups (DO and DM) was significantly higher than that in respective control groups (p<0.01), whereas the fish oil treatment induced an increase in enzyme activity that is not significant.
The main effect of fish oil supplementation (CO vs CM) in rats was a significant decrease in [16:1 (n-7)] and [18:1(n-9)] fatty acids, whereas the percentage of [C18:2 (n-6)] fatty acid was significantly increased. This specific effect was not significant for PUFA, but the total amount of MUFA decreased significantly. After fish oil supplementation (DO vs DM) in diabetes, the [C18:2(n-6)] fatty acid levels decreased. No significant change in the percentage of oleic, arachidonic, and DHA fatty acids was observed, whereas the palmitoleic and EPA fatty acids levels increased significantly.
Discussion
The purpose of our study was twofold: first, to localize the hepatic Na+, K+-ATPase catalytic α1-subunit, and then to determine the effects of STZ-induced diabetes. Our second aim was to evaluate the effects of dietary fish oil on these diabetes changes.
Fluorescence polarization measurements in liver microsomal membrane in control and STZ-treated diabetic rats with or without fish oil supplementation a
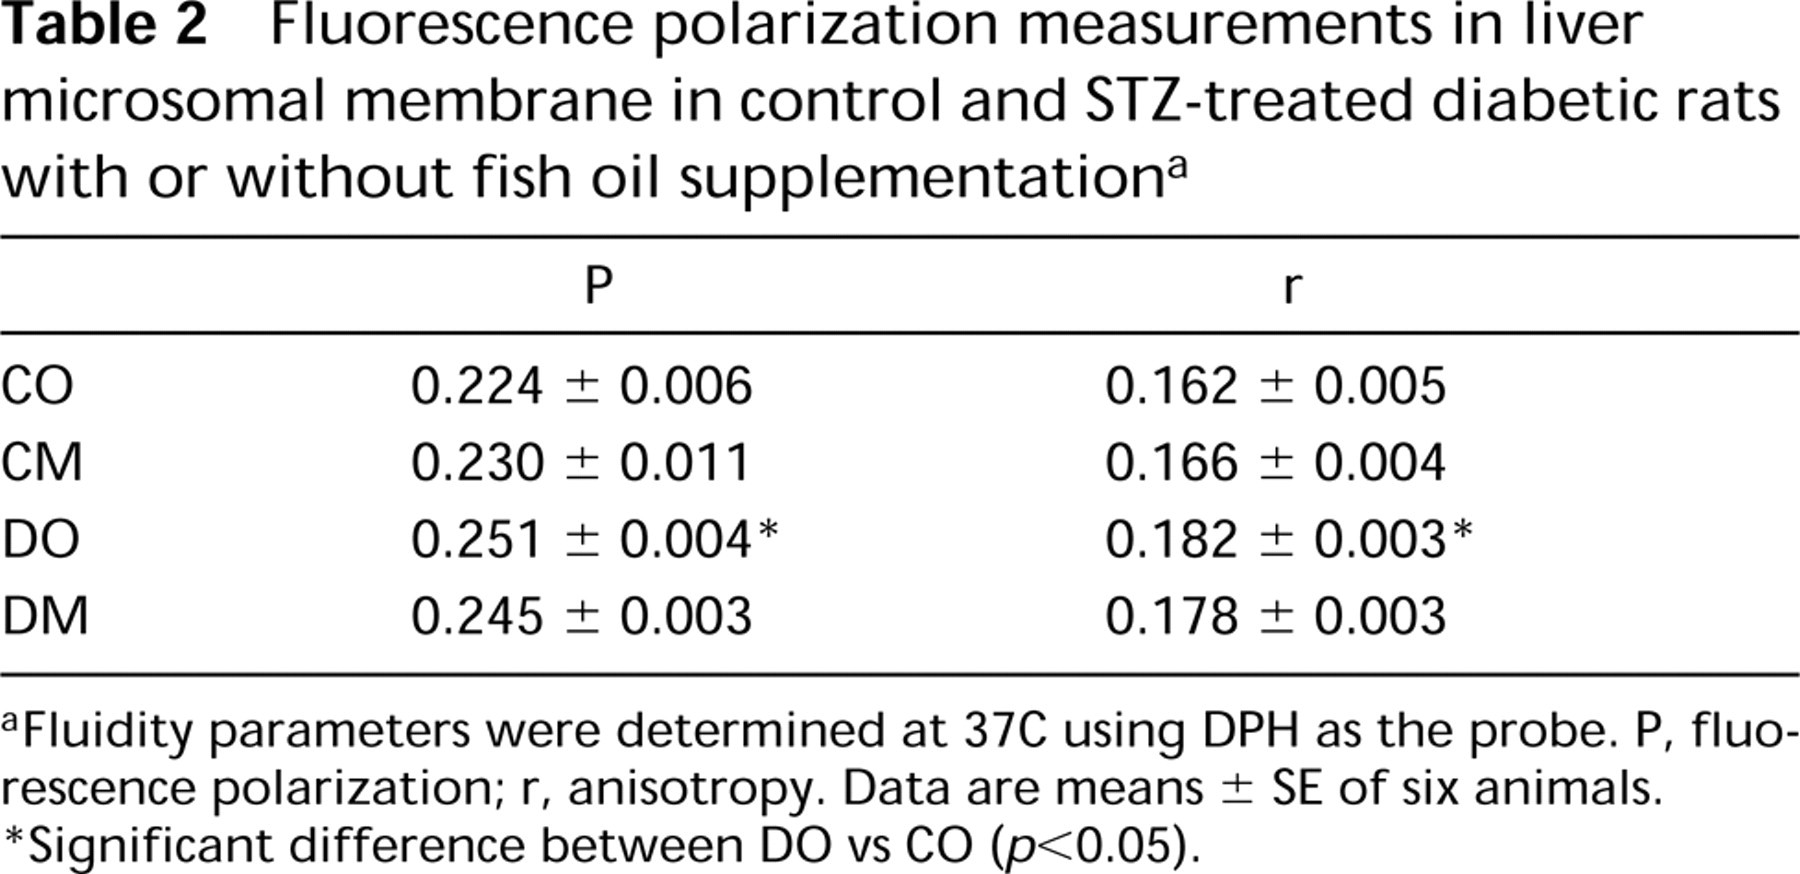
aFluidity parameters were determined at 37C using DPH as the probe. P, fluorescence polarization; r, anisotropy. Data are means ± SE of six animals.
∗Significant difference between DO vs CO (p<0.05).
In agreement with previous functional and biochemical studies, we found that the catalytic subunit is located on the BCM as well as on the BM (Schenk and Leffert 1983; Schenk et al. 1984; Simon et al. 1995). These results are similar to previous cytochemical and immunocytochemical localizations on human hepatocytes (Chamlian et al. 1988; Benkoël et al. 1995). There was a discrepancy between the bile canalicular localization of the α1-subunit and the basolateral localization found in a number of biochemical and cytochemical studies (Blitzer and Boyer 1978; Boyer et al. 1983; Gorvel et al. 1983; Takemura et al. 1984; Yamamoto et al. 1984; Leffert et al. 1985; Sztul et al. 1987; Chamlian et al. 1988; Hara et al. 1988; Benkoël et al. 1995; Simon et al. 1995). This controversy could be explained by variations in membrane lipid fluidity (Sutherland et al. 1988), mobility of Na+, K+-ATPase from basolateral membranes to apical membranes as described in renal epithelium (Molitoris 1993; Paller 1994), and the possibility that anti-α1-subunit antibody could recognize similar epitopes in Ca++-ATPase (Lingrel et al. 1990; Sellinger et al. 1990; Lemas et al.1994).
To our knowledge, the localization of hepatic Na+, K+-ATPase in experimental diabetes has not been studied. This report confirms a basolateral and bile canalicular localization of Na+, K+-ATPase α1-subunit in control and diabetic groups. However, the decreased density of the Na+, K+-ATPase catalytic α1-subunit induced by diabetes was limited to the BCM. The basolateral localization of the α1-subunit remains the same between control and diabetic groups. In contrast, the present study demonstrates that STZ-induced diabetes increases enzymatic activity of liver membranes, whereas the abundance of the α1-subunit decreases in BCM. Future study will be required to explain these contradictory findings and to determine the factors involved in the change in enzyme activity. The fact that α1-subunit density does not fully account for the increase in enzyme activity suggests that alterations in the membrane environment may also play a role. The mechanism regulating bile canaliculi Na+, K+-ATPase in hepatocytes can be explained by the fact that diabetes is a chronic disorder that induces alterations in total fatty acid content and in the physical state of liver membranes. Alterations in membrane fluidity and fatty acid content remain possible mechanisms responsible for decreased α1-subunit. Polarization and anisotropy measurements on membranes from diabetic groups indicate that their lipid structure behaves rigidly. This decrease in α1-subunit density can be attributed to changes in membrane fluidity. Sutherland et al. (1988) reported that membrane lipid fluidity affected Na+, K+-ATPase activity in the BCM. Changes in the fatty acid content of the liver membranes could be partly responsible for these observations. Changes observed in the membrane fatty acid content with a similar experiment design are comparable to those previously described in liver microsomal membranes from STZ-treated rats (Holman et al. 1983). These changes suggest an inhibition of Δ6- and Δ5-desaturase activity because final products of these enzymes were decreased by C20:4 (n-6) (arachidonic acid) and C20:5 (n-3) (EPA).
Effects of STZ-induced diabetes and fish oil supplementation on fatty acid composition of liver microsomal membranes a
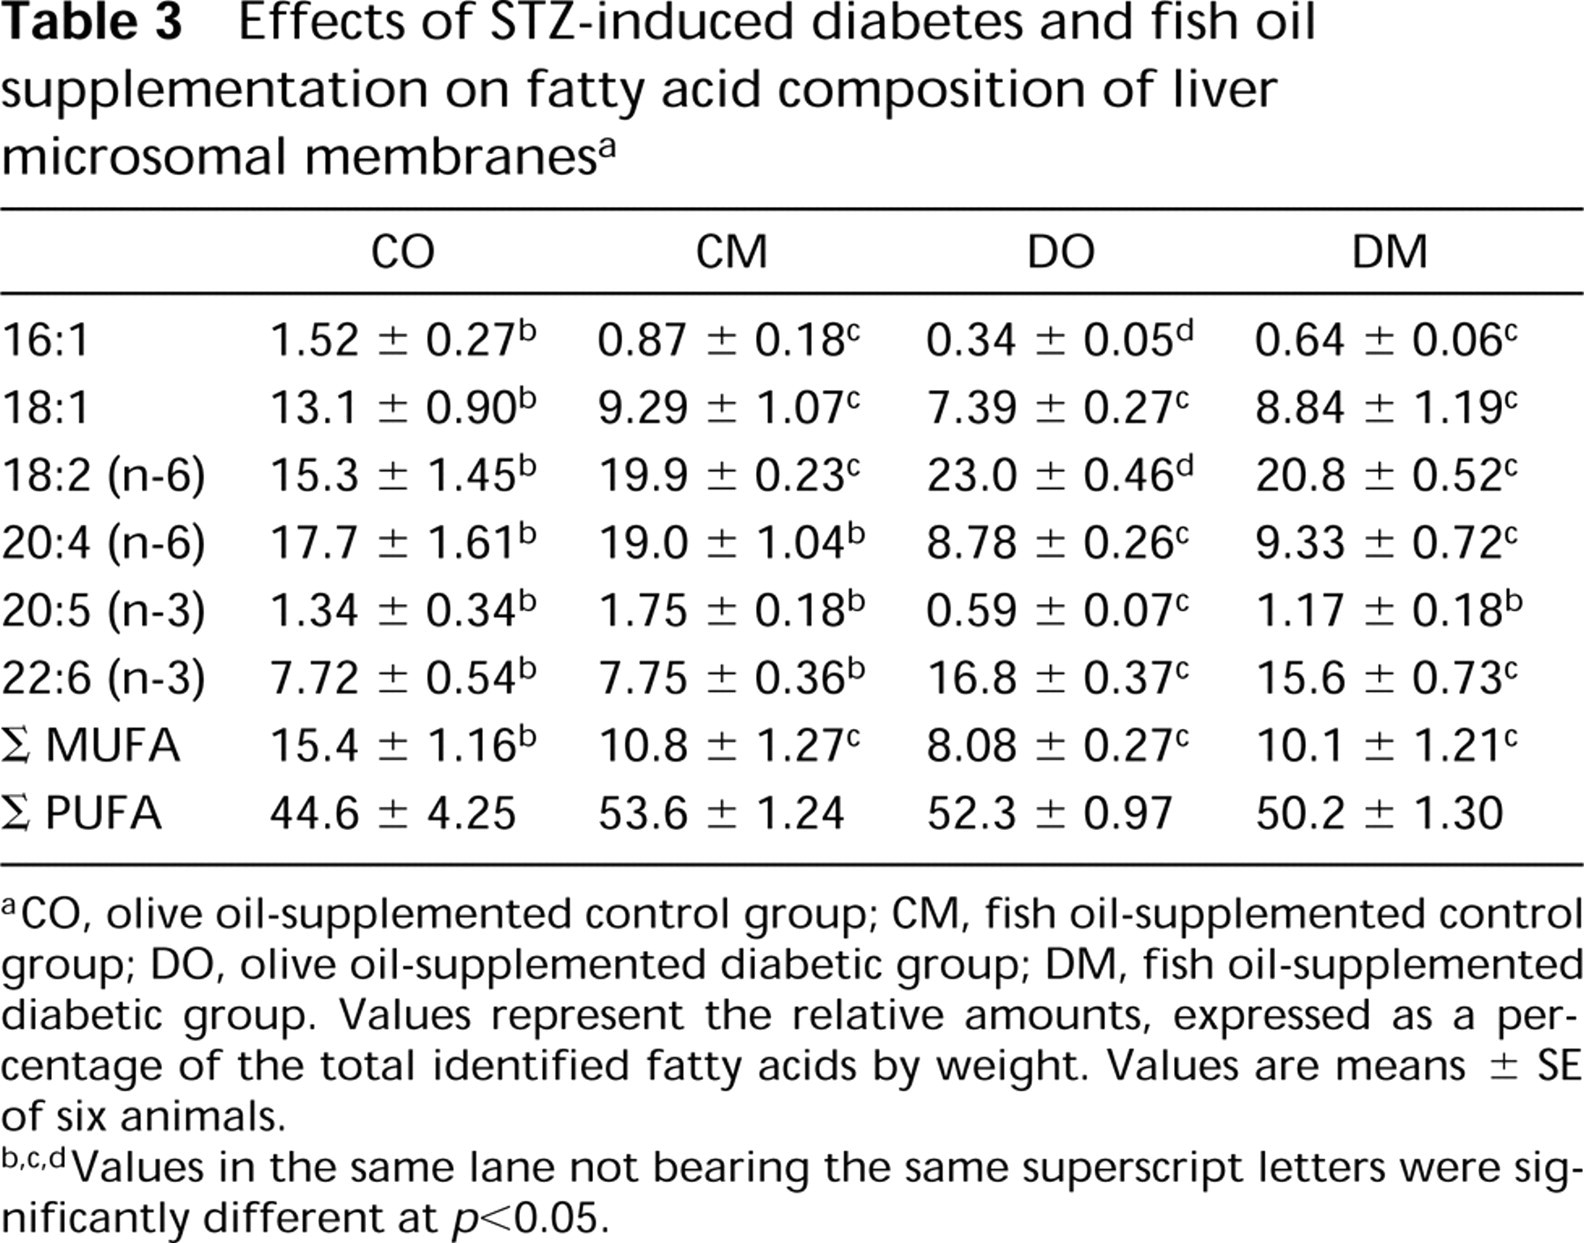
aCO, olive oil-supplemented control group; CM, fish oil-supplemented control group; DO, olive oil-supplemented diabetic group; DM, fish oil-supplemented diabetic group. Values represent the relative amounts, expressed as a percentage of the total identified fatty acids by weight. Values are means ± SE of six animals.
b,c,dValues in the same lane not bearing the same superscript letters were significantly different at p<0.05.
Concerning the mechanisms regulating bile canaliculi Na+, K+-ATPase in hepatocytes, we can speculate that the decreased α1-subunit density might be related to modification of fatty acid composition. This might alter the molecular configuration of the membrane, affecting the bound enzyme system and thus leading to the lowered activity, but this is not the case in our study. Diabetes is known to produce profound changes in hepatobiliary secretion. In the same experimental model of STZ-induced diabetes, Lu et al. (1997) reported that diabetes was associated with reduced canalicular glutathione secretion. Whether the decreased staining of BCM α1-subunit is associated with changes in biliary secretion remains to be determined.
The purpose of this study was to assess the ability of dietary fish oil to prevent diabetes-induced changes. In this study, fish oil did not affect the Na+, K+-ATPase catalytic α1-subunit under control conditions. We did not observe significant differences between control groups, whereas the decrease observed in diabetes-induced changes was prevented to a small degree by dietary fish oil. Moreover, dietary fish oil had no effect on enzymatic activity. The trend observed in diabetic groups was not significant in the fish oil-treated groups. Dietary fish oil affects the fatty acid composition of the liver membrane and prevents the decrease of eicosapentaenoic acid observed with STZ-induced diabetes. These biochemical effects may alter membrane architecture and enzymatic activities (Brasitus et al. 1985; Christon et al. 1988). This effect of fish oil may be explained by the fact that diets containing n-3 PUFA lead to a marked hypersecretion of cholesterol (Balasubramaniam et al. 1985; Lenaz 1987; Smit et al. 1991). Gerbi et al. (1997) reported that dietary fish oil changed the fatty acid content of myocardial membranes and prevented the diabetes-induced altered Na+, K+-ATPase activity.
In conclusion, this study demonstrates that Na+, K+-ATPase catalytic α1-subunit was altered in BCM by diabetes and was partly prevented by dietary fish oil, and suggests that fish oil therapy may be effective in preventing or treating some of the consequences of diabetes.
Footnotes
Acknowledgments
We are grateful to A-M Benoliel for scientific assistance and to Pr P. Bongrand (Immunology laboratory, Hôpital Sainte-Marguerite, Marseille).
We thank Dr E. Feraille for providing the antibody (Nephrology Laboratory, Hôpital Cantonal, Geneve). We would also like to thank P. Micel for English assistance.