
Abstract
The linker histone H1fx is the least characterized member of the H1 family. To investigate the developmental changes of H1fx, we performed an immunohistochemical analysis of its expression pattern from embryos to adult mice. We found that H1fx was highly expressed during gastrulation, and was positive in all embryonic germ layers between E8.5 and E10.5, which mostly overlapped with the expression of the proliferation marker Ki-67. Neural and mesenchyme tissues strongly expressed H1fx at E10.5. H1fx expression began to be restricted at around E12.5. Western blot analysis of brain tissues demonstrated that the total expression level of H1fx gradually decreased with time from E12.5 to adulthood, whereas H1f0 was increased over this period. In adult mice, H1fx was restrictively expressed at the hypothalamus, subventricular zone, subgranular zone, medulla of the adrenal grand, islets of Langerhans, and myenteric plexus. Taken together, these data suggest that H1fx is preferentially expressed in immature embryonic cells and plays some roles in cells with neural properties.
Introduction
Histones are highly basic proteins composed of nucleosomes, and play key roles in maintaining genomic organization and integrity. The linker histone H1 family proteins are associated with the nucleosome core and linker DNA near the DNA entry-exit points, which results in high-order chromatin structures.1–3
In mammals, the H1 family proteins include 11 variants: seven somatic H1s (H1.0, H1.1–H1.5, H1.10) and four germ cell-specific H1s (TSH1.6–TSH1.7, OOH1.8, TSH1.9).4,5 H1.1 to H1.5 are referred to as the cluster H1, as they are encoded in tandem at the same chromosome. They also share high homology in their DNA sequences. In this article, we adopt the gene names as nomenclature for the H1 variants: We designate the product of H1f0 as H1.0, that of H1fx as H1.10, and that of H1foo as OOH1.8. Among these variants, H1f0, H1fx, and H1foo are expressed in a replication-independent manner. Their mRNAs contain polyadenylation sequences and are transcribed independently of DNA synthesis. The others, including the cluster H1 variants, are transcribed during the S phase of the cell cycle in a replication-dependent manner, and contain a stem-loop structure instead of the polyadenylation sequence found in canonical core histones.
The replication-independent H1 member H1foo is expressed in the oocytes in which H1f0 is stored as both a maternal mRNA and protein. After the first cleavage of fertilized eggs, the expression of H1foo is significantly decreased, and in 4-cell stage embryos it becomes undetectable.6–8 Conversely, the cluster H1 members are induced through the major zygotic gene activation, and incorporated into the chromatin. 9 To date, each of the somatic H1 members (H1f0, and H1.1–H1.5) has been investigated only as a percentage of the total histones in midgestation embryos,10,11 and the individual expression patterns in the subsequent stages of embryogenesis have not been fully defined. H1f0 is rarely expressed during embryogenesis; rather, it is accumulated in the terminally differentiated cells at the postnatal stage.12,13 Histochemical studies in adult mice revealed that H1f0 was strongly expressed in the kidney, hippocampus, and cerebellum. 14 The accumulation of H1f0 also coincides with the terminal differentiation of the brain cortex. Cluster H1 members come to show different expression patterns after birth.15,16 It is generally considered that linker histone variants play redundant roles during mouse development. Although the single-knockout mice of each H1 variant are phenotypically normal,17,18 the triple-knockout mice of H1.2, H1.3, and H1.4 caused the embryonic lethality at E11.5 by a broad spectrum of developmental defects.11,19
In terms of H1fx protein, there has been no report about its expression pattern during mammalian embryogenesis. H1fx is the most recently identified and thus the least characterized of the H1 family members. At first, the H1fx gene was cloned as a novel histone in humans. 20 The amino acid sequence of H1fx had low similarity not only with the other H1 family members in the same species but also with H1fx of other species. 21 H1fx has been characterized as the linker histone accumulated at the nucleoli during the G1 phase.21,22 H1fx showed higher expression in tumor cells than in the surrounding normal cells both in human endocrine tumors 23 and astrocytic gliomas. 24 H1fx is thought to exert suppressive actions against differentiation, as the treatment of human embryonal carcinoma NT2 cells with retinoic acid brought about recruitment of the H1fx protein to the 5′-upstream region of the nanog gene, a marker of stemness, which suppressed the expression of nanog. 25 However, despite investigations using human ES cells, HeLa cells, and breast cancer cells, it is still unclear how H1fx is regulated during the cell cycle, and whether H1fx is involved in retaining pluripotency.21,26,27 Recent studies in breast cancer cells revealed that the H1fx protein bound to the coding region, RNA polymerase II–enriched regions, and hypomethylated CpG islands in the genome, which were totally different from those of H1f0.28,29 Furthermore, H1fx possesses significantly lower binding affinity to DNA/nucleosome and histone chaperone, which causes its rapid translocation to regulate differential gene expression and chromatin remodeling.30,31 Although previous in vitro studies suggested that H1fx played important roles in the transcriptional regulation, in vivo examinations will be needed to clarify its physiological function. In the present study, therefore, we sought to determine the expression patterns of H1fx to properly characterize this protein.
In regard to its role in development, H1fx has been shown to be detected in the early-embryo histone fraction in Xenopus. 32 Mouse H1fx was described as one of the genes significantly reduced in the Foxa2-null E7.5 embryo, in which the organizer was impaired. 33 This result indicates that H1fx would be involved in the gastrulation stage. An in situ hybridization of the E14.5 embryo revealed that H1fx is expressed in the medulla of the adrenal gland (Eeurxpress database, www.eurexpress.org/). 34 H1fx null mice were reported to develop normally, but showed some abnormalities such as increased circulating sodium level and decreased total body fat amount (IMPC database, www.mousephenotype.org/). 35 To clarify the developmental changes of H1fx, we compared the expressions of H1fx and H1f0, especially during the embryonic stages. Our results showed that H1fx expression was regulated in a dynamic spatio-temporal manner.
Materials and Methods
Animals and Tissue Preparation
Pregnant, postnatal, and adult ICR mice were purchased from SLC Japan (Shizuoka, Japan). For the preparation of western blotting samples, isolated brains were immediately stored at −80C until use. The embryos and tissues were fixed with the 4% paraformaldehyde/phosphate-buffered saline (PBS). All procedures using experimental animals were performed according to the guidelines for the Animal Care and Use Committee of the Nagoya University Graduate School of Medicine.
Immunohistochemistry
The fixed tissues were dehydrated, embedded in paraffin, and cut into 5-µm sections. For immunohistochemistry, sections were deparaffinized, washed with PBS three times, and subjected to antigen retrieval using 10 mM citrate buffer, pH 6.0, for 20 min at 98C followed by standing for 40 min at 4C. For the detection using horse radish peroxidase (HRP), samples were treated with 0.3% H2O2 in advance. Samples were treated with 5% normal goat serum (NGS) in PBS for 30 min at room temperature, and incubated with primary antibodies diluted in 3% NGS at 4C overnight. The following primary antibodies were used: rabbit anti-H1X (anti-H1fx) polyclonal antibody (1:1500; Abcam, Cambridge, UK), mouse anti–Ki-67 monoclonal antibody (1:80; BD Biosciences, San Jose, CA), rabbit anti–E-cadherin polyclonal antibody (1:200; Cell Signaling Technology, Danvers, MA), mouse anti-Sox2 monoclonal antibody (1:600; Merck Millipore, Darmstadt, Germany), mouse anti-nestin monoclonal antibody (1:500; eBioscience, San Diego, CA), mouse anti-Sox10 monoclonal antibody (1:200; eBioscience), mouse anti-tyrosine hydroxylase monoclonal antibody (1:800; Merck Millipore), mouse anti-neuronal Nuclei (NeuN) monoclonal antibody (1:600; Merck Millipore), mouse anti-tubulin β-3 (TUJ1) monoclonal antibody (1:2500; BioLegend, San Diego, CA), rabbit anti-histone H1.0 (anti-H1f0) polyclonal antibody (1:500; GeneTex, Irvine, CA), and rabbit anti-calretinin (CR) polyclonal antibody (1:2500; Swant, Switzerland). For the control staining, either mouse or rabbit IgG (Merck Millipore) was used at 5 µg/ml. After washing with PBS, sections were incubated with goat biotinylated anti-mouse IgG antibody (1:100; BD Biosciences) or goat biotinylated anti-rabbit IgG antibody (1:100; BD Biosciences). Sections were treated with HRP–avidin–biotin solution (Vectastain ABC Elite kit; Vector Laboratories, Burlingame, CA) according to the manufacturer’s instruction, and signals were visualized by using a liquid DAB+ substrate chromogen system (Agilent Technologies; Santa Clara, CA). After counter-staining with hematoxylin, sections were dehydrated and mounted in the EUKITT mounting medium (ORSAtec GmbH; Freiburg, Germany). For fluorescent immunohistochemistry, the following second antibodies were used: AlexaFluor 488–labeled goat anti-mouse IgG (1:400; Thermo Fisher Scientific, Waltham, MA), AlexaFluor 488–labeled goat anti-rabbit IgG (1:400; Thermo Fisher Scientific), AlexaFluor 594–labeled goat anti-mouse IgG (1:400; Thermo Fisher Scientific), and AlexaFluor 594–labeled goat anti-rabbit IgG (1:400; Thermo Fisher Scientific). Sections were mounted with Slowfade Diamond Antifade (Thermo Fisher Scientific) with 4’,6-diamidino-2-phenylindole (DAPI; 1mg/L). Images were captured using an Olympus BX41 microscope with cellSens imaging software (Olympus Corp., Tokyo, Japan).
RNA Isolation and Quantitative Real-Time Polymerase Chain Reaction
Total RNA samples were purified from mouse tissues by Isogen II (Nippongene, Tokyo, Japan), and were reverse transcribed to cDNA by ReverTra Ace qPCR RT Master Mix with gDNA Remover (Toyobo, Osaka, Japan). Quantitative real-time polymerase chain reaction (qPCR) was carried out with Mx3005p Real-time QPCR System (Agilent) and THUNDERBIRD SYBR qPCR Mix (Toyobo). The primer sequences are as follows: β-actin forward, 5′-CACTGTCGAGTCGCGTCC-3′; β-actin reverse, 5′-CGCAGCGATATCGTCATCCAT-3′; H1fx forward, 5′-GGGCGCACCTACCTCAAGTA-3′; and H1fx reverse, 5′-CCCTCCAGCTTCTTGCGGTT-3′. The relative expression levels were calculated based on the ΔΔCt method.
Extraction of Histone Proteins From Brains
Brains isolated from E12.5 embryos were homogenized by pipetting in ice-cold nuclear isolation buffer (NIB; 15 mM Tris-Cl, pH 7.4, 60 mM KCl, 15 mM NaCl, 5 mM MgCl2, 1 mM CaCl2, and 250 mM sucrose) containing protease inhibitor cocktail [1 mM 4-(2-aminoethyl) benzenesulfonyl fluoride hydrochloride, 0.8 µM aprotinin, 15 µM E-64, 20 µM leupeptin hemisulfate monohydrate, 50 µM bestatin, and 10 µM pepstatin A; Nacalai Tesque, Kyoto, Japan]. Brains from E15.5 embryos and postnatal mice were minced with scissors in the ice-cold NIB/protease inhibitor cocktail, and homogenized by a glass homogenizer. Homogenates were centrifuged at 300 × g for 5 min at 4C. Each precipitate was transferred to a disposable homogenizer (Biomasher II; Nippi, Tokyo, Japan), and lysed in NIB containing 0.2% NP-40 and protease inhibitor cocktail for 10 min at 4C. The lysates were centrifuged at 700 × g for 5 min at 4C, and the supernatants were removed. NIB containing 0.2% NP-40 and protease inhibitor was added to each precipitate, and then the precipitates were resuspended and centrifuged at 700 × g for 5 min at 4C. After washing with NIB three times, the pellets were resuspended in ice cold 0.2 M H2SO4 by gentle pipetting, and incubated for 2 hr with gentle rocking at 4C. Then the samples were centrifuged at 3400 × g for 5 min at 4C. Each supernatant was transferred to a new tube, and mixed with a half volume of 100% trichloroacetic acid to prepare the 33% solution. After 1-hr incubation at 4C, the samples were centrifuged at 5000 × g for 5 min at 4C, and the supernatants were carefully removed by aspiration. After washing with cold acetone, the precipitates were dissolved in H2O as the histone fraction, the protein concentrations of which were measured by using a BCA assay kit (Thermo Fisher Scientific).
Western Blotting
The western blot analysis was performed as previously described. 36 Briefly, the histone fraction was mixed with the sodium dodecyl sulfate (SDS)–polyacrylamide gel electrophoresis sample buffer containing 50 mM dithiothreitol, and the mixture was applied to a 13.5% polyacrylamide gel and separated by electrophoresis. The separated proteins were electro-transferred onto a polyvinylidene difluoride membrane (Bio Rad, Hercules, CA) in the 10 mM N-cyclohexyl-3-aminopropanesulfonic acid (CAPS)–NaOH buffer, pH 10.5, containing 10% methanol at 4C. Membranes were blocked by 5% non-fat milk in Tris-Cl, pH 7.4, containing 150 mM NaCl and 0.1% Tween 20 [Tris-buffered saline with Tween (TBS-T)], and incubated primarily either with rabbit anti-H1X polyclonal antibody (1:2500; Abcam) or rabbit anti-H1.0 polyclonal antibody (1:1000; GeneTex). They were treated with secondary HRP-labeled goat anti-rabbit IgG polyclonal antibody (1:6000; Jackson ImmunoResearch Laboratories, West Grove, PA). After treatment with ECL PRIME (GE Healthcare Bio-Sciences; Piscataway, NJ), chemiluminescence was detected and analyzed by an Amersham Image Analyzer 600 (GE Healthcare Bio-Sciences). These membranes were incubated with a stripping buffer (TBS-T containing 1% SDS and 100 mM 2-mercaptoethanol) at 37C for 1 hr, washed with TBS-T, blocked with 5% non-fat milk in TBS-T, and re-probed with rabbit anti-histone H3 monoclonal antibody (1:5000; Cell Signaling Technology). Finally, they were treated with HRP-labeled goat anti-rabbit IgG polyclonal antibody, and the signals were detected and analyzed as described above.
Statistical Analysis
The quantified results of qPCR and western blot are presented as the means ± SDs. Statistical differences were evaluated by two-tailed Student’s t-test.
Results
H1fx Is Broadly and Strongly Expressed in E6.0–7.0 Embryos
We examined the expression of H1fx, in comparison with H1f0, during mouse embryogenesis. To provide a precise description of the early stages of embryogenesis, the Theiler stage number37–40 is indicated together with the embryonic day.
First, we immunostained the embryonic sections at two time points, E6.0 (TS8, before gastrulation) and E7.0 (TS10, gastrulation). E6.0, the advanced egg cylinder stage, is characterized by the formation of an ectoplacental cone, which is followed by the proamniotic cavity generation within the mass of primitive ectoderm called the epiblast. Each epiblast is surrounded by a layer of visceral endoderm.38,39 We found that H1fx was strongly positive at the extraembryonic ectoderm and the visceral endoderm, but slightly weak at the epiblast (Fig. 1A). In contrast, H1f0 was expressed at the visceral endoderm, but faint at the epiblast (Fig. 1B). E-cadherin and Ki-67, known as an epithelial cell marker and a proliferation marker, respectively, were ubiquitously expressed at the ectoplacental cone, extraembryonic ectoderm, visceral endoderm, and epiblast (Fig. 1C and D). Trophoblasts, including those in the decidual tissue around embryos, were strongly stained for H1f0 but not H1fx (Fig. 1A and B).
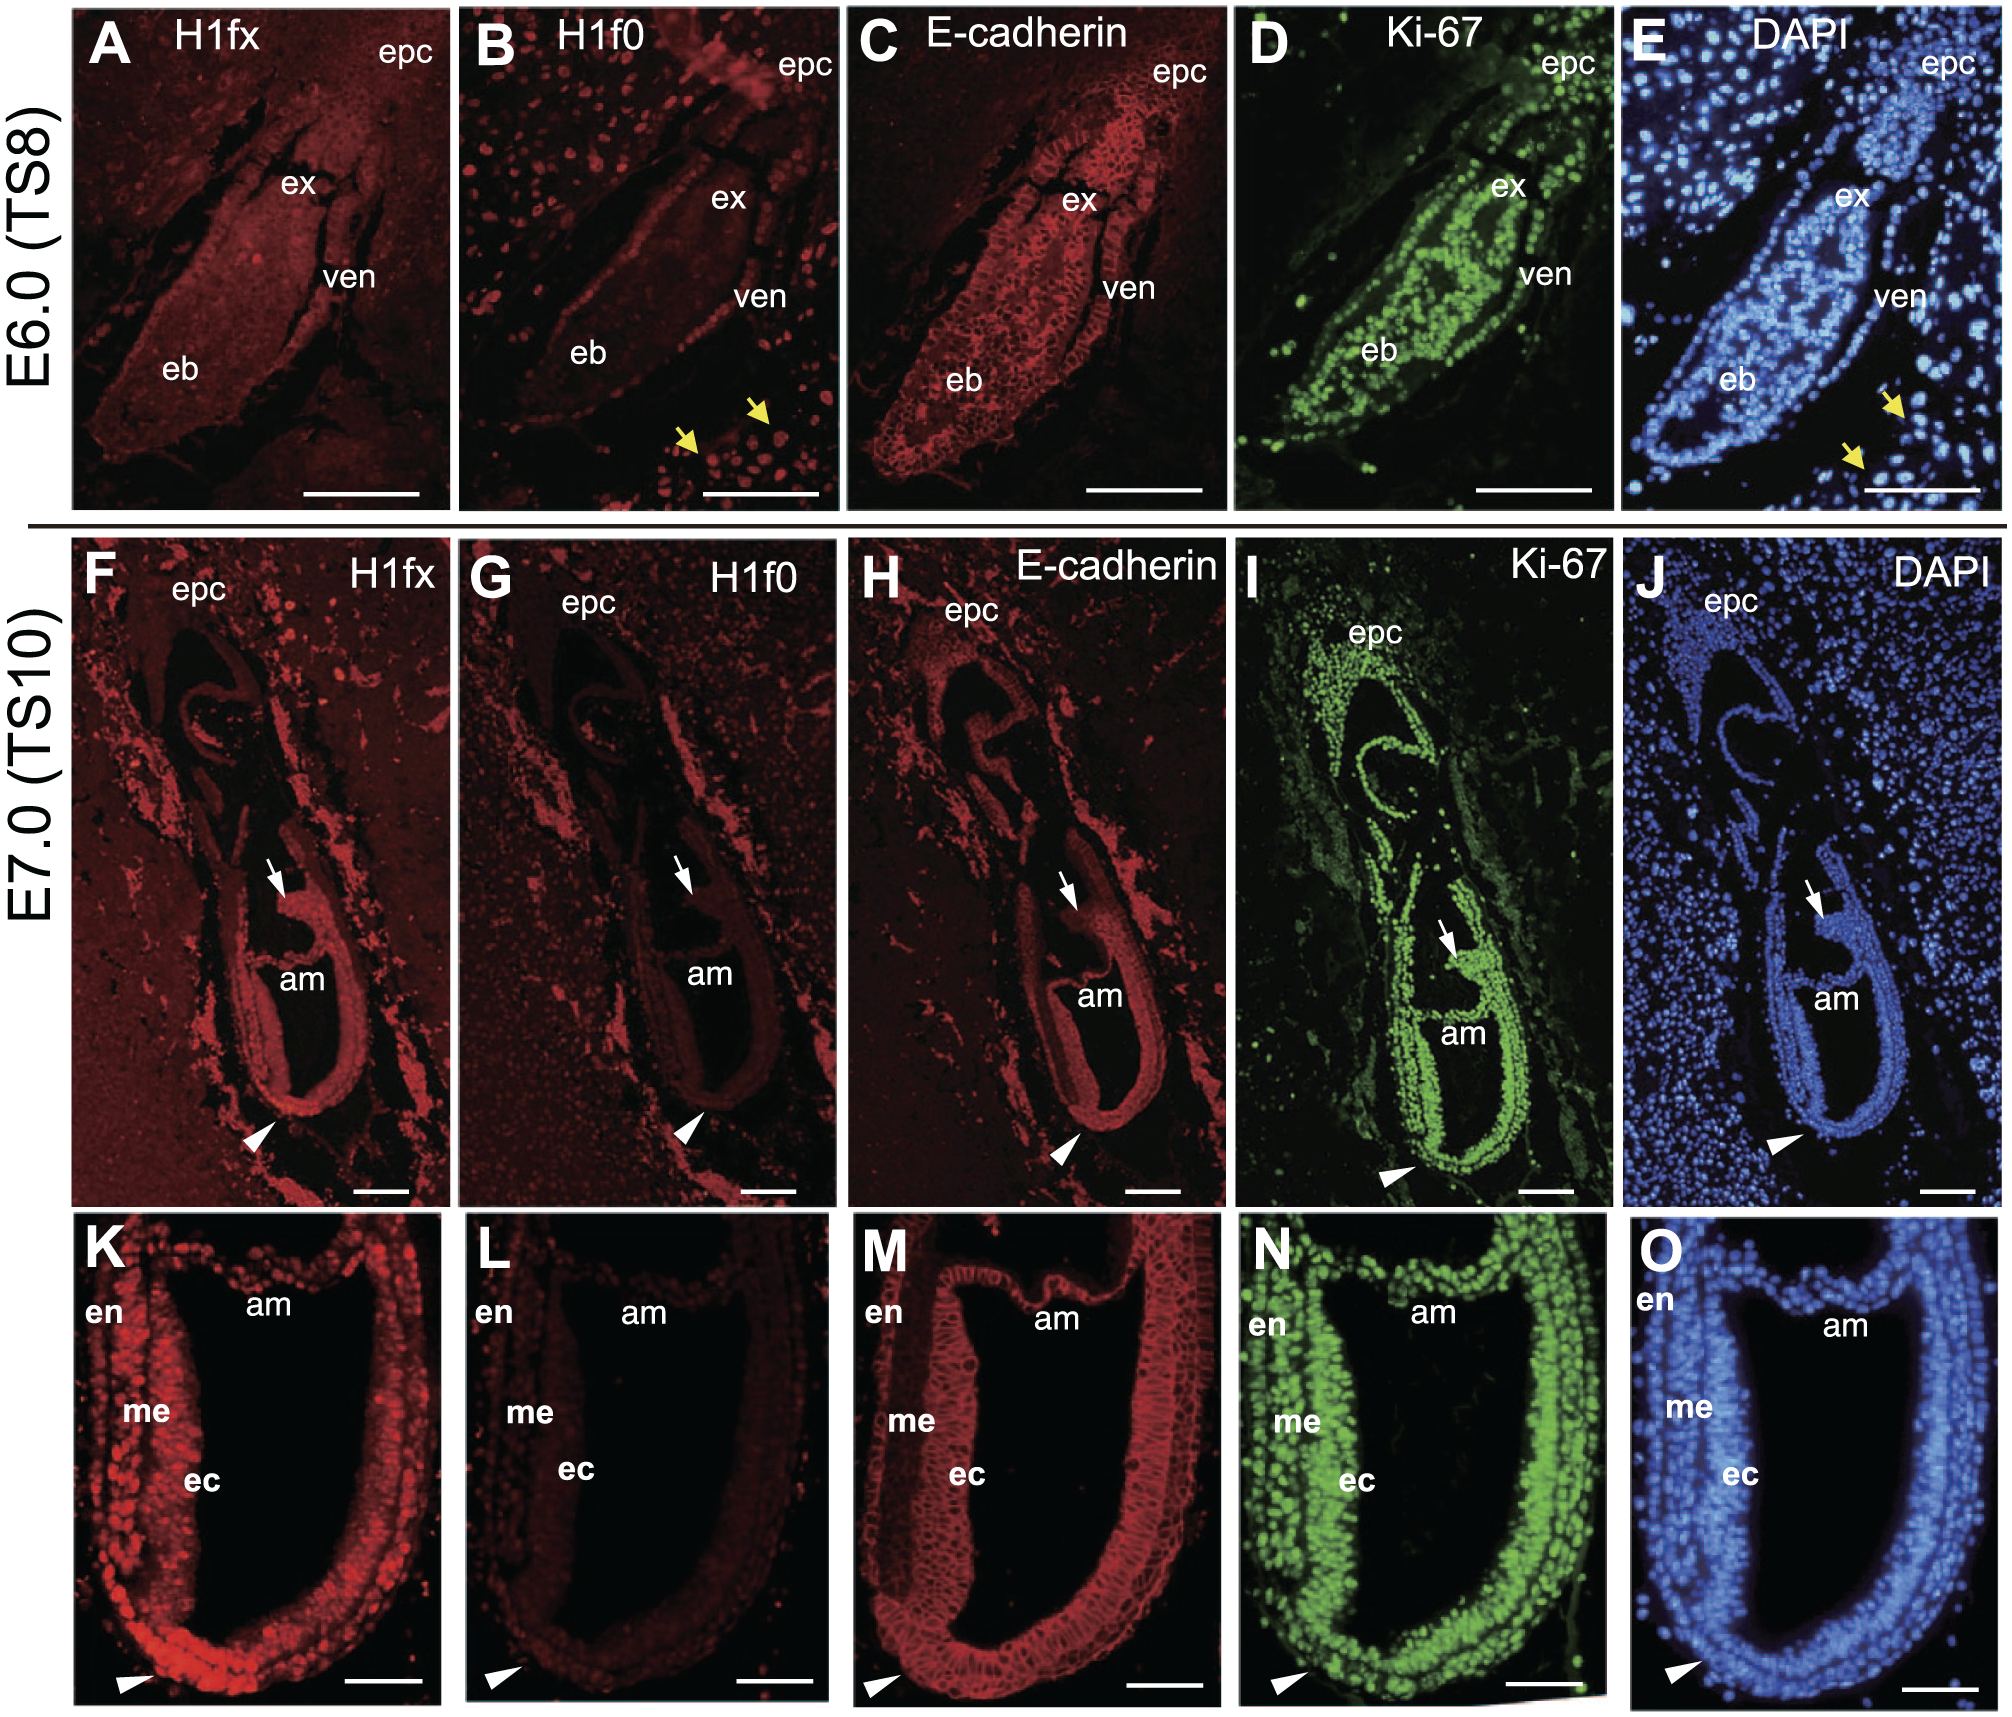
H1fx is broadly and strongly expressed in E6.0–7.0 embryos. (A–E) The sagittal sections of E6.0 (TS8) embryos at the advanced egg cylinder stage were stained with anti-H1fx (A), H1f0 (B), E-cadherin (C), Ki-67 (D) and DAPI (E). The epiblast (eb) and extraembryonic ectoderm (ex) were surrounded by visceral endoderm (ven). (F–O) The sagittal sections of E7.0 (TS 10) embryos at the late streak, early allantoic bud stage, were stained with anti-H1fx (F and K), H1f0 (G and L), E-cadherin (H and M), Ki-67 (I and N), and DAPI (J and O). The lower panels (K–O) are high-magnification images of the upper ones (F–J). Yellow arrows represent trophoblasts. White arrows and white arrowheads indicate the node and allantoic bud, respectively. Scale bars: A to J, 50 µm; K to O, 25 µm. Abbreviations: epc, ectoplacental cone; am, amnion; en, endoderm; me, mesoderm; ec, ectoderm.
At E7.0 (TS10, the late streak, early allantoic bud stage), the egg cylinder is elongated, giving rise to the amnion and the allantoic bud. As a result of the primitive streak processing, the epiblast cells differentiate into a node and three embryonic germ layers: the neural ectoderm, endoderm, and mesoderm. In our experiments, H1fx was expressed at all three embryonic germ layers, and was very strongly expressed at the node (Fig. 1F and K, arrowheads). Little or no H1f0 expression was observed at either the node or layers (Fig. 1G and L), whereas Ki-67 was ubiquitously expressed (Fig. 1I and N). E-cadherin was expressed at the node and each of the embryonic germ layers except the mesoderm (Fig. 1H and M). These results show that H1fx is upregulated beyond the gastrulation stage, and also that H1fx is the dominant linker histone at these stages, as it was more widely and strongly expressed than H1f0.
H1fx Is Almost Ubiquitously Expressed in the E8.0–E8.5 Embryonic Tissues at the Early Somitogenesis Stage
At E8.0 (TS12, early somitogenesis stage), the embryos become larger in size and the anterior–posterior axis is determined. Each embryo and the exocoelomic cavity are segregated by the boundary of extraembryonic membranes, including the amnion. In our experiments, H1fx was strongly expressed at the whole embryo and amnion (Fig. 2A), but H1f0 was not (Fig. 2B). Ki-67 was ubiquitously expressed at both the embryonic and the extraembryonic membranes (Fig. 2C). The expression of E-cadherin declined at the neural ectoderm (Fig. 2D).
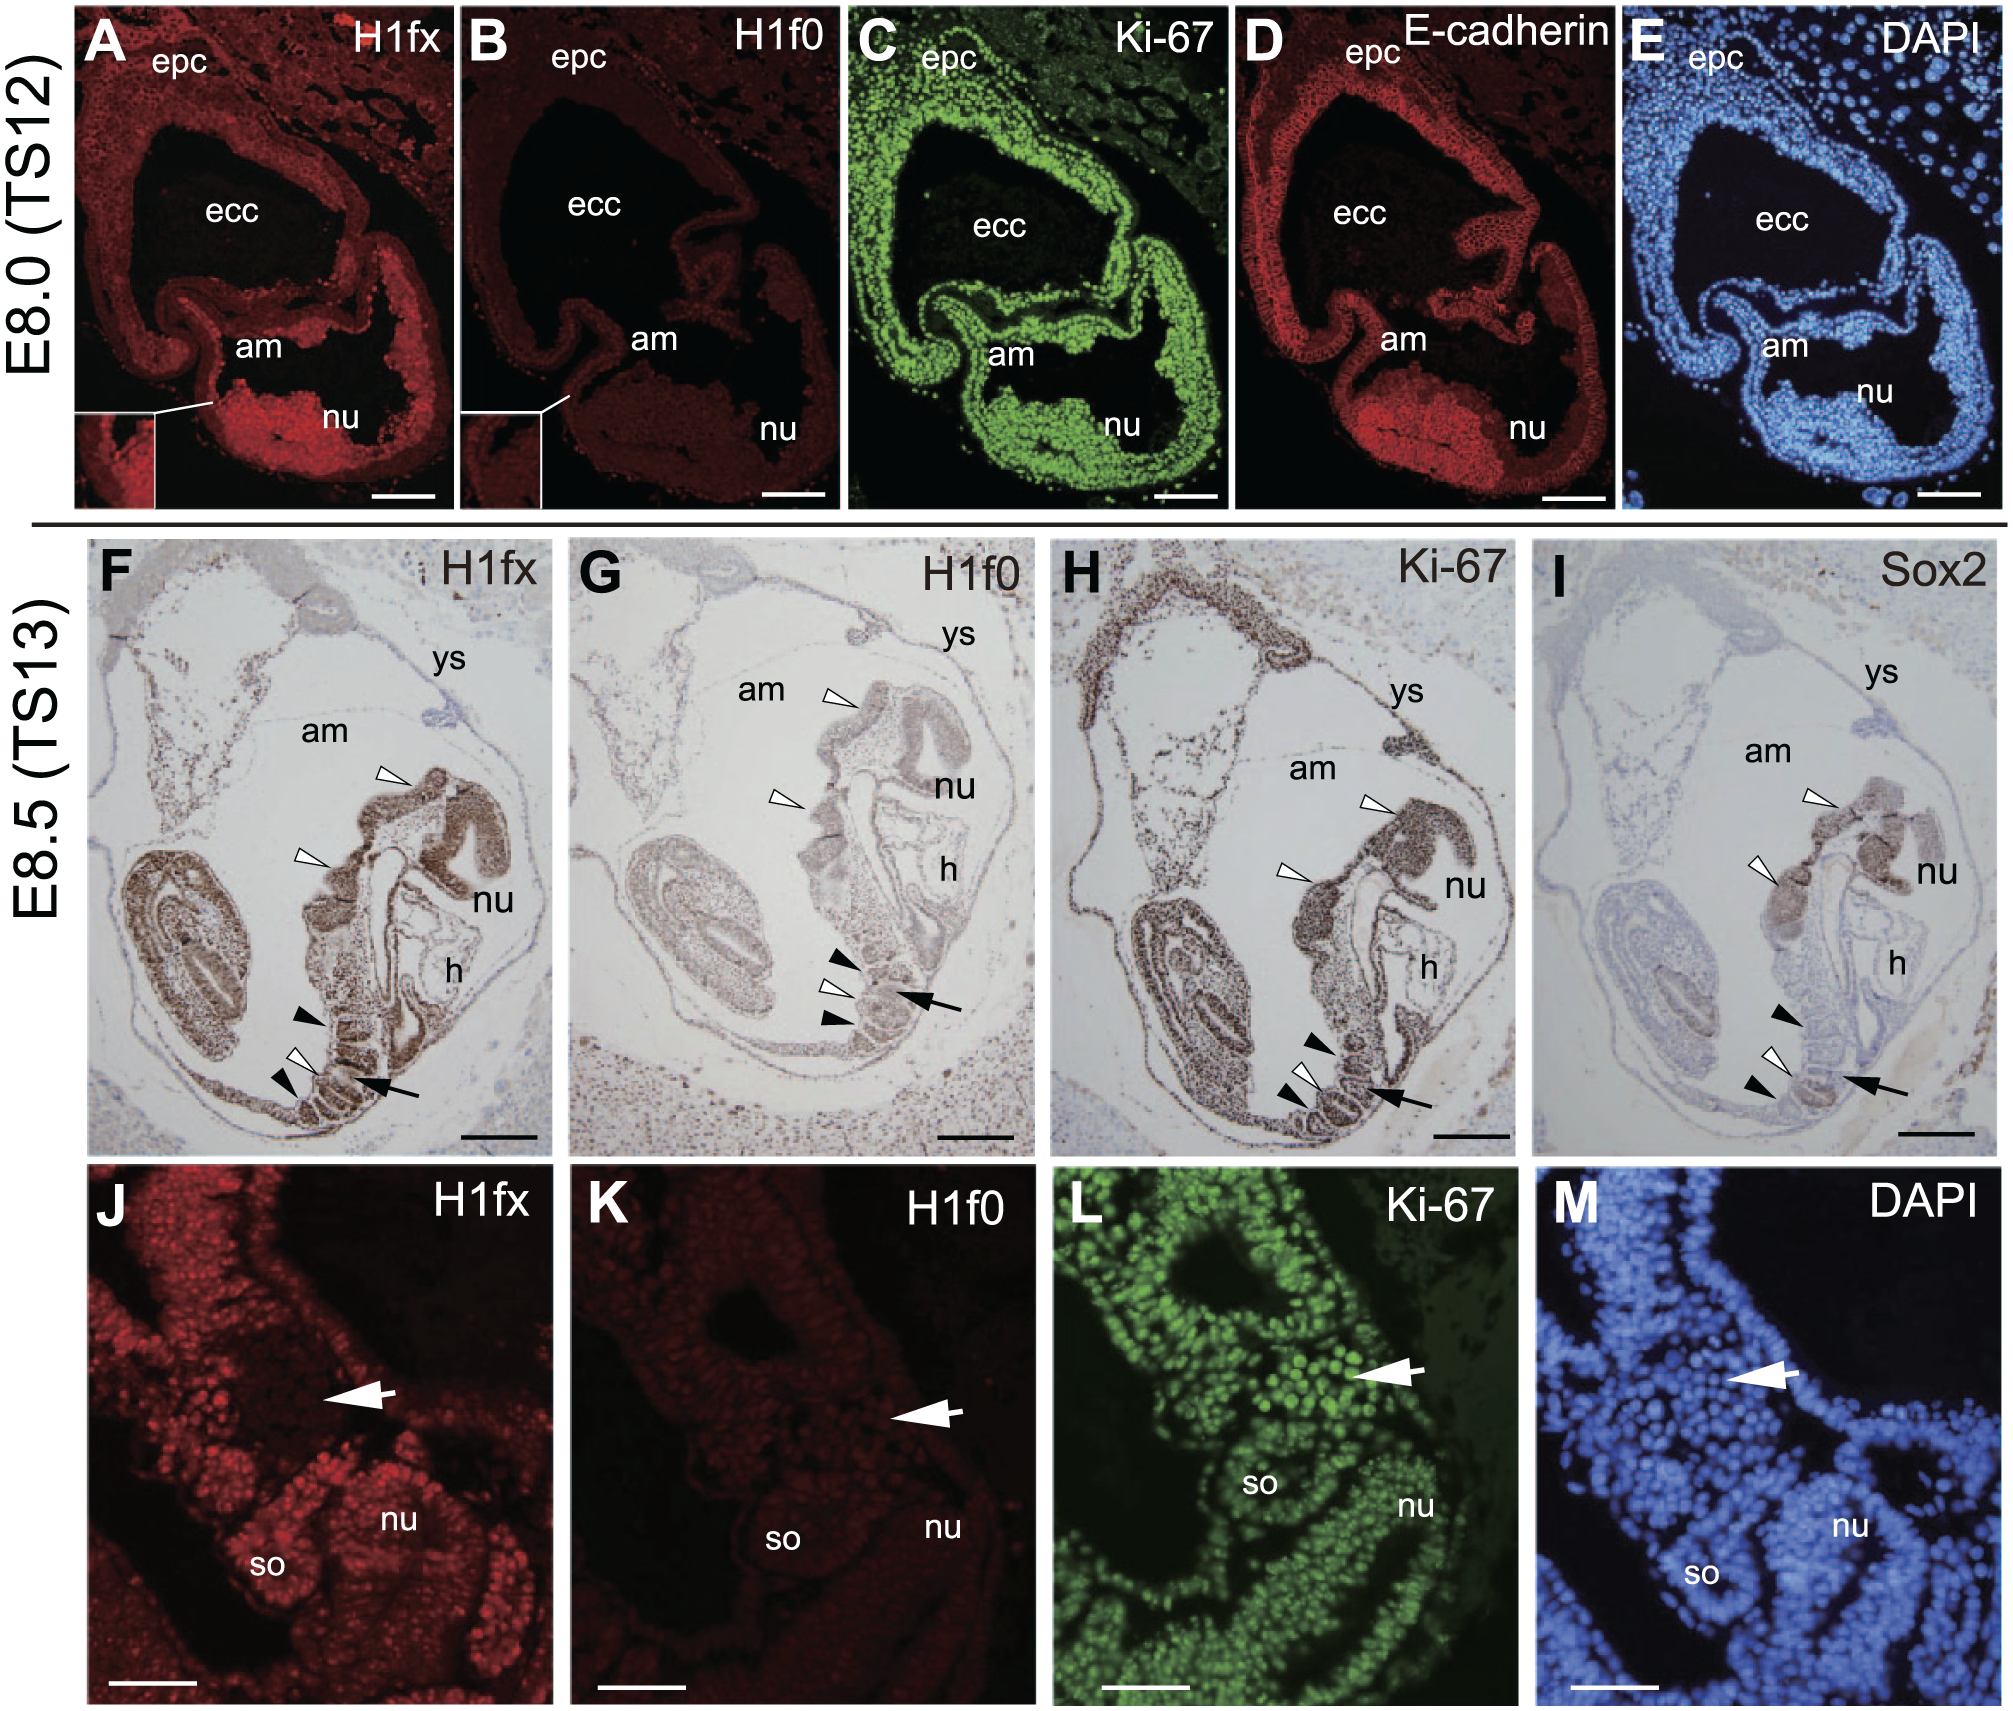
H1fx is expressed at the neural tube, somites, mesenchymal cells, and endoderm during the somitogenesis stage. (A–E) Sagittal sections of E8.0 (TS 12) embryos. (F–M) Sagittal sections of E8.5 (TS 13) embryos. Sections were stained with anti-H1fx (A, F, and J), H1f0 (B, G, and K), Ki-67 (C, H, and L), E-cadherin (D), DAPI (E and M), and Sox2 (I). The inset panels in A and B show enlarged images of a portion of embryos. (F–I) The white and black arrowheads represent the neural tube and somites, respectively. Black arrows represent the area of septum transversum. (J–M) The caudal part includes somites (so) and the septum transversum (white arrows). Scale bars: A to E, 100 µm; F to I, 200 µm; J to M, 50 µm. Abbreviations: epc, ectoplacental cone; ecc, exocoelomic cavity; am, amnion; nu, neural tube; ys, yolk sac; h, heart rudiment.
At E8.5 (TS13, early somitogenesis), the embryos are dually surrounded by amnion and the yolk sac, and initiate the axial rotation. The mid-trunk region of embryos is closely attached to the yolk sac, whereas their rostral and caudal regions appear to be detached. As somitogenesis progresses, the neural tube is elongated and heart rudiments are formed. In our experiments, H1fx was almost ubiquitously expressed at the embryonic tissues (Fig. 2F), and there was faint immunostaining for H1f0 (Fig. 2G and K). Ki-67 was expressed at both the embryonic and extraembryonic tissues (Fig. 2H and L). Sox2, a neural progenitor cell marker, was expressed in the neural tube (Fig. 2I). Interestingly some H1fx-negative cells were observed at the caudal area adjacent to the somites including the septum transversum (Fig. 2F, arrow). Immunofluorescence staining clearly showed that cells composed of the septum transversum were negative for H1fx, but were positive for Ki-67 (Fig. 2J and L, white arrows).
H1fx Is Strongly Expressed at E10.5 in the Early Organogenesis Stage
E10.5 (TS17) is characterized by the early organogenesis that accompanies cell and tissue differentiation, whose prominent feature is ventricular formation in the brain. The primitive gut and its associated gland are generated by interactions between the gut endoderm and surrounding mesenchyme. H1fx was strongly expressed at the brain, spinal cord, branchial arch, lung bud, and mesenchyme around primitive digestive tracts (Fig. 3A, E, and H). Ki-67 was expressed in most cells, but H1f0 was still faintly expressed in the whole embryo (Fig. 3B and C). The primitive heart tube and the septum transversum, which develop to the hepatic primordium, were weakly immunostained for H1fx. However, H1fx was strongly expressed at the esophagus and the surrounding mesenchyme (Fig. 3A, E, and H). At this stage, Sox10-positive neural crest cells migrating to various tissues were observed along with the trunk close to the dorsal aorta (Fig. 3F–H). Those Sox10-positive cells were also positive for H1fx. Thus, H1fx seems to support the role of Sox10-positive neural crest cells.
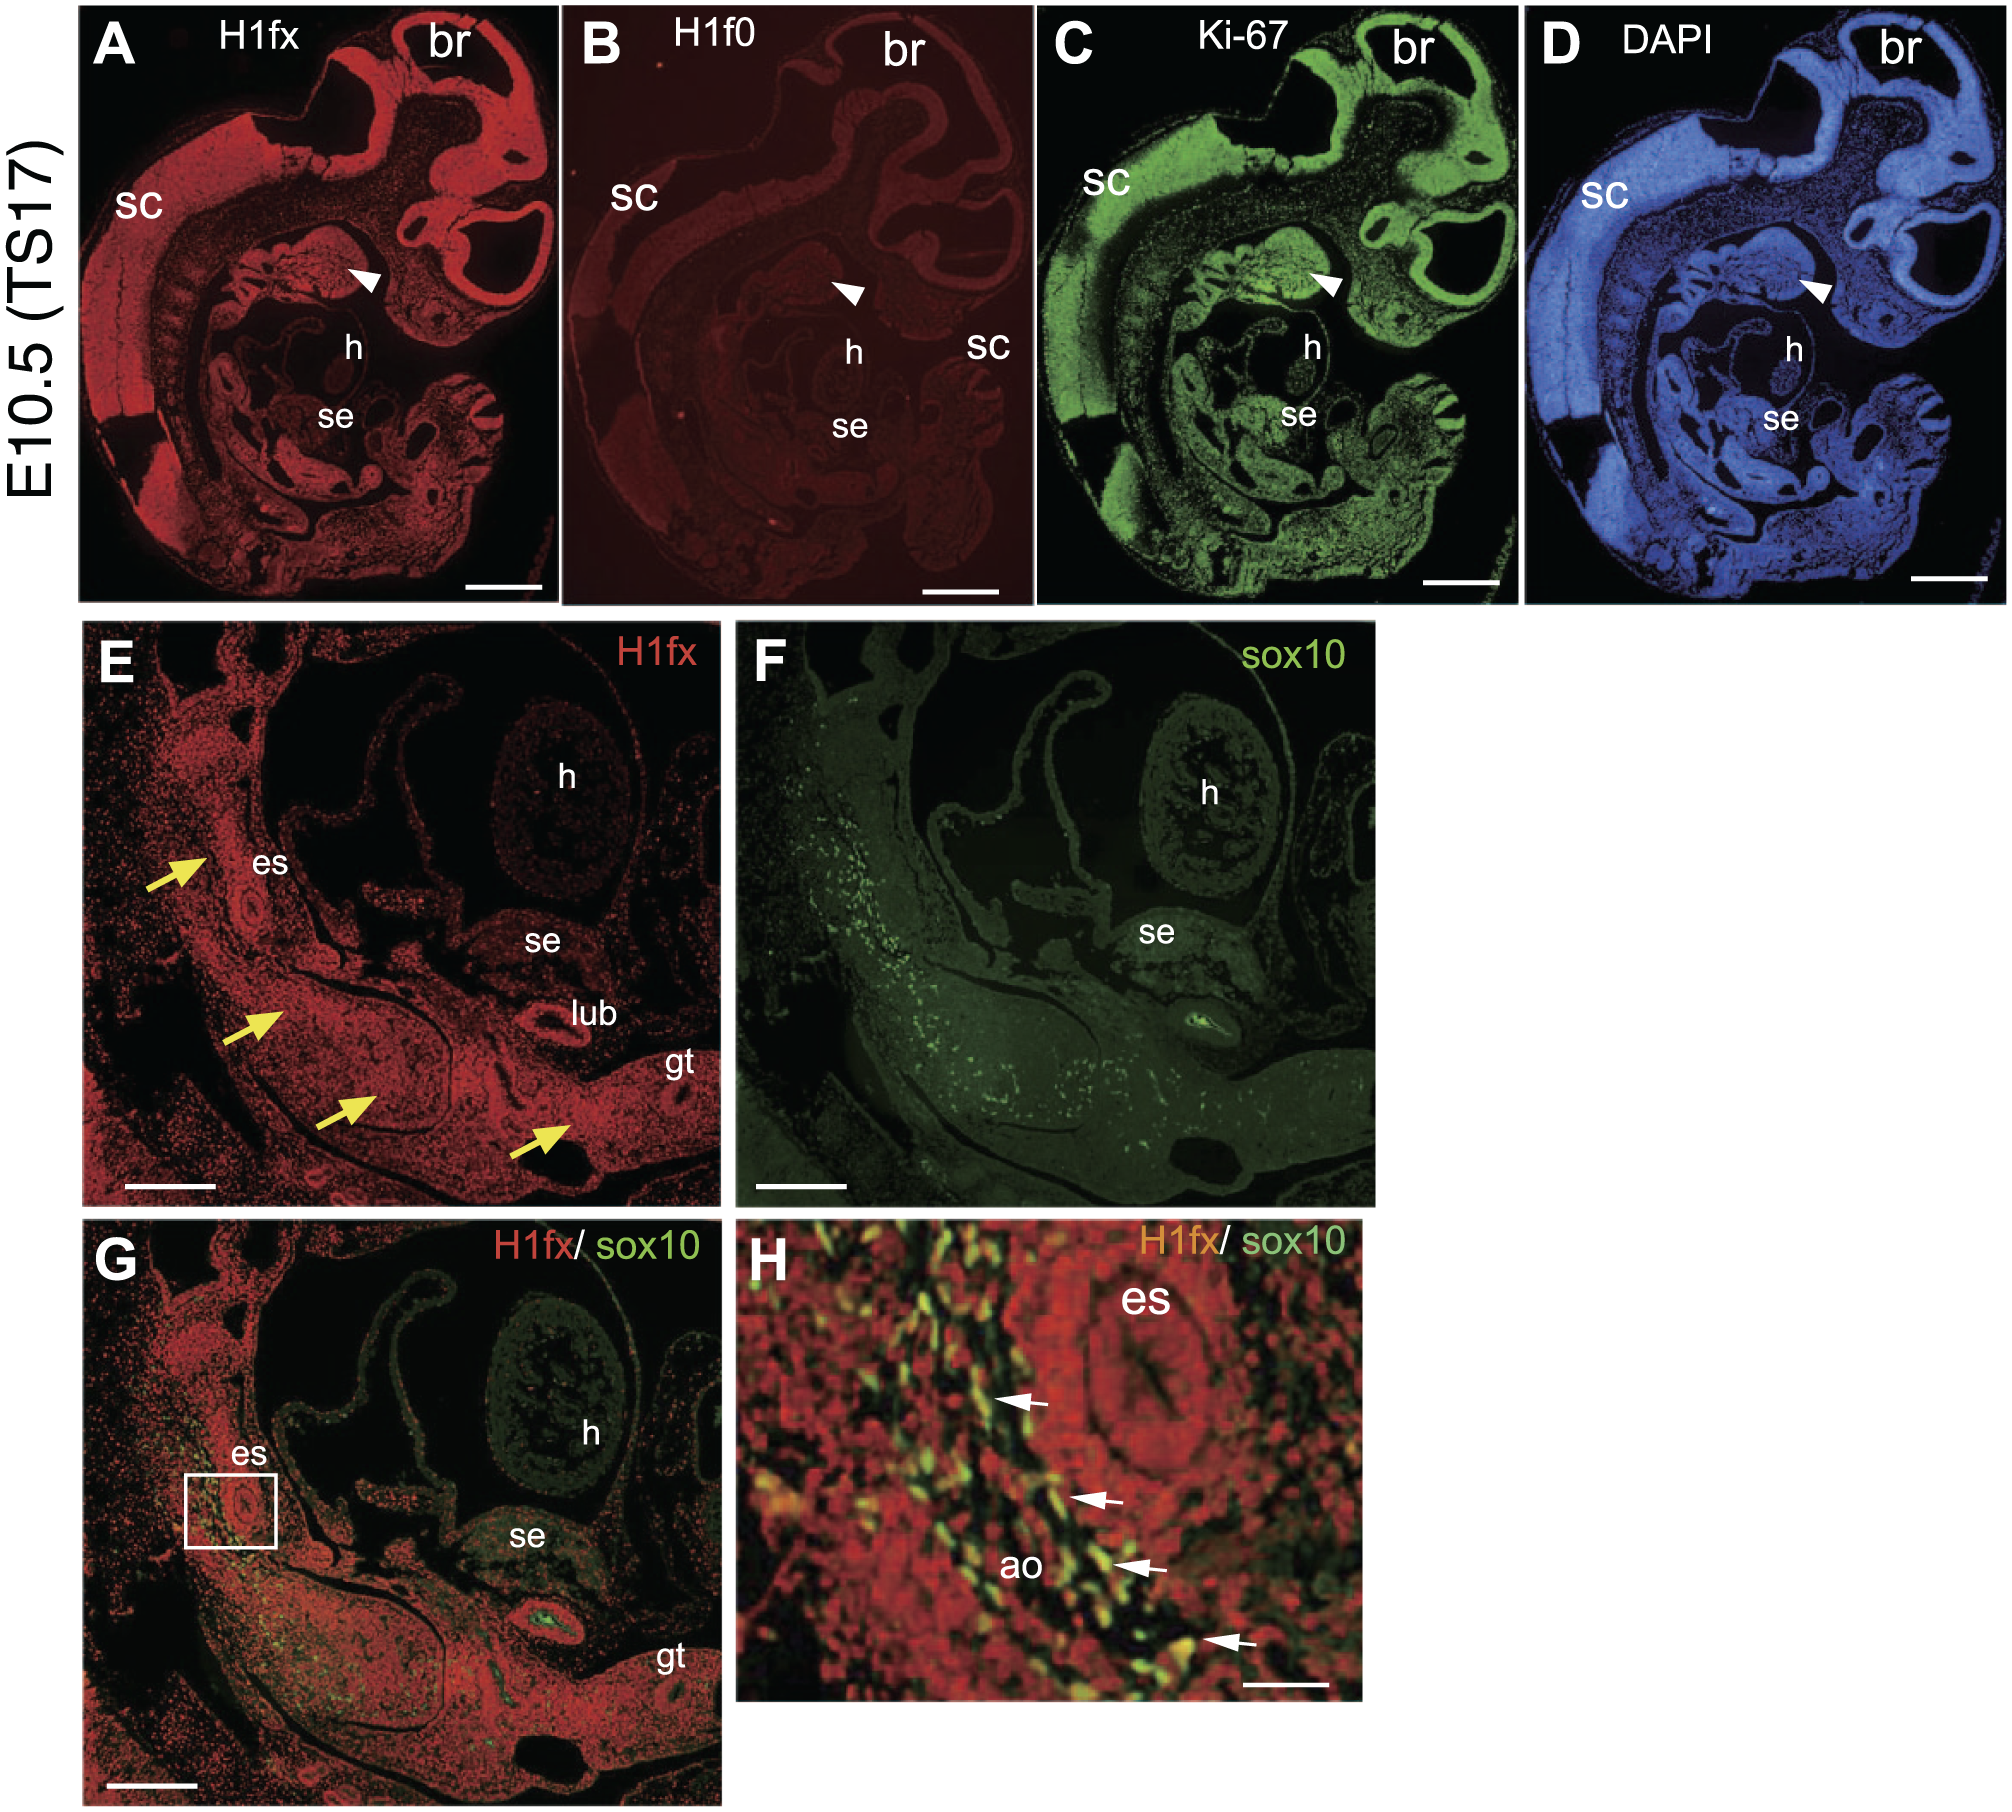
H1fx is strongly expressed in the brain and spinal cord at the early organogenesis stage. (A–D) The sagittal sections were stained with anti-H1fx (A), H1f0 (B), Ki-67 (C), and DAPI (D). Arrowheads represent the branchial arch. (E–H) The abdominal region containing the alimentary canal was stained with anti-H1fx (E) and anti-Sox10 (F), and their merged image is also shown (G). Yellow arrows indicate the mesenchymal tissues. (H) Enlargement of the boxed area is shown in panel G. White arrows represent the double-stained neural crest cells. Scale bars A to D, 500 µm; E to G, 200 µm; H, 50 µm. Abbreviations: br, brain; sc, spinal cord; h, heart; se, septum transversum; es, esophagus; lub, lung bud; gt, gut; ao, aorta.
Localized Expression of H1fx at E12.5 During the Organogenesis Stage
H1fx is continuously expressed between E10.5 (TS17) and E12.5 (TS21). The subsequent period between E12.5 and E15.5 (TS24) is classified as the late organogenesis stage. To investigate the overall expression of H1fx, we immunostained a series of coronal sections from E12.5 embryos (Fig. 4). At E12.5, H1fx was expressed in the following neural regions, usually together with Ki-67: the ventricular zone of both the telencepharic and fourth ventricle (Fig. 4, head), the retina and inner ear (Fig. 4, face), the ventricular zone of spinal cord (Fig. 4, face to caudal part), the dorsal root ganglion (Fig. 4, thorax), and a pair of tyrosine hydroxylase (TH)–-positive sympathetic ganglia originated from neural crest cells (Fig. 4, thorax and caudal part). H1fx was also expressed in the mesodermal regions, along with Ki-67 in both cases: the facial mesenchyme (Fig. 4, face) and pre-cartilage mesenchymal cell aggregate (termed as pre-cartilage condensation 39 ; Fig. 4, thorax to caudal part). Positive staining for H1fx and Ki-67 was also observed in several endodermal tissues, that is, the esophagus, trachea, stomach and gut (Fig. 4, abdominal and caudal part). At E12.5, H1fx expression was low in the heart and the liver primordium, where Ki-67 expression was high (Fig. 4, thorax to caudal part). H1f0 was observed at the ventricular zone of the spinal cord. At E12.5, the neural crest cells expressing TH, H1fx, and Ki-67 in association with the abdominal aorta entered into the adrenal primordium to form the medulla (Fig. 4P–R). The mesonephric tubules, a temporary structure during embryogenesis, expressed H1fx but neither Ki-67 nor TH. The gonads are located next to the mesonephros, and contain primordial germ cells, although their sexes are indistinguishable at this stage. We found that Ki-67 was ubiquitously expressed in the gonads, and positivity for H1fx was observed in the peripheral zone (Fig. 4P and Q).
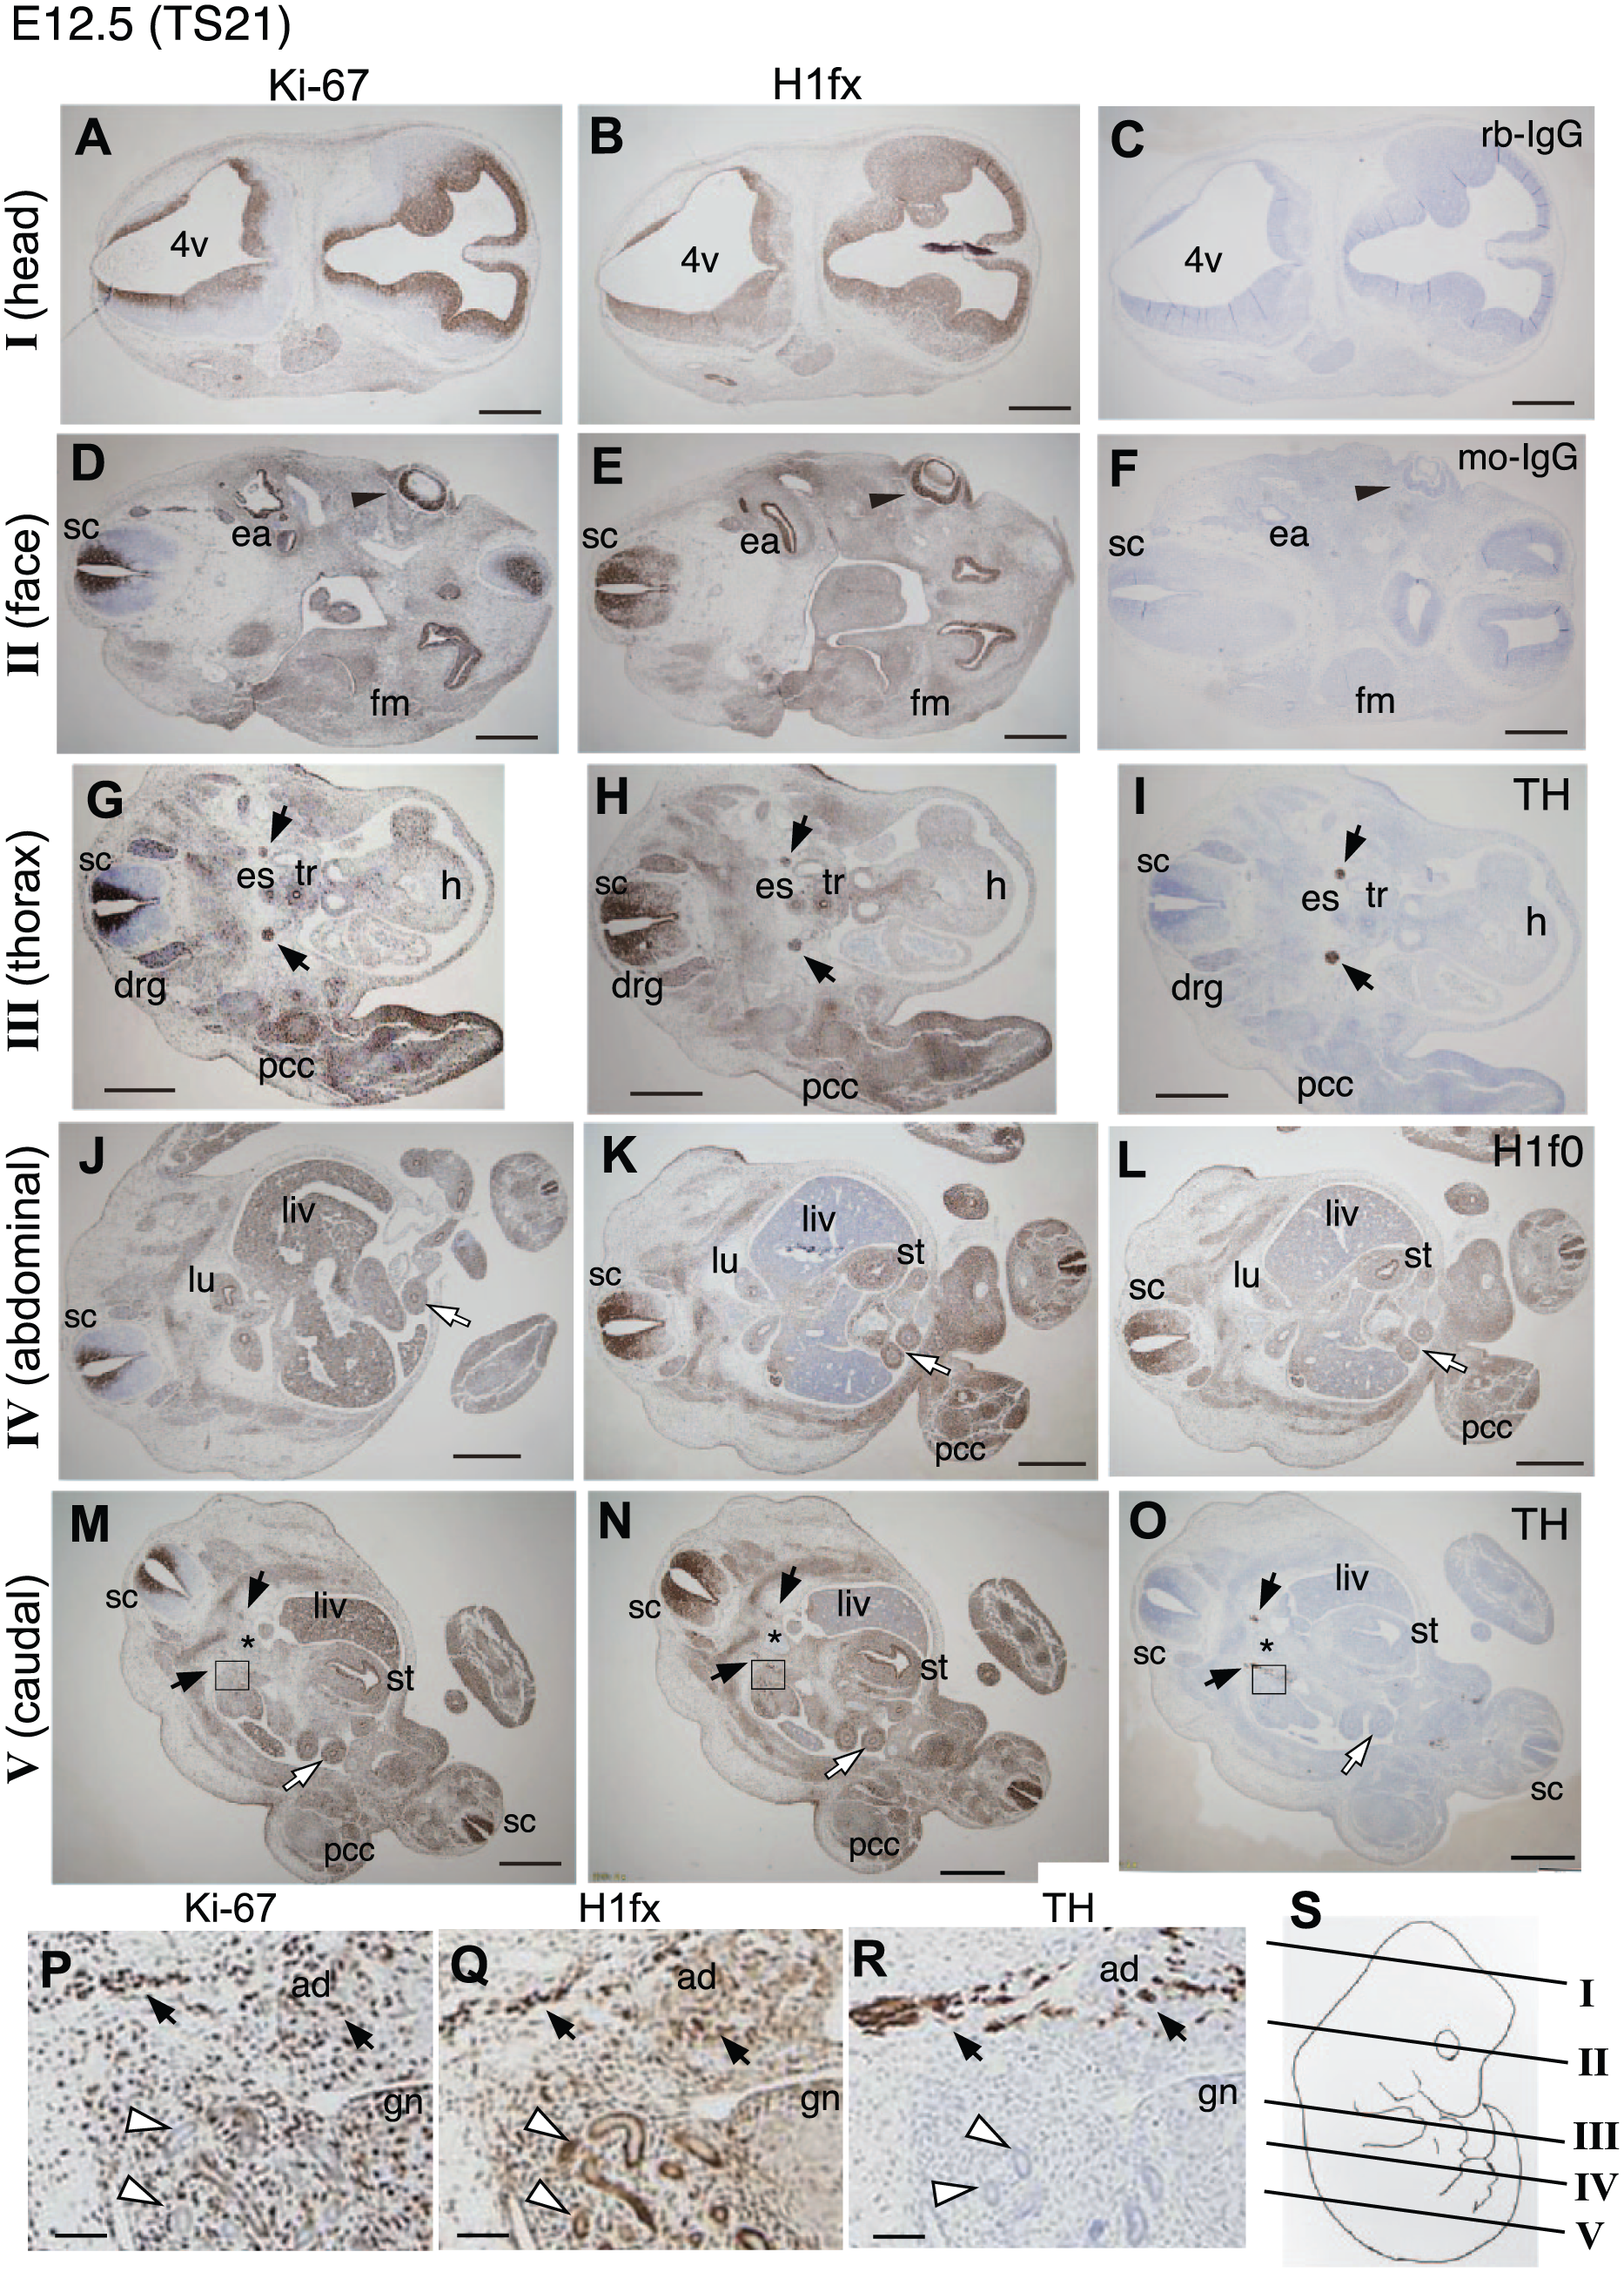
H1fx expression is localized at E12.5 (TS21) during the organogenesis stage. The transverse sections of E12.5 embryos were stained with anti–Ki-67 (A, D, G, J, M, and P), H1fx (B, E, H, K, N, and Q), tyrosine hydroxylase (TH; I, O, and R), H1f0 (L), control rabbit IgG (C), and control mouse IgG (F): (A–C) head, containing the fourth ventricle (4v) and lateral ventricle of the forebrain; (D–F) face, containing the spinal cord (sc), eye (black arrowheads), inner ear (ea), and facial mesenchymal tissue (fm); (G–I) thorax, containing the esophagus (es), trachea (tr), heart (h), pre-cartilage condensation (pcc), dorsal root ganglia (drg), and sympathetic ganglia (black arrows); (J–L) abdominal, containing the lung (lu), liver (liv), gut (white arrows), pcc, and stomach (st); (M–R) caudal region, containing the liver, stomach, gut, sympathetic ganglia (black arrows) pcc, and abdominal aorta (asterisks); and (P-R) high-magnification images of the boxed areas in panels M, N, and O, respectively. H1fx was observed at the mesonephric tubules (white arrowheads), sympathetic ganglia (black arrows), and adrenal primordium (ad). The peripheral zone of the gonad (gn) was positive for H1fx. (S) The positions of sections in the embryo from the head to caudal region are schematically indicated by I to V. Scale bars: A to O, 500 µm; P to R, 50 µm.
In summary, H1fx appears to be expressed in the neural tissues originating from the neural tube and neural crest cells, in the mesodermal tissues from somites, in endodermal tissues from the branchial arch, and in the alimentary canal, and more faintly expressed in the heart, liver, and gonads.
Further Restricted Expression of H1fx at E14.5–E15.5
At E14.5 (TS23), the expression of H1fx continued in the whole body but became more narrow and restricted (Fig. 5A and B). The sagittal sections showed that Ki-67 was still highly expressed in the developing tissues, such as the liver, lung, and kidney, whereas H1fx expression was high in the forebrain, but was restricted to the trunk of the embryo. However, we confirmed the H1fx expression in the specific tissues of several organs: the posterior part of the pituitary gland, which is connected to the bottom of the third ventricle, expressed H1fx (Fig. 5C and D). In addition, H1fx was detected in the region of the hypothalamus surrounding the bottom area of the third ventricle. Ki-67 was localized at the ventricular zone of the third ventricle and the remnant of Rathke’s pouch. In the thoracic portion, the sympathetic ganglia expressed TH, H1fx, and Ki-67 (Fig. 5E–G). In the lungs, Ki-67 was ubiquitously expressed at the bronchi and mesenchyme, whereas H1fx was strongly expressed in the bronchi and less in the mesenchyme. In the pancreas, which differentiates into a tubular exocrine portion and an endocrine portion, the exocrine tissues expressed Ki-67 and H1f0, and the endocrine tissues expressed H1fx and H1f0 (Fig. 5H–J). The adrenal gland, which neighbors on the metanephros consisting early nephrons, was differentiated into a cortex and medulla (Fig. 5K and L). H1fx was expressed in the medulla cells of the adrenal gland, and was weakly expressed in the early nephrons and mesenchyme of the kidney. Ki-67 was strongly expressed in both the kidney and liver. At E14.5, the gut tube elongated and formed the radial organization of the mesenchyme, smooth muscle layer, and enteric neural cell layer. The endodermal epithelium constituting the lumen expressed Ki-67 but not H1fx (Fig. 5M–O). TUJ1-positive enteric neural regions lying outside of the smooth muscle layers were H1fx positive. Collectively, these results suggested that H1fx expression was involved in the neuroendocrine function.
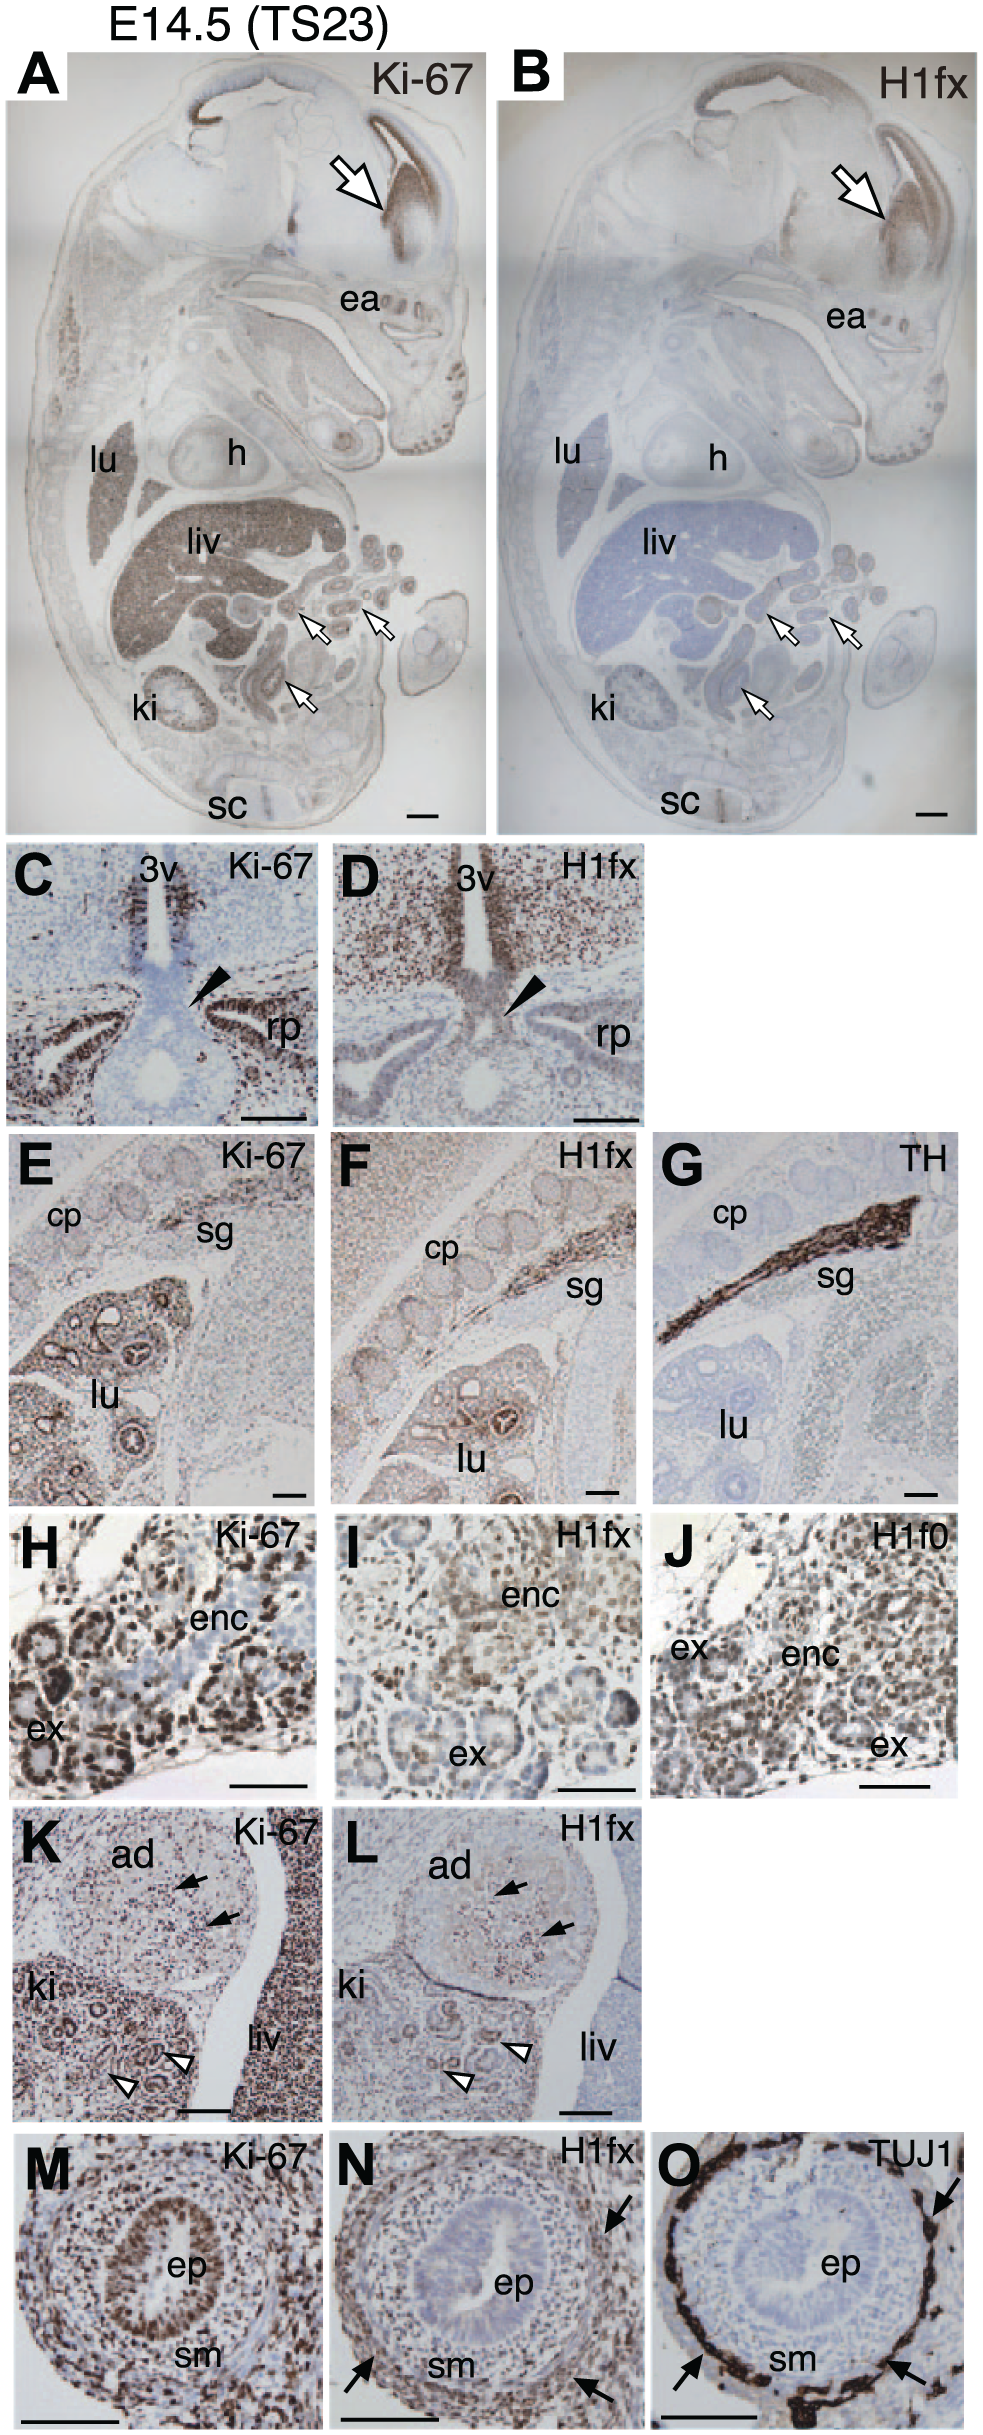
Expression of H1fx is further restricted at E14.5 (TS23). Sagittal sections of an E14.5 (TS23) embryo were stained with anti-Ki-67 (A, C, E, H, K, and M), H1fx (B, D, F, I, L, and N), tyrosine hydroxylase [TH; (G)], H1f0 (J), and TUJ1 (O). (A and B) The paramedian plane including the corpus striatum of the lateral ventricle (large white arrows), spinal cord (sc), heart (h), liver (liv), lung (lu), kidney (ki), and midgut (small white arrows). (C and D) Bottom of the third ventricle (3v) with posterior part of the pituitary (black arrowheads) and Rathke’s pouch (rp). (E–G) The thoracic part includes the cartilage-primordium (cp), lung (lu), and sympathetic ganglia (sg). (H–J) The pancreatic primordium includes the tubular exocrine tissues (ex) and endocrine tissues (enc). (K and L) The adrenal primordium (ad) contains the H1fx-positive cells (black arrows), kidney (ki) with early nephrons (white arrowheads), and liver (liv). (M–O) The cross sections of the midgut tube contain the endodermal epithelium (ep) surrounding the lumen, smooth muscle layer (sm), and enteric neural cells (black arrows). Scale bars: A and B, 100 µm; C to L, 100 µm. Abbreviation: ea, ear.
At E15.5 (TS24), H1fx expression was retained in the brain, but had declined at the visceral organs, as observed in E14.5 embryos (data not shown). Here we show the expression of H1fx at the head, which is characterized as an enlarged thickened cerebral cortex, and the progression of the pineal gland in the diencephalon (Fig. 6A–H). H1fx was expressed at the olfactory epithelium linking to the thalamus and the subventricular zone of the lateral ventricle, which corresponded with the Ki-67 expression profile (Fig. 6A and B). The coronal sections showed that H1fx and Ki-67 were expressed at the subventricular zone of the cerebral cortex (Fig. 6C–H). In addition, H1fx was observed at the retina, cochlea, pineal gland, and the bottom area of the third ventricle. Calretinin, a premature neuronal marker, was expressed at the hypothalamus and the cortical plate, but not yet expressed at the subventricular zone. It seems that H1fx is expressed not only in neural stem cells but also neural precursor cells. Taken together, these findings reveal that H1fx is preferentially expressed in the early embryos and then declines as organogenesis proceeds. However, H1fx is still likely to be expressed in the undifferentiated neural cells or neuroendocrine cells.
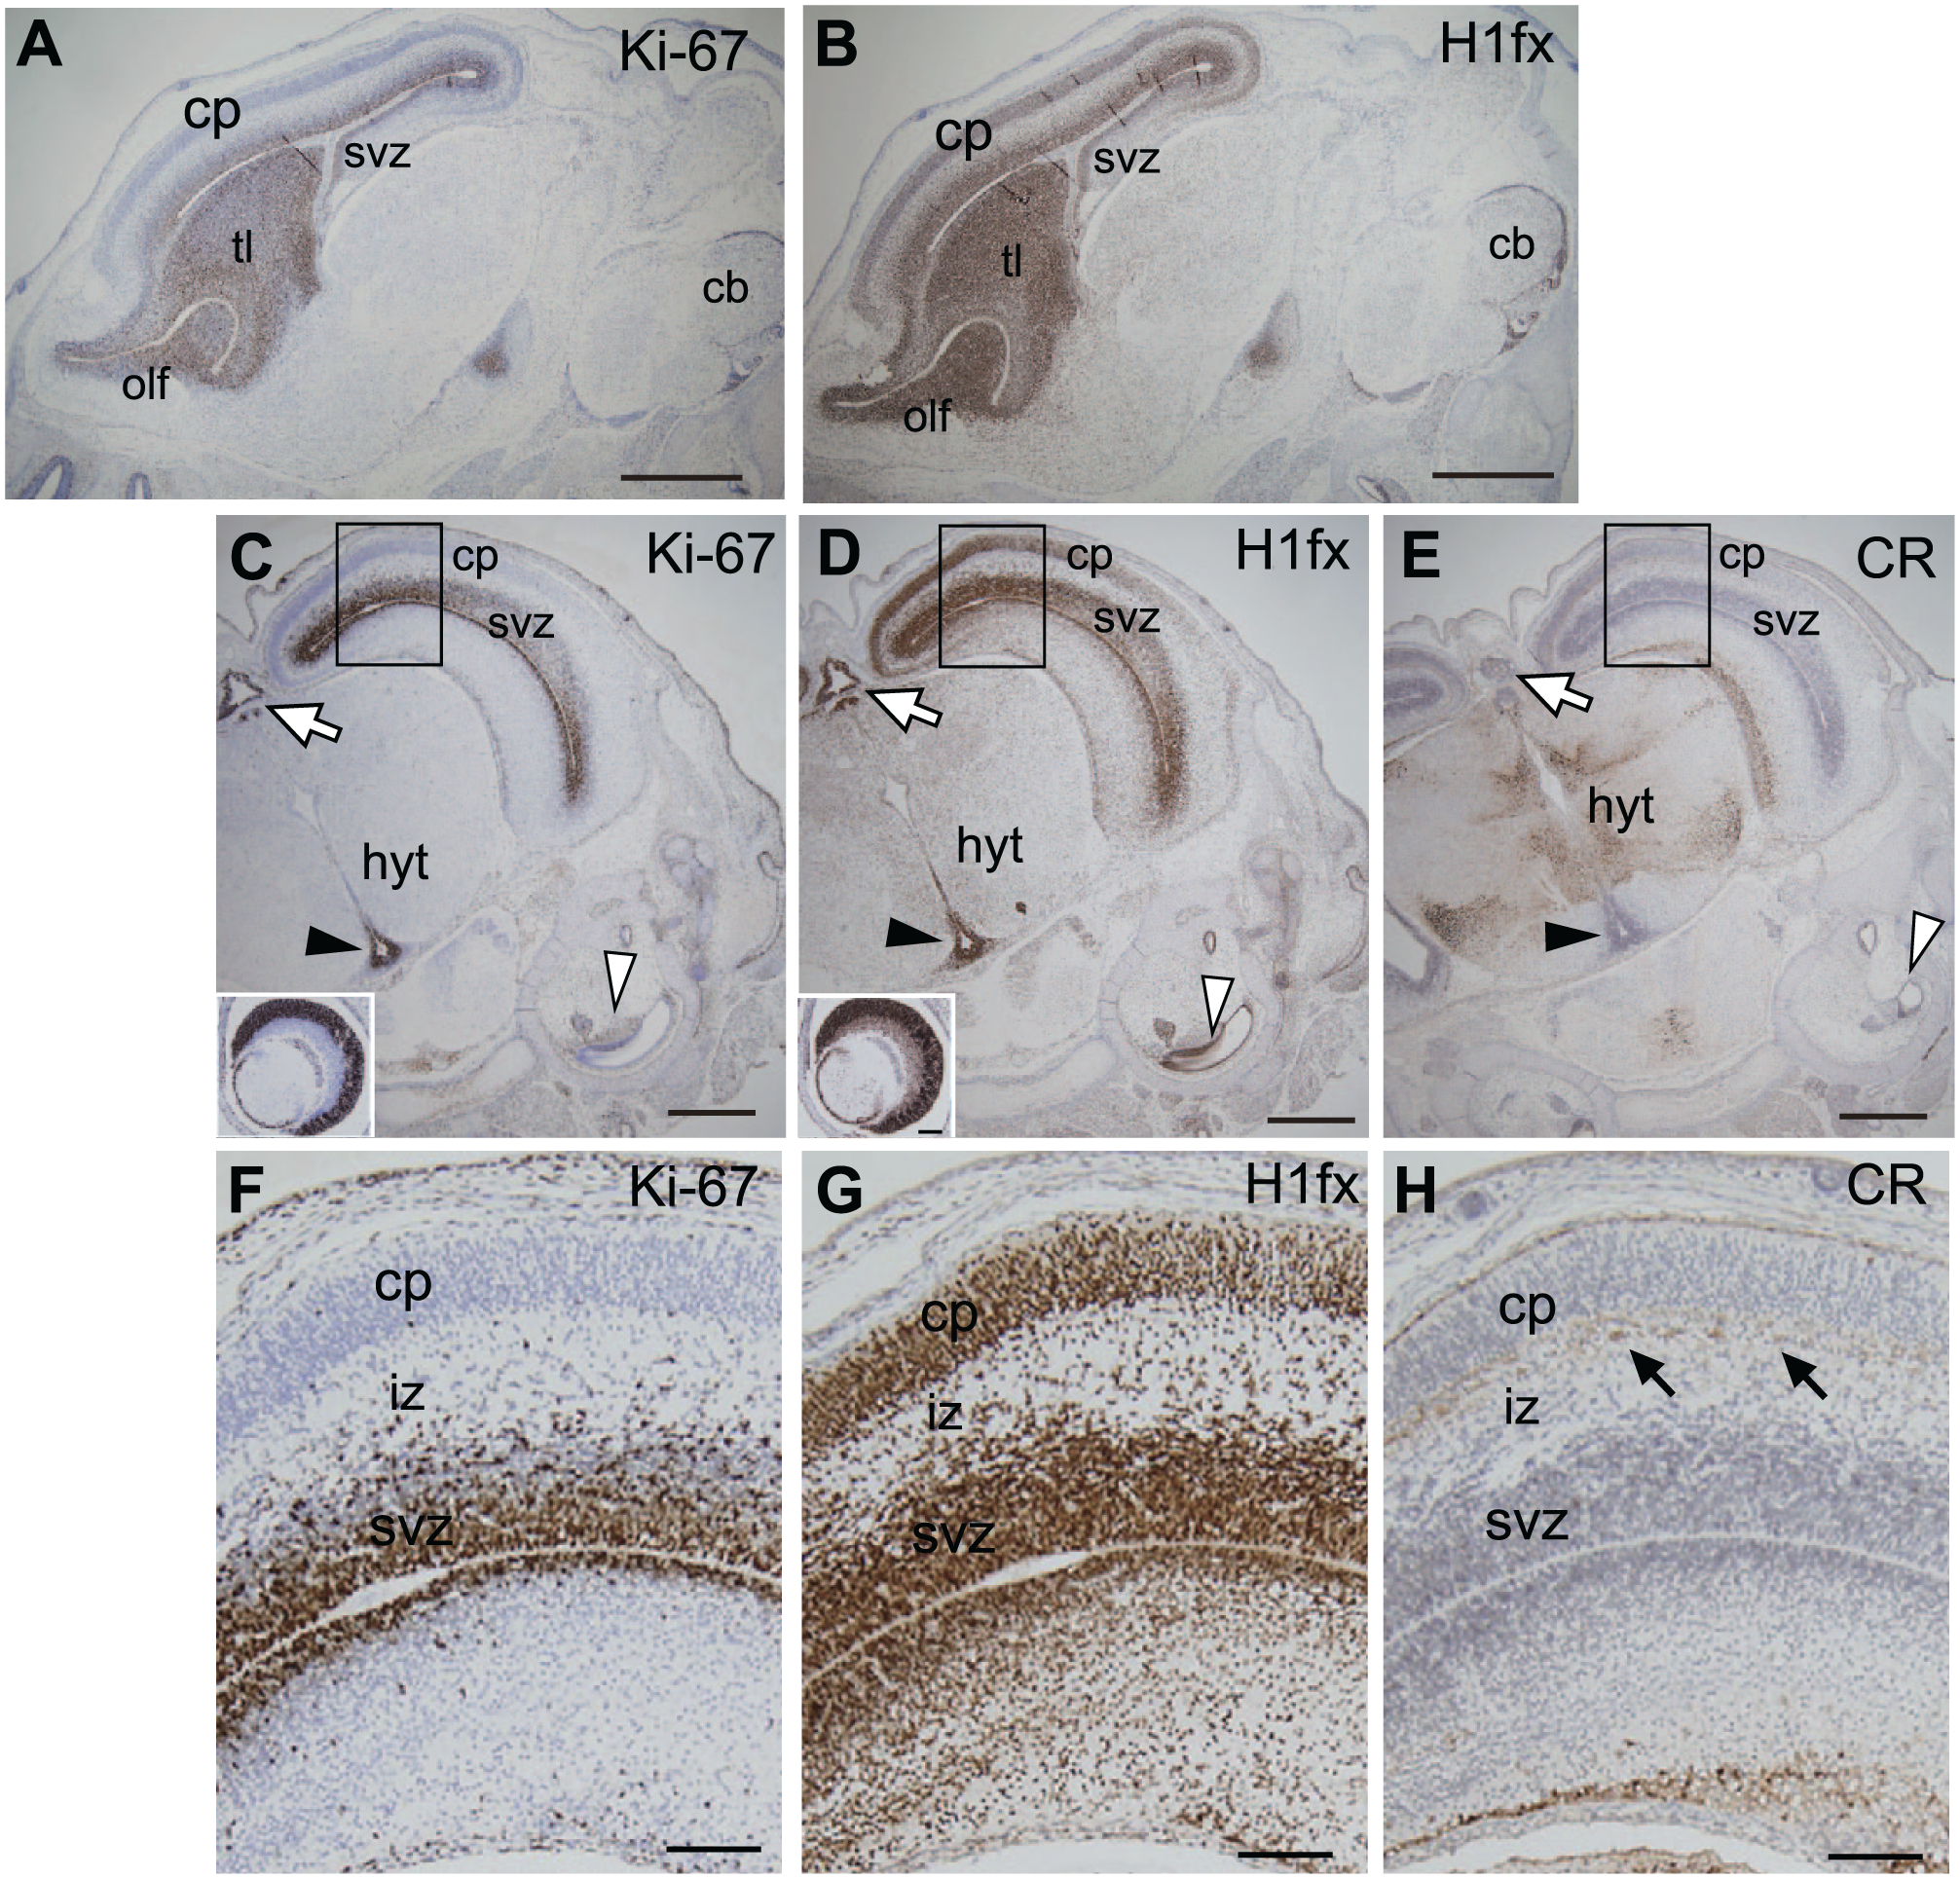
Expression of H1fx in the E15.5 (TS24) brain. Brain sections of an E15.5 embryo were immunostained with anti-Ki-67 (A, C, and F), H1fx (B, D and G), and calretinin [CR; (E and H)]. (A and B) Sagittal sections include the olfactory lobe (olf), thalamus (tl), and cerebellar primordium (cb). (C–E) Coronal sections contain the cerebral cortex, hypothalamus (hyt) associated with the third ventricle (black arrowheads) and pineal gland (white arrows). The inset panels in C and D represent the eyes. (F–H) Enlargements of the boxed areas in C, D, and E, respectively. Scale bars: A to H, 500 µm; I to K and inlets of C and D, 100 µm. Abbreviations: cp, cortical plate; svz, subventricular zone; iz, intermediate zone.
Expression H1fx in the Brain at the Postnatal Stages
The expression of H1fx seemed to be restricted to the nervous system during late embryogenesis. Thus, we studied the expression of H1fx in the postnatal brain. In the neonatal brain (P0), the cerebral cortex becomes larger, and the cerebellar primordium gives rise to the layer structure. H1fx was expressed at the inner layers of the olfactory bulb connected to the subventricular zone, the granular layer of the hippocampus, and the cerebellum (Fig. 7A–F). Ki-67 and nestin were also observed at the olfactory layers and the subgranular zone (Fig. 7D–F, white arrows).
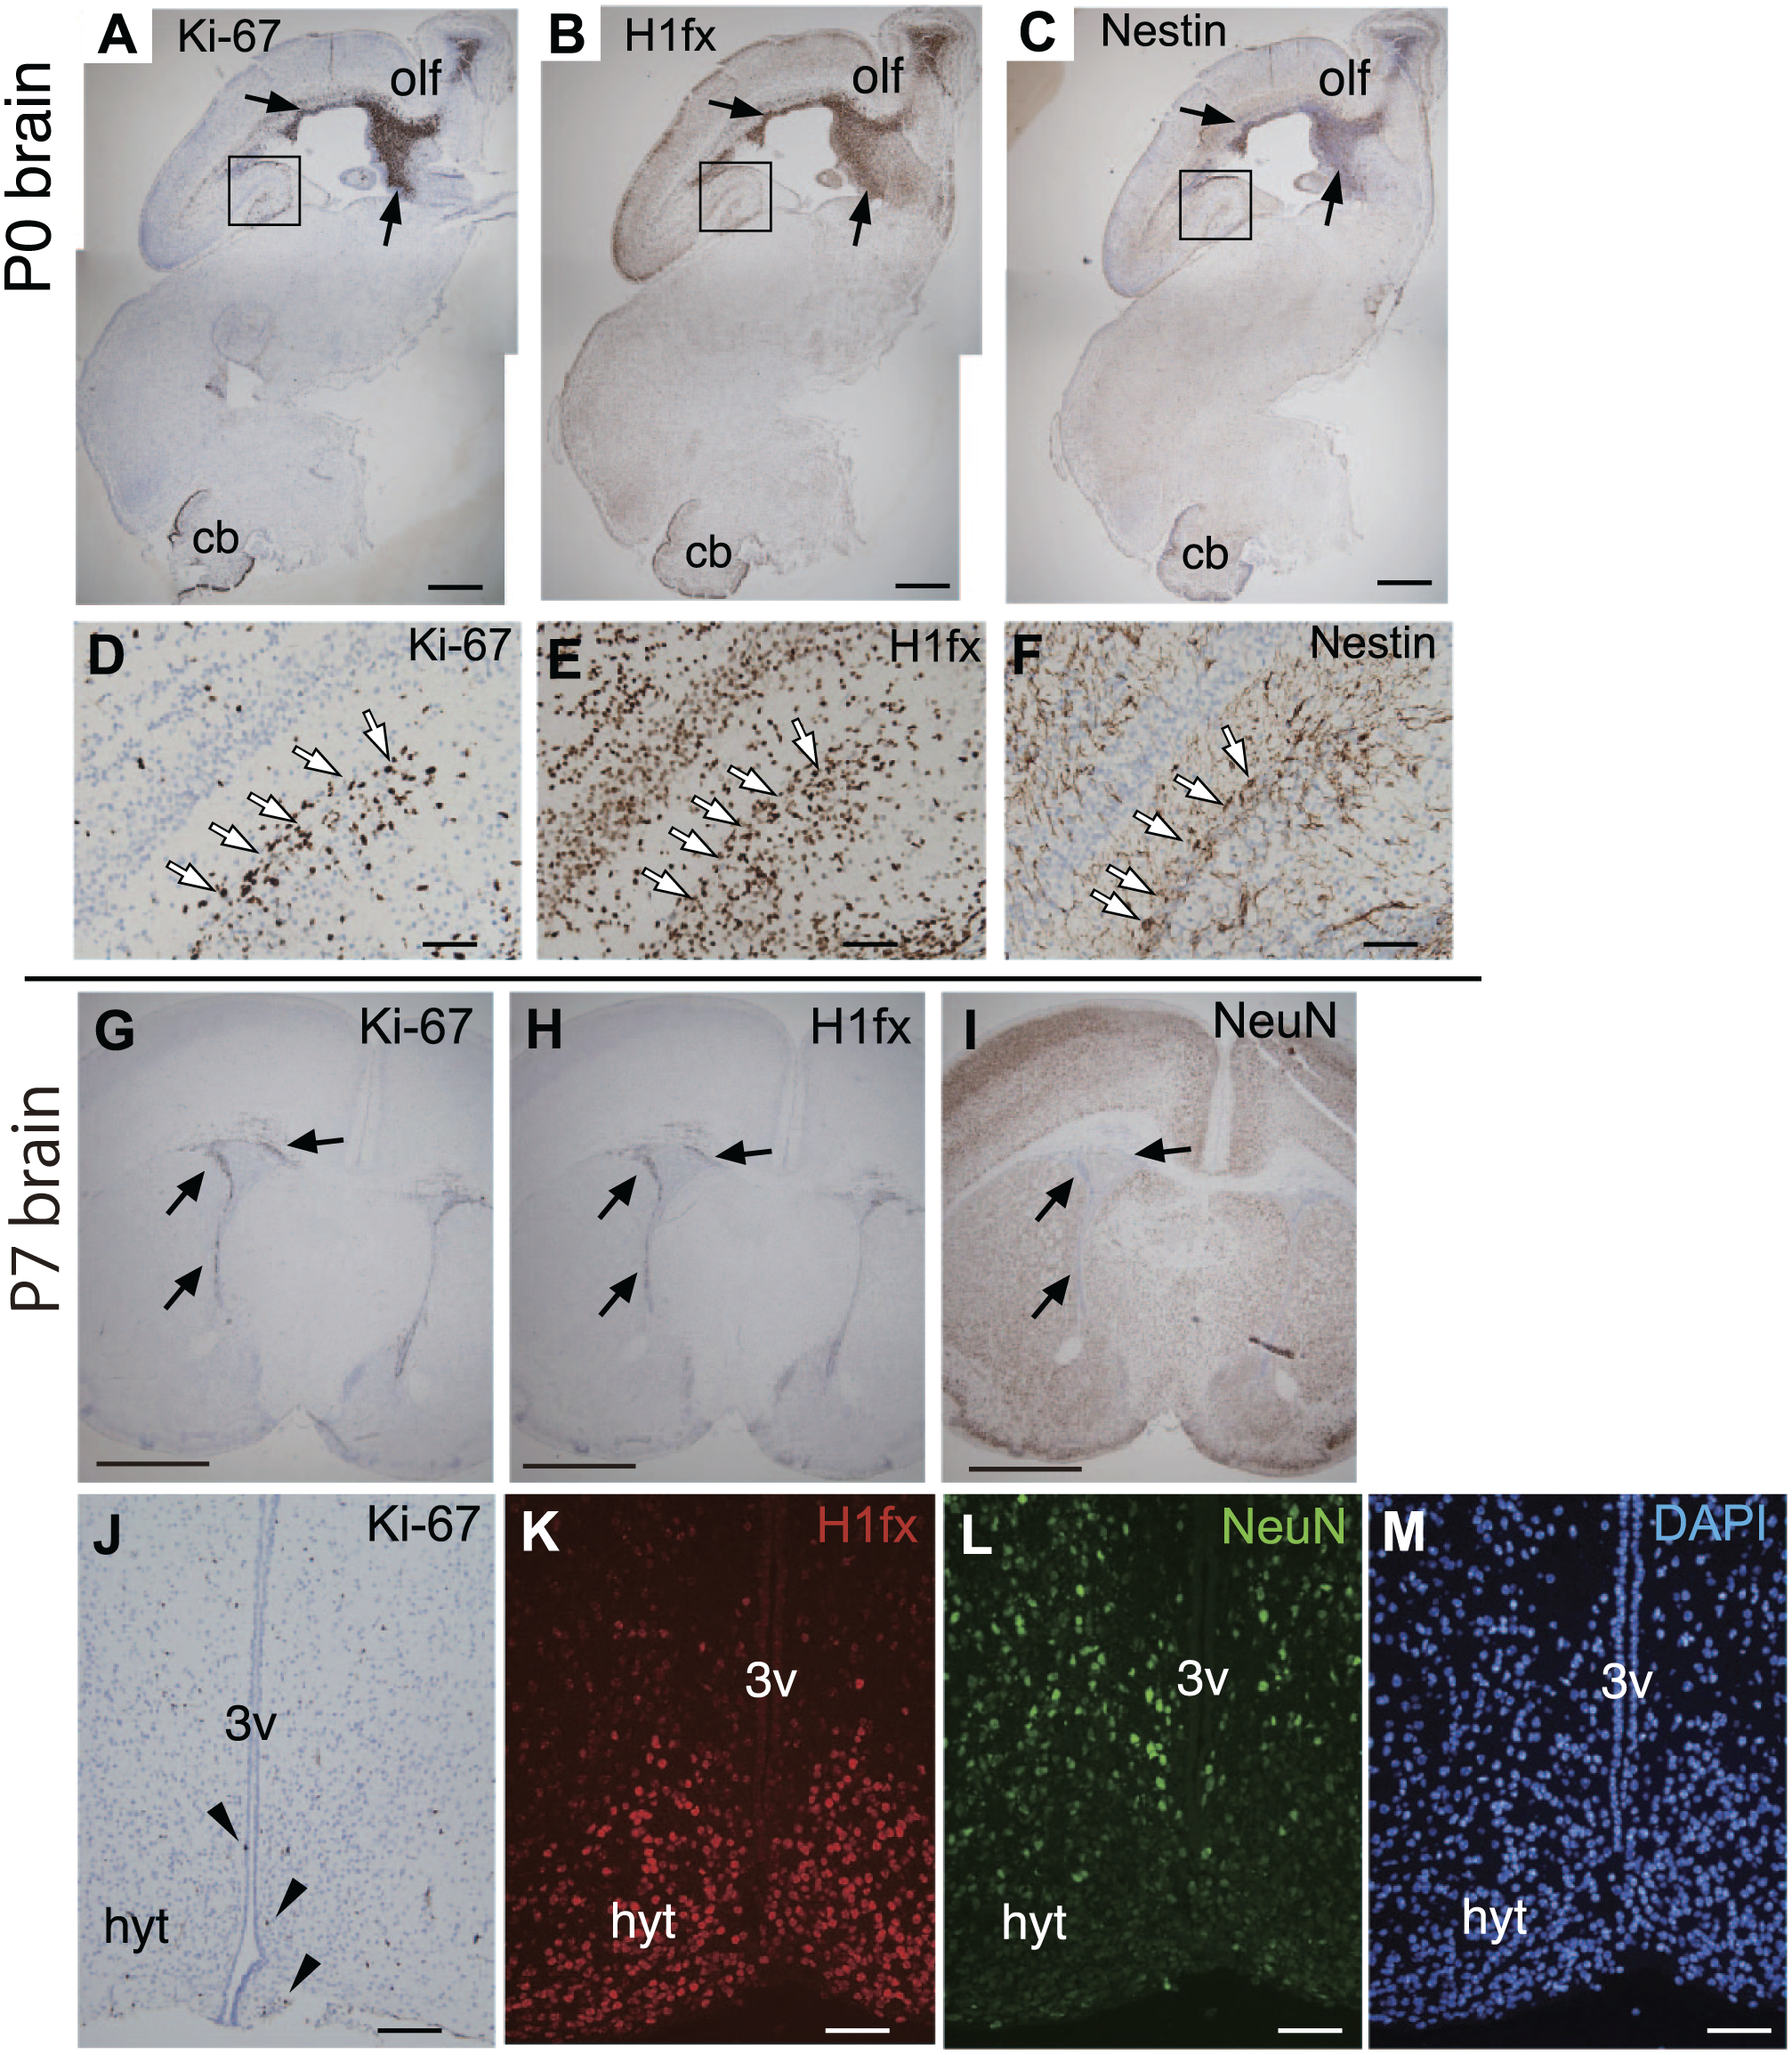
Expression of H1fx in the neonatal (P0) and newborn (P7) brain. The P0 brain and P7 brain were stained with anti-Ki-67 (A, D, G, and J), H1fx (B, E, H, and K), nestin (C and F), NeuN (I and L), and DAPI (M). (A–F) Sagittal sections including the olfactory lobe (olf), connecting to the subventricular zone (black arrows) of the third ventricle, and cerebellum (cb). The boxed regions in A to C are enlarged in D to F. White arrows indicate the cell arrangement in the subgranular zone. (G–I) Coronal sections of the P7 brain. (J to K) The hypothalamus (hyt) of P7 includes the third ventricle (3v). Scale bars: A to C, G to I, 500 µm; D to F, J to M, 50 µm.
At 7 days after birth (P7), H1fx and Ki-67 were immunostained at the edge of the subventricular zone (Fig. 7G–I, arrows). At the hypothalamus area surrounding the third ventricle, a small number of cells were positive for Ki-67 (Fig. 7J, closed arrowhead), whereas H1fx-positive cells were observed at the arcuate nucleus of hypothalamus (Fig. 7K). NeuN, a mature neuronal marker, was expressed at the medial hypothalamic nucleus (Fig. 7L). In terms of the expression of H1fx and NeuN, they were mutually exclusive. H1fx is not likely to be expressed in the terminal differentiated cells.
Next, the expression of H1fx in the adult (P56) brain was investigated. H1fx-positive cells were localized to the subventricular zone, where Ki-67-positive cells and nestin-positive cells were observed, whereas NeuN was not expressed (Fig. 8A–J). H1f0 was ubiquitously expressed in the subventricular zone and the surrounding tissues. At the subgranular zone of the hippocampus, which is known to include neural stem cells, only a few Ki-67–positive cells were detected (Fig. 8K). H1fx was expressed at the subgranular zone and the cerebral cortex, albeit weakly (Fig. 8L). In contrast, NeuN and H1f0 were strongly expressed in both regions (Fig. 8M and N). In the cerebellar cortex, staining for H1fx was observed at the granular layer, but not in the Purkinje cells (Fig. 8P). Ki-67 and nestin were rarely detected in the adult cerebellum (Fig. 8O and Q), whereas NeuN was strongly expressed (Fig. 8R).
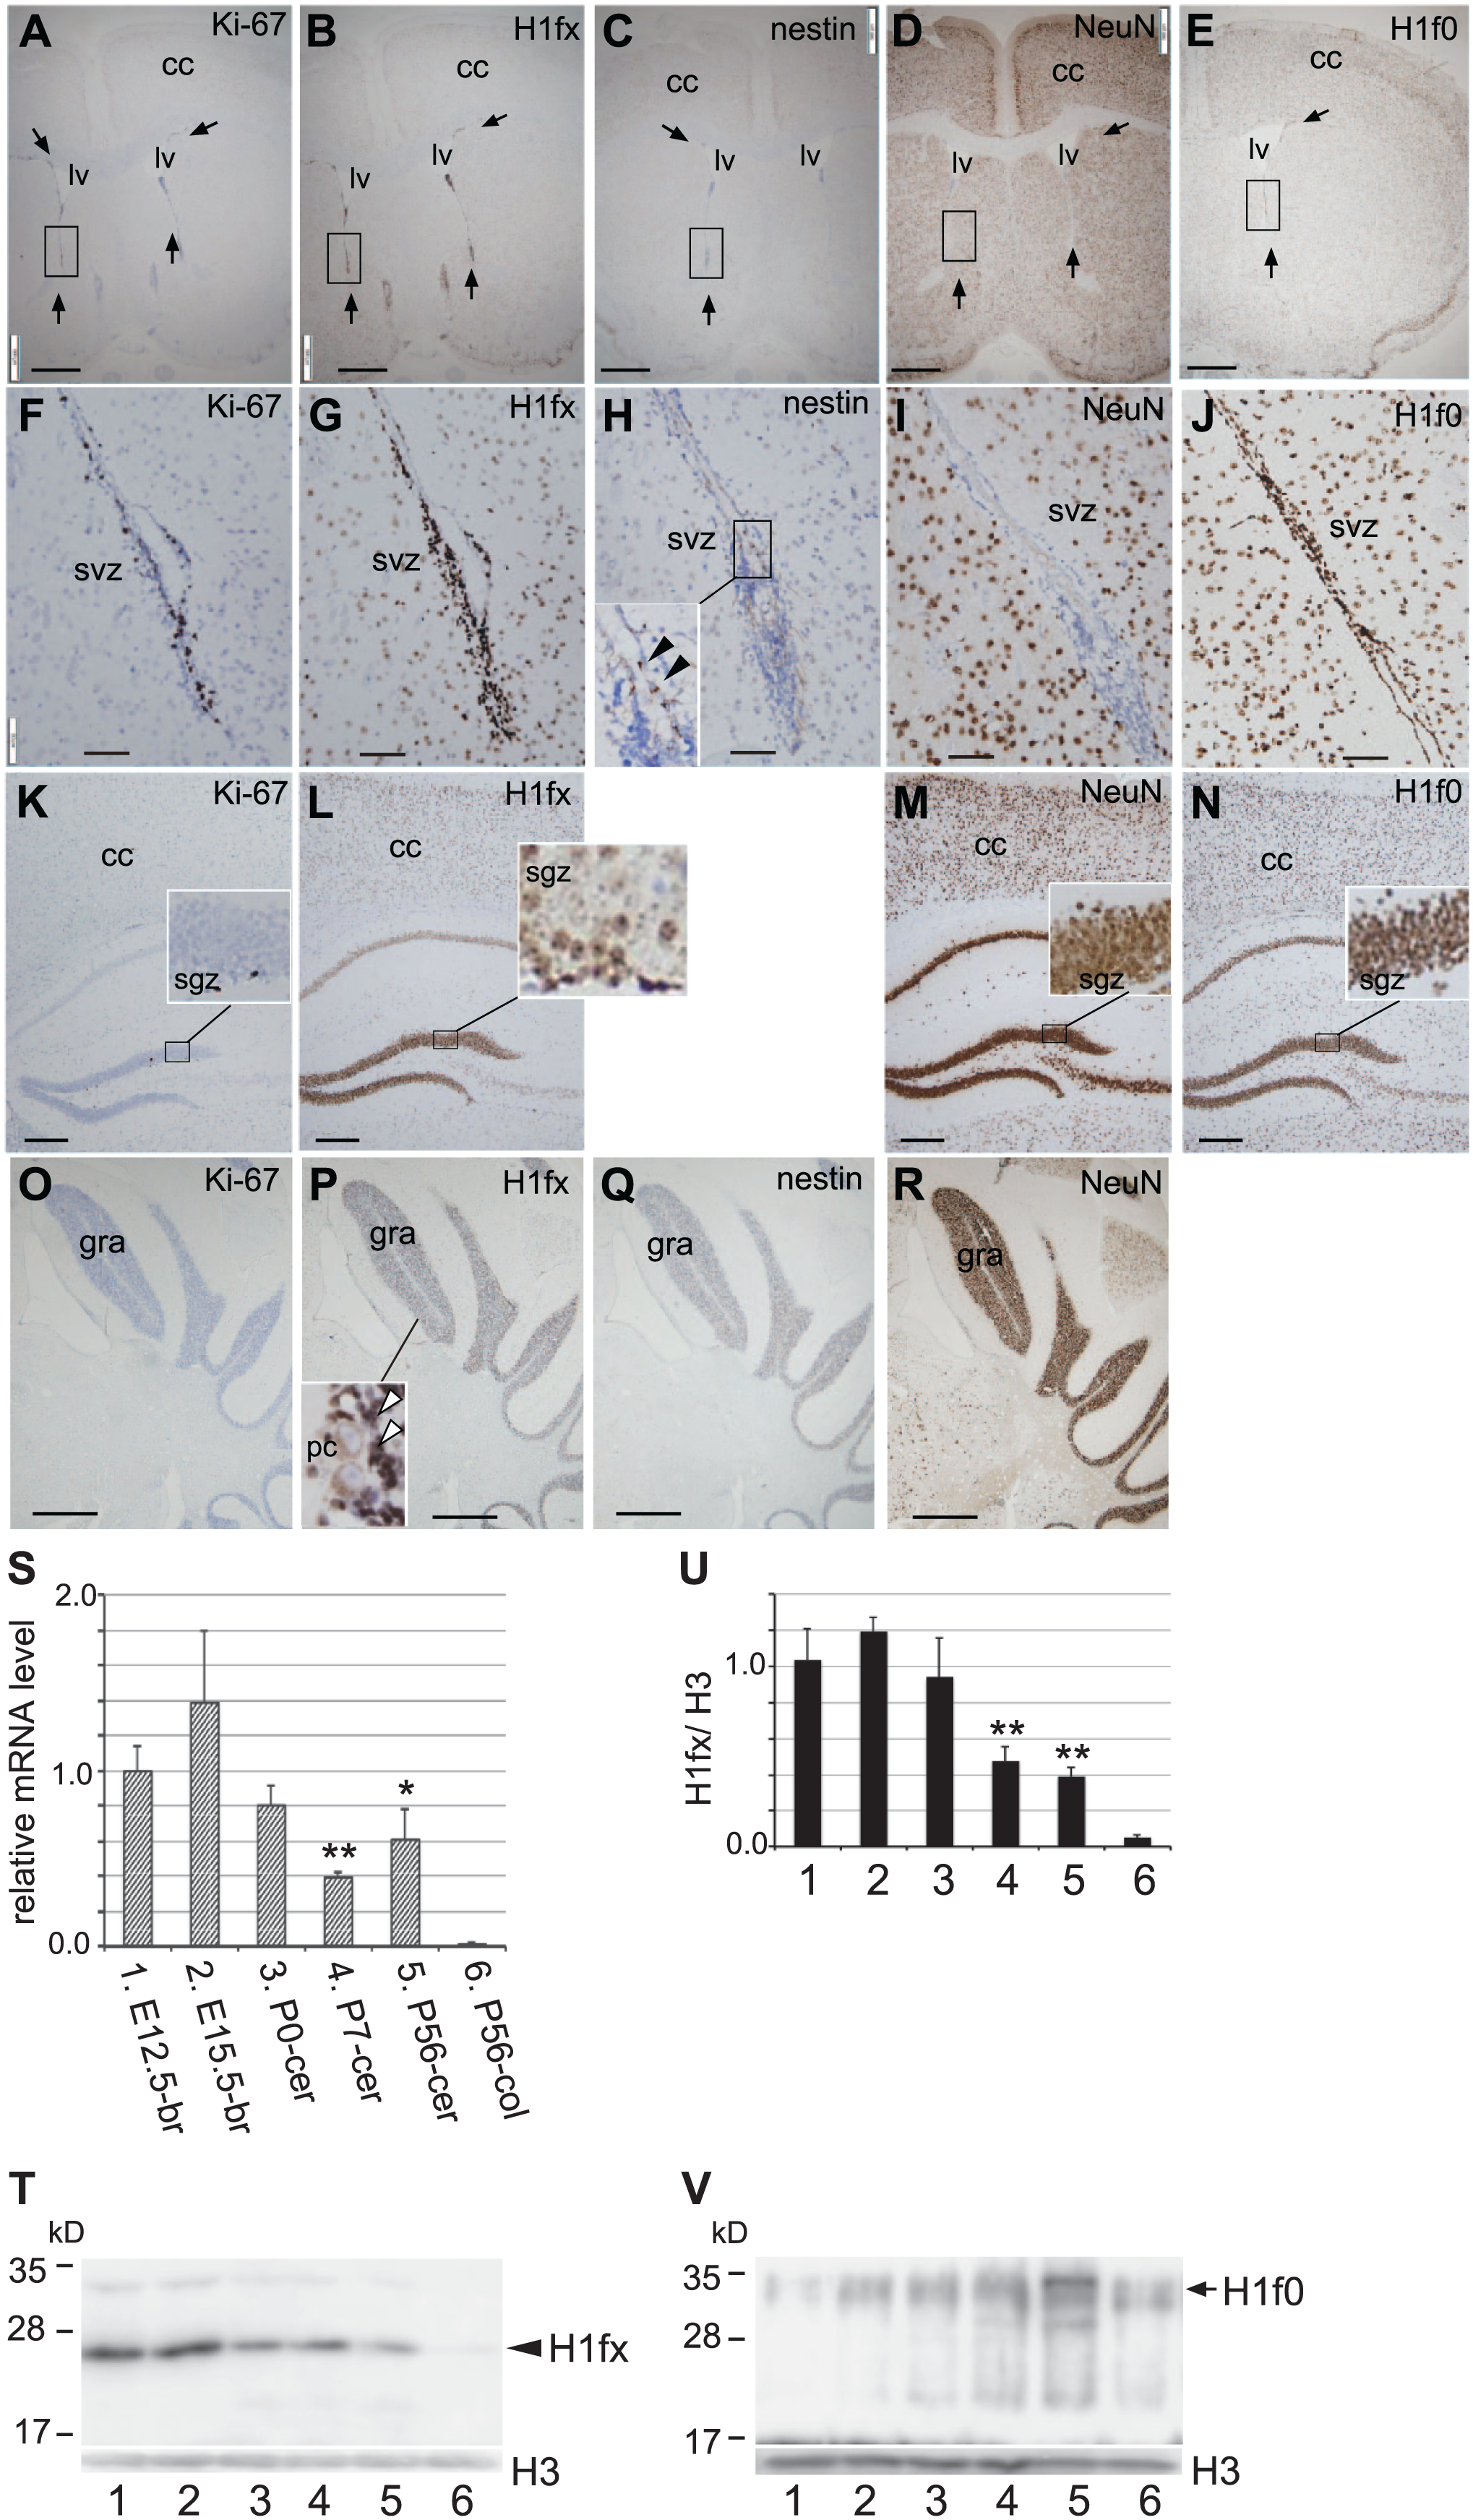
H1fx is locally expressed in the P56 adult brain. Coronal sections of the P56 brain were stained with Ki-67 (A, F, K and, O), H1fx (B, G, L, and P), nestin (C, H, and Q), NeuN (D, I, M, and R), and H1f0 (E, J, and N). (A–E) Arrows represent the subventricular zone along with the lateral ventricles (lv). (F–J) High-magnification images of the boxed regions in A to E, respectively. The high-magnification image of the boxed region in H was indicated as the inset. Black arrowheads indicate the nestin-positive cells. (K–N) The cerebral cortex and the hippocampus. The inset panels in K to N are high-magnification images of the granular zone, including the subgranular zone (sgz). (O–R) Coronal sections of the cerebellum at P56. The inset panel in P represents an enlarged image of the granular layer (gra) including Purkinje cells (pc) and granular cells (white arrowheads). (S) H1fx mRNA expression was analyzed by quantitative real-time PCR (n=4, for samples 1–4, and n=3, for samples 5 and 6). (T) H1fx protein expression was analyzed by western blot. The triplicated samples for each condition were examined, and the representative result was shown. (U) The quantification of the western blot of H1fx. The signal intensities were quantified by Image Analyzer, and the H1fx values were normalized by histone H3 as an internal standard of nuclear protein. (V) The western blot results of H1f0 with the same samples as T. The samples examined in T to V are as follows: lane 1, E12.5 brain; lane 2, E15.5 brain; lane 3, P0 cerebrum; lane 4, P7 cerebrum; lane 5, P56 cerebrum; lane 6, P56 colon. *p<0.05, **p<0.01 (vs E12.5-br, two-tailed Student’s t-test). Scale bars: A to E, O to R, 500 µm; F to J, 50 µm; K to N, 200 µm. Abbreviation: cc, cerebral cortex; svz, subventricular zone.
In addition to immunohistochemical analyses, we also carried out the quantitative real-time PCR (Fig. 8S) and western blot (Fig. 8T–V). H1fx mRNA was highly expressed in the early stages, and declined during neuronal development (Fig. 8S). These results were also confirmed by western blot (Fig. 8T and U). However, H1f0 expression increased along with the neural development (Fig. 8V). These expression patterns were consistent with our histochemical results.
Expression of H1fx in the Other Adult Tissues
Finally, we examined the expression of H1fx in the other adult tissues. The pancreas consists of endocrine and exocrine tissues. In the endocrine portion, both H1fx and H1f0 were expressed in the islets of Langerhans, whereas H1fx was not expressed in the exocrine tissues (Fig. 9A–C). In the adrenal gland, H1fx was expressed at the medulla, and H1f0 was ubiquitously expressed at both the medulla and cortex (Fig. 9D–F). In adults, the intestinal tube is composed of mucosa, submucosa, and muscularis. H1fx was observed at the submucosa, where enteric neural cells called myenteric plexus cells were distributed (Fig. 9G). The triple staining with H1fx, tubulin-β3 (TUJ1), a neuronal marker, and DAPI revealed that the neural cells making up the myenteric plexus expressed H1fx (Fig. 9G–I). However, H1f0 was ubiquitously expressed at the intestinal tissues (Fig. 9J). These results indicate that H1fx shows a restricted expression pattern in adult tissues, whereas H1f0 shows relatively ubiquitous expression.
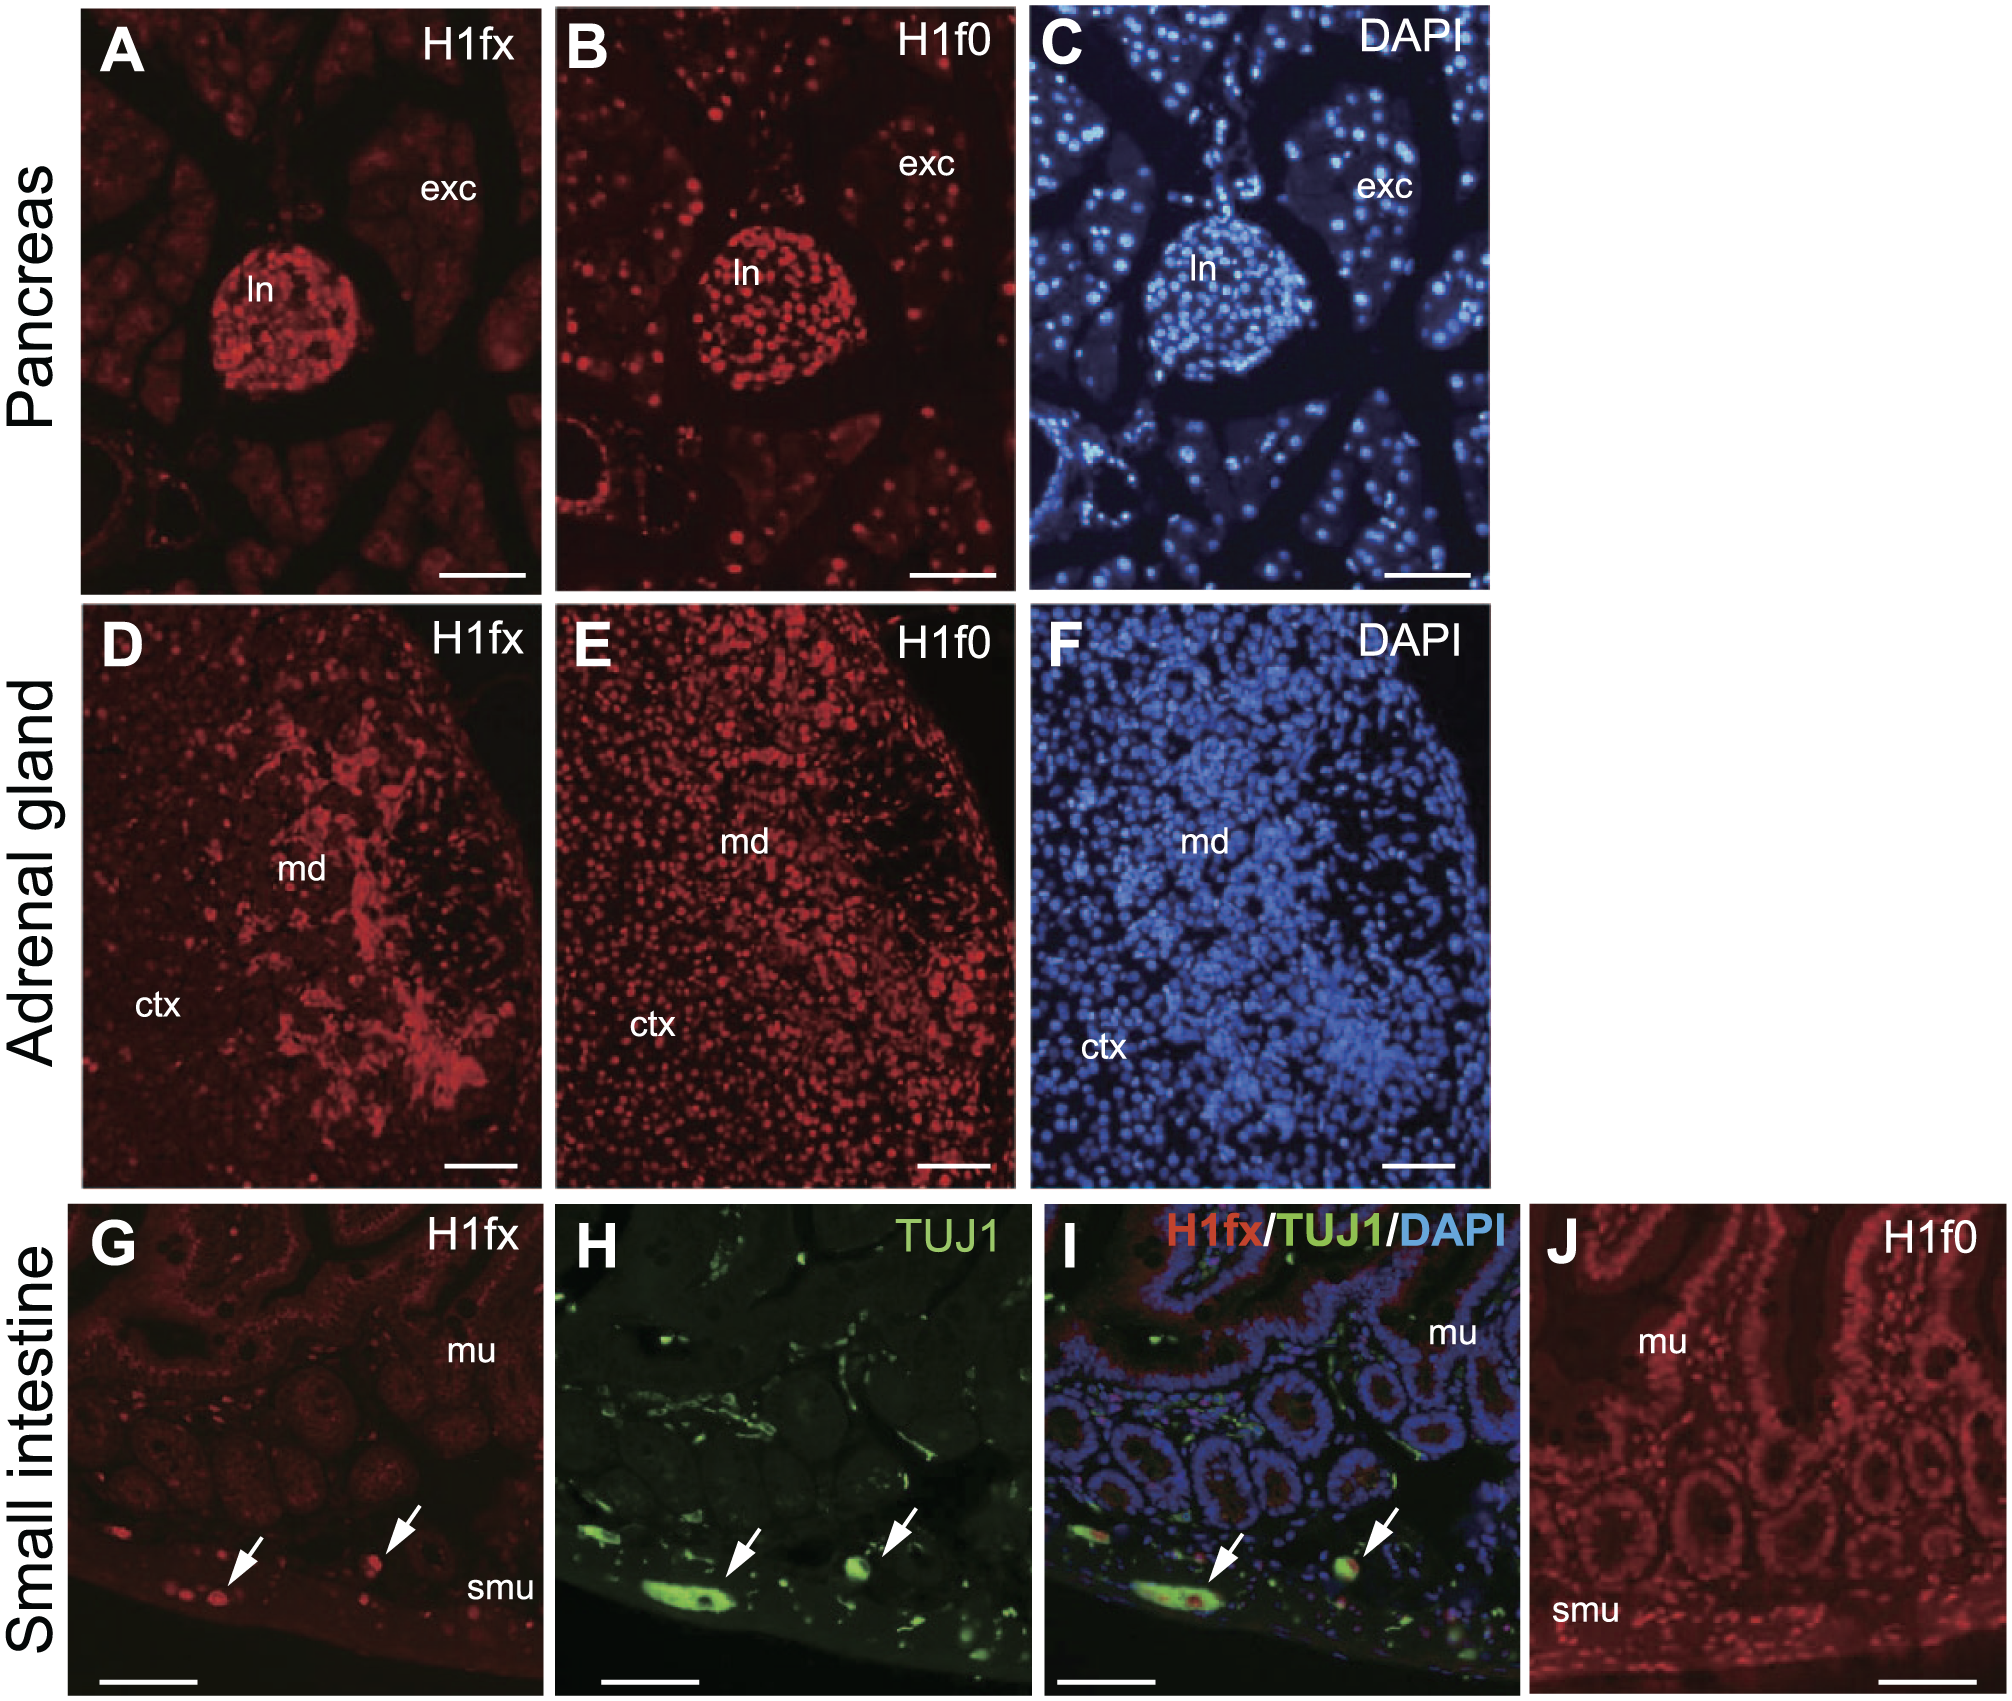
Expression of H1fx and H1f0 in the other adult tissues. Sections from P56 mice are stained with H1fx (A, D, and G), H1f0 (B, E, and J), and TUJ1 (H). (A–C) The pancreas is composed of the endocrine part, the islets of Langerhans (ln), and the exocrine tissues (exc). (D–F) Adrenal gland consisting of the cortex (ctx) and the medulla (me). (G–J) Cross section of the small intestine, consisting of the mucosa (mu), submucosa (smu), and muscularis. White arrows represent the H1fx- and TUJ1-positive cells. (I) Merged image of H1fx (G), TUJ1 (H), and DAPI. Scale bars: A to J, 50 µm.
Discussion
Somatic linker histones are abundant chromatin-binding proteins that facilitate chromatin arrangement and remodeling. Although numerous studies have investigated the roles of somatic linker H1s in mammalian development based on knockout mice and ES cells,10,11,17,19,27,41 the potential involvement of H1fx has not been addressed, as this histone is considered to be ubiquitously expressed. Triple-knockout mice lacking three members of the HI cluster, H1.2−/−, H1.3−/−, and H1.4−/−, can survive until E11.5. ES cells established from triple null mice (H1-KO ESCs) have 50% lower levels of histone H1 proteins compared to normal ES cells.10,19 H1-KO ESCs show resistance to spontaneous differentiation induced by the removal of leukemia inhibitory factor, and exhibit a normal growth rate accompanied by the expression of core pluripotency genes and the stem cell marker, stage specific embryonic antigen 1.42,43 Another triple-knockout mouse line lacking H1.2−/−, H1.4−/−, and H1f0−/− exhibits lower birth rate and growth retardation. 10 H1f0 is accumulated in the terminally differentiated cells of these mice at the postnatal stage.12,13 These results imply that H1.2, H1.3, H1.4, and H1f0 are likely to be required for the later stages of embryogenesis, including organogenesis.
In this article, we showed that the H1fx protein was expressed at the prestreak stage E6.0, and was more strongly expressed in all three embryonic germ layers at E7.0 (Fig. 1). These results indicate that H1fx is upregulated throughout the entire epiblast during gastrulation, as previously suggested. 33 H1fx, together with Ki-67, continued to show high expression in the whole embryo until E10.5 (Fig. 2–3). Thus, H1fx might be involved in pluripotency at the early stages. Between E10.5 and E12.5, H1fx appeared to be expressed in the ventricular zone of both the brain and spinal cord (Fig. 3 and 4). It was notable that the expression of H1fx became restricted within those specific tissues after E10.5. At E15.5, H1fx was expressed at the subventricular zone, intermediate zone, and the cortical plate in the cerebral cortex, whereas Ki-67 was observed at the subventricular zone. The expression of H1fx was low in the adult brain, but was positive at the subventricular zone and subgranular zone of the cerebrum, where the neural stem cells remained (Fig. 7 and 8). Therefore, H1fx is likely to be expressed not only in the proliferative cells during embryogenesis but also in the progenitor or precursor cells supplying mature neurons to the brain. The high expression of H1fx at the gastrulation and somitogenesis stages suggests that this histone plays a role in the regulation of cell differentiation and tissue organization. Therefore, to elucidate the mechanisms of embryonic development or tumorigenesis, additional investigations into the molecular mechanism by which H1fx functions in those undifferentiated cells will be needed.
Some human cancer cells show a high frequency of heterogeneous H1f0 expression. As either silencing or loss of H1f0 induces faster tumor growth and genome-wide changes in gene expression, it appears that the self-renewal activity of tumor cells is strongly related to the loss of H1f0. 44 However, there are no data regarding which H1 members are highly expressed in malignant tumor cells. As shown in Fig. 1, embryonic cells at E7.0 do not express H1f0, but highly express H1fx. This is the stage at which these embryonic cells commit to their fates, and begin to differentiate through the regulation of certain transcription factors. The H1fx protein is localized at the coding regions, the RNA polymerase II–enriched regions and the hypomethylated CpG islands in the genome,28,29 and it shows significantly lower binding affinity to DNA/nucleosome and histone chaperones compared with H1f0. 31 These characteristics suggest that H1fx is involved in the regulation of transcriptional processes of significant transcription factors governing embryogenesis. Although we indeed observed the nuclear localization of H1fx (Fig. 8L and P), further analyses, for example, ChIP assays, RNA binding assays, and detailed subnuclear localization, would verify the H1fx roles in the development. However, the knockdown of H1.3, another H1 variant highly expressed in ES cells, did not affect their self-renewal ability. 27 H1.3, as well as H1.2, is unlikely to contribute to the transcriptional regulation, as both were enriched at AT-rich regions. 41 Taken together, these findings suggest that H1fx plays a specific role in regulating the character of immature embryonic cells, which would be clearly distinguishable from the roles played by other H1 variants. Moreover, H1fx might support the growth of H1f0-negative tumor cells.
In some adult tissues, H1fx and H1f0 were differently expressed. We observed H1fx protein expression at the hypothalamus, granular layer of cerebellum, islets of Langerhans, adrenal medulla, and myenteric plexus in the small intestine at P56. In previous reports, H1fx has been shown to be upregulated in neuroendocrine tumors and astroglioma.23,24 Together, these results imply that H1fx may support the neural tissues in adults, although the expression of H1fx is diminished along with the differentiation of other tissues.
Footnotes
Author Contributions
KI-T and SK designated the experiments. KI-T performed the experiments. KI-T and SK drafted, and KK revised the manuscript. All authors reviewed and approved the final version of the manuscript.
Competing Interests
The author(s) declared no potential conflicts of interest with respect to the research, authorship, and/or publication of this article.
Funding
The author(s) disclosed receipt of the following financial support for the research, authorship, and/or publication of this article: Research funds (to KI-T) were from Aichi Gakuin University, and grants were from the Ministry of Education, Culture, Sports, Science and Technology of Japan (15K15079 to KK and 16K08617 to SK).