
Abstract
The functions of type II diacylglycerol kinase (DGK) δ and -η in the brain are still unclear. As a first step, we investigated the spatial and temporal expression of DGKδ and -η in the brains of mice. DGKδ2, but not DGKδ1, was highly expressed in layers II–VI of the cerebral cortex; CA–CA3 regions and dentate gyrus of hippocampus; mitral cell, glomerular and granule cell layers of the olfactory bulb; and the granule cell layer in the cerebellum in 1- to 32-week-old mice. DGKδ2 was expressed just after birth, and its expression levels dramatically increased from weeks 1 to 4. A substantial amount of DGKη (η1/η2) was detected in layers II–VI of the cerebral cortex, CA1 and CA2 regions and dentate gyrus of the hippocampus, mitral cell and glomerular layers of the olfactory bulb, and Purkinje cells in the cerebellum of 1- to 32-week-old mice. DGKη2 expression reached maximum levels at P5 and decreased by 4 weeks, whereas DGKη1 increased over the same time frame. These results indicate that the expression patterns of DGK isozymes differ from each other and also from other isozymes, and this suggests that DGKδ and -η play distinct and specific roles in the brain.
Keywords
Introduction
Diacylglycerol kinase (DGK) is a lipid-metabolizing enzyme that phosphorylates diacylglycerol (DG) to produce phosphatidic acid (PA). DG and PA are important precursors of triacylglycerol and phospholipids. In addition, they act as lipid second messengers in a wide variety of biological processes in mammalian cells (English 1996; Exton 1994; Hodgkin et al. 1998). DG activates several signaling proteins, such as conventional protein kinase C (PKC), novel PKC, Unc-13, and Ras guanyl nucleotide-releasing protein (Hurley et al. 1997; Nishizuka 1992; Ron and Kazanietz 1999), whereas PA regulates phosphatidylinositol-4-phosphate 5-kinase (Jenkins et al. 1994; Moritz et al. 1992), the mammalian targets of rapamycin (Fang et al. 2001), and atypical PKC (Limatola et al. 1994). Thus, DGK plays a pivotal role in various intracellular signaling pathways by regulating DG and PA concentrations. DGK represents a large enzyme family (Goto et al. 2006; Merida et al. 2008; Sakane et al. 2007; Topham and Epand 2009): ten DGK isozymes (α, β, γ, δ, η, κ, ϵ, ζ, ι, and θ) have been identified and are classified into five subtypes based on their structural features.
The type II DGK (Sakai and Sakane 2012) comprises δ (Sakane et al. 1996), η (Klauck et al. 1996), and κ (Imai et al. 2005) isozymes. Moreover, alternative splice variants of DGKδ (δ1 and δ2) (Sakane et al. 2002) and DGKη (η1 and η2) (Murakami et al. 2003) have been identified. All type II DGK isoforms possess a pleckstrin homology domain at the N-terminus and a separated catalytic region, and DGKs δ1, δ2, and η2, but not DGK η1, contain a sterile α-motif domain at the C-terminus. DGKδ2 specifically contains the proline-rich stretch of 52 residues, which extends from the N-terminus (Sakane et al. 2002).
On the basis of the analysis of DGKδ-knockout (KO) mice, it has recently been reported that DGKδ regulates the epidermal growth factor receptor pathway in epithelial cells of lung and skin (Crotty et al. 2006) and insulin receptor signaling in skeletal muscle (Chibalin et al. 2008) by modulating PKC activity. We recently reported that DGKη was expressed in stomach cancer and HeLa cervical cancer cells, and have shown that it is required for the Ras/B-Raf/C-Raf/MEK/ERK signaling cascade, which is activated by epidermal growth factor (Yasuda et al. 2009).
In addition to being expressed in skeletal muscle (δ) (Chibalin et al. 2008) and stomach cancer (η) (Yasuda et al. 2009), here we show that DGKδ and η are abundantly expressed in mouse brain (see Results). Moreover, DGKδ and η have been reported to relate to neurological disorders (Sakai and Sakane 2012; Sakane et al. 2008). For example, one report indicated that disruption to DGKδ was linked with epileptic seizures and a psychiatric disorder in a female patient (Leach et al. 2007). In another patient with bipolar disorder, DGKη mRNA levels were found to be increased (Moya et al. 2010). A genome-wide association study has also implicated DGKη in the etiology of bipolar disorder (Baum et al. 2008; Weber et al. 2011). However, the functions of DGKδ and -η in neurological disorders are still unclear, and their detailed expression and distribution in the brain have yet to be revealed. An investigation of the expression patterns of DGKδ and -η in the brains of mice may help to elucidate the specific functions of DGKδ and -η in the central nervous system. Therefore, in this study, we examined the spatial and temporal expression and distribution of DGKδ and -η proteins and mRNAs in the mouse brain.
Materials & Methods
Animals and Tissue Preparation
C57BL/6N mice were obtained from SLC Japan Inc. (Shizuoka, Japan). Tissues were removed immediately after decapitation. All procedures using experimental animals were performed according to the guidelines for the Care and Use of Laboratory Animals of Chiba University.
Western Blotting
All of the tissues collected were homogenized in lysis buffer (50 mM HEPES, pH7.2, 150 mM NaCl, 5 mM MgCl2) containing complete EDTA-free protease inhibitor cocktail (Roche Diagnostics; Mannheim, Germany) and centrifuged at 1,000 × g for 5 min. The protein concentration in the supernatants was determined by a bicinchoninic acid protein assay kit (Thermo Scientific; Wilmington, DE). The tissue lysates (20 or 30 µg of protein) were separated on SDS-PAGE. The separated proteins were transferred to polyvinylidene difluoride membranes (Pall Life Sciences; Port Washington, NY). Membranes were blocked with 5% skim milk and incubated with anti-DGKδ polyclonal antibody (serum, 1:1000 dilution) (Sakane et al. 2002), anti-DGKη polyclonal antibody (0.5 µg/µl, 1:3000 dilution) (ProteinTech Group; Chicago, IL), or anti-β-actin polyclonal antibody (0.8 µg/µl, 1:5000 dilution) (Sigma-Aldrich; St Louis, MO) overnight at 4C. The immunoreactive bands were visualized using a peroxidase-conjugated anti-rabbit IgG antibody (0.8 µg/µl, 1:10,000 dilution) (Jackson ImmunoResearch Laboratories; West Grove, PA) and the ECL Western Blotting Detection System (GE Healthcare Bio-Sciences; Piscataway, NJ).
RT-PCR Amplification of the DGK mRNA
Brains were homogenized in QIAzol lysis reagent, and total RNA was isolated with the RNeasy Lipid Tissue Midi Kit (Qiagen; Venlo, Netherlands). cDNA synthesis was performed with the Transcriptor First-Strand cDNA Synthesis Kit (Roche Diagnostics), using 0.5 µg of total RNA and random hexamer primers. PCR amplification was performed using KOD–Plus (Toyobo; Osaka, Japan) and the following mouse oligonucleotide primers against DGKδ and -η. DGKδ primers: forward primer (nucleotide positions 4506–4527, 5’-CGGGATCCGGAAGTGACATATGCCATGAGA-3’); reverse primer (nucleotide positions 5484–5505, 5’-GGGGTACCTCCTTCATTCTATCCCTCTCCA-3’). The PCR conditions were as follows: 94C for 3 min, 35 cycles of 94C for 30 sec, 56C for 30 sec, and 68C for 1.5 min, and 68C for 5 min. DGKη primers: forward primer (nucleotide positions 2417–2436, 5’-GGGAATTCCGGGAGCTACTACAGAGATC-3’); reverse primer (nucleotide positions 3224–3243, 5’-GGGGGTCGACCTCCACAGAGTGTAAGGCAC-3’). The PCR conditions were as follows: 94C for 3 min, 35 cycles of 94C for 30 sec, 58C for 30 sec, and 68C for 2 min, and 68C for 5 min. PCR products were subcloned into BamHI/KpnI and EcoRI/SalI sites of pBluescript SK (+) vector (Stratagene-Agilent Technologies; Santa Clara, CA), respectively.
Preparation of Digoxigenin-labeled Riboprobes for In Situ Hybridization
Plasmids were cut with either Asp718 (Roche Diagnostics) or BamHI for DGKδ mRNA and also with either SalI or EcoRI for DGKη mRNA to produce the sense or antisense probes. The antisense probe for DGKη mRNA recognizes both DGKη1 and -η2. Digoxigenin (DIG)-labeled probes were synthesized by transcribing 3 µg of template linear DNA with T3 and T7 RNA polymerase (Promega; Madison, WI) according to DIG RNA labeling kit protocol (Roche Diagnostics).
In Situ Hybridization
Isolated mouse brains were rapidly frozen in 100% OCT compound (Tissue-Tek Sakura Finetek USA, Inc.; Torrance, CA) in a dry ice-hexane bath. Frozen brains were sectioned at a 25-µm thickness (Leica; Solms, Germany) and mounted on APS-coated slides (S8441, Matsunami; Tokyo, Japan). Sections were fixed in 4% paraformaldehyde in phosphate-buffered saline (PBS, Wako Pure Chemical; Osaka, Japan) for 10 min. Basic proteins were acetylated with 0.5% acetic anhydrite in 0.1 M triethylamine (pH 8.0). Both before and after this process, slides were rinsed with PBS. Pre-hybridization was carried out with hybridization buffer (40% deionized formamide, 10% dextran sulfate, 1× Denhard’s solution, 4× SSC (1× SSC; 0.15 M NaCl, 15 mM sodium citrate), 10 mM dithiothreitol, 1 mg/ml tRNA from baker’s yeast, 1 mg/ml boiled deoxyribonucleic acid from salmon sperm) without riboprobes for 20 min at room temperature. Hybridization was performed overnight at 72C with a hybridization buffer with 0.25 mg/ml DIG-labeled riboprobe, which was denatured at 80C for 5 min. At the end of incubation, sections were rinsed at 72C sequentially with the following solutions: 1× SSC, 0.2× SSC, 0.1× SSC, 0.05× SSC. Sections were then blocked for 1 hr in blocking reagent solution (Roche Diagnostics). Sections were incubated overnight at 4C in the presence of anti-DIG Fab fragments conjugated with alkaline phosphatase diluted 1:5000 in blocking reagent solution. Staining was developed using nitroblue terazolium/5-bromo-4-chloro-3-indolyl-phosphate staining solution according to the DIG Nucleic Acid Detection Kit protocol (Roche Diagnostics).
Results
Expression of DGKδ in the Brain
Type II DGK consists of δ, η, and κ isozymes. Because DGKκ was not expressed in the mouse brain (Imai et al. 2005), we focused on the distribution of DGKδ and -η. First, we determined the expression of DGKδ protein using western blotting in various mouse tissues. We confirmed that a 135-kDa band of DGKδ2 was detected (Sakane et al. 2002) in the extract from the whole brain of a C57BL6/N mouse (Supplemental Fig. 1). This was confirmed using brain tissue extracts from a recently established strain of brain-specific DGKδ-knockout mouse (Usuki et al., unpublished work), for which a band for DGKδ2 could not detected (Supplemental Fig. 1). DGKδ1 (130 kDa), an alternative spliced product, was undetectable in the mouse brain (Supplemental Fig. 1). Although DGKδ was detected broadly in multiple mouse tissues, this protein was most strongly expressed in the brain (Fig. 1A).
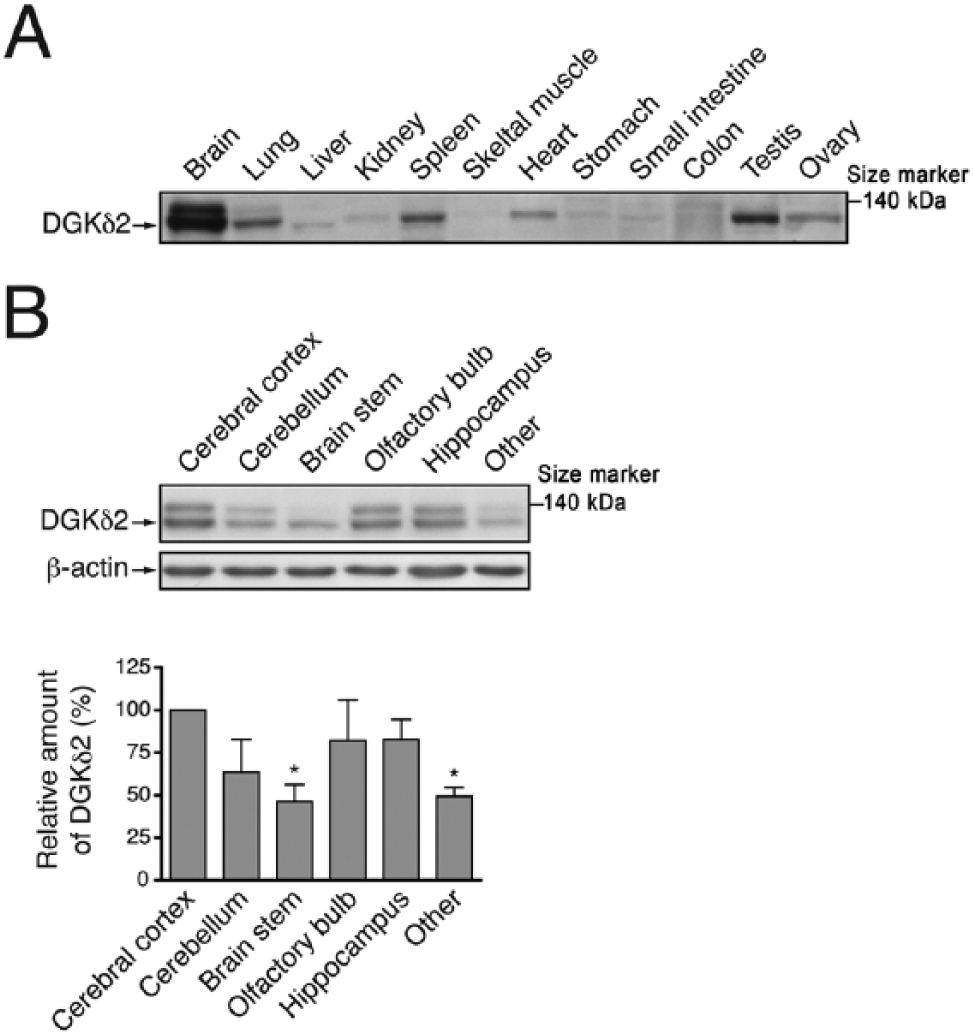
Expression of DGKδ protein in mouse tissues. (A) Thirty µg protein samples from the indicated tissues of a 25-week-old mouse were probed with anti-DGKδ antibody. (B) The brain of 12-week-old mouse was sectioned into six parts, as indicated, and DGKδ and β-actin were detected by western blotting using anti-DGKδ and anti-β-actin antibodies, respectively. The graph shows the relative amount of DGKδ2 in the various brain regions. DGKδ immunoblots were scanned and DGKδ2 levels were quantified using Image J software (NIH; Bethesda, MD) and normalized relative to β-actin levels. DGKδ2 protein level in the cerebral cortex was set to 100%. Data shown are the mean ± SD of four independent experiments. Statistical significance was determined by ANOVA followed by Tukey’s post hoc test (*p<0.05 vs cerebral cortex).
To examine the expression pattern of DGKδ in the brain in detail, we sectioned the mouse brain into six parts: cerebral cortex, cerebellum, brain stem, olfactory bulb, hippocampus, and other regions, which included the midbrain and hypothalamus. We detected DGKδ in each of these tissue regions in 12-week-old mice, with the highest level of expression in the cerebral cortex and relatively high levels in the olfactory bulb, hippocampus, and cerebellum (Fig. 1B).
Spatio-temporal Expression of DGKδ Protein and mRNA in the Developing Brain
To examine the temporal expression pattern of DGKδ in the brain, we detected DGKδ in P0 to 32-week-old mouse brains. In the entire brain, DGKδ was already expressed just after birth, and its expression levels reached a maximum at 4 weeks (Fig. 2A). The expression levels of DGKδ increased until 4 weeks in the cerebral cortex, as observed with a whole brain (Fig. 2B). However, other sites including the cerebellum, olfactory bulb, and hippocampus, showed no marked age-dependent changes with respect to the expression of DGKδ (Fig. 2C–2E).
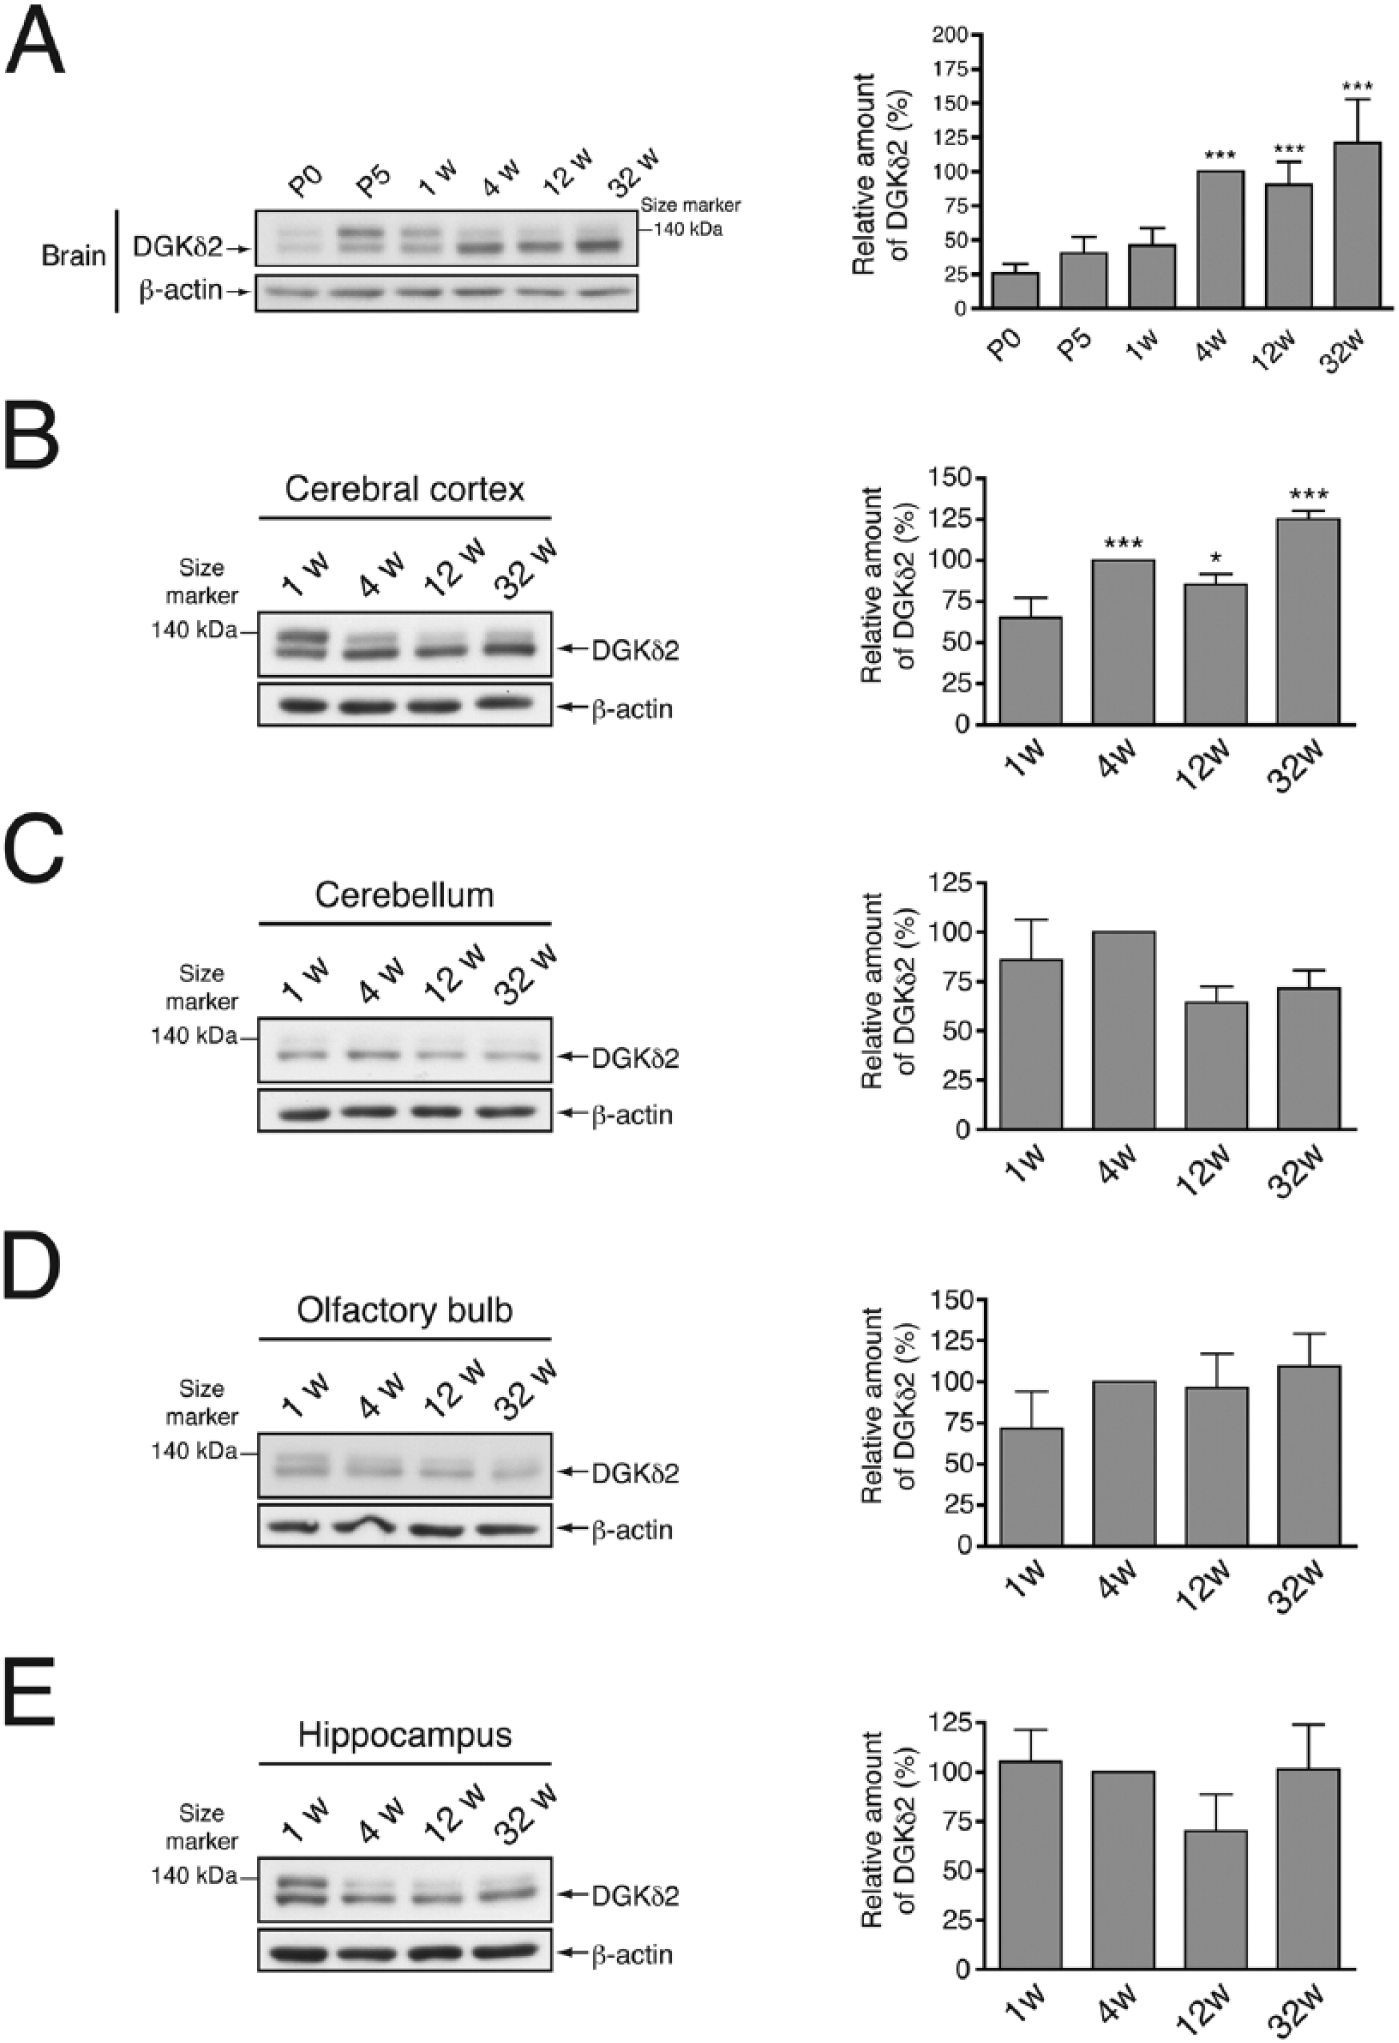
Age-dependent expression levels of DGKδ in mouse brain. (A) Western blot analysis of the whole brains of P0 to 32-week-old mice. (B–E) Western blot analysis of cerebral cortex (B), cerebellum (C), olfactory bulb (D), and hippocampus (E) of 1- to 32-week-old mice using anti-DGKδ and anti-β-actin antibodies. The graphs show the relative amount of DGKδ2. DGKδ immunoblots were scanned and DGKδ2 levels were quantified using Image J software (NIH; Bethesda, MD) and normalized relative to β-actin levels. DGKδ2 protein level from 4-week-old mice was set to 100%. Data shown are the mean ± SD of four independent experiments. Statistical significance was determined by ANOVA followed by Tukey’s post hoc test (*p<0.05, ***p<0.005 vs P0 (A) or 1 week (B–E)). P, postnatal age; w, week(s).
Next, we tried to detect the distribution of DGKδ in the brain in more detail. However, the anti-DGKδ antibody (Sakane et al. 2002) generated high background staining, so we switched to in situ hybridization. Brains from 1-, 4-, 12-, and 32-week-old mice were sectioned and stained with antisense RNA against DGKδ mRNA. In the cerebral cortex, where DGKδ protein was expressed at high levels (Fig. 1B), DGKδ mRNA was broadly distributed under the external granule layer (layer II) but not in the molecular layer (layer I) (Figs. 3A and 4A). DGKδ mRNA was also detected in the cerebellum, olfactory bulb, and hippocampus (Fig. 3B–3D). In the cerebellum, DGKδ mRNA was distributed in the granule cell layer, but not in the Purkinje cell layer (Figs. 3B and 4B). In the olfactory bulb, DGKδ mRNA was detected in mitral cell, glomerular and granule cell layers (Figs. 3C and 4C). In addition, DGKδ mRNA was expressed in the pyramidal cells of CA1–3 regions of hippocampus and in the granule cells of the dentate gyrus (Figs. 3D and 4D–4G). However, we could not find a marked development-dependent alteration in DGKδ mRNA expression (Fig. 3); although the brain sections were also hybridized with the sense probe of DGKδ mRNA as a control, no distinct staining was detected.
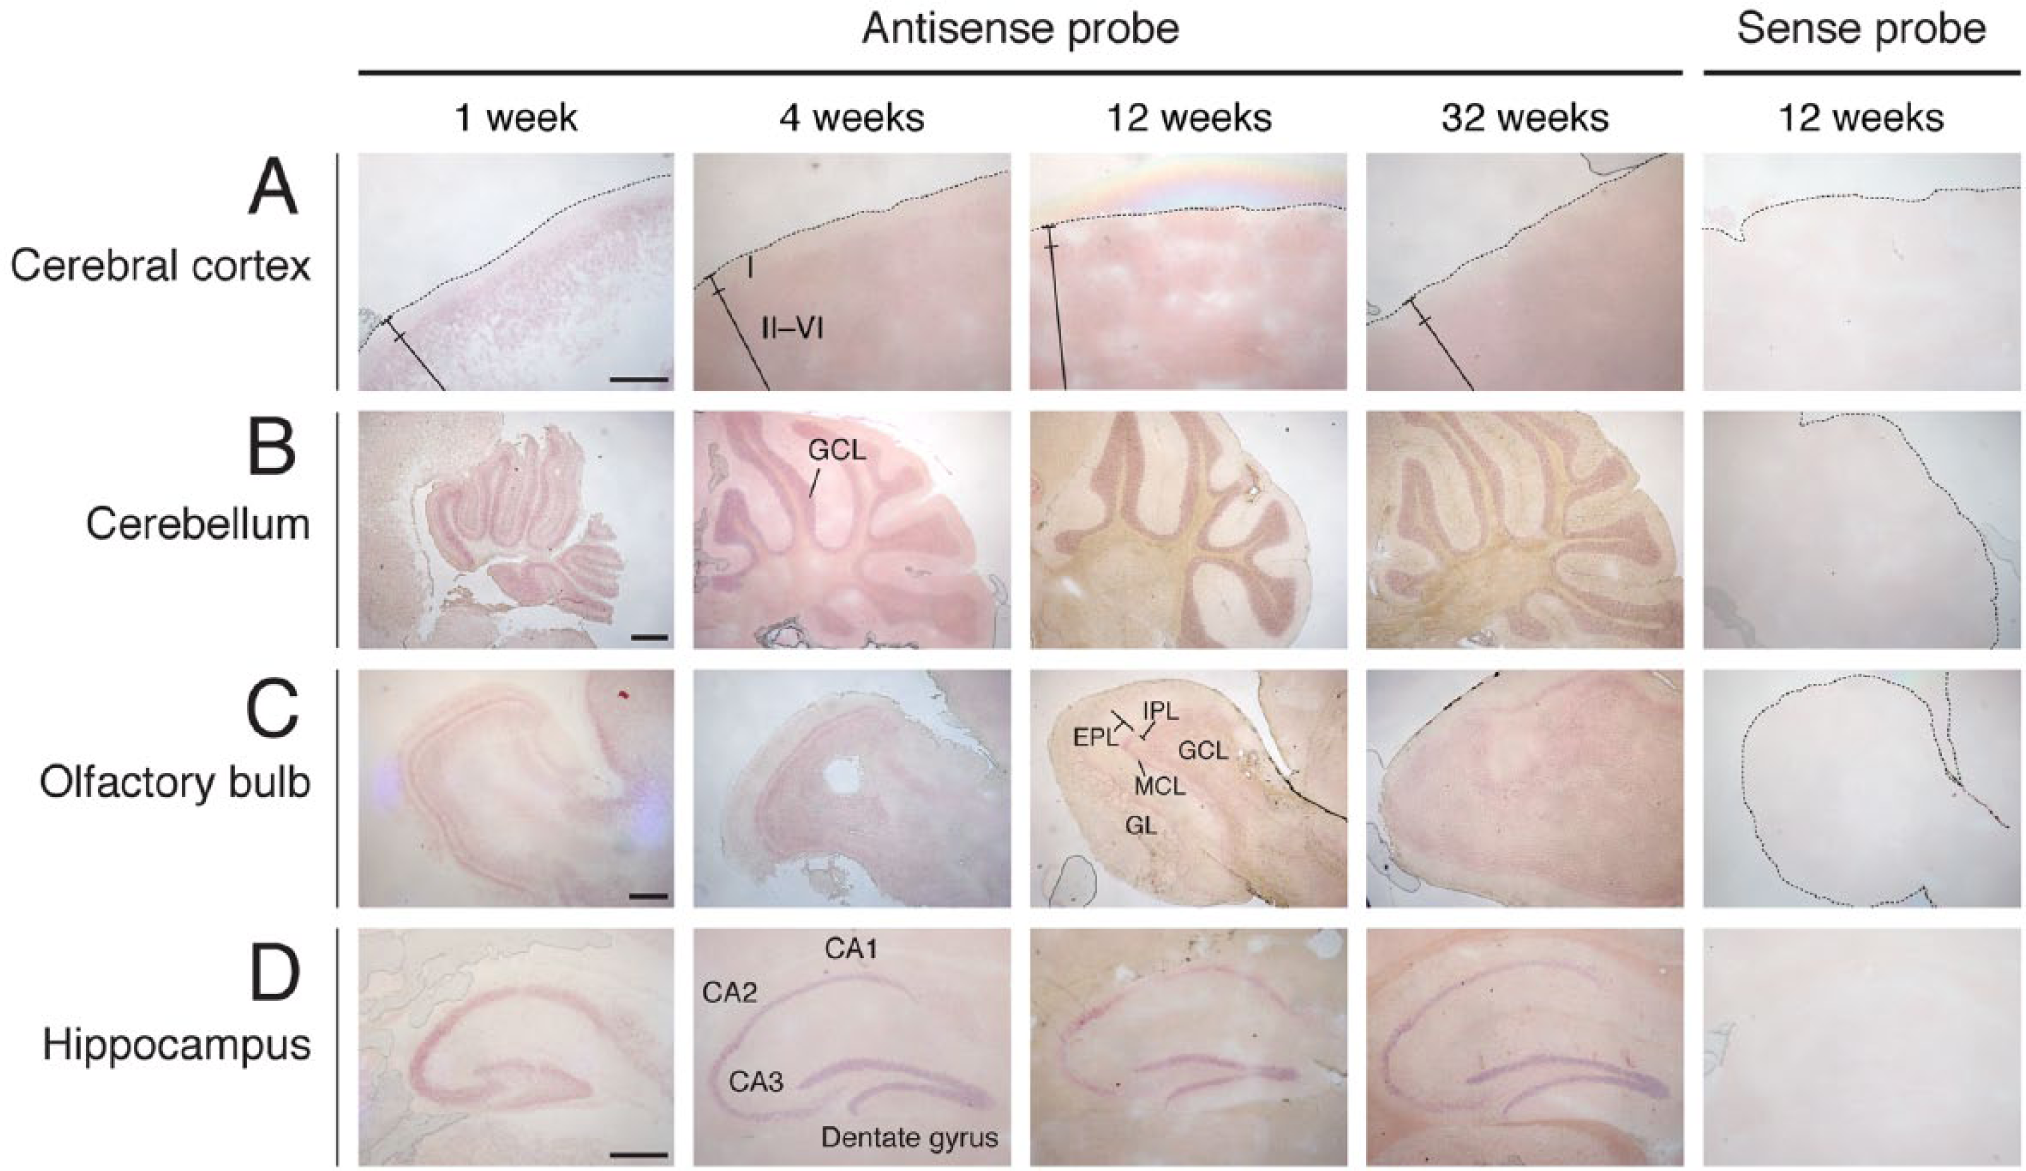
In situ hybridization of DGKδ mRNA in the developing mouse brain. DGKδ mRNA was hybridized and detected with antisense and sense probes of DGKδ mRNA in cerebral cortex (A), cerebellum (B), olfactory bulb (C), and hippocampus (D) of 1- to 32-week-old mice. Three independent experiments were performed at each stage for both DGKδ and -η. I, layer I of cerebral cortex; II, layer II of cerebral cortex; VI, layer VI of cerebral cortex; GCL, granule cell layer; EPL, external plexiform layer; GL, glomerular layer; IPL, internal plexiform layer; MCL, mitral cell layer. Scale, 400 µm.
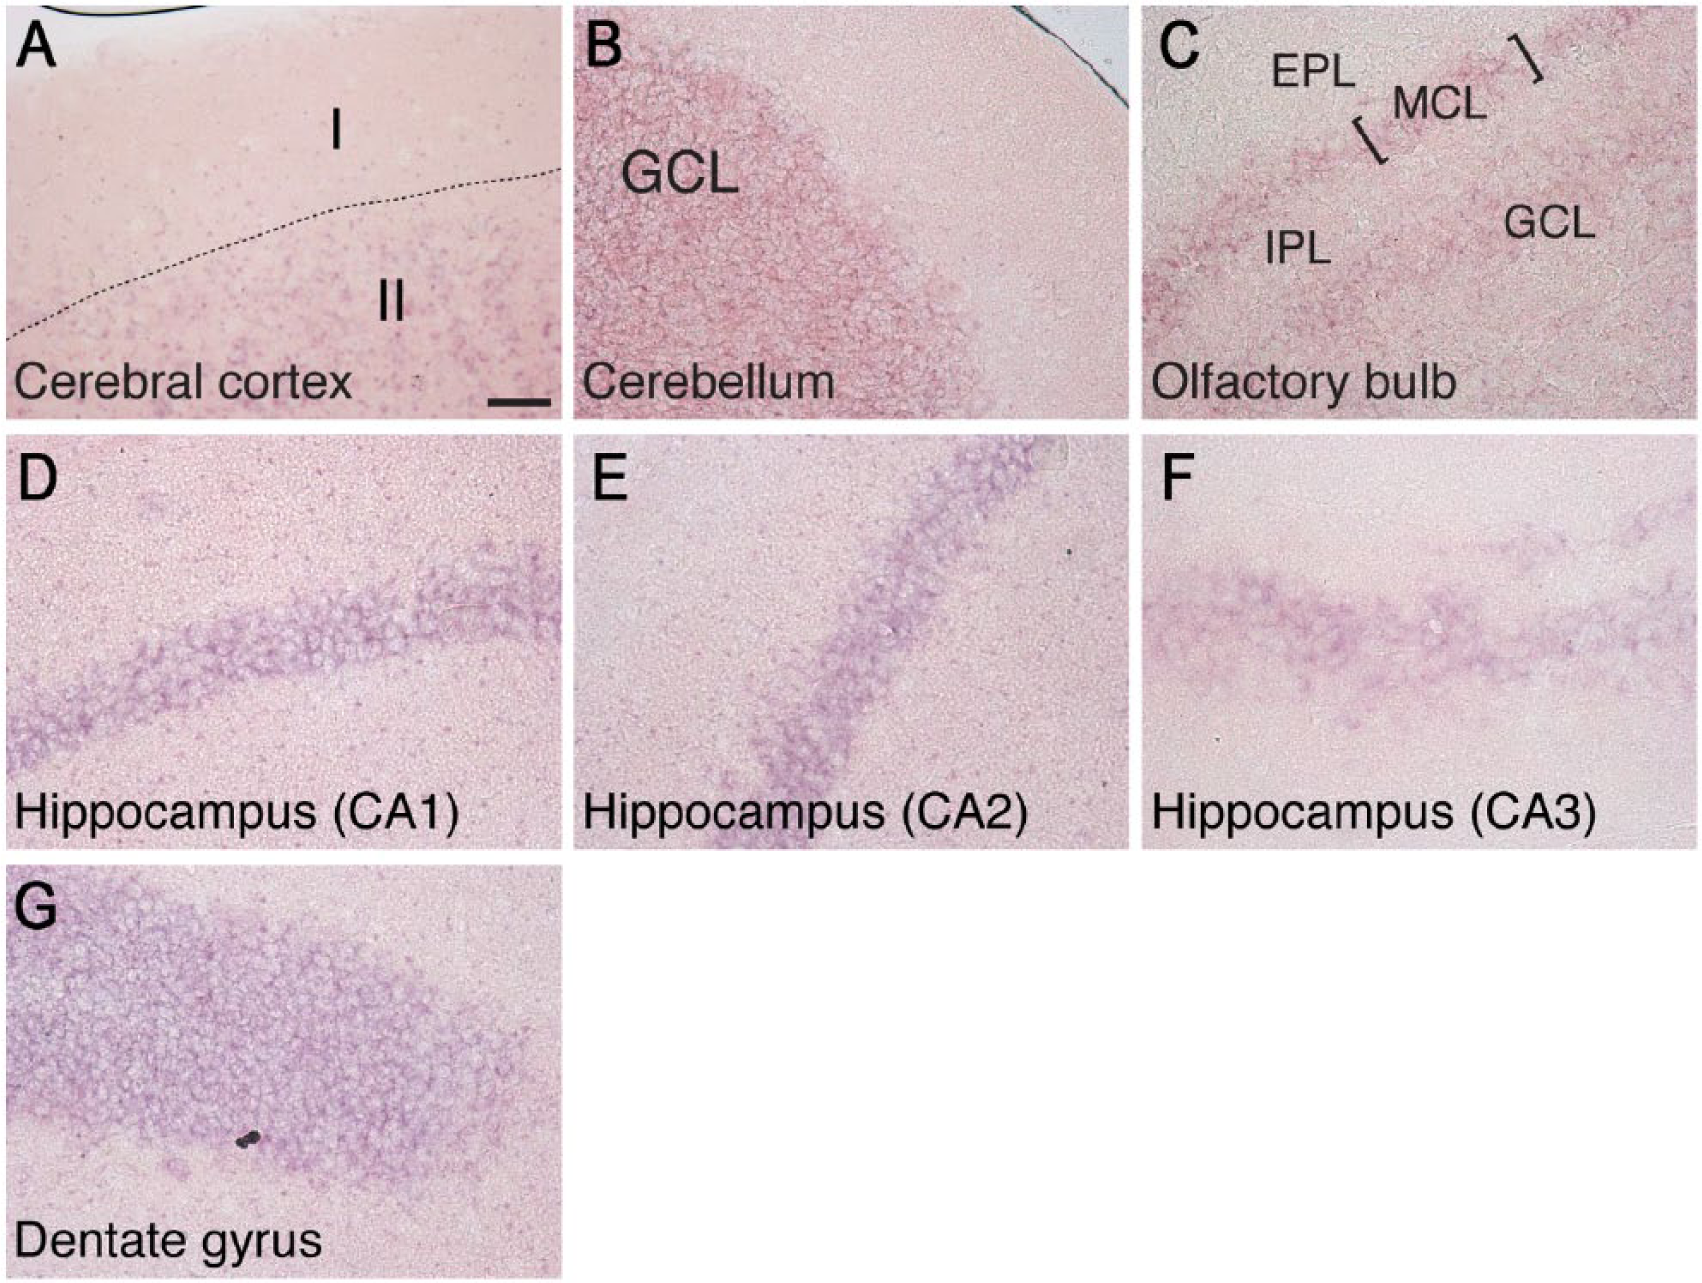
High magnification of the cerebral cortex, olfactory bulb, hippocampus, and cerebellum harvested from 4 -week-old mice and subjected to in situ hybridization with DGKδ mRNA. I, layer I of cerebral cortex; II, layer II of cerebral cortex; GCL, granule cell layer; EPL, external plexiform layer; IPL, internal plexiform layer; MCL, mitral cell layer. Scale, 40 µm.
Expression Pattern of DGKη in the Brain
We then examined the distribution of the other type II DGK isozyme, DGKη. We used anti-DGKη antibody, which detected 130-kDa and 135-kDa bands of DGKη1 and DGKη2, respectively, in the extracts from the 25-week-old mouse brain (Supplemental Fig. 2). These bands were not detected in the extracts from a brain of a recently created (Isozaki et al., our unpublished work) conventional DGKη-knockout mouse (Supplemental Fig. 2). Both DGKη1 and DGKη2 expression were highest in the brain tissue as compared with their expression in other tissues, similar to that which we observed with DGKδ (Fig. 5A). However, the expression pattern of DGKη in the brain was rather different from that of DGKδ. DGKη1 was detected at quite a high level in the cerebral cortex, cerebellum, and hippocampus taken from sections of 12-week-old mouse brain (Fig. 5B). On the other hand, its expression was weak in other brain regions, including the olfactory bulb and brain stem. Unlike DGKη1, DGKη2 was expressed very weakly in all of the sites of the sectioned mouse brain at 12 weeks.
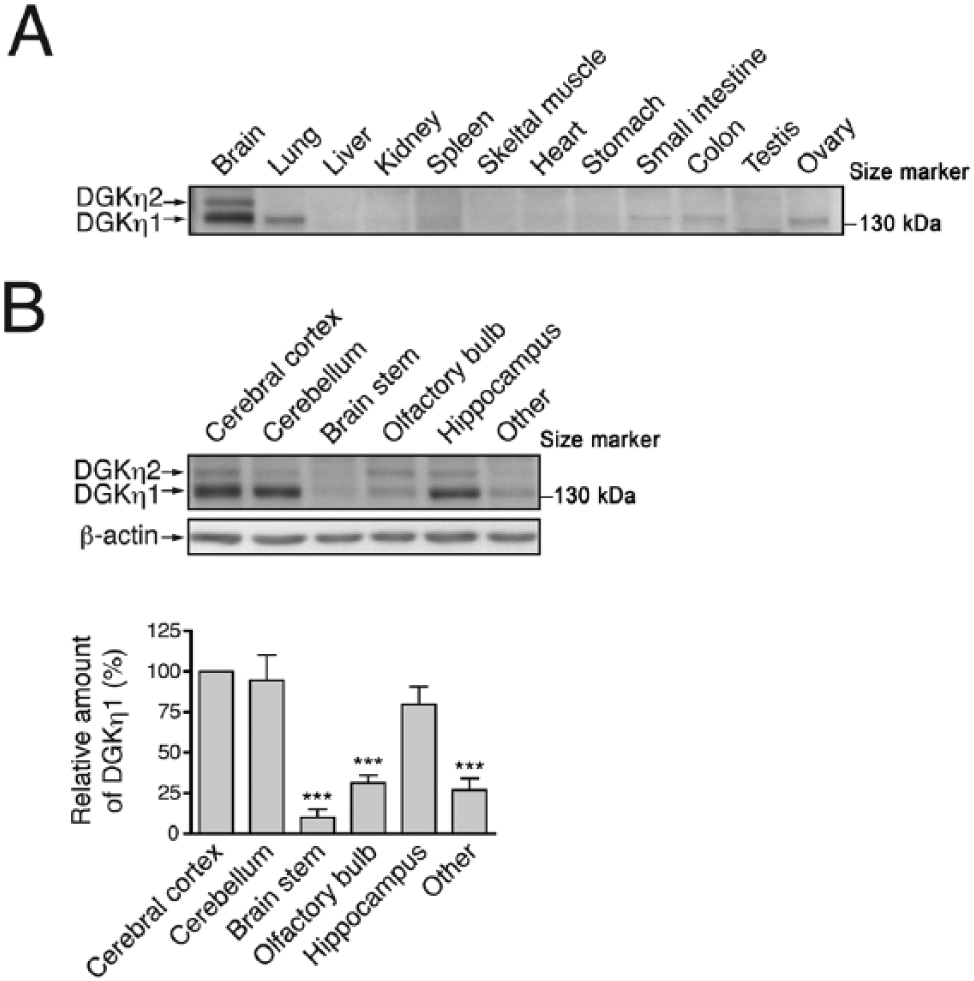
Expression pattern of DGKη protein in mouse tissues. (A) Thirty µg protein samples from the indicated tissues of a 25-week-old mouse were probed with an anti-DGKη antibody. (B) The expression of DGKη in the mouse brain. A brain of a 12-week-old mouse was sectioned into six parts, as indicated, and DGKη and β-actin were detected by western blotting using anti-DGKη and anti-β-actin antibodies, respectively. The graphs show the relative amount of DGKη1 in the sectioned parts of brain. DGKη immunoblots were scanned and DGKη1 levels were quantified using Image J software (NIH; Bethesda, MD) and normalized relative to β-actin levels. DGKη1 protein level in the cerebral cortex was set to 100%. Data shown are the mean ± SD of four independent experiments. Statistical significance was determined by ANOVA followed by Tukey’s post hoc test (***p<0.005 vs cerebral cortex).
Spatio-temporal Expression of DGKη Protein and mRNA in the Developing Brain
The temporal expression patterns of DGKη1 and DGKη2 were also inconsistent with each other in the brain. In the whole brain, DGKη2 expression was maximal at P5 but fell significantly by 1 week (Fig. 6A). On the other hand, DGKη1 was only slightly detected in 1-week-old tissue (Fig. 6A). DGKη1 was strongly detected in 4-week-old tissue, as the band of DGKη2 almost disappeared. In the cerebral cortex and hippocampus, the expression levels of DGKη2 were highest at 1 week and quickly decreased thereafter (Fig. 6B and 6E). In marked contrast, DGKη1 promptly increased from 1 week and reached maximum levels in cerebral cortex (Fig. 6B), cerebellum (Fig. 6C), and hippocampus (Fig. 6E) by 4 weeks. Although the expression level of DGKη1 increased from 1–4 weeks, in the cerebellum, DGKη2 showed no marked age-dependent difference in expression (Fig. 6C). In the olfactory bulb, we found no substantial age-dependent changes in the expression pattern of either DGKη1 or -η2 (Fig. 6D).
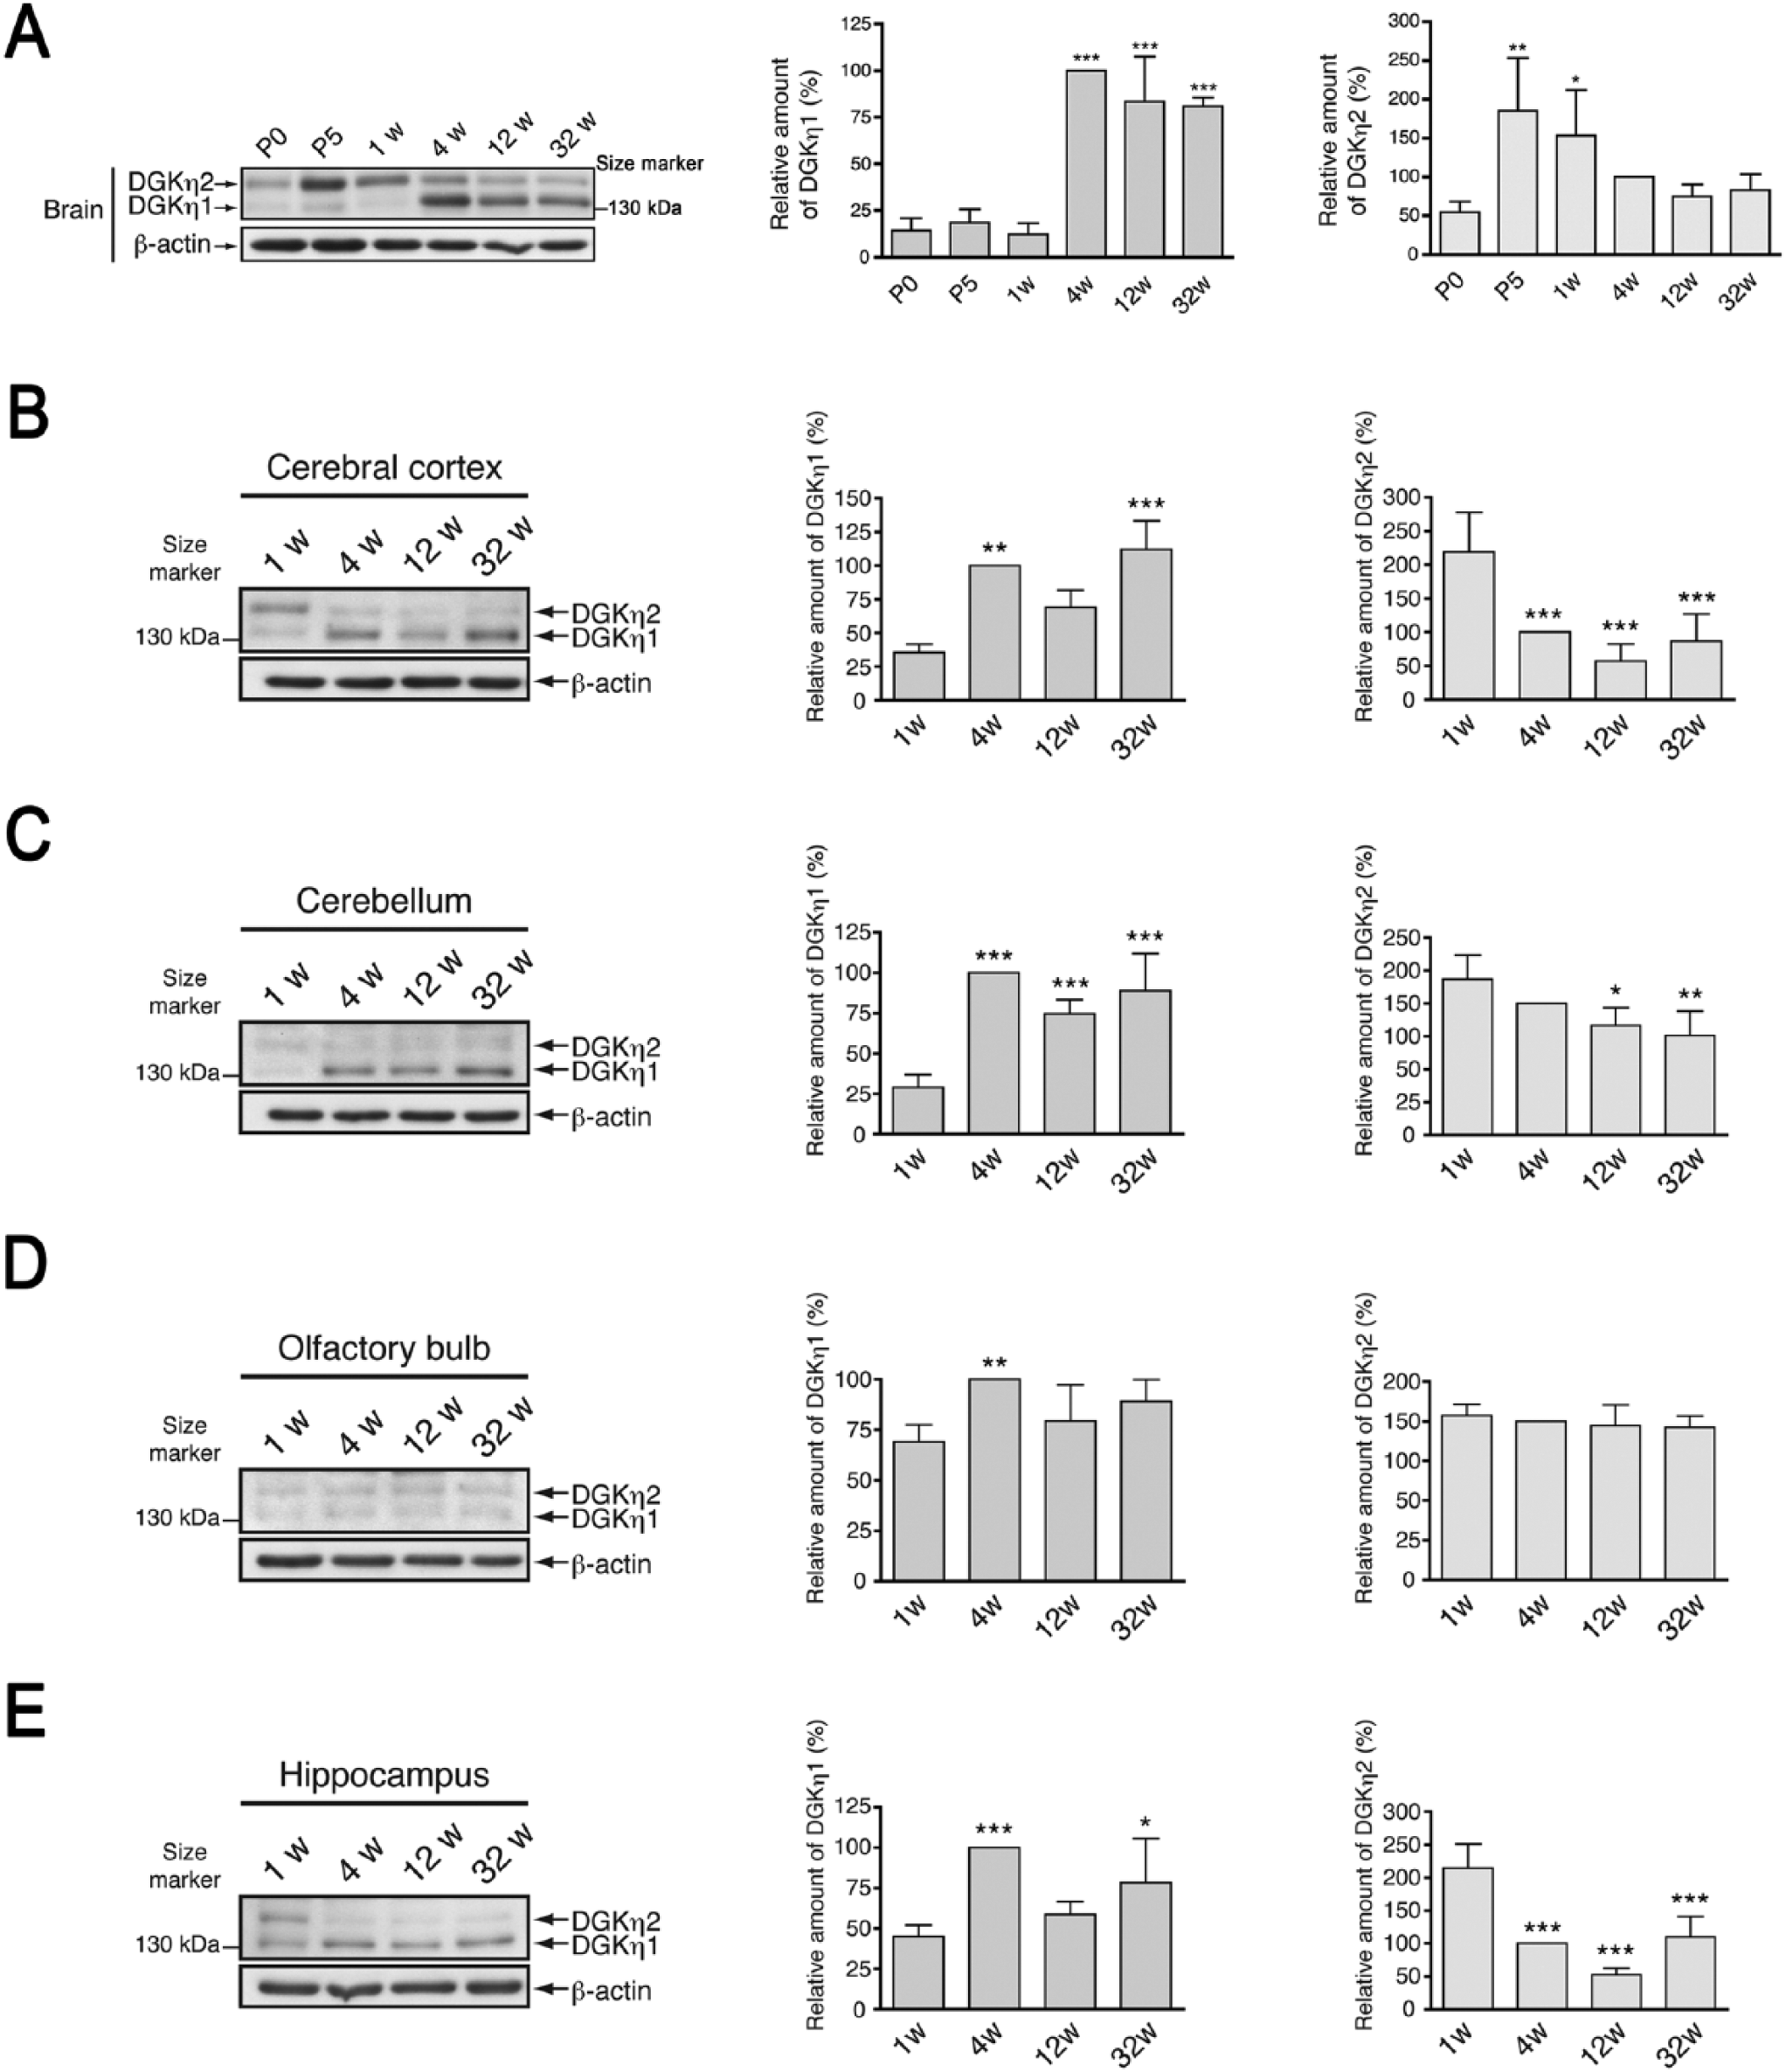
Age-dependent expression levels of DGKη in mouse brain. (A) Western blot analysis of the whole brain of P0 to 32-week-old mice. (B–E) Western blot analysis of cerebral cortex (B), cerebellum (C), olfactory bulb (D), and hippocampus (E) of 1- to 32-week-old mice using anti-DGKδ and anti-β-actin antibodies. The graphs show the relative amounts of DGKη1 and -η2, as indicated. DGKη immunoblots were scanned and DGKη levels were quantified using Image J software (NIH; Bethesda, MD) and normalized relative to β-actin levels. DGKη1 and -η2 protein levels in tissues from 4-week-old mice were set to 100%. Data shown are the mean ± SD of four independent experiments. Statistical significance was determined by ANOVA followed by Tukey’s post hoc test (*p<0.05, **p<0.01, ***p<0.005 vs P0 (A) or 1 week (B–E)). P, postnatal age; w, week(s).
To analyze the distribution of DGKη in more detail, we next detected DGKη mRNA in the brain using in situ hybridization. DGKη mRNA was clearly detected in the cerebral cortex, cerebellum, olfactory bulb, and hippocampus. In the cerebral cortex, DGKη mRNA was distributed broadly under layer II in tissues taken from 1 to 32 weeks of age (Figs. 7A and 8A) and its distribution pattern was almost the same as that of DGKδ mRNA (Figs. 3A and 4A). In the cerebellum, DGKη mRNA (probably DGKη1 mRNA) was strongly detected in the Purkinje cell layer, but not the granule cell layer, at 4, 12 and 32 weeks (Figs. 7B and 8B), where DGKδ mRNA was expressed (Fig. 3B and 4B). The expression of DGKη in the Purkinje cell layer from 1-week-old mice was markedly weaker than those at 4, 12, and 32 weeks. Although DGKδ mRNA was expressed in the mitral cell, glomerular and granule cell layers of the olfactory bulb (Figs. 3B, 3C, 4B, and 4C), DGKη mRNA was detected clearly in the mitral cell layer and quite weakly in the glomerular layer of 1-, 4-, 12-, and 32-week-old mice (Figs. 7C and 8C). In the hippocampus (including the dentate gyrus), the pattern of DGKη mRNA expression differed from that of DGKδ. Unlike DGKδ, detected in the CA1 region, the expression level of DGKη mRNA (probably DGKη1 mRNA) in the CA3 area was markedly weaker than that in the CA1 area in 4- to 32-week-old mouse brains (Figs. 7D and 8D–8F). Interestingly, the expression of DGKη mRNA (probably DGKη1 mRNA) was much higher in the dentate gyrus than in the CA region at 4, 12 and 32 weeks of age. In contrast, its expression (probably DGKη2 mRNA) in the dentate gyrus was almost equal to that in CA1–3 regions at 1 week (Fig. 7D). Although the brain sections were also hybridized with the sense probe of DGKη mRNA as a control, no distinct staining was detected (Fig. 7).
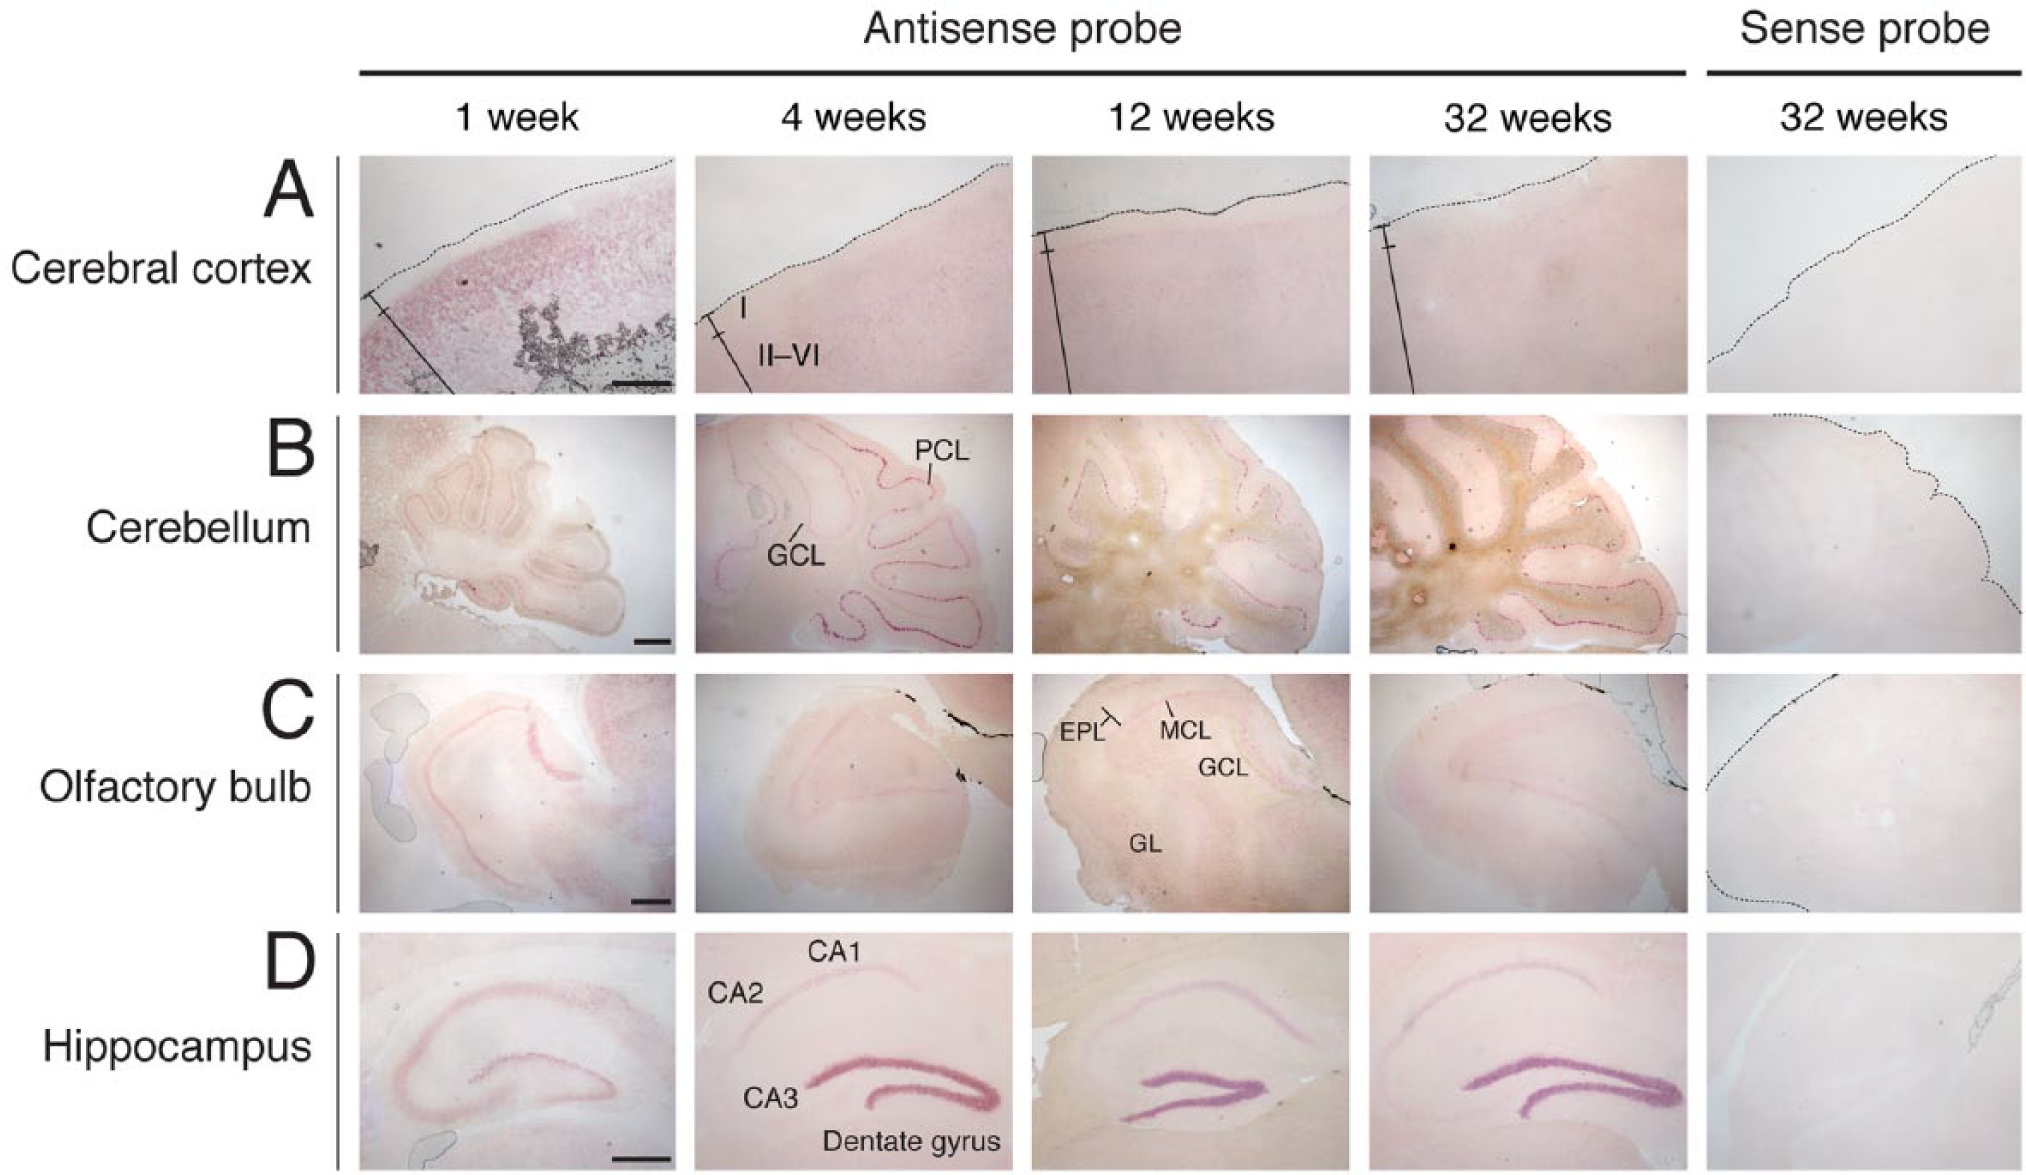
In situ hybridization of DGKη mRNA in developing mouse brain. DGKη mRNA was hybridized and detected with antisense and sense probes of DGKη mRNA in the cerebral cortex (A), cerebellum (B), olfactory bulb (C), and hippocampus (D) of 1- to 32-week-old mice. Three independent experiments were performed at each stage for both DGKδ and -η. I, layer I of cerebral cortex; II, layer II of cerebral cortex; VI, layer VI of cerebral cortex; GCL, granule cell layer; PCL, Purkinje cell layer; EPL, external plexiform layer; GL, glomerular layer; MCL, mitral cell layer. Scale, 400 µm.
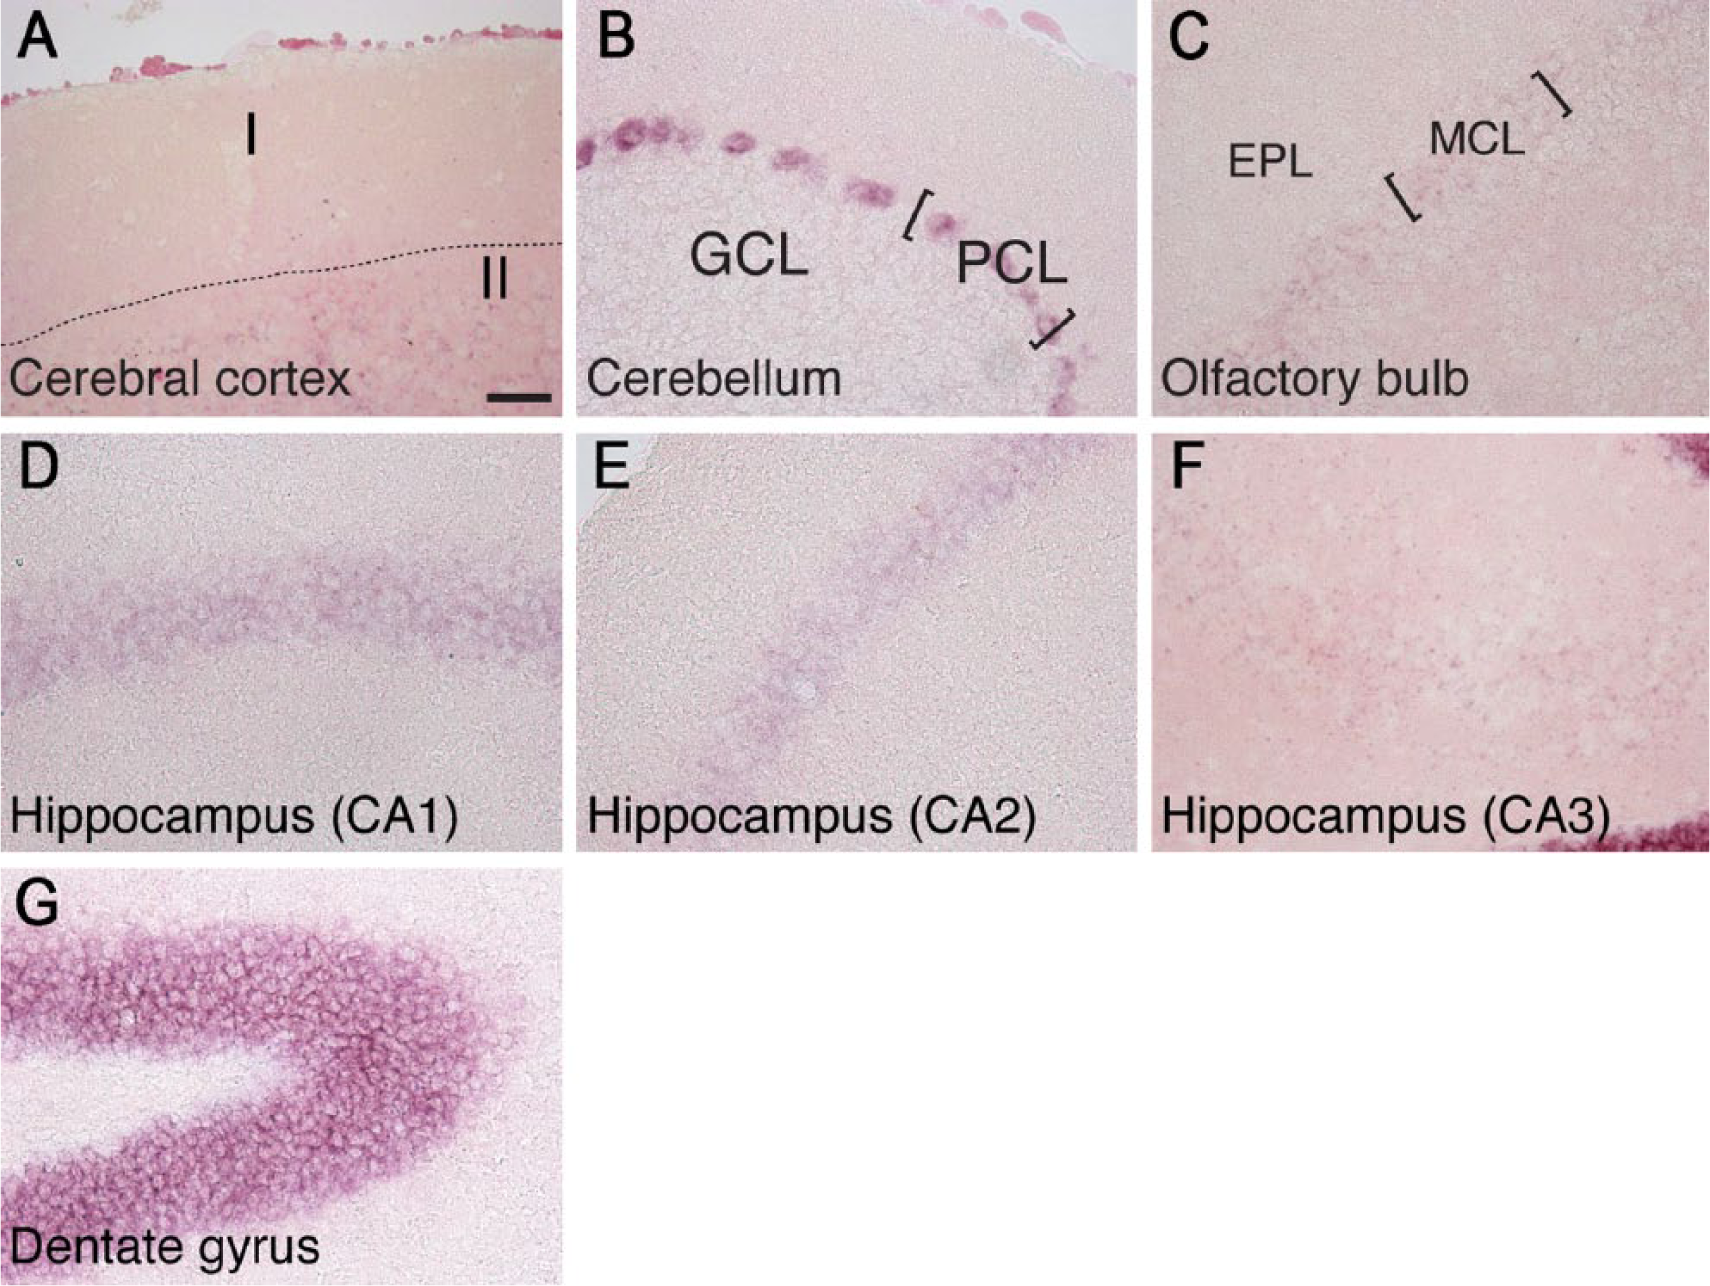
High magnification of the cerebral cortex, olfactory bulb, hippocampus, and cerebellum of 4 -week-old mice in situ hybridized with DGKη mRNA. I, layer I of cerebral cortex; II, layer II of cerebral cortex; GCL, granule cell layer; PCL, Purkinje cell layer; EPL, external plexiform layer; MCL, mitral cell layer. Scale, 40 µm.
Discussion
The spatiotemporal expression patterns of DGKδ and DGKη in the brain have not been previously elucidated. We have recently established brain-specific conditional KO mice of DGKδ (Usuki, T. et al. unpublished work) and conventional DGKη-KO mice (Isozaki, T. et al. unpublished work). To analyze brain-related phenotypes of these KO mice, it is important to understand the expression patterns of these DGK isozymes in the brain. Therefore, in the present study, we revealed the expression and localization patterns of DGKδ and -η in the brain for the first time. DGKδ and -η exhibited distinct expression and localization patterns in the mouse brain.
DGKδ was previously reported to be expressed in pyramidal neurons of the neocortex and hippocampus, and cerebellar granule layer of adult wild-type mouse (Leach et al. 2007). Our data are consistent with these results. We found that DGKδ was highly expressed in layers II–VI of the cerebral cortex; hippocampus; dentate gyrus; mitral cell, granule cell and glomerular layers of the olfactory bulb; and the granule cell layer of the cerebellum in 1- to 32-week-old mice (Figs.1–4). A substantial amount of DGKη was detected in the layer II–VI of the cerebral cortex, hippocampus and dentate gyrus, the mitral cell and glomerular layer of olfactory bulb, and the Purkinje cells in cerebellum in 1- to 32-week-old mice (Figs. 5–8). The pattern of brain expression for several other DGK isozymes has also been reported, as follows: DGKα, the corpus callosum and cerebellar medulla (Goto et al. 1992); DGKβ, the caudate-putamen, hippocampus and olfactory tubercle (Adachi et al. 2005; Goto and Kondo 1993); DGKγ, the hippocampus and the Purkinje and granule cells in the cerebellum (Adachi et al. 2005; Goto et al. 1994); DGKζ, the hippocampus, the dentate gyrus and the Purkinje and granule cells in the cerebellum (Goto and Kondo 1996); and DGKϵ, the whole gray matter region (Goto and Kondo 1999). These results indicate that the expression patterns of DGK isozymes in the brain vary substantially, suggesting that each DGK isozyme may play a distinct and specific role.
We investigated the age-dependent expression pattern of DGKδ and -η in mouse brain. Western blot analysis revealed that DGKδ was expressed just after birth and its expression levels dramatically increased between 1 and 4 weeks (Fig. 2), which is coincident with synapse formation of the brain. Intriguingly, DGKη2 expression reached maximal levels at P5 and then decreased by 4 weeks of age, whereas DGKη1 expression increased between 1 and 4 weeks (Fig. 6), resulting in the inversion of the expression levels of these isoforms. This expression reversal could be important for the neuronal development of the cerebral cortex, cerebellum, and hippocampus, where DGKη1 and -η2 are highly expressed (Figs. 5 and 6). Between DGKη1 and -η2, only DGKη2 has a sterile α motif domain, and this domain may be crucial during the early stages of neuronal development.
The precise roles of these genes are not understood. One female patient, who partially lacks the DGKδ gene, was shown to exhibit epileptic seizures concomitant with a psychiatric disorder (Leach et al. 2007). The hippocampus is often the focus of epileptic seizures because it is the most commonly damaged site in temporal lobe epilepsy (Sendrowski and Sobaniec 2013); temporal lobe epilepsy has been reported to be caused by a neuronal network defect in the hippocampus (Koyama et al. 2012). The granular layer of the cerebellum, where DGKδ mRNA is highly expressed (Fig. 4), is also an essential site for epileptic seizures, because dysgenesis in the granular layer of the cerebellum leads to a defect in the neuronal network wiring which, in turn, causes epileptic seizures (Hisatsune et al. 2006). Therefore, it is possible that a defect in DGKδ expression in the hippocampus and/or granular layer of the cerebellum may cause epileptic seizures. DGKϵ, which is expressed in the Purkinje cells of the cerebellum, pyramidal cells of the hippocampus and mitral cells of the olfactory bulb, is also associated with epilepsy (Musto and Bazan 2006; Rodriguez de Turco et al. 2001). Because the brain expression pattern of DGKϵ is different from that of DGKδ (Figs. 1, 3 and 4), it is likely that these isozymes are involved in epileptic seizure through different mechanisms.
We previously reported that the expression of DGKη1 and -η2 mRNAs in other tissues of human, for example kidney, was stronger than that in the brain (Murakami et al. 2003). However, we found that both DGKη1 and -η2 were detected more strongly in the brain than in any of the other tissues tested (Fig. 5A). This discrepancy probably derives from the different tissue sources, as human tissues used in our previous report.
It is noteworthy that DGKη mRNAs (probably DGKη1 mRNA) in the brains of 4- to 32-week-old mice were almost undetectable in the CA3 region of hippocampus, which is in marked contrast to its high expression in the CA1 and CA2 regions and the dentate gyrus (Figs. 7 and 8). Glucocorticoid receptor is broadly expressed in the brain but shows a distinct expression pattern in the hippocampus: it is markedly less abundant in the CA3 region than in the CA1 and CA2 regions, and the dentate gyrus (Bizon et al. 2001; Soontornniyomkij et al. 2010); this is the same for DGKη mRNA (Figs. 7 and 8). Interestingly, Klauck et al. (1996) and Murakami et al. (2003) reported that glucocorticoid treatment markedly increased the expression levels of DGKη1 and decreased those of η2 at the transcriptional level. Therefore, the expression of DGKη1 and -η2 mRNAs in the hippocampus could be, at least in part, regulated by glucocorticoid. Glucocorticoid is well known to relate to fear, anxiety, and psychopathology; i.e., dysregulation of the glucocorticoid receptor function is associated with human depression and anxiety disorder (Holsboer 2000; Korte 2001). In addition, a brain-specific glucocorticoid receptor-KO mouse showed less anxious behavior accompanied by profound alterations in the neuroendocrine system via the hypothalamus-pituitary-adrenal axis (Tronche et al. 1999; Wei et al. 2004). Therefore, it will be interesting to investigate the relationship between DGKη and depression/anxiety disorder.
Previous genome-wide association studies have suggested a correlation between bipolar disorder and DGKη (Baum et al. 2008; Weber et al. 2011). Moreover, the patients with bipolar disorder had increased DGKη mRNA levels (Moya et al. 2010). DGKη mRNA was expressed higher in the dentate gyrus than in the CA region of the hippocampus (Fig. 7D). Dysgeneration of the dentate gyrus is known to be a cause of bipolar disorder (Hagihara et al. 2013; Walton et al. 2012). Therefore, it is possible that a high expression of DGKη in the dentate gyrus is involved in the pathogenesis of bipolar disorder. DGKη was also highly expressed in the Purkinje cells of the cerebellum. Since Purkinje neurons integrate information from various regions of the brain and play a pivotal role in cerebellar function, such as motor learning, DGKη may be one of key regulators of cerebellar function. Moreover, Purkinje neurons are known to associate with schizophrenia and bipolar disorder (Maloku et al. 2010). Therefore, DGKη expressed in the Purkinje cells may also play a role in the pathogenesis of bipolar disorder.
Our data demonstrate that the spatial and temporal expression patterns of DGKs δ and η in the developing murine brain are distinct from each other and from other isozymes. These results support the hypothesis that DGKs δ and η could have distinct and specific roles in the brain during development. Studies are underway to examine the neuronal functions of these DGK isozymes and their correlations with the psychiatric disorders mentioned above using their knockout mice.
Footnotes
Declaration of Conflicting Interests
The authors declared no potential conflicts of interest with respect to the research, authorship, and/or publication of this article.
Funding
The authors disclosed receipt of the following financial support for the research, authorship, and/or publication of this article: This work was supported in part by grants from the