
Abstract
We have designed a stable rat chronic acid reflux esophagitis (RE) model. In gastrointestinal lesions, several lysosomal cathepsins are known to participate in epithelial permeability in cell-cell connections, such as tight junctions in ulcerative colitis. However, very few studies have focused on the distribution of cathepsins in the esophageal multilayer squamous epithelium. Therefore to clarify the role of cathepsins in RE, we investigated their immunohistological localization in the esophageal epithelium under normal conditions and after RE. Of the cathepsins examined (cathepsins B, C, D, F, H, L, S, and X), granular immunoreactivity for cathepsins B, C, D and L was observed in the control esophageal epithelia; although, their distribution differed depending on the enzyme examined. In the RE model, immunoreactivity of these cathepsins was increased in esophageal epithelial cells and activated macrophages. The immunoreactivity for cathepsins F, H, S and X was barely detectable in the control esophageal epithelium. However, in the RE model, we noticed a slight increase in the expression of cathepsins H and X in the epithelial cells. Furthermore, activated macrophages of the RE model possessed intense immunoreactivity for these cathepsins, which may have been related to esophageal inflammatory mechanisms.
Introduction
Cases of gastro-esophageal reflux disease (GERD) are increasing due to the Westernization of lifestyles, an aging society, and a decrease in the H. pylori infection rate in Japan (Fujimoto 2004; Fujiwara and Arakawa 2009). In addition to a reduction in the lower esophageal sphincter pressure at the esophago-gastric junction, an impairment of the esophageal mucosal defense system has been implicated in the pathophysiology of GERD (Orlando 1998; Castell et al. 2004). A dilated intercellular space (DIS) has been reported in patients with non-erosive reflux disease (NERD) and reflux esophagitis (RE) (Tobey et al. 2004; van Malenstein et al. 2008). It is postulated that the increased paracellular permeability of the esophageal epithelium is a crucial factor for the onset of GERD; however, the detailed mechanism of reflux esophagitis remains unknown.
Our previous studies have focused on the relationship between the impairment of tight junctions (TJs)—the most important factor in the epithelial defense system—and the onset of GERD. We used a rat chronic acid RE model to show how the intracellular distribution of the TJ protein “claudin-3” is altered in the non-erosive esophageal epithelium (Asaoka et al. 2005; Oguro et al. 2011; Mori et al. In Press). Decreased levels of claudin-3 have been associated with instability of the epithelial TJ complex (Oguro et al. 2011), which is related to dilatation of the intercellular space in the esophageal epithelium (Miwa et al. 2009). Recently, we conducted immunoelectron microscopy to reveal the subcellular distribution of claudin-3 in the rat esophageal epithelium. We showed that gold particles, indicative of claudin-3, were located on the surface of control esophageal epithelial cells, whereas such immunoreactivity was decreased in the RE group. Instead, some gold particles were observed on the membranes of intracellular vacuoles, indicating that an endocytic downregulation and lysosomal degradation of claudin-3 may be associated with decreased levels of claudin-3 in the RE group (Mori et al. In Press).
Lysosomes are multifunctional, membrane-bound acidic organelles. Lysosomes contain various acid hydrolases that degrade excess, old, and unneeded intra- and extracellular materials, including cytoplasmic organelles, into biologically active monomers (Uchiyama 1994; Uchiyama et al. 2008). Among the lysosomal proteinases that belong to the aspartic, cysteine, or serine proteinase families, the papain-like cysteine proteinase constitutes the largest, with 11 proteinases in humans (cathepsins B, C, F, H, K, L, O, S, V, W and X) and an additional 8 proteinases in mice (cathepsins 1, 2, 3, 6, J, M, Q and R) (Reiser et al. 2010). There are also a few lysosomal aspartic proteinases including cathepsin D (CD), BACE and napsin. Of these, CD is the major lysosomal aspartic proteinase and is expressed variably in all tissues (Whitaker and Rhodes 1983).
Thus far, many lines of knockout mice deficient in each of the various cathepsins have been generated. Among these, only CD-deficient mice die at an early stage (postnatal day (P) 26) due to massive neurodegeneration, intestinal necrosis and lymphopenia (Saftig et al. 1995; Koike et al. 2000). Mice deficient in tripeptidyl peptidase-I or cathepsin F also exhibit neurodegeneration, but these mice are able to live longer and are fertile (Passini et al. 2006; Tang et al. 2006); this suggests that these cysteine proteinases compensate for each other. Indeed, mice deficient in cathepsins B (CB) and L (CL) show severe neurodegeneration and die at around postnatal day 14 similar to CD-deficient mice (Felbor et al. 2002; Koike et al. 2005), indicating that CB and CL exert their important functions in the brain. On the other hand, through analyses of several lines of knockout mice, some specific functions of cysteine proteinases have been revealed (Reiser et al. 2010). For example, cathepsin K (CK) is predominantly expressed in osteoclasts and plays a key role in bone remodeling and extracellular matrix degradation (Ohsawa et al. 1993; Saftig et al. 1998). Cathepsin F (CF), CL, and cathepsin S (CS) are known to be involved in major histocompatibility complex class II antigen presentation and immune responses (Riese et al. 1996). Cathepsin C (CC) is required for the activation of several granule-associated serine proteinases (Pham and Ley 1999; Wolters et al. 2001; Adkison et al. 2002). CL-deficient mice exhibit skin abnormalities such as periodic hair loss and epidermal hyperplasia, acanthosis, and hyperkeratosis (Roth et al. 2000). CK, CL and CS are also known to show elastolytic activity (Liu et al. 2004; Aikawa et al. 2009).
In a previous study on the localization of lysosomal proteinases in normal rat epidermis, CB, CC, CH, CL, and CD were shown to be expressed heterogeneously in the epidermal layers. Granular immunodeposits of CB and CC are prominent in the basal and spinous layers, whereas those for CD and CL are expressed dominantly in the granular layer and those for CH are relatively weak but detected distinctly in the spinous layer (Sato et al. 1997). However, there is no information concerning the distribution of cathepsins in the normal esophagus.
In recent years, the pathophysiological roles of various cathepsins have been investigated as a mechanism of the increased paracellular permeability of intestinal epithelium (Dabek et al. 2009; Cattaruzza et al. 2011). During chronic inflammation, macrophages destroy the extracellular matrix by secreting cysteine proteinases such as CB, CL, and CS (Krueger et al. 2005), which may aggravate colitis by promoting paracellular permeability and an influx of inflammatory cells (Cattaruzza et al. 2011). However, there are few reports of the relationship between cathepsins and esophageal epithelial permeability. There are many reports concerning cathepsins in esophageal adenocarcinoma (Andl et al. 2010; Habibollahi et al. 2012), yet the identities and cellular origins of cathepsins that are activated during inflammation after RE are not fully established, and their causative roles in diseases remain uncertain.
In the present study, we investigated the precise immunohistological localization of lysosomal cysteine and aspartic proteinases in the esophageal mucosa obtained from normal rats and rats suffering from chronic acid RE.
Materials & Methods
The procedures involving animal care and sample preparation were approved by the Animal Experimental Committee of the Juntendo University Graduate School of Medicine, and were performed in accordance with the NIH guidelines and the regulations and guidelines for the care and use of laboratory animals of the Juntendo University Graduate School of Medicine.
Induction of Chronic Acid Reflux Esophagitis in Rats
Specific-pathogen-free (SPF) male Wistar rats (7 weeks old) were purchased from Clea Japan (Tokyo, Japan) and acclimatized for 1 week before experimentation. The animals were fed standard laboratory chow and water ad libitum, and were housed in an environmentally controlled room (24 ± 2C; 12 hr light/dark cycles).
A chronic acid RE model was induced in rats as previously described (Omura et al. 1999; Asaoka et al. 2005; Oguro et al. 2011; Mori et al. In Press). Briefly, the animals (8 weeks old) (n=12 each for sham group and RE group) were fasted for 24 hr prior to surgery. Inhalation anesthesia was performed with isoflurane. After laparotomy, a duodenal stenosis was induced by wrapping the duodenum near the pylorus with a 2.5 mm-wide piece of 18-Fr Nelaton catheter (diameter, 4.0 mm; Terumo, Tokyo, Japan). To prevent it from being dislodged, the catheter was immobilized by suturing it to the serosa of the gastric antrum with 4-0 silk thread. The transitional region between the forestomach and the glandular portion (the limiting ridge) was ligated with 2-0 silk thread. In our original model, a duodenal stenosis was created by wrapping the duodenum near the pylorus with a piece of 18-Fr Nelaton catheter. The width of the catheter for the duodenum was 3.0 mm in our original model; however, we had difficulty inducing RE with a high reproducibility. We therefore modified the width from 3.0 mm to 2.5 mm in the present study using an 18-Fr Nelaton catheter.
After the operation, the animals were fasted for 48 hr. The sham group consisted of sham-operated rats that underwent the same abdominal surgery with the exception that the limiting ridge was not ligated and the catheter was not placed around the duodenum. Although rats were sacrificed on day 14 after the operation (Asaoka et al. 2005) in the original model, all animals in the present study that were to be used for morphological and biochemical analyses were sacrificed on day 28 after surgery. This change in the procedure was introduced because we noticed a higher frequency of RE and a wider mean area of the ulcer in longer surviving animals.
Measuring the Total Ulcer Area of the Esophagus
On day 28 after surgery, rats in both groups (n=3 for both groups) were anesthetized deeply with ether and their esophagi were removed. After taking photographs of the esophageal lesions, the total ulcer area in the RE model was measured (in square millimeters).
Sampling for Morphological Analyses
On post-operative day 28, rats in both groups (n=3 for both groups) were anesthetized deeply with pentobarbital (25 mg/kg i.p.) and fixed by cardiac perfusion with 4% paraformaldehyde buffered with 0.1 M phosphate buffer (pH 7.2) (PB) containing 4% sucrose for light microscopy and immunohistochemistry.
For light microscopy, esophagi were removed quickly from the rats and further immersed in the same fixative for 2 hr. Samples processed for paraffin embedding were cut into 3-µm sagittal sections and placed on silane-coated glass slides. Samples for cryosections were embedded in OCT compound (Miles, Kankakee, IL) after cryoprotection with 15% and 30% sucrose solutions, and cut into 10-µm sagittal sections with a cryostat (CM3050, Leica Microsystems; Wetzler, Germany). Sections were placed on silane-coated glass slides and stored at -80C until use. Paraffin sections were used for hematoxylin and eosin staining and bright-field immunohistochemistry for CD68. Cryosections were used for triple immunofluorescence staining as described below.
Immunohistochemistry for Light Microscopy
For bright-field immunohistochemistry, deparaffinized sections were immunostained according to a previously described method (Koike et al. 2000; Koike et al. 2013a). Briefly, the samples were treated with 0.3% H2O2 in methanol for 30 min and incubated with 2% normal goat serum for 20 min at room temperature. Sections were then incubated overnight at 4C with a mouse anti-rat CD68 antibody (MCA341R; AbD Serotec; Oxford, United Kingdom) (1:100). Further incubation was performed with goat anti-mouse antibody conjugated to polymerized horseradish peroxidase (Impress Kit, Vector Laboratories; Burlingame, CA). After each step, the sections were rinsed thoroughly in 0.5 M saline buffered with 0.1 M PB (pH 7.2) containing 0.1% Tween-20. Staining for peroxidase was performed using 0.0125% of 3, 3’-diaminobenzidine tetrahydrochloride (DAB, Wako Pure Chemical Industries; Osaka, Japan) and 0.002% H2O2 in 0.05 M Tris-HCl buffer (pH 7.6) for 10 min. Digital images of the sections were captured by a standard light microscope (BX50, Olympus; Tokyo, Japan) equipped with a DP71 or DP72 digital imaging system (Olympus).
Multiple immunostaining confocal immunofluorescence microscopy was performed as previously described (Koike et al. 2008; Koike et al. 2013a; Koike et al. 2013b). For the triple staining of CB, CD, CH or CL with lysosomal-associated membrane protein 1 (lamp1) and CD68, the sections were incubated with rabbit anti CB (06-480; Millipore, Temecula, CA, USA) (1:100), CD (Koike et al. 2005; Koike et al. 2013a) (1:100), CH (Kominami et al. 1985) (1:100), or CL (Bando et al. 1986), along with goat anti-lamp1 (AF4800, R&D Systems, Minneapolis, MN) (1:100), and mouse anti-CD68 (1:100). Subsequently, the sections were incubated with a mixture of donkey anti-rabbit, -goat, and -mouse IgG coupled with Cy2, Cy3 and Cy5 (Jackson Laboratory, Bar Harbor, ME) (1:300), respectively, for 1 hr at room temperature. For the triple staining of CC, CF, CS or CX with lamp1 and CD68, the sections were incubated with goat anti-CC, -CF, -CX (AF1033 AF2544 or AF1034, respectively, R&D Systems) (1:100) or goat anti-CS (sc-6505; Santa Cruz Biotechnology, Dallas, TX) (1:100) along with rabbit anti-lamp1 (ab24170, Abcam; Cambridge, MA) (1:100) and mouse anti-CD68 (1:100). Subsequently, the sections were incubated with a mixture of donkey anti-goat, -rabbit, and -mouse IgG, coupled with Cy2, Cy3 and Cy5 (Jackson Laboratory) (1:300), respectively, for 1 hr at room temperature. The stained sections were coverslipped with VectaSheild mounting medium with 4’-6’-diamindino-2-phenylindole (DAPI) (Vector Laboratories) and observed under a confocal laser scanning microscope (FV1000; Olympus, Tokyo, Japan).
For control experiments, cryosections were incubated with nonimmunized rabbit or goat serum (1:1000), followed by the respective second antibodies. Some sections were incubated directly with the second antibodies without pretreatment with the primary antibodies as a control.
Quantitative Analyses of Immunohistological Samples
ImageJ (NIH; Bethesda, MD) was used for the following quantitative analyses.
For a comparison of the fluorescence intensity of cathepsins in esophageal epithelial cells, 10 cells for each cathepsin in the esophageal epithelial basal, spinous, and granular layers of each group were selected from the TIFF files of the representative images presented in the current study. Measurements of mean fluorescence intensity in the whole cell of interest were used to estimate the relative intensity of cathepsins in each cell. For a comparison of the fluorescence intensity of cathepsins in macrophages in the esophageal normal (n=16, 12, 6, 11, 9, 9, 6, and 9 for CB, CC, CD, CH, CL, CX, CF and CS, respectively) and non-erosive (n=31, 31, 30, 30, 31, 32, 29, and 30 for CB, CC, CD, CH, CL, CX, CF and CS, respectively) lamina propria mucosae of sham and RE groups, and the fundus of the ulcer (n=50, 50, 48, 50, 50, 50, 48, and 28 for CB, CC, CD, CH, CL, CX, CF and CS, respectively) of the RE group, the mean fluorescence intensities of cathepsins in the CD68-positive regions of each macrophage were measured.
To compare the extent of macrophage infiltration, the number of the CD68-positive macrophages per unit area in the sham and RE groups (n=3) was examined. The number of CD68-positive macrophages was counted manually in the esophageal normal and non-erosive lamina propria mucosae of the sham and RE groups, respectively, and in three square areas (0.01 square of millimeter) in the fundus of the ulcer of the RE group. The areas of the regions of interest were outlined and measured using ImageJ.
Western Blot Analysis
Western blot analysis was performed as previously described (Oguro et al. 2011; Koike et al. 2013b). The distal portion (gastric side) of the esophagus was removed from all animals anesthetized deeply with ether (n=6 for both groups) on day 28 after surgery, and the esophageal mucosa was stripped away manually with tweezers and stored in liquid nitrogen until use. Each esophageal mucosa was homogenized in ice-cold lysis buffer containing 50 mmol/l Tris–HCl pH 8.0, 150 mmol/l NaCl, 1 mmol/l ethylene diamine tetraacetic acid (EDTA), 1% Triton X-100, and a Complete Mini (EDTA-free, protein inhibitor cocktail tablets, Roche Mannheim, Germany). The homogenates were centrifuged at 12,000 ×g for 5 min at 4C, and the supernatant was used for the analyses. Protein concentrations were measured at 562 nm using BCA Protein Assay Reagent (Thermo Scientific; Wilmington, DE), with bovine serum albumin as the standard. Equal amounts of total protein (20 µg/lane) were subjected to 12.5% sodium dodecylsulfate (SDS)-polyacrylamide gel electrophoresis (PAGE), and the gels were transferred electrophoretically onto polyvinylidene difluoride (PVDF) membranes (removal rating 0.45 µm; GE Healthcare; Buckinghamshire, UK). The membrane was incubated for 1 hr with a buffer containing T-TBS (20 mM Tris–HCl pH 7.5, 0.15 M NaCl, 0.05% Tween-20) and 5% nonfat dried milk, and then incubated with rabbit anti-CB, CC, CD or CL (Kominami et al. 1985; Bando et al. 1986; Kominami et al. 1992; Muno et al. 1993; Koike et al. 2013a) antibodies (1:600), goat anti-CS (sc-6505; Santa Cruz Biotechnology), CF, CH or CX (AF2544, AF1013 or AF1034, respectively; R&D Systems) antibodies (1:600), and mouse anti-glyceraldehyde 3-phosphate dehydrogenase (GAPDH) antibody (G8795; Sigma-Aldrich, St Louis, MO) (1:600) overnight at 4C. The membranes were washed with T-TBS, and then incubated with horseradish peroxidase-conjugated goat anti-rabbit or donkey anti-goat IgG (1:2000) (Jackson Immunoresearch; West Grove, PA) for 1 hr. After extensive washing with T-TBS, the membrane was probed for antibody reactivity using SuperSignal West Dura Extended Duration Substrate (Thermo Scientific). The intensity of each band was scanned using a LAS-4000 scanner (Fuji Photo Film, Tokyo, Japan) and quantified using Multi Gauge V3.0 software (Fuji Photo Film). Incubation with non-immune rabbit or goat serum (1:1000) was performed as a control.
Statistical Analysis
For analysis of body weight in the sham and RE models, a student’s t-test was used. Data obtained from the number of macrophages per unit area of esophageal mucosae, and immunofluorescence intensity of cathepsins in esophageal epithelial cells and macrophages were analyzed using one-way ANOVA to determine statistical significance using Kaleidagraph software (version 3.6 for Mac; Synergy Software; Reading, PA). All paired multiple comparison procedures were performed using a Tukey’s post-hoc test. Data are expressed as the mean ± standard deviation (SD). We assumed statistically significant differences at p<0.05.
Results
Macroscopic and Histological Findings of a Rat Chronic Acid Reflux Esophagitis (RE) Model
In the present RE model, the survival rate at 28 days post-operatively was 70.0% (7/10). The ratio of occurrence of reflux esophagitis was 100% (7/7). Because the occurrence rate of reflux esophagitis was higher than that of our original model (14 days post-operatively), this model was regarded as suitable to investigate the pathophysiology of RE.
The body weight of the animals in the RE group was significantly lower than that of the controls at 28 days post-operatively (RE, 243.4 ± 26.2 g vs Sham, 360.8 ± 11.4 g; p<0.01). Macroscopic findings revealed that, in the RE model, multiple ulcers of various sizes were detected in the middle and lower portions of the esophagus, whereas, in the control model, there were no ulcers (Fig. 1A, 1B). On day 28 post-operatively, the mean numbers of erosions were 3.0 ± 0.8 and the mean total ulcerated area was 27.9 ± 15.4 mm2. Histologically, a thin epithelial layer with squamous cells was observed in the control model, whereas a thicker epithelium, elongation of lamina papilla and basal cell hyperplasia were prominent in the RE model (Fig. 1C–1E).
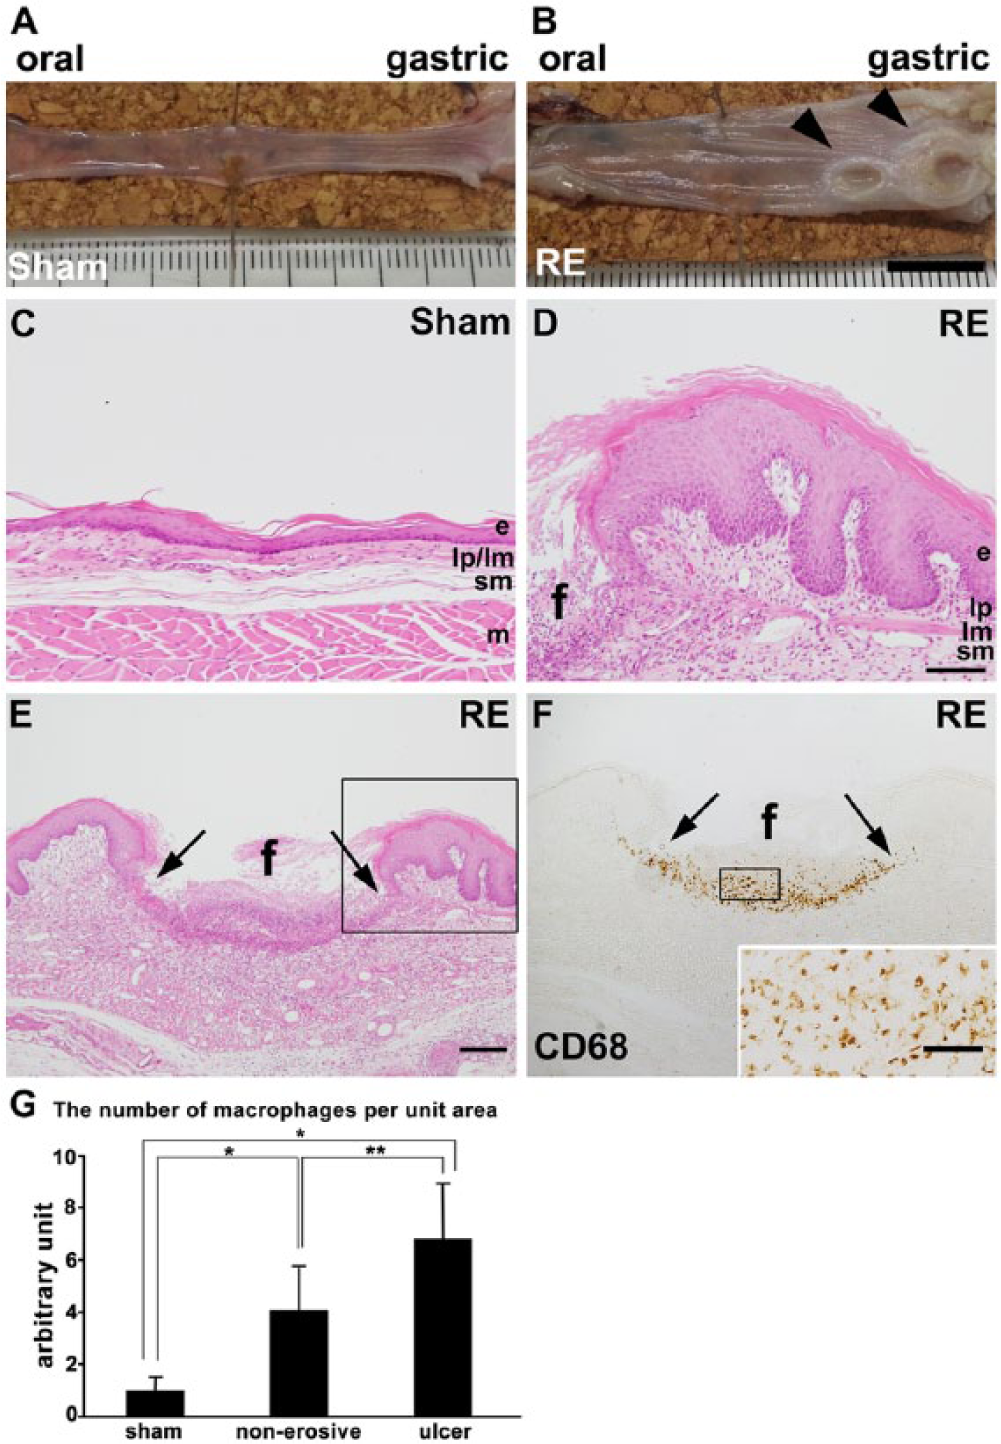
Macroscopic and histological findings of the esophagus in sham and RE models at 28 days post-operatively. (A, B) Esophagus specimens from sham (control) (A) and RE (B) rats at 28 days post-operatively. In the RE model, many ulcers and/or erosions of various sizes are noted in the mucosa (arrowheads), whereas no erosions are noted in the control model. (C–E) Hematoxylin-eosin staining of the esophageal mucosa of sham (C) and RE (D, E) groups on day 28. The boxed area in E is enlarged and shown in D. In the RE group, severe ulceration with loss of epithelium (e), lamina propria mucosae (lp) and lamina musculus mucosae (lm) (between two arrows in E) is observed. Furthermore, a thicker epithelium, elongation of the lamina papilla and basal cell hyperplasia are prominent in the RE model as compared with that in the sham model. (F) Immunohistochemistry of CD68 around an ulcer in a sample from the RE group. The boxed area is enlarged and shown in the inset. In the fundus of the ulcer (f) there is markedly increased infiltration of CD68-positive macrophages. sm: submucosa, m: muscular layer. Scale bars: 1 cm (A, B), 100 µm (C, D), 200 µm (E, F) and 50 µm (inset in F). (G) Comparison of the number of macrophages per unit area of esophageal normal and non-erosive lamina propria mucosae of sham and RE groups (n=3) and measurement of the fundus of the ulcer of the RE group. Vertical bars represent the mean ± SD (*p<0.001, **p<0.01, one-way ANOVA followed by Tukey’s post hoc test).
Localization of Cathepsins in the Control Esophageal Epithelia
By immunohistological analysis using confocal laser microscopy, we examined the localization of lysosomal cysteine (CB, CC, CF, CH, CL, CS, and CX) and aspartic (CD) proteinases in the control esophageal epithelia. We confirmed the lysosomal localization of these proteinases by double staining with lamp1. The distribution and intensity of the immunoreactivity of the cathepsins in the rat esophageal mucosae of the sham and RE groups is summarized in Table 1.
Distribution and Intensity a of the Immunoreactivity of Cathepsins in Rat Esophageal Mucosae of the Sham and Reflux Esophagitis Groups.
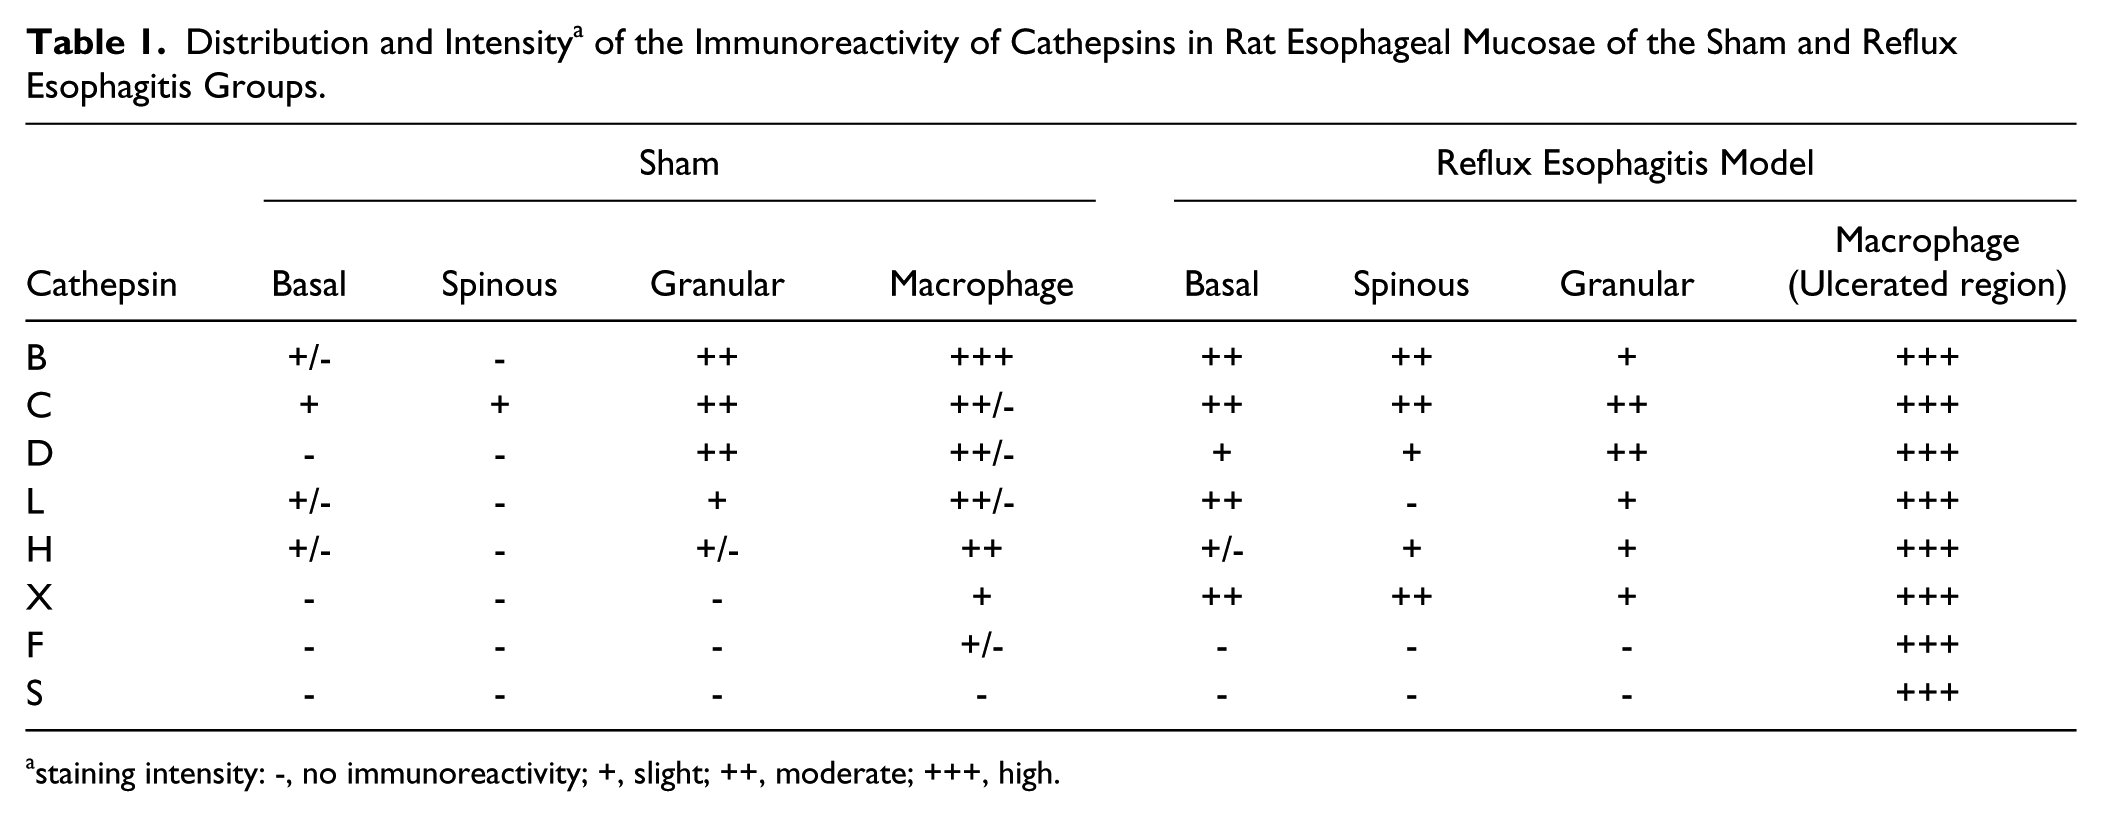
staining intensity: -, no immunoreactivity; +, slight; ++, moderate; +++, high.
Among the cathepsins examined, granular immunoreactivity for CB, CC, CD and CL was observed in the control esophageal epithelia, although their intensity and distribution differed depending on the enzyme examined. Unlike their distribution in the epidermis, CB and CC were expressed dominantly in the granular layer (insets in Fig. 2C, 3C), with very weak granular immunodeposits for CB were observed in the basal layer (Fig. 2A–2C), moderate granular immunoreactivity for CC in the basal layer, and weak CC immunoreactivity in the spinous layer (Fig. 3A–3C). The distribution patterns of CD and CL in the esophageal epithelia were similar to those in the epidermis: Granular immunodeposits for CD and CL were expressed dominantly in the granular layer (insets in Fig. 4C, 6C), although the granular immunodeposits were very weak for CL (Fig. 6A-C). Granular immunodeposits for CH were relatively weak but were previously reported to be detected distinctly in the spinous layer of the epidermis (Sato et al. 1997). However, we were unable to detect granular immunopositive signals for CH in the spinous layer of the control esophageal epithelia (Fig. 5A–5C). An enlargement of Figure 5C (inset) shows a faint but distinct immunoreactivity for CH in both basal and granular layers. Granular immunoreactivity for the other three cathepsins (CF, CS, and CX) was absent in the control esophageal epithelia (Fig. 7A–7C; 8A–C; and 8E–8H). An enlargement of Figure 8K (inset) shows moderate immunoreactivity for CS in the granular layer but an absence of co-localization with lamp1 in this region. Therefore, we assume this CS positive staining was non-specific background. Quantitative analyses of the fluorescence intensity for each of these proteinases confirmed the immunostaining results (Fig. 9).
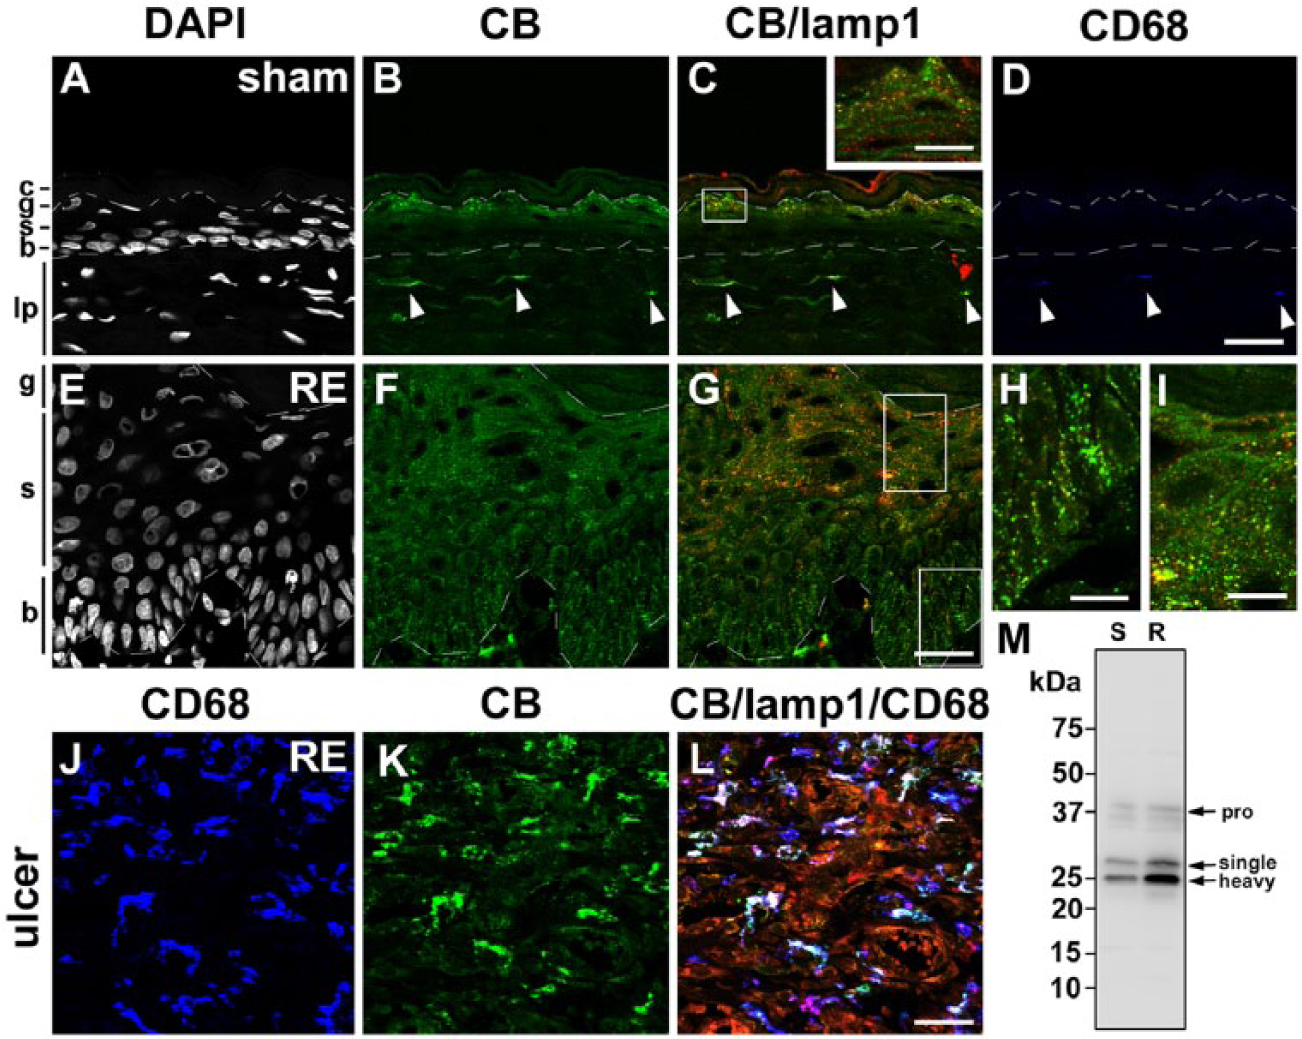
Distribution of cathepsin B (CB) in the esophageal mucosa of sham (A–D) and Reflux Esophagitis (RE) (E–G) groups and the fundus ulcer of the RE group (H–J) at 28 days post-operatively. Triple staining for CB (green), lamp1 (red) and CD68 (blue) in addition to counterstaining with DAPI (white). Boxed areas in C and G are enlarged and shown as insets in C, and H and I, respectively. In the sham group, granular immunoreactivity for CB is localized intensely in the granular layer (g), only weakly localized in the basal layer (b), and absent in the spinous layer (s) (A–C). In the RE group, intense granular staining for CB is observed in the basal and spinous layers in addition to the granular layer (E–G). In both groups, CD68-positive macrophages are intensely positive for CB (arrowheads in A–D and H–J). Dotted lines: upper and lower limits of granular and basal layers, respectively. c: cornified layer, lp: lamina propria. Scale bars: 20 µm (A–G, J–L), 50 µm (inset in C, H, I). (M) Immunoblot analysis of CB in esophageal mucosae of the sham (S) and RE (R) groups. In both groups, the proform (pro) of CB (around 40 kD) is only weakly detected, whereas mature forms of CB (29 kD and 26 kD for single- and heavy-chain forms, respectively) are evident. Protein amount of both the proform and mature forms for CB is increased in the RE group.
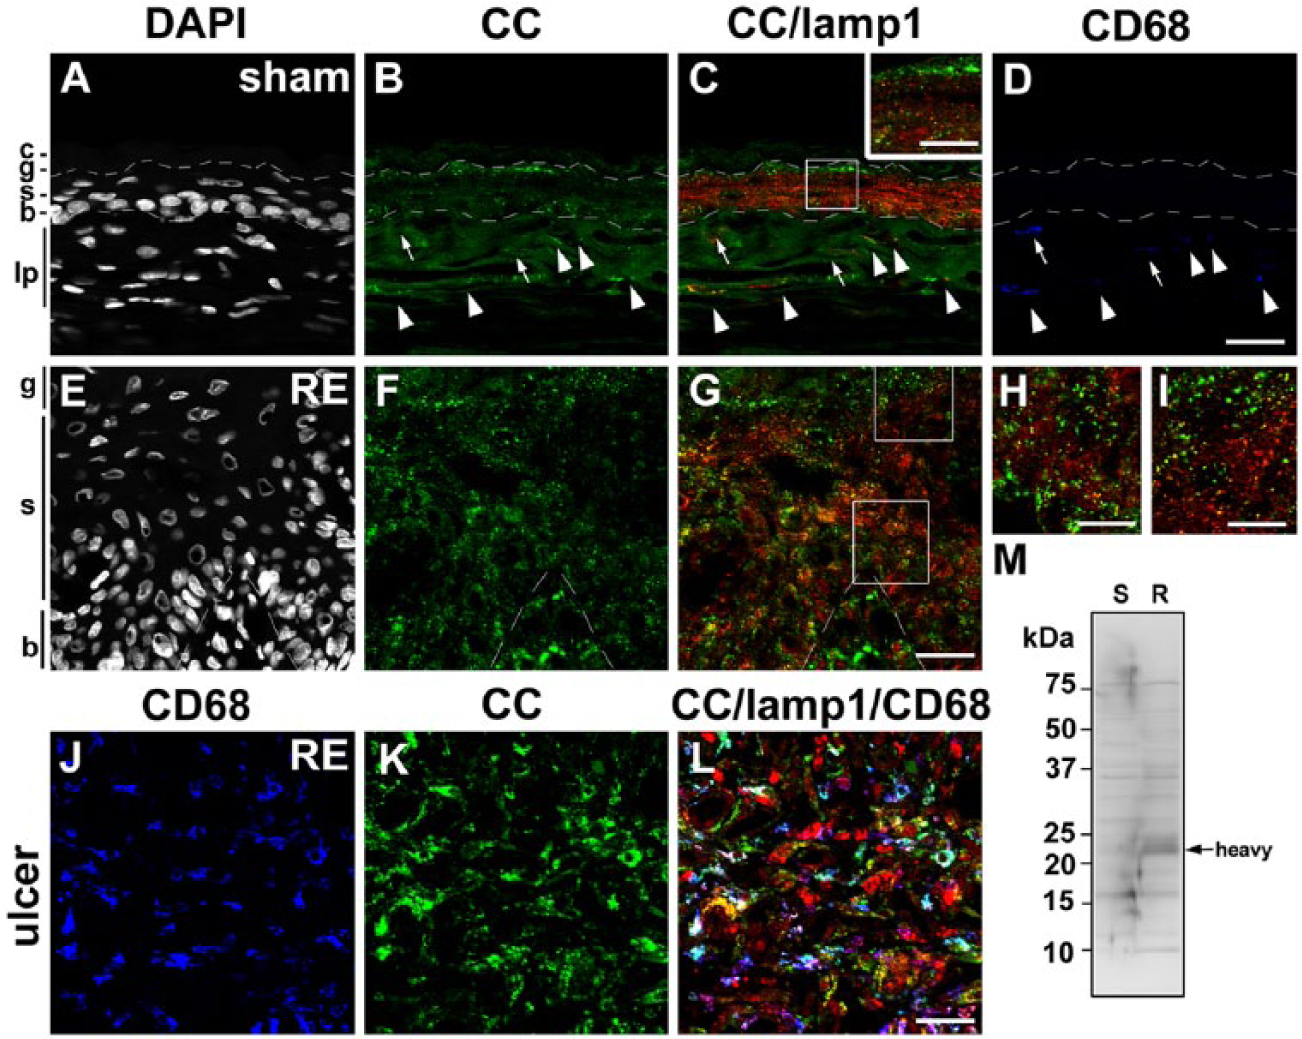
Distribution of cathepsin C (CC) in the esophageal mucosa of sham (A–D) and Reflux Esophagitis (RE) (E–G) groups and the fundus ulcer of the RE group (H–J) at 28 days post-operatively. Triple staining for CC (green), lamp1 (red) and CD68 (blue) in addition to counterstaining with DAPI (white). Boxed areas in C and G are enlarged and shown as insets in C, and H and I, respectively. In the sham group, granular immunoreactivity for CC is localized intensely in the granular layer (g), and moderately localized in the basal (b) and spinous (s) layers (A–C). In the RE group, intense granular staining for CC is observed in the basal and spinous layers in addition to the granular layer (E–G). In the sham group, some CD68-positive macrophages are intensely positive for CC (arrowheads in A–D), whereas some are negative for CC (arrows in A–D). In the RE group, most of the CD68-positive macrophages are intensely positive for CC (H–J). Dotted lines: upper and lower limits of granular and basal layers, respectively. c: cornified layer, lp: lamina propria. Scale bars: 20 µm (A–G, J–L), 50 µm (inset in C, H, I). (M) Immunoblot analysis of CC in esophageal mucosae of the sham (S) and RE (R) groups. The mature form of CC (25 kD for the heavy-chain form) is increased significantly in the mucosa of the RE group.
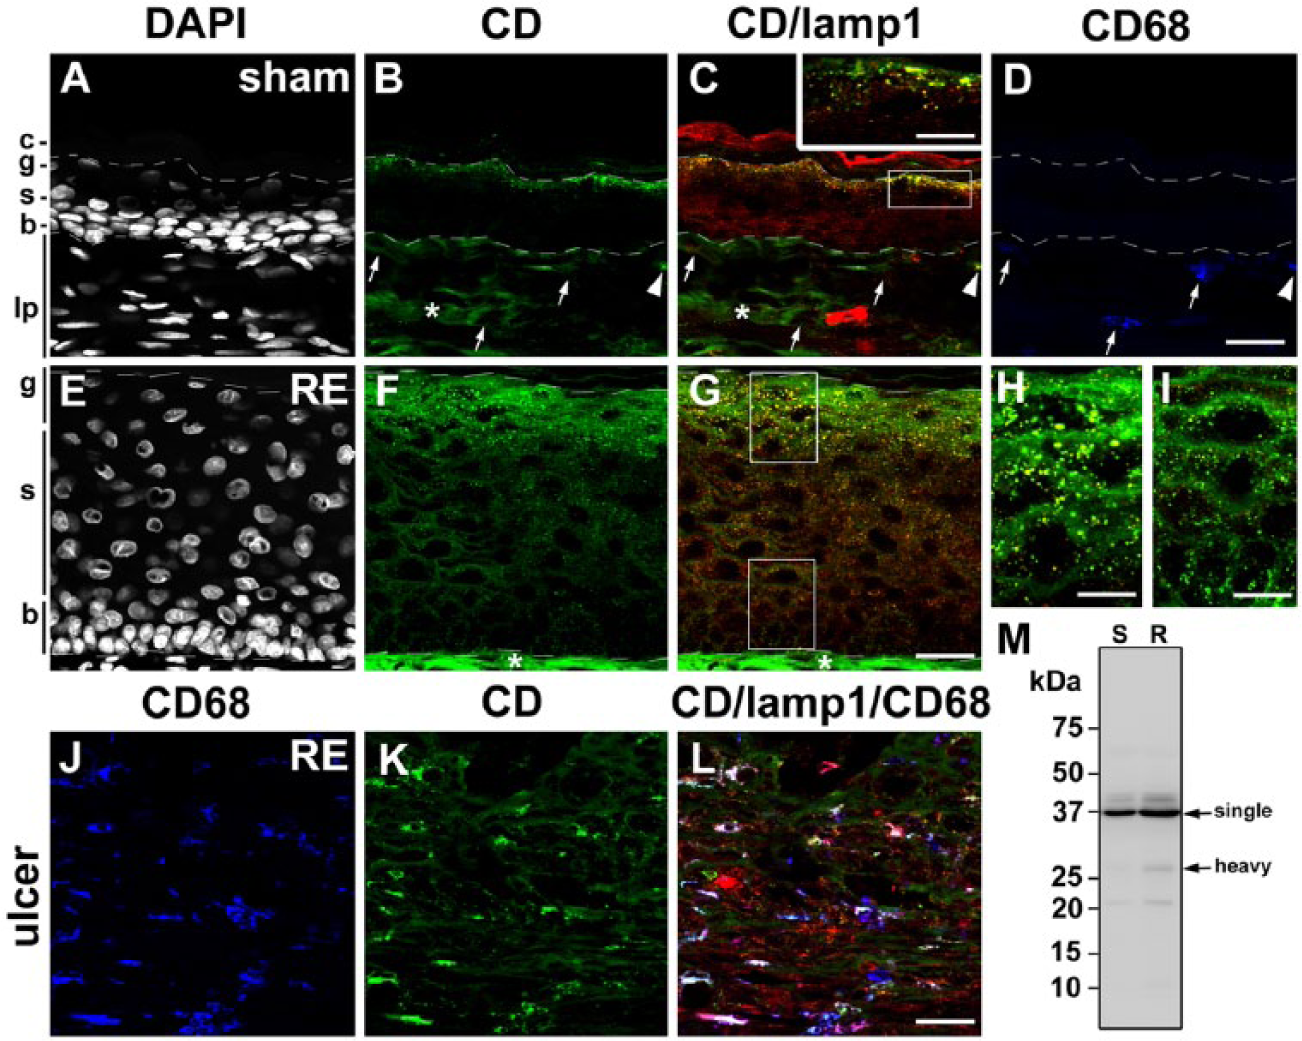
Distribution of cathepsin D (CD) in the esophageal mucosa of sham (A–D) and Reflux Esophagitis (RE) (E–G) groups and the fundus ulcer of the RE group (H–J) at 28 days post-operatively. Triple staining for CD (green), lamp1 (red) and CD68 (blue) in addition to counterstaining with DAPI (white). Boxed areas in C and G are enlarged and shown as insets in C, and H and I, respectively. In the sham group, granular immunoreactivity for CD is intensely localized in the granular layer (g) and absent in the spinous (s) and basal (b) layers (A–C). In the RE group, intense granular staining for CD is observed in the granular layer and weak granular staining appears in the spinous layers, but the immunoreactivity for CD is absent in the basal granular layer (E–G). In the sham group, some CD68-positive macrophages are positive for CD (arrowheads in A–D), whereas some are negative for CD (arrows in A-D). In the RE group, most of the CD68-positive macrophages are intensely positive for CD (H–J). Dotted lines: upper and lower limits of granular and basal layers, respectively. Asterisks: non-specific staining in the lamina propria. c: cornified layer, lp: lamina propria. Scale bars: 20 µm (A–G, J–L), 50 µm (inset in C, H, I). (M) Immunoblot analysis of CD in esophageal mucosae of the sham (S) and RE (R) groups. Mature forms of CD (43 kD and 31 kD for single- and heavy- chain forms, respectively) are increased in the mucosa of the RE group.
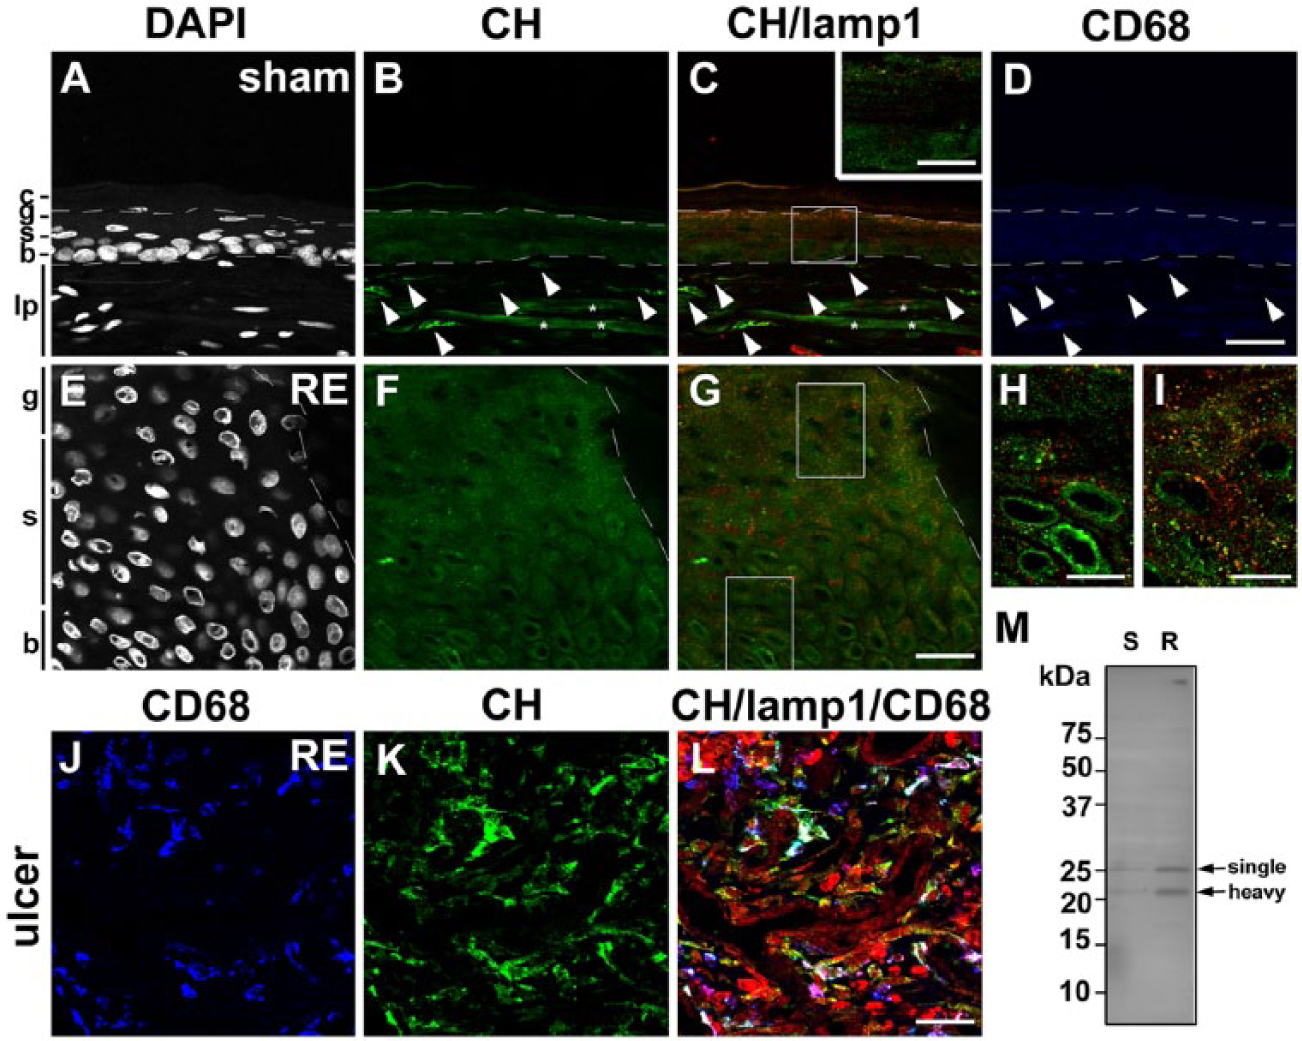
Distribution of cathepsin H (CH) in the esophageal mucosa of sham (A–D) and Reflux Esophagitis (RE) (E–G) groups and the fundus ulcer of the RE group (H–J) at 28 days post-operatively. Triple staining for CH (green), lamp1 (red) and CD68 (blue) in addition to counterstaining with DAPI (white). Boxed areas in C and G are enlarged and shown as insets in C, and H and I, respectively. In the sham group, granular immunoreactivity for CH is absent in all layers (A–C). In the RE group, weak but distinct granular staining for CH appears in all layers (E–G), though its immunoreactivity in the basal layer is faint. In both groups, CD68-positive macrophages are intensely positive for CH (arrowheads in A–D and H–J). Dotted lines: upper and lower limits of granular and basal layers, respectively. Asterisks: non-specific staining in the lamina propria. c: cornified layer, g: granular layer, s: spinous layer, b: basal layer, lp: lamina propria. Scale bars: 20 µm (A–G, J–L), 50 µm (inset in C, H, I). (M) Immunoblot analysis of CH in esophageal mucosae of the sham (S) and RE (R) groups. Mature forms of CH (28 kD and 22 kD for single and heavy chains, respectively) are significantly increased in the mucosa of the RE group.
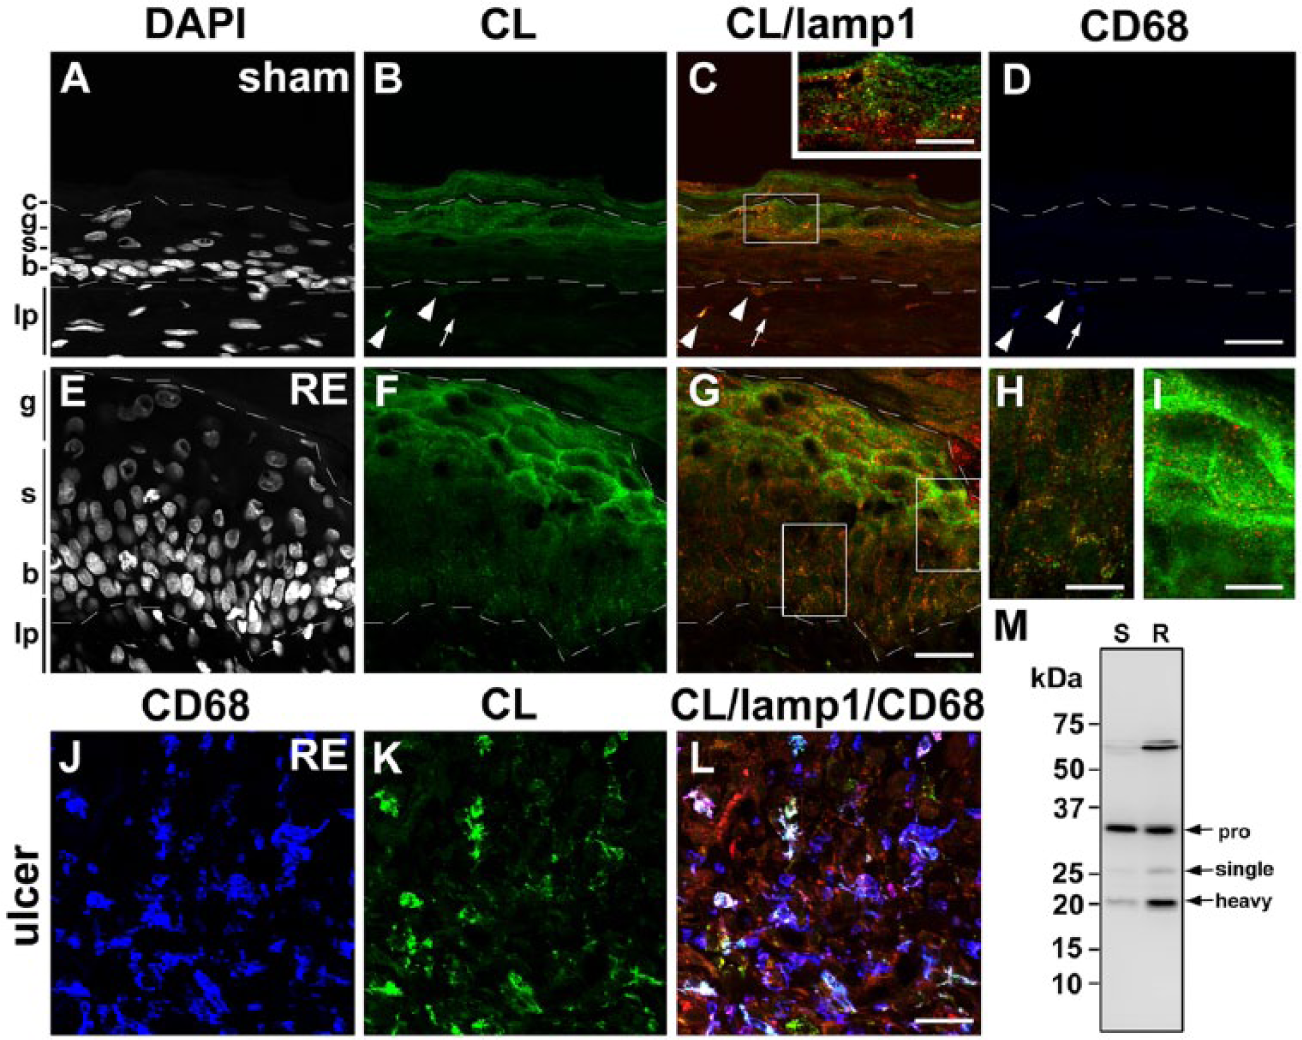
Distribution of cathepsin L (CL) in the esophageal mucosa of sham (A–D) and Reflux Esophagitis (RE) (E–G) groups and the fundus ulcer of the RE group (H–J) at 28 days post-operatively. Triple staining for CL (green), lamp1 (red) and CD68 (blue) in addition to counterstaining with DAPI (white). Boxed areas in C and G are enlarged and shown as insets in C, and H and I, respectively. In the sham group, granular immunoreactivity for CL is weak localized in the granular (g) and basal (b) layers and absent in the spinous (s) layer (A–C). In the RE group, moderate granular staining for CL appears in the basal layer in addition to the weak immunodeposits for CL in the granular layer, but immunoreactivity for CL is also absent in the spinous layers (E–G). In the sham group, some CD68-positive macrophages are positive for CL (arrowheads in A–D), whereas some are negative for CL (arrows in A–D). In the RE group, most of the CD68-positive macrophages are intensely positive for CL (H–J). Dotted lines: upper and lower limits of granular and basal layers, respectively. c: cornified layer, lp: lamina propria. Scale bars: 20 µm (A–G, J–L), 50 µm (an inset in C, H, I). (M) Immunoblot analysis of CL in esophageal mucosae of the sham (S) and RE (R) groups. In both groups, the proform (pro) of CL (39 kD) is intensely detected. Furthermore, the mature forms of CL (29 kD and 23 kD for single and heavy chains, respectively) are increased significantly in the mucosa of the RE group.
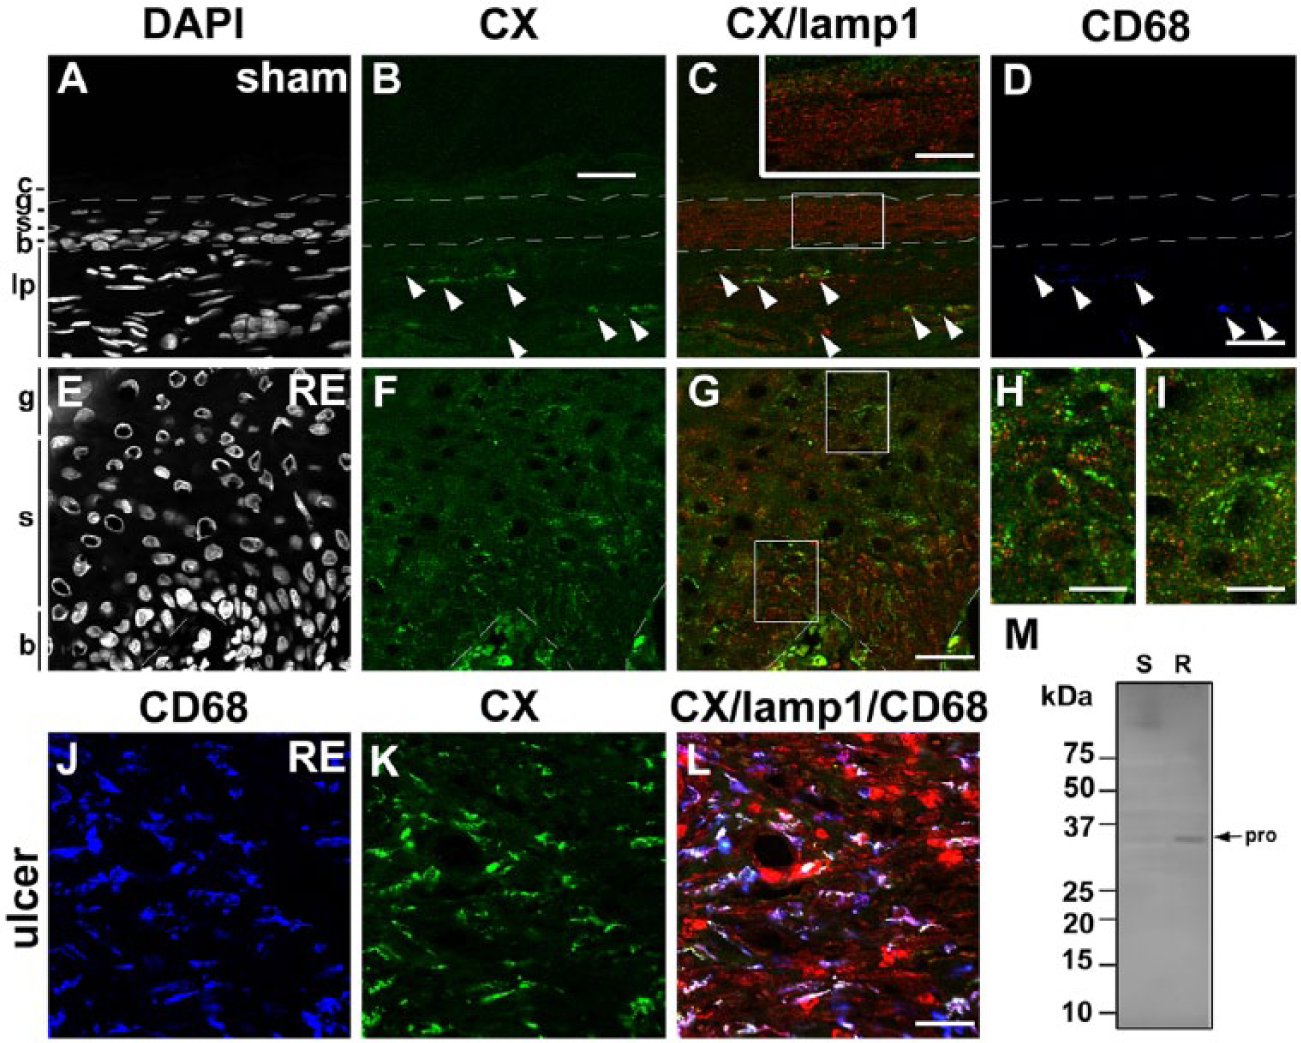
Distribution of cathepsin X (CX) in the esophageal mucosa of sham (A–D) and Reflux Esophagitis (RE) (E–G) groups and the fundus ulcer of the RE group (H–J) at 28 days post-operatively. Triple staining for CX (green), lamp1 (red) and CD68 (blue) in addition to counterstaining with DAPI (white). Boxed areas in C and G are enlarged and shown as insets in C, and H and I, respectively. In the sham group, granular immunoreactivity for CX is absent in all layers (A–C). In the RE group, weak but distinct granular staining for CX appears in the basal (b) and spinous (s) layers (E–G), whereas immunoreactivity for CX is absent in the granular layer (g). In both groups, CD68-positive macrophages are positive for CX. Immunoreactivity for CX in macrophages is stronger in the RE groups (arrowheads in A-D and H–J). Dotted lines: upper and lower limits of granular and basal layers, respectively. c: cornified layer, g: granular layer, s: spinous layer, b: basal layer, lp: lamina propria. Scale bars: 20 µm (A–G, J–L), 50 µm (inset in C, H, I). (M) Immunoblot analysis of CX in esophageal mucosae of the sham (S) and RE (R) groups. The proform (pro) of CX (34 kD) is increased significantly in the mucosa of the RE group. The mature form of CX is not detected in both groups.
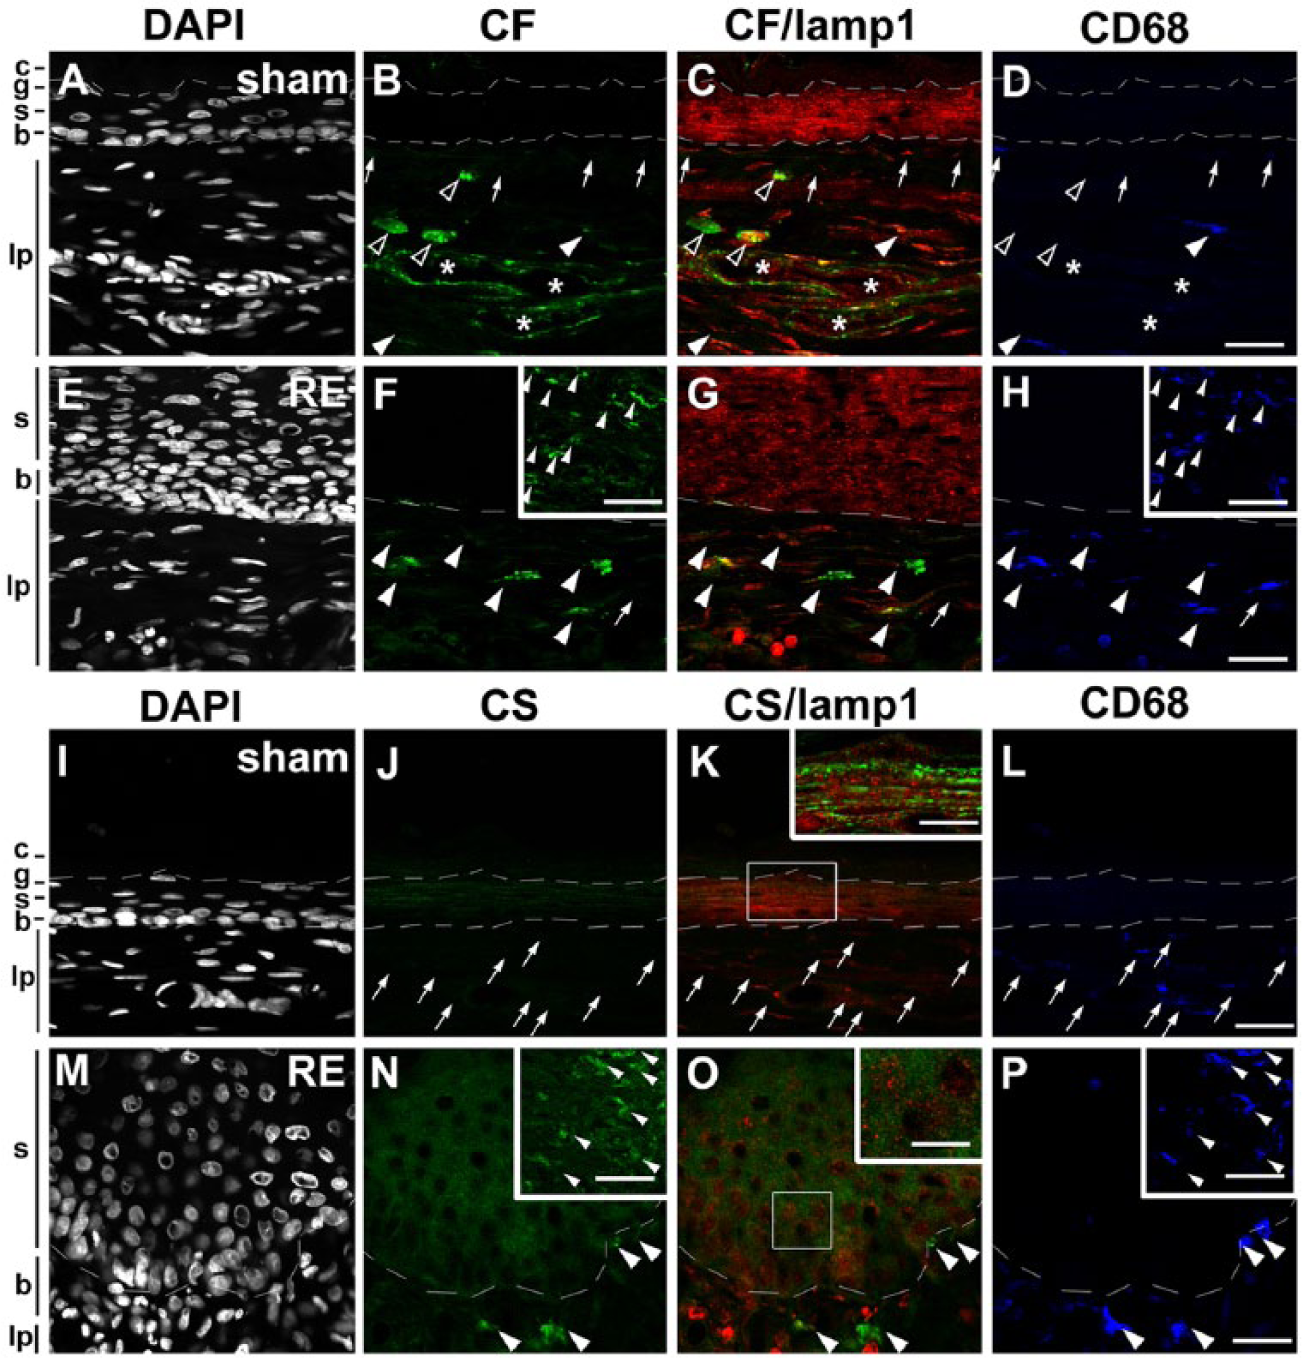
Distribution of cathepsin F (A–H) and S (I–P) (CF and CS, respectively) in the esophageal mucosa of sham (A–D and I–L, respectively) and Reflux Esophagitis (RE) (E–H and M–P, respectively) groups and the fundus ulcer of the RE group (insets in F, H and N, P, respectively) at 28 days post-operatively. Triple staining for CF or CS (green), lamp1 (red) and CD68 (blue) in addition to counterstaining with DAPI (white). Boxed areas in K and O are enlarged and shown as insets. In both groups, granular immunoreactivity for CF is absent in all layers (A–C and E–G). In both groups, some CD68-positive macrophages are positive for CF (arrowheads in B–D, F–H) and some are negative for CF (arrows in B–D, F–H). Immunoreactivity for CF in macrophages is stronger in the RE groups (arrowheads in A–D, H–J and insets in F, H). Note that granular immunoreactivity for CF is also detected in cells other than macrophages in the lamina propria (lp) and endothelial cells of the capillaries (asterisks). In both groups, granular immunoreactivity for CS is absent in all layers (I–K and M–O). In the sham group, CD68-positive macrophages are completely negative for CS (arrows in J–L), whereas in the RE group CD68-positive macrophages are intensely immunopositive for CS (arrowheads in N–P and insets in O, P). Dotted lines: upper and lower limits of granular and basal layers, respectively. c: cornified layer, g: granular layer, s: spinous layer, b: basal layer. Scale bars: 20 µm (A-P, insets in F, H, N, P), 50 µm (insets in K, O).
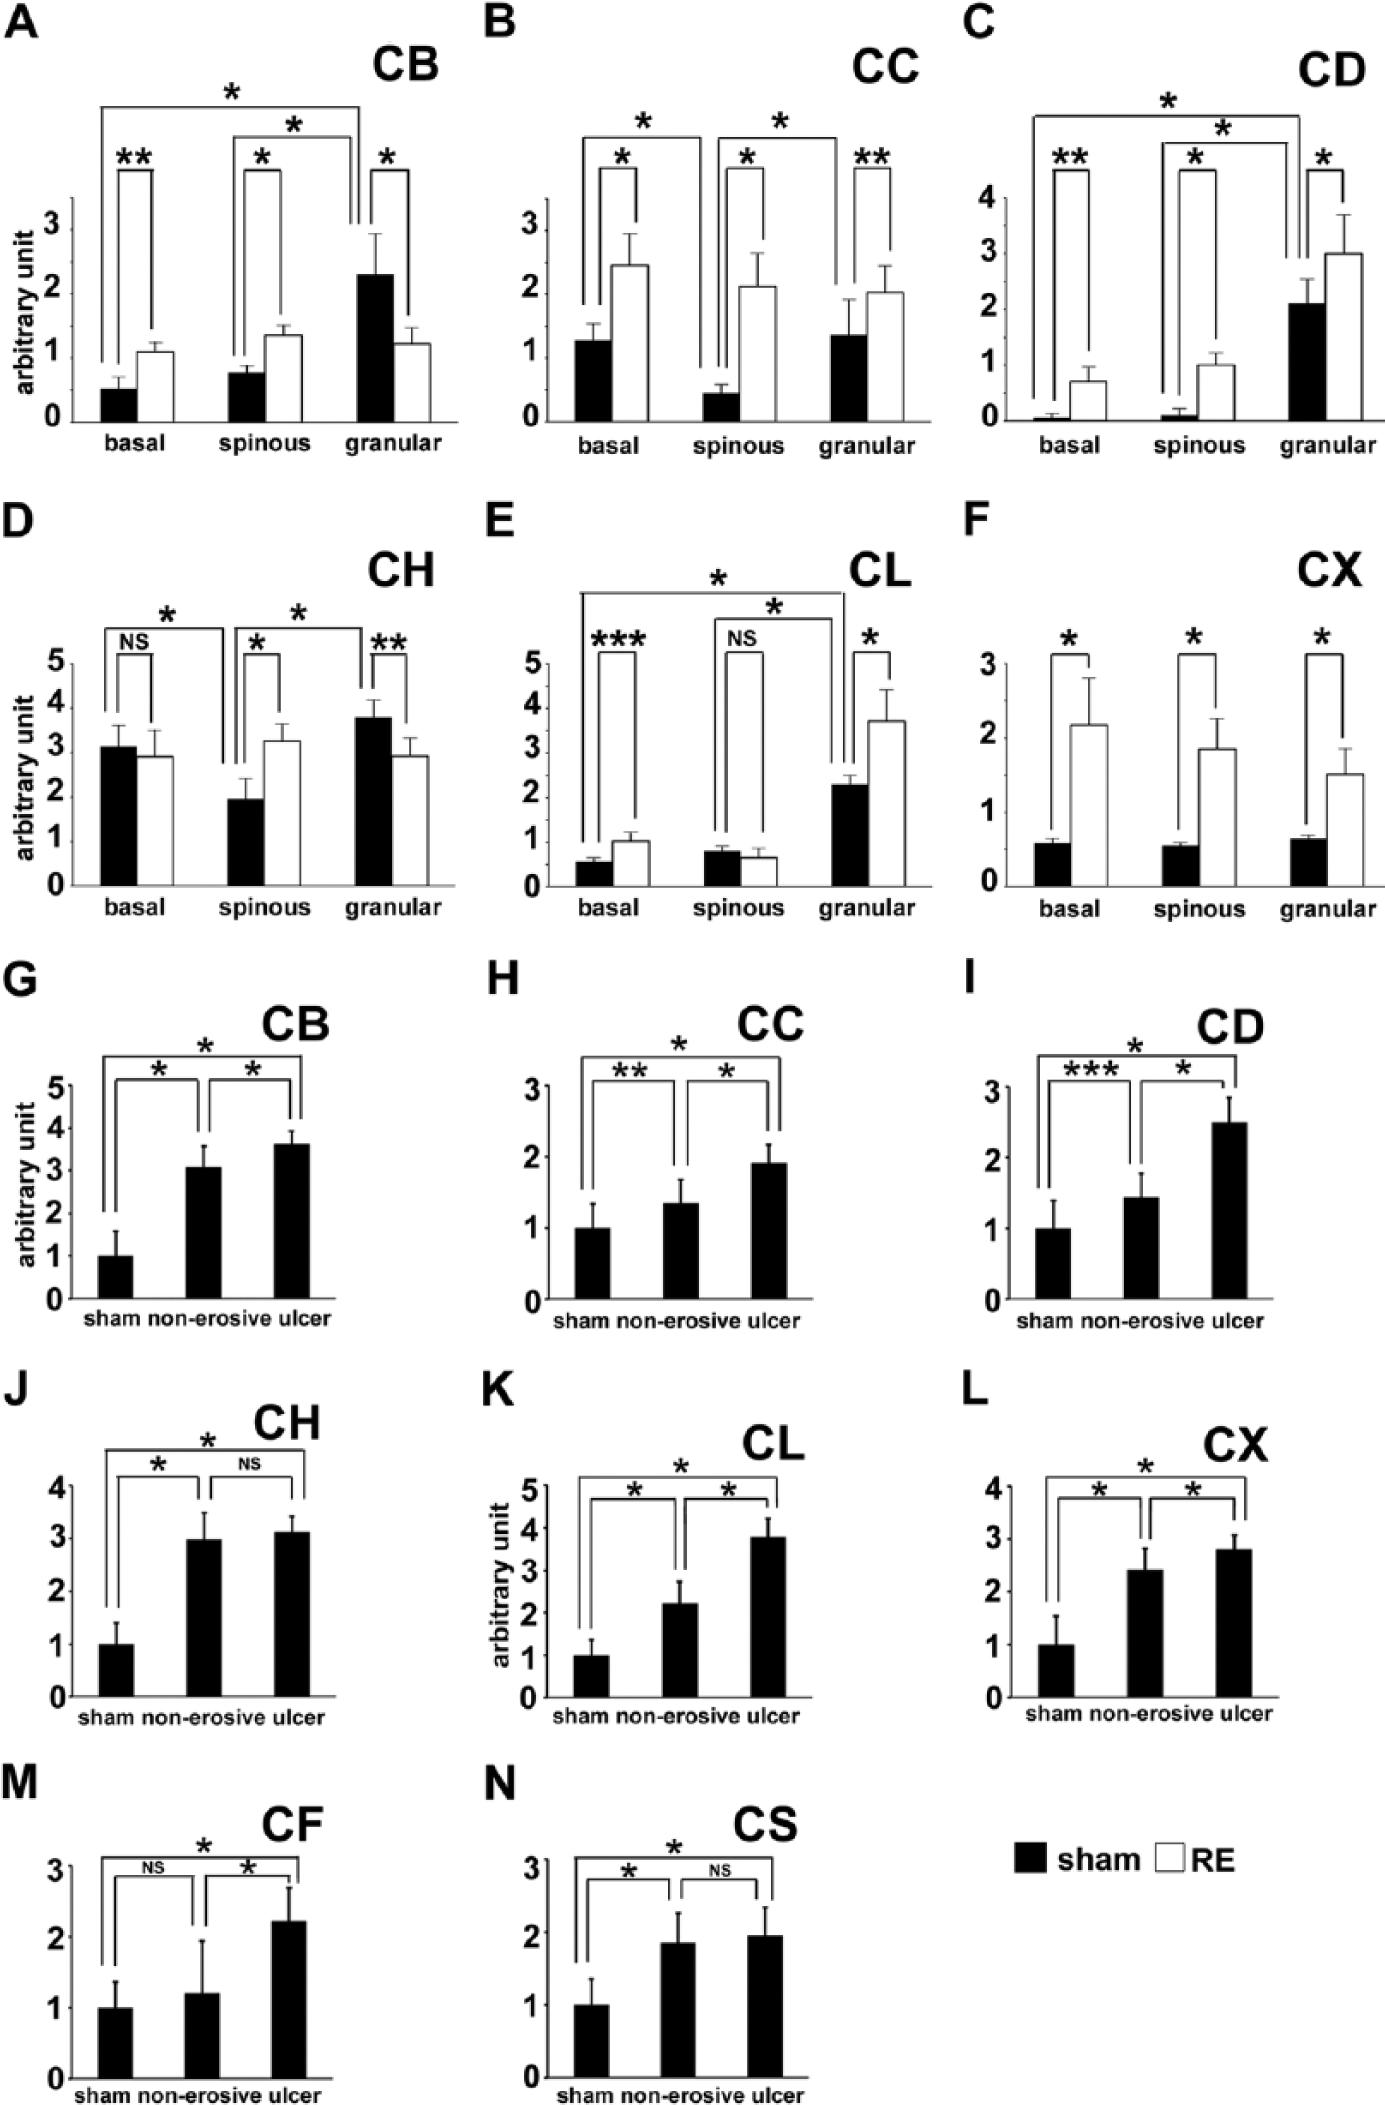
Fluorescence intensity of cathepsin B (CB) (A, G), cathepsin C (CC) (B, H), cathepsin D (CD) (C, I), cathepsin H (CH) (D, J), cathepsin L (CL) (E, K), cathepsin X (CX) (F, L), cathepsin F (CF) (M), cathepsin S (CS) (N) in esophageal epithelial cells (n=10) in the basal, spinous and granular layers of sham and Reflux Esophagitis (RE) groups (A-F) and macrophages in the esophageal normal (n=16, 12, 6, 11, 9, 9, 6, and 9 for CB, CC, CD, CH, CL, CX, CF and CS, respectively) and non-erosive (n=31, 31, 30, 30, 31, 32, 29, and 30 for CB, CC, CD, CH, CL, CX, CF and CS, respectively) lamina propria mucosae of sham and RE groups, respectively, and the fundus of the ulcer (n=50, 50, 48, 50, 50, 50, 48, and 28 for CB, CC, CD, CH, CL, CX, CF and CS, respectively) of the RE group. Vertical bars represent mean ± SD (*p<0.001, ** p<0.01, *** p<0.05, one-way ANOVA followed by Tukey’s post hoc test). NS: non-significant.
Western blotting of Cathepsins in the Esophageal Mucosa of the Sham and RE Groups
For a biochemical examination of the presence of the lysosomal cysteine and aspartic proteinases mentioned above, western blotting was performed using extracts of the stripped esophageal mucosa of the sham and RE groups. GAPDH was used as a loading control (Supplemental Fig. S1G, S1H). The bands immunoreactive to anti-CB appeared strongly at 29 and 26 kD (single- and heavy-chain forms) and weakly at 40 kD (the proform). The contents of both the proform and mature forms for CB were increased in the RE group (Fig. 2M and Supplemental Fig. S1A). The band immunoreactive to anti-CC, which appeared at 25 kD for the heavy-chain form, was significantly increased in the RE group (Fig. 3M and Supplemental Fig. S1B). The bands immunoreactive to anti-CD, which appeared at 43 and 31 kD (single- and heavy-chain forms), were increased in the RE group (Fig. 4M and Supplemental Fig. S1C). Protein bands immunoreactive to anti-CH, which appeared at 28 and 22 kD (single- and heavy-chain forms, respectively), were significantly increased in the RE group (Fig. 5M and Supplemental Fig. S1D). Protein bands immunoreactive to anti-CL were strong at 39 kD corresponding to the proform in both groups. Furthermore the bands immunoreactive to anti-CL, which appeared at 29 and 23 kD (single- and heavy-chain forms, respectively), were increased significantly in the RE group (Fig. 6M and Supplemental Fig. S1E). Protein bands immunoreactive to anti-CX were detected strongly at 34 kD, corresponding to the proform. The protein amount of the proform for CX was increased in the RE group (Fig. 7M and Supplemental Fig. S1F). The mature form of CX was below the detection level in both groups. In the present study, we failed to detect immunoreactive bands for CF or CS in both groups using commercially available antibodies. These data suggest that most of the cathepsins examined in this study were upregulated after the RE induction.
Upregulation of Cathepsins in the Esophageal Epithelia of the RE Group
Immunohistological analyses revealed that CB, CC, CD and CL, which showed different distributions in the control esophageal epithelia, were distributed more widely and intensely in the esophageal epithelia of the RE group compared with that of the sham group. Intense granular immunodeposits for CB and CC were observed in all of the esophageal epithelia of the RE group (Fig. 2E–2I and 2E–2I; 9A, 9B), although the intensity of CB in the granular layer of the RE group had decreased to some extent. In addition to the strong granular immunodeposits for CD in the granular layer of the esophageal epithelia of the RE group, weak but distinct granular immunoreactivity for CD appeared in the epithelial cells in the basal and spinous layers (Fig. 4E–4I), which was confirmed by a quantitative analysis of the fluorescence intensity of CD (Fig. 9C). As for CL, moderate granular immunoreactivity appeared in the epithelial cells in the basal layer but was barely detected in the spinous layer (Fig. 6E–6H), as confirmed by the quantitative analysis (Fig. 9E). According to the quantitative analysis, the immunoreactivity for CL seemed to be increased in the granular layer (Fig. 9E), but this overestimation was due to a higher background around the epithelial cells for unknown reasons. Immunoreactivity for CL in the granular layer was moderate, as determined using an enlarged image of the double staining for CL and lamp1 (Fig. 6I). Among the other four cathepsins, which were negative in all epithelial layers of the control esophagus, the immunoreactivity for CF and CS was absent in the esophageal epithelia of the RE group (Fig. 8E–8H, 8M–8P). As shown in the enlarged image, diffuse immunoreactivity for CS was observed in the spinous layer, but CS immunoreactivity was not colocalized with the granular immunoreactivity of lamp1 (inset in Fig. 8O). Therefore, we assumed this to be non-specific background staining. On the other hand, granular immunoreactivity for CH and CX was induced in the esophageal epithelia of the RE group. Weak but distinct granular immunodeposits for CH were distributed in all the esophageal epithelia of the RE group, although the deposits in the basal layer were weaker in intensity (Fig. 5E–5G). Quantitative analyses of the fluorescence intensity of CH immunoreactivity only confirmed its upregulation in the spinous layer of the RE group (Fig. 9D); the higher background hampered the quantitative analysis of CH immunoreactivity in the basal and granular layers of the RE group (Fig. 9D). Moderate granular immunodeposits for CX were distributed in the basal and spinous layers of the RE group, whereas those in the granular layer were weak (Fig. 7E–7I); this was confirmed by quantitative analysis (Fig. 9F). These results indicated that several cathepsins are induced in esophageal epithelial cells after RE induction.
Localization of the Cathepsins in the Macrophages of the Esophageal Mucosa of the Sham and RE Groups
Our previous studies showed a marked infiltration of inflammatory cells in the lamina propria of the RE group (Asaoka et al. 2005; Oguro et al. 2011; Mori et al. In Press). Therefore, we focused on the distribution of cathepsins in macrophages of the esophageal mucosa of the sham and RE groups via the double or triple staining of the cathepsins, CD68 and lamp1. Using bright-field immunohistochemistry for CD68 in paraffin sections, intense immunoreactivity for CD68 was detected only in activated macrophages infiltrated around the fundus of the ulcer of the RE group (Fig. 1F); however, immunofluorescence microscopy revealed the presence of CD68-positive macrophages in both RE and sham groups. In the RE group, a massive infiltration of CD68-positive macrophages was observed not only in the fundus of the ulcer, but also in the non-erosive lamina propria. A comparison of the number of the CD68-positive macrophages per unit area in the sham and RE groups confirmed massive macrophage infiltration both in the non-erosive lamina propria mucosae and in the fundus of the ulcer in the RE group (Supplemental Fig. S1G).
Intense immunoreactivity for CB or CH was observed in the CD68-positive macrophages of both groups (Fig. 2A–2D; 2H–2J; 5A–5D; and 5H–5J). In the sham group, some CD68-positive macrophages were intensely positive for CC, CD or CL, whereas some showed no immunoreactivity (Fig. 3A–3D; 4A–4D; and 6A–6D). In the RE group, however, most of the CD68-positive macrophages were intensely positive for CC, CD or CL (Fig. 3H–3J; 4H–4J; and 6H–6J). In both groups, CD68-positive macrophages were positive for CX; however, CX immunoreactivity in the macrophages was stronger in the RE group (Fig. 7A–7D and 7H–7J). In both groups, some CD68-positive macrophages were positive for CF and some were negative for CF. Immunoreactivity for CF in macrophages was stronger in the RE group (Fig. 8B–8D and 8F–8H, insets in Fig. 8F and 8H). However, some macrophages in the non-erosive lamina propria mucosae of the RE group were still negative for CF (an arrow in Fig. 8F–8H), whereas, in the fundus of the ulcer, most macrophages were positive for CF (insets in Fig. 8F and 8H). In the sham group, CD68-positive macrophages were completely negative for CS (Fig. 8J–8L), whereas, in the RE group, CD68-positive macrophages were intensely immunopositive for CS (Fig. 8N–8P; insets in Fig. 7N and 7P). These results indicated that all cathepsins examined in this study are upregulated in macrophages after inducing RE.
To further compare the immunoreactivity of the cathepsins in macrophages in the esophageal normal and non-erosive lamina propria mucosae of sham and RE groups, respectively, and the fundus of the ulcer of the RE group, measurements of the mean fluorescence intensity of cathepsins in the CD68-positive regions of macrophages were performed (Fig. 9G–9K). Among the cathepsins examined, with the exception of CF, most were upregulated in macrophages infiltrated both in the non-erosive and ulcerated regions. As for CB, CC, CD, CL, and CX, the upregulation of these proteinases were more pronounced in macrophages in the ulcerated regions than those in the non-erosive regions (Fig. 9G–9I, 9K and 9L), whereas there were no differences in the intensities of immunoreactivity for CH and CS in the macrophages of these regions (Fig. 9J, 9N). Finally, judging from the mean fluorescence intensity per cell, CF was upregulated only in the macrophages in the ulcerated region. There were no differences in the intensities of CF immunoreactivity in the macrophages of the esophageal normal and non-erosive lamina propria mucosae of sham and RE groups, respectively (Fig. 9M).
Discussion
The results of the present study demonstrate that, among the cathepsins examined (CB, CC, CD, CF, CH, CL, CS, and CX), the representative cysteine and aspartic proteinases (CB, CC, CL and CD) were localized in control esophageal epithelial cells, although their distribution differed depending on the enzyme examined (summarized in Table 1). These four proteinases are ubiquitously expressed in the cells of various tissues (Katunuma and Kominami 1983; Whitaker and Rhodes 1983). However, immunohistochemical analyses have revealed that these proteinases are heterogeneously distributed even in the same tissues (Uchiyama 1994). Previously, we demonstrated that, in rat sole skin epidermis, the immunoreactivity for CB and CC was prominent in the lower spinous and basal layers, whereas that for CL and CD was intense in the upper spinous and granular layers (Sato et al. 1997). In the present study, we obtained similar results showing that CL and CD are expressed dominantly in the granular layer of the control rat esophageal epithelia. However, aside from their distribution patterns in skin epidermis, CB and CC were also prominently expressed in the granular layer of the control rat esophageal epithelia, although CB was detected faintly in the basal layer and CC was observed moderately in both basal and spinous layers. The specific localization of these proteinases may indicate that they participate in the degradation process in granular cells; this is in line with their drastic structural changes. Among these four proteinases, CC was widely distributed in all layers. In humans, loss-of-function mutations in the CC gene are responsible for the Papillon-Lefèvre and Haim-Munk syndromes (Hart et al. 1999; Toomes et al. 1999; Hart et al. 2000), which are rare, autosomal recessive diseases characterized by palmoplantar hyperkeratosis of the skin. Rat esophagus is covered by keratinized squamous epithelium. Therefore, it is possible that CC has some essential role for normal keratinization of the rat esophageal epithelium. CH has been purified biochemically from rat skin, vaginal mucosa and forestomach mucosa (Rinne et al. 1985) and has been detected immunohistochemically in the basal layer or weakly in the spinous layer (Rinne et al. 1985). In the present study, however, CH immunoreactivity was faint in all layers of normal rat esophageal epithelia. Enzyme immunoassays for CH using various rat tissue extracts have shown that the level of CH in the skin is about five times higher than that in the esophagus (Kominami et al. 1985), suggesting that it may be difficult to detect CH immunoreactivity in a normal rat esophagus.
The present study also demonstrated an alteration in the distribution/expression of cathepsins at the esophageal mucosa in an RE animal model. Using western blotting, the intensity of protein bands specifically immunoreactive to the cathepsins examined were increased in the RE group. As summarized in Table 1, in the RE group, the immunoreactivity of CB, CC, CL and CD, which were also detected in the normal esophagus, were increased in the esophageal epithelia. In the RE group, all layers became immunopositive for CB and CD, as did the spinous layer for CL. The immunoreactivity for CF, CH, CS and CX was barely detectable in the control esophageal epithelium. In the RE group, however, we noticed a slight increase in the expressions of CH and CX in epithelial cells. In the pathological conditions of the skin, such as psoriasis, previous reports have shown an increased expression and redistribution of CL, CB and CD in psoriatic epidermis (Kawada et al. 1997). Similar to the present study, there is no immunoreactivity for CS in a normal human skin keratinocytes, whereas psoriatic keratinocytes become immunopositive for CS (Schonefuss et al. 2010), which is triggered by inflammatory changes. Cathepsins are known to be secreted extracellularly. Such secreted cathepsins mediate degradation of various molecules of the extracellular matrix (Premzl et al. 2003). Some cathepsins also show elastolytic activity (Liu et al. 2004). A recent report showed that age-related changes in the protein expression and activity of cysteine cathepsins and their endogenous inhibitors is associated with an abnormal degree of extracellular matrix protein degradation and deposition during the aging process of the skin (Sage et al. 2014). Moreover, in keratinocytes, cathepsins are involved in a remodeling of intercellular junctions such as desmosomes (Igarashi et al. 2004; Kitajima In Press). The onset mechanism of the reflux esophagitis is unknown. However, in esophageal epithelial cells after RE, the induction of cathepsins may be associated with increased paracellular permeability through a remodeling of the extracellular matrix and/or as a result of damage to intercellular junctions, similar to that observed in the epidermis. Importantly, the expression of cathepsins was increased in the thickened, but non-erosive, esophageal epithelium, which may indicate a role in the pathogenesis of non-erosive reflux disease (NERD).
The quantitative analyses in the present study confirmed massive macrophage infiltration both in the non-erosive lamina propria mucosae and in the fundus of the ulcer of the RE group. Moreover, more macrophages had infiltrated in the ulcerated regions than in the non-erosive regions. Our present immunohistological analyses also showed that the upregulation of immunopositive western blot bands for cathepsins in the RE group was due not only to the induction of cathepsins in the esophageal epithelia, but also their expression in macrophages in both the non-erosive and ulcerated regions. Cathepsin may act as a physiological activating agent for inflammation through its induction in activated macrophages. In various types of brain injuries, several lysosomal cysteine proteinases, such as CC, CX and CS, are upregulated in microglia/macrophages (Leichsenring et al. 2008; Wendt et al. 2008; Koike et al. 2013b). Interestingly, in H. pylori-infected mucosal stroma, CX is expressed predominantly by macrophages (Krueger et al. 2005). Moreover, CB, CL and CS are activated in macrophages during colitis (Cattaruzza et al. 2011). Our results clearly demonstrate that the number of macrophages was increased and that these submucosal, activated macrophages in the RE group were intensely immunopositive for all cathepsins examined. Judging from the mean fluorescence intensity per cell, we noticed that there were no differences in the intensities for CF immunoreactivity in the macrophages of the esophageal normal and non-erosive lamina propria mucosae between the sham and RE groups, whereas it was upregulated only in macrophages in the ulcerated regions. The results from the immunohistochemical analyses suggest that CF was detected in a subpopulation of macrophages in the normal esophageal mucosa and in the non-erosive mucosa of the RE group. It is well known that activated macrophages can present as two major phenotypes: M1, or classically activated, which has pro-inflammatory features, and M2, or alternatively activated, with anti-inflammatory features (Gordon and Taylor 2005; Biswas and Mantovani 2010). Recently, the involvement of both M1 and M2 type macrophages during chronic inflammation and carcinogenesis was implicated in a rat reflux model of esophageal carcinoma (Miyashita et al. 2014). Further investigations will be necessary to better understand the relationship between the induction of cathepsins and the heterogeneity of macrophages after RE.
During the chronic inflammation stage of colitis, macrophages destroy the extracellular matrix by secreting several cathepsins (Reddy et al. 1995), which may aggravate colitis by promoting paracellular permeability and an influx of inflammatory cells. Furthermore, secreted CS activates nociceptors to induce visceral pain via protease-activated receptor-2, which may induce colonic pain and inflammation (Cattaruzza et al. 2011). Therefore, the crosstalk between cathepsins and inflammation may be an important consideration in any attempts to understand the mechanism of reflux esophagitis, and the use of inhibitors against cathepsins may improve the submucosal inflammation associated with reflux esophagitis. However, further investigation is necessary to better understand the relationship between cathepsin and epithelium permeability and subepithelial inflammation in the esophagus.
Footnotes
Acknowledgements
We would like to thank Yoshimitsu Kobayashi for his histological analyses.
Declaration of Conflicting Interests
The authors declare no potential conflicts of interest with respect to the research, authorship, and/or publication of this article.
Funding
The authors disclosed receipt of the following financial support for the research, authorship, and/or publication of this article: This work was supported in part by a Program for the Strategic Research Foundation at Private Universities (Y.U.) from the Japan Society for the Promotion of Science and the Ministry of Education, Science, Sports and Culture, Japan.