
Abstract
The phenotypic polarization of macrophages are involved in steroid-induced osteonecrosis (ON). This study tried to investigate the detrimental and beneficial roles of M1/M2 macrophages associated with TNF-a in ON. Mice ON model was induced by the injection of methylprednisolone. After that, flow cytometry technique, immunohistochemistry, immunofluorescence, ELISA, and RT-PCR methods were used to investigate the expression pattern of macrophages and the expression of inflammatory cytokines. During the progression of ON, massive chronic inflammatory cells infiltrated into the necrotic zone, represented by the infiltration of macrophages. In the early stage of ON, there was high TNF-a activity; and a large population of M1 macrophages infiltrated into the necrotic zone. On the contrary, the expression of TNF-a gradually decreased; simultaneously, a larger M2 cell population presented in the necrotic zone in the late stage of ON. The increased M2 macrophages could be beneficial for resolving inflammation and promoting tissue repair, confirmed by the histologic findings of appositional new bone formation around the necrotic bone. Thus, it showed that TNF-a-mediated alteration of M1/M2 macrophage polarization contributed to the pathogenesis of steroid-induced osteonecrosis. M1-polarized macrophages appeared to be disruptive in the early stage of ON, while M2-polarized macrophages played an important role in the late stage during the pathogenesis of ON.
Introduction
Osteoncrosis, characterized by avascular necrosis of the osteocytes and bone marrow cells, is a debilitating disease that usually affects the femoral head and eventually destroys the hip joint. The usage of steroids is the most common non-traumatic cause of osteonecrosis (ON). Excessive glucocorticoid administration could decrease bone formation, promote osteoclastic resorption, impair bone cell survival, and strengthen adipocytic differentiation in glucocorticoid-induced bone microenvironments. 1 Besides osteocytes, adipocytes, vascular endothelial cells, and macrophage are involved as supporting cells. 2
Macrophages are immune effector cells that orchestrate a diverse array of functions including inflammatory response, tissue repair, immune responses, and so on.3–5 Their diverse but polarized functional phenotypes, driven by micro-environmental cues, allow them to adapt readily to changing conditions within tissues. 6 In response to diverse signals derived from damaged tissues, macrophages undergo reprogramming, which leads to two different polarization states, M1 macrophages (classically activated) and M2 macrophages (alternatively activated).7,8 Classical activation of macrophages have been known to be induced by interferon (IFN), lipopolysaccharides (LPS), TNF, and granulocyte-macrophage colony-stimulating factor (GM-CSF); whereas alternative activation of macrophages are induced by IL-4 and IL-13. Under certain micro-environments, macrophages could be released from the bone marrow to circulatory system, then immigrate into the target tissues and differentiate into resident macrophages mainly responsible for phagocytosis, cytokine secretion, tissue remodeling, and antigen presentation. 9
Inflammation is closely related to the activation of macrophages: M1 macrophages exert pro-inflammatory activities while M2 macrophages are involved in inflammation resolution. According to the potential mechanisms, M1 macrophages are pivotal in antigen present, the secretion of pro-inflammatory cytokines, phagocytic activity, 10 while M2 macrophages play important roles in the clearance of helminthes and nematodes, resolution of inflammation and tissue repair, and remodeling.11–13 TNF-a is a potent pro-inflammatory mediator secreted by activated M1 macrophages, which plays a variety of biologic effects, such as cell differentiation, proliferation, and multiple pro-inflammatory effects. After stimulation with lipopolysaccharide (LPS), macrophages induce kinds of inflammatory modulators, including tumor necrosis factor a (TNF-a), nitric oxide (NO), interleukin-1(IL-1), interleukin-6 (IL-6), and prostaglandins (PG). 14 Many studies have found that autoimmune-related disorders are correlated with downregulated TNF-a expression, like rheumatoid arthritis (RA) and systemic lupus erythematosus (SLE).15,16
To date, the molecular mechanisms related to steroid-induced osteonecrosis are unclear, and the cell types and their contributions to the pathophysiological process following osteonecrosis are also largely unknown, such as macrophages. Excessive cortisoteroid administration could disturb the dynamic balance between M1/M2-polarized macrophages, resulting in pathological bone necrosis. We hypothesized that steroid intervention would result in increased macrophages infiltration and a shift to an M1 macrophage polarization as TNF-a expression in the early and middle stage of ON. This study aimed to investigate the roles of macrophages in the progression of steroid-induced osteonecrosis, with an emphasis on the role of TNF-a; and to explore the mechanisms for their activation and polarization.
Materials and methods
All experiments abided by the declaration of ethical approval for experiments. The experimental protocol was approved by the Animal Ethics Committee of Tongji Medical College.
Animals, establishing of ON model
Twenty-eight BALB/C mice (female, aged 8–10 weeks old) were used in the study, purchased from the animal center of Tongji Medical College, HUST. The mice were housed under SPF conditions, and received a standard laboratory diet and water ad libitum. Animals were further divided into two groups: ON group (n = 24) and control group (n = 4). Mice ON model was established according to the reported protocols. 17 Briefly, the mice were induced by one injection into the right gluteal muscle with 20 mg/kg of methylprednisolone (MPS; Pfizer, USA).
Tissue preparation
The mice of ON group were sacrificed by decapitation at 1, 2, 4 and 6 weeks after the last injection of MPS. Bilateral proximal and distal femur and humeri were harvested and fixed with 10% formalin (0.1 M phosphate buffer, pH 7.4) for histological and immunohistochemical examination. Synovial tissue were harvested and preserved at −70°C for PCR examination. Blood was collected from the inferior vena cava, half of them were used for flow cytometric analysis, and another half were centrifuged immediately at the time of sacrifice. The serum supernatant was collected and stored as platelet-rich plasma (PRP) in −70 °C for ELISA analysis.
Isolation of peripheral blood mononuclear cells (PBMCs) and flow cytometric analysis
Approximately 2 mL of blood was collected and suspended in 2 mL of heparin sodium. Mononuclear cells (MNCs) were separated on Ficoll-Paque density gradient (1.077 g/mL) and washed in PBS. Then, the isolated PBMCs were incubated with an antibody against mouse F4/80 for 30 min on ice and then washed with PBS. A total of 105 events per sample were collected using a FACSC flow cytometer (BD bioseience) and the percentage of F4/80+ cells was determined.
ELISA analysis
Tumor necrosis factor alpha (TNF-a), a well-recognized mediator of the inflammatory reaction, primarily synthesized and released by macrophages in response to inflammation and tissue damage. The level of TNF-a in blood sample was detected using ELISA kits, according to manufacturer’s procedures.
Histological and immunohistochemical assessment
After fixed with 10% formalin, the specimens were decalcified within 10% EDTA. Then the tissues were embedded in paraffin and cut into 4 um sections in sagittal plane. Sections were sampled from each group at different time points and stained with hematoxylin and eosin. Then, four visual fields were randomly selected from each at 100 magnification, to assess the presence of ON and the accumulation of inflammatory cells, by a blinded examiner.
For immunohistochemistry, sections from each group were deparaffinized and treated with 3% hydrogen peroxide to inhibit endogenous peroxidases activity. After blocking non-specific binding with 5% normal goat serum (Sigma-Aldrich), the slides were incubated with primary antibodies: TNF-a (bs-2150R; 1:100; Bioss) F4/80 (ab60343; 1:50; abcam); CD11 (ab33483; 1:100; abcam); CD206 (ab64693; 1:1000; abcam), overnight at 41 °C. After washing, sections were incubated with peroxidase-labeled goat anti-mouse or anti-rabbit secondary antibodies (1:200; KPL) for 30 min at room temperature. Peroxidase activity was detected with diaminobenzidine (DAB) for 4 min, and sections were counterstained with hematoxylin-eosin for 10 min. The level of positive protein was estimated as the percentage of the total counterstained area, which was analyzed and determined using a computer-assisted image analysis system HPIAS-1000.
Double staining immunohistochemistry
The paraffin-embedded sections from each group were randomly selected for identifying M1 and M2 macrophages. Sections were analyzed for the specific marker of M1 phenotype (CD 11) and the marker of M2 phenotype (CD206), along with the specific marker (F4/80) of macrophage. Briefly, after deparaffinizing, rehydrating, and washing, the sections were treated with 3% hydrogen peroxide in PBS for 10 min at room temperature to block endogenous peroxidase activity. For immunofluorescence double staining, the sections were incubated for 60 min with an antibody directed against TNF-a (bs-2150R; 1:100; Bioss) F4/80 (ab60343; 1:50; abcam); CD11 (ab33483; 1:100; abcam); CD206 (ab64693; 1:1000; abcam). The secondary antibodies were goat anti-mouse fluorescein-conjugated antibody (1:200, DAKO), or goat anti-rabbit fluorescein-conjugated antibody (1:200, DAKO), applied for 1 h at room temperature.
All images were obtained using a fluorescence microscope (Olympus). Quantitative analysis of CD11c+ macrophages (M1) CD206+ macrophages (M2) for each group was conducted by selecting nine random visuals per slide at 200× magnification. The number of M1 and M2 phenotype macrophages was counted on the basis of positive staining cells. The percentage of each phenotype was calculated based on six independent replicates of each group, counted as the percentages of total DAPI-positive cells.
Quantitative real-time PCR analysis
Quantitative real-time PCR (qRT-PCR) analysis was carried out following the protocol as our previous study. 18 Briefly, total RNA was extracted using Trizol (Invitrogen, Carisbad, CA, USA) from the tissue homogenates, according to the manufacturer’s protocol. Then the quantity of RNA was assessed using a spectrophotometrical method. The RNA samples were reverse-transcribed to cDNA using ThermoScript™ reverse transcription reagents (Roche Applied Science), followed by qRT-PCR assays using QuantiFast SYBR Green PCR Kit (QIAGEN, German) and analyzed with ABI 7500 real-time PCR system (Applied Biosystems, Foster City, CA, USA). To amplify specific gene products, the following primers were used: 5’-3’ CATCTTCTCAAAATTCGAGTGACAA, 3’-5’ TGGGAGTAGACAAGGTACAAC –CC. PCR amplification was performed using a profile with 40 cycles at 94°C for 1 min (denaturation), 60°C for 30 s (annealing), 72°C for 45 s (elongation), finally followed 72°C for 5 min (extension). 18S ribosomal RNA was chosen as an internal control to standardize the variability. The product was quantified using a standard curve, and the relative mRNA expression was calculated with comparative CT method.
Statistical analysis
All experimental data were expressed as mean ± standard error of the mean (SEM). Data were obtained from three independent experiments, each in triplicate. Statistical analyses were performed using Prism v. 5.0 (GraphPad Software, Inc.), and significance were determined by ANOVA or t‑test, and P <0.05 was considered a statistically significant result.
Results
No mice died during the experimental period (6 weeks). Positive diagnosis of osteonecrosis was performed as previously described, at least one osteonecrotic lesion out of eight examined areas was considered as ON. Histologically, featured empty lacunae appeared in the necrotic bone trabeculae, accompanied with an accumulation of bone marrow cell debris, with the entry of fibrous tissue in the medullary space. Appositional new bone formation also presented around the necrotic bone during the reparative stages (late stage). In addition, during the progression of ON, extensive hemorrhage associated with massive chronic inflammatory cells infiltrated into the necrotic zone, represented by the accumulated lymphocytes and plasma cells. The incidence of ON in the experiment group was 79.1% (19/24), and the five animal without ON were excluded in the following assessment.
The expression of TNF-a in serum
TNF-a, mainly released by macrophages, acts as a potent inflammatory cytokine to regulate inflammatory reaction. According to Figure 1, the blood concentration of TNF-a was significantly increased at week 1. The marked increase in TNF-a level was detected at week 2, which indicated the expression of pro-inflammatory cytokines and the intensified inflammation. The expression of TNF-a then gradually decreased 3 weeks later.

The concentration of TNF-a in serum was detected by ELISA. Results were shown as mean ± SEM. *P <0.05,**P <0.01 vs. control group.
The expression of TNF-a in the necrotic bone tissue
TNF-α is critical for host defense against a wide variety of pathogenic microbes. However, over-expression of TNF-α may contribute to the development of the pathogenesis of osteonecrosis. Thus, we evaluated the protein accumulation of TNF-a during the progression of ON. Figure 2 showed the time course of changes in TNF-a during the pathogenesis of steroid-induced osteonecrosis. The protein of TNF-a expressed at low level in control group (Figure 2a). In ON group, the expression of TNF-a reached the peak value at week 1 (Figure 2b), and which kept at a high level at week 2 (Figure 2c), then weakened at week 4 and week 6 (Figure 2d, e). MPS intervention significantly increased the expression of TNF-a (Figure 2f). These findings suggested that accumulation of TNF-a might be associated with the development of steroid-induced osteonecrosis.

Immunohistochemical and quantitative analyses of the expression of TNF-a. (a–e) Histopathological appearance of the necrotic bone after TNF-a immunohistochemical staining 1 week, 2 weeks, 4 weeks, and 6 weeks after the last treatment. (f) Quantitative analysis of TNF-a expression in the necrotic area was expressed as the percentage of the total counterstained tissue area stained for TNF-a. Data showed the mean ± SEM. *P <0.05 vs. control group.
Expression of F4/80, CD11, and CD206 in the necrotic bone tissue after treatment
The protein expressions of F4/80, CD11, and CD206 were tested using the immunohistochemical method (Figure 3a). The proteins were observed in osteoblasts and bone marrow cells and were significantly increased after MPS intervention. The marked increase in F4/80 level indicated that macrophages in the necrotic zone had become activated (Figure 3b). CD11 expression was observed to be significantly increased at week 1 after treatment, and then kept a high status of expression during the 6 weeks (Figure 3c). The expression of CD 206 increased significantly by week 1, and the expression intensity gradually increased at weeks 2, 4, and 6 (Figure 3d). The marked increase in CD206 levels indicated that the alternative polarization of macrophages (M2) had become activated.

Protein expression of F4/80, CD11, and CD206 detected by immunohistochemical staining. (a) Immunohistochemical staining for the expression of F4/80, CD11, and CD206 at weeks 1, 2, 4, and 6 after the last treatment. Quantitative analyses the protein expression demonstrated as the percentage of the total counterstained tissue area for F4/80 (b), CD11 (c), and CD206 (d). IgG controls were shown for each group. Photographs were taken at 200×. Data show the mean ± SEM. *P <0.05 vs. control group.
The dynamic change of F4/80+ macrophages in PBMCs
The percentage of F4/80+ cells in peripheral blood was analyzed by FACS. The expression of F4/80 was detected 1 week after MPS induction. The relative percentage of F4/80+ macrophages in PMNCs was increased gradually after MPS treatment, which reached the peak value at week 6 (Figure 4).
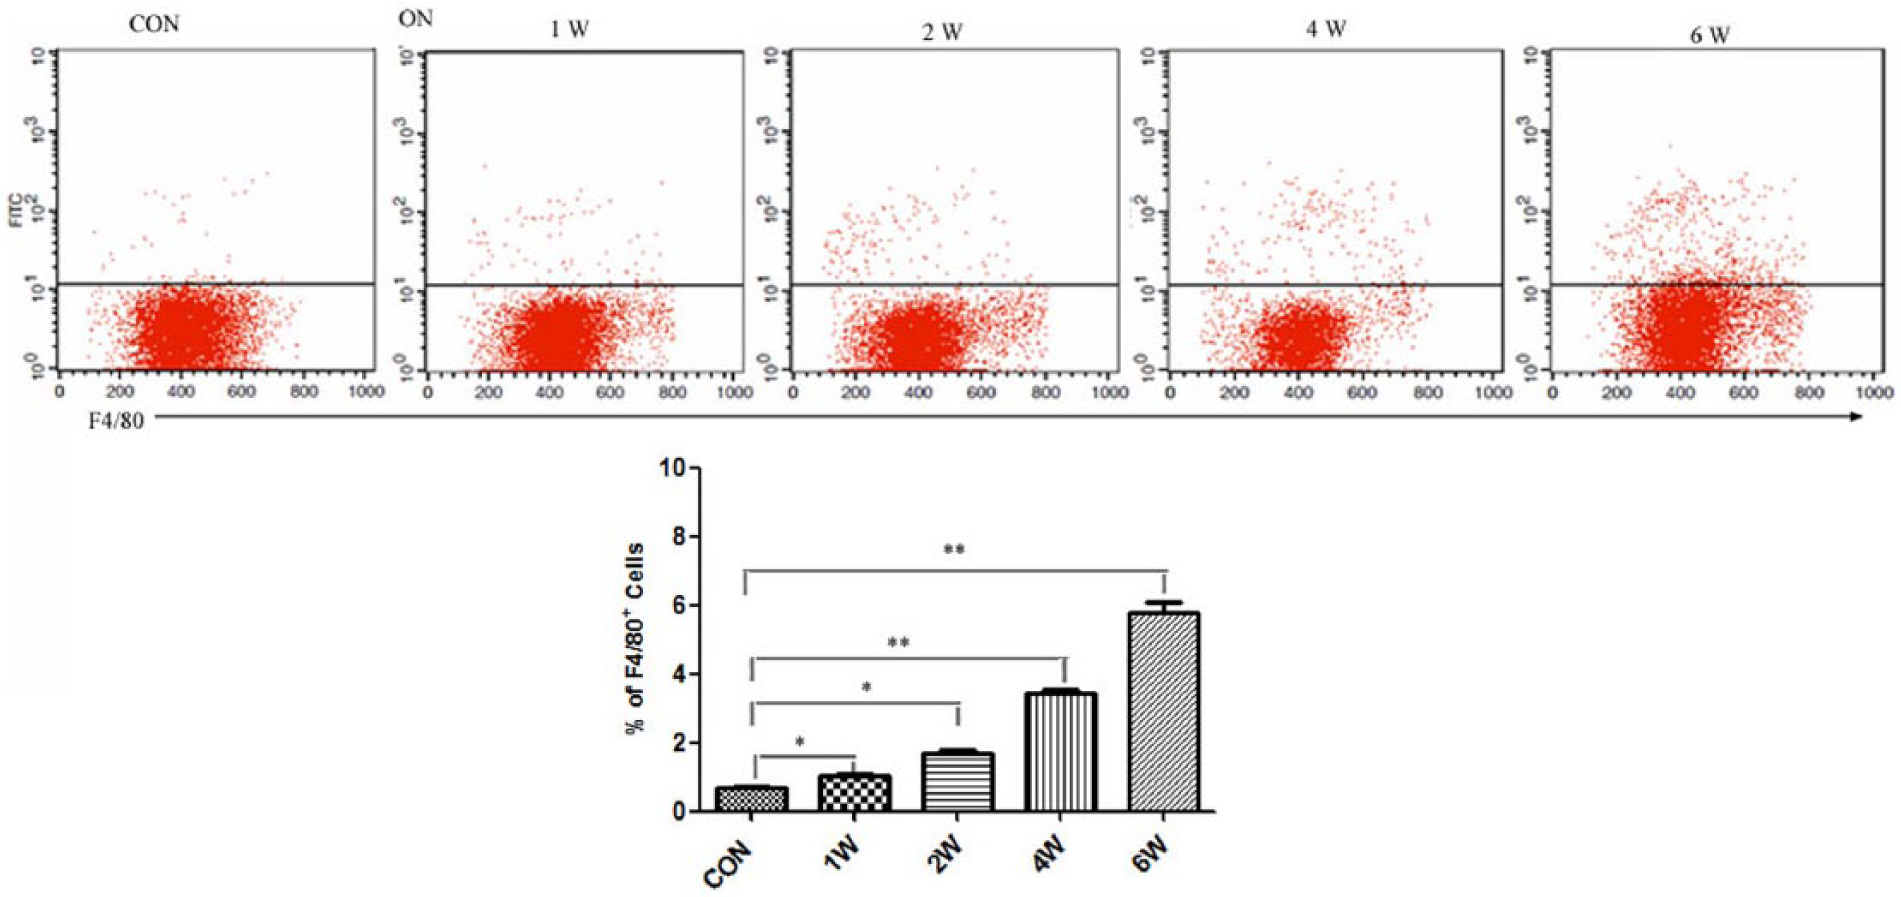
The dynamic change of F4/80+ cells in PBMCs during the development of ON. Representative flow cytometry dot plots showing the presence of surface F4/80+ macrophages was significantly increased during the development of ON. Data were representative of three experiments. *P <0.05; **P <0.001.
Classically activated macrophages (M1) in steroid-induced osteonecrosis
After identifying the presence of F4/80+ macrophages in the necrotic bone tissue, we sought to determine which kind of macrophage predominantly presented, M1 or M2 type. TNF-a +/ CD11+ cells considered as M1 macrophages were identified by double staining immunohistochemistry. As shown in Figure 5a, CD11+ macrophages (M1) were dramatically increased in bone marrow cavity and trabecular bone in the necrotic bone tissue, as compared to those from control mice without ON. These cells were positive of TNF-a, and the elevated TNF-a expression was also confirmed by qRT-PCR using synovial tissue lysates obtained from ON group (Figure 5b). In the control group, the results demonstrated occasional M1 macrophages in the bone marrow cavity but no macrophages in the trabecular bone; while, a remarkable infiltration of CD11+ macrophages (M1) was noticed in the necrotic bone tissue. One week following MPS intervention, M1 macrophages remarkable accumulated in the necrotic area, then attenuated at week 2, but remained present throughout the whole experiment time (Figure 5c, d). It indicated that a large number of CD11+ macrophages (M1) presented in the necrotic area in the early stage of ON; as time went by, the disease of ON deteriorated, the relative amount of CD11+ macrophages (M1) was found a significant decrease in the necrotic area in the later stage of ON. Thus, M1 macrophages are critical in the pathogenesis of ON, whereas suppressing the activation and polarization of M1 macrophages may be beneficial to reverse the process of ON.

Inflammatory infiltrations in mice with ON comprised CD11+ macrophages. (a) Immunofluorescence studies showed an increased infiltration of TNF-a+/ CD11+ M1 macrophages at 1, 2, 4, and 6 weeks after the last administration of MPS in the ON group and the CON group. (b) TNF-a levels in the synovial tissue were examined by qRT-PCR (n = 8 for each group). (c) Quantification of total TNF-a+/ CD11+ macrophages (M1) in six randomly selected high-power fields (HPFs). (d) Quantification of the percentage of TNF-a+/ CD11+ macrophages (M1) in necrotic bone tissue. Data were mean ± SEM. *P <0.05; **P <0.01.
Alternatively activated macrophages (M2) in steroid-induced osteonecrosis
To investigate the infiltration and phenotypic change of macrophages, we examined the distribution of M1 and M2 macrophages at the necrotic sites. As Figure 6a shows, the pictures demonstrated the presence of F4/80+CD206+ (M2) macrophages in the control group. In the ON group, the results indicated CD206+ (M2) macrophages co-existed with M1 macrophages through the whole course during the development of steroid-induced osteonecrosis, and which predominantly presented in the late stage. One week following MPS intervention, M2 macrophages slowly accumulated at the necrotic regions and became the predominant macrophage phenotype at week 6 (Figure 6b, c). The development of ON was associated with an increase in the M2/M1 ratio 1 week after the induction of MPS (Figure 6d). According to the results, M1 macrophages were predominantly presented in the early and middle stage of ON, whereas M2 macrophages predominantly presented in the late stage. The increased M2 macrophages could be beneficial for resolving inflammation and promoting tissue repair.

Altered M2 macrophage infiltrations in the bone tissue after the induction of osteonecrosis. (a) Immunofluorescence studies showed an increased infiltration of F4/80+ CD206+ M2 macrophages at 1, 2, 4, and 6 weeks after the last administration of MPS in ON group and the control group. (b) Quantification of total F4/80+/ CD206+ macrophages (M1) in six randomly selected high-power fields (HPFs). (c) Quantification of the percentage of F4/80+/ CD206+ macrophages (M2) in necrotic bone tissue. (d) The ratio of M2/M1 macrophages in different time points. Data were mean ± SEM. *P <0.05; **P <0.01.
Discussion
In the present study, we found an elevated expression of TNF-a in the necrotic bone tissue with a distinct histological feature of macrophage infiltration and polarization. During the early stage (induction phase) of ON, there was high TNF-a activity, accompanied with a larger M1 cell population in the necrotic lesions, leading to the disease progression of osteonecrosis. Thereafter, TNF-a activity was decreased gradually, and a larger M2 cell population presented in the late stage of ON, in the need for new tissue formation and reparation. Additionally, we observed a correlation between TNF-a expression and the change in M1/M2 ratio in local necrotic lesions. Therefore, we deduced that TNF-a-mediated alteration of M1/M2 macrophage polarization contributed to the pathogenesis of steroid-induced osteonecrosis, with a dominant role M1 macrophages in early stage and M2 macrophages in the late stage of ON. The activation and regulation of macrophages will be the new regulatory target for the treatment of osteonecrosis.
In recent years, there is a growing attention to the polarized macrophages, aimed to alter disease outcomes. Macrophage can be activated into two main types: classically activated macrophages (M1) and alternatively activated macrophages (M2). M1 macrophages promote the process of inflammation; in contrast, M2 macrophages suppress inflammatory response and promote enhanced damage repair. If M2 macrophages (alternatively activation) possess mainly anti-inflammatory properties, the switch in macrophage phenotype from M1 to M2 may be partially responsible for the suppression of inflammatory gene expression, leading to tissue repair and regeneration. Therefore, the balance of M1/M2 macrophage activity is suggested to play a significant role in human physiology and pathology. And the understanding of the molecular mechanisms controlling the dysregulated macrophage might further the pathophysical process of diseases and provide new strategies for more targeted therapies.
M1 macrophages secrete high levels of pro-inflammatory cytokines (e.g. TNF-α, IL-6, IL-1β), and generate reactive nitrogen and oxygen intermediates.19,20 Conversely, M2 macrophages secrete anti-inflammatory cytokines (e.g. IL-10, TGF-β, IL-4), which play an essential role in the resolution of inflammation response. Previous studies have shown that inflammatory cytokines are increased during the development of steroid-induced osteonecrosis, such as IL-1, IL-2, IL-4, IL-6, IL-10, GM-CSF, IFN-γ, and TNF-α. 21 TNF-a, a kind of potent osteoclastogenic factor, which could promote osteoclastogenesis while simultaneously inhibiting osteoblastogenesis, 22 exists widely in the area of inflammatory bone erosion. Under pro-inflammatory conditions, the cytokines orchestrate the overlapping signaling pathways to enhance osteoclastogenesis. 23 The balance between osteoclasts and osteoblasts determine the rate of bone remodeling, which could be disturbed by several molecular pathways. Considerable studies have been made to explore the effect of cytokines on osteoblasts and osteoclasts and their ultimate effect on bone resorption and formation. Pro-inflammatory cytokines, such as TNF-a, directly stimulate osteoclasts differentiation and activation; meanwhile, TNF-a acts on osteoblasts or bone marrow cells to synthesize and release cytokines to promote osteoclasts proliferation and maturation in an un-directly way.24,25 Therefore, it is possible that steroid abuse induces inflammation and stimulates the production of TNF-α.
TNF-a is mainly secreted by macrophages during the process of osteonecrosis. M1-polarized macrophages secrete higher levels of pro-inflammatory genes and possibly contribute to steroid-induced inflammation and osteonecrosis. Actually, classically activated M1 macrophages, driven by TNF-a secreted is thought to be the primary trigger for the recruitment.26,27 Besides, MCP-1, IL-6, and adiponectin play important roles through other pathways than the paracrine loop.28,29 The increase in the expression of MCP-1 will lead an influx of monocytes and macrophages. 30 Additionally, previous studies have demonstrated that the polymorphism TNF-α gene may be attributed to the occurrence osteonecrosis in direct or indirect ways in SARS patients. 31 TNF-α can regulate the absorption activity of osteoclasts and the release of oxygen free radicals and lipid peroxidation, destroy bone and cartilage, which eventually result in ischemic necrosis of the femoral head. 32 Therefore, TNF-α has dual roles in both innate immunity and inflammatory pathology, and the gene regulation is challenging. Apparently, targeting TNF-α may be beneficial to inhibit the progression of osteonecrosis.
During the development of ON, M1, and M2-polarized macrophages dynamically coexisted under the complicated and changed cytokine environment, and the dynamic balance of the cells determine the development and progression of the disease. M1 macrophages expressed high levels of CD11c on the cell surface, and M2 macrophages expressed high levels. After identifying the presence of F4/80+ macrophages in the necrotic bone tissue, we sought to determine which kind of macrophage predominantly presented, M1 or M2. TNF-a/ CD11+ cells were considered as M1 macrophages, while F4/80+CD206+ cells considered as M2 macrophages. As shown in Figures 5 and 6, CD11+ macrophages (M1) were present to a large degree in the necrotic area, with similar amounts of CD206+ macrophages, in the early stage of ON. As time went by, the disease of ON deteriorated, the relative amount of CD11+ macrophages (M1) was found a significant decrease in the necrotic area in the late stage of ON; in contrast, the amount of CD206+ macrophages (M2) increased significantly in the necrotic bone tissue. Therefore, it could be used to explain why the regenerative repair reaction in the necrotic region of the femoral head appeared in the late stages of osteonecrosis. Therefore, if the polarization of M1/M2 macrophages is switched to M1 type (classically activation), inflammatory response will be strengthened, resulting the promoted development of osteonecrosis; if the polarization is switched to M2 type (alternative activation), macrophages will play an extremely important role in inhibiting bone necrosis and promoting tissue repair. In a word, changes in cell polarity of macrophages will influence the pathological development of osteonecrosis.
In conclusion, macrophages are reversible in the specific micro-environment and closely associated with the development of steroid-induced osteonecrosis. In the early stage of ON, increased pro-inflammatory signals promote the recruitment of M1-polarized macrophages, which could eventually overwhelm the protective effect of M2 macrophages, leading to a dominant role for M1-polarized macrophages. TNF-a plays a very important role in the development of osteonecrosis, which activates macrophages to M1 phenotype, thereby contributing the progress of the progression of osteonecrosis. In the late stage, phenotypic switch of macrophage polarization from M1 to M2, which contributes to the pathogenesis of ON in the late stage, resolving inflammation and promoting tissue repair. The results could help to explain the pathogenic mechanism of steroid-induced osteonecrosis, and deserves further studies. And these findings may lead to the development of novel therapies for the treatment of osteonecrosis targeting macrophages. Through the further study the molecular mechanism for activation and regulation of macrophages, the pathogenic mechanism of steroid-induced osteonecrosis will be explored, and new pathways for clinical treatment and drug screening will be opened. Further in-depth studies are needed to delineate the underlying potential mechanisms of TNF-a-mediated activation of STAT-1/STAT-6 balance and how they contribute to M1 and M2 switching in the pathophysiologic process of steroid-induced osteonecrosis.
Footnotes
Declaration of conflict interests
The author(s) declared no potential conflicts of interest with respect to the research, authorship, and/or publication of this article.
Funding
This study was supported by grants from the financial support of the National Science Foundation of China (NSFC, 81201393; 2013YGYL015).