
Abstract
The aim was to study laminin (LM) synthesis, integration, and deposition into the basement membrane (BM) during adipogenesis. Human bone marrow-derived mesenchymal stromal cells (MSCs) were induced along the adipogenic lineage. LM chain mRNA and protein levels were followed using quantitative real-time polymerase chain reaction (qRT-PCR), immunofluorescence (IF) staining, transmission electron microscopy (TEM), and immunoprecipitation. MSCs produced low levels of LM mRNAs but were not surrounded by BM in IF and TEM imaging. LM-α4, LM-β1, and LM-γ1 mRNAs increased during adipogenesis 3.9-, 5.8-, and 2.8-fold by day 28. LM-411 was immunoprecipitated from the ECM of the differentiated cells. Immunostaining suggested deposition of LM-411 and some LM-421. BM build-up was probably organized in part by integrin (Int) α6β1. At day 28, TEM images revealed BM-like structures around fat droplet-containing cells. The first signs of BM formation and Int α6β1 were seen using IF imaging at day 14. Laminin-411 and Int α6β1 were expressed in vivo in mature human subcutaneous fat tissue. Undifferentiated human MSCs did not organize LM subunits into BM, whereas LM-411 and some LM-421 are precipitated in the BM around adipocytes. This is the first demonstration of LM-411 precipitation during hMSC adipogenesis around adipocytes as a structural scaffold and Int-regulated signaling element.
Introduction
The adipocyte is involved in a range of diseases, including obesity, metabolic syndrome, diabetes, and chronic inflammation (Gesta et al. 2007; Trayhurn 2007). This emphasizes the importance of adipocyte (patho)biology. The adipocyte belongs to the mesenchymal cell lineage and is formed from mesenchymal stromal (stem) cells (hMSCs) (Tang and Lane 2012). However, the exact differentiating cues in the human body are not known. Upon appropriate stimulation with a combination of soluble factors, cultured hMSCs can be induced to become adipocytes (Pittenger et al. 1999). Apart from soluble factors, adipocytes, as mesenchymal cells, are particularly dependent on cell-extracellular matrix (ECM) signaling (Konttinen et al. 2011). The ECM of adipocytes consists of an adipocyte-specific basement membrane (BM) in contact with adipocyte matrix receptors, in particular, integrins. The adipocyte BM forms a physicochemical supporting framework (scaffold) to which adipocytes adhere, and it also exerts effects on them via its physicochemical properties; adipocytes are relatively supple cells, and the soft culture substrates and matrix function to promote adipogenesis (McBeath et al. 2004). Therefore, direct cell-matrix contacts and the low elastic modulus of the BM scaffold may play substantial roles during the formation of fat cells in adipogenesis. It is interesting that, in vivo, MSCs are not surrounded by BM, which appears only during the adipogenic differentiation process.
In earlier work, we described the development of a type IV collagen α-chain network around developing adipocytes. Entactin (nidogen), which binds the type IV collagen network to the laminin (LM) network, was shown to be organized within BM-like structures during adipogenesis (Sillat et al. 2012). Others had already shown that the adipocyte BM also contains LM. This was done using either LM antibodies, which stain epitopes shared by most LM isoforms (Kubo et al. 2000), or antibodies that bind only to single LM chains (Petäjäniemi et al. 2002), without any further specification of the exact trimeric α-, β-, and γ-chain LM structure of the adipocyte BM. We therefore systematically analyzed for the first time the LM composition of the BM formed during MSC differentiation into adipocytes, using LM chain-specific primers and antibodies and the known combinatorial rules as a reference for heterotrimeric formation. Transcription of LM chain genes and protein synthesis were used to assess the secretion of LM trimers to the extracellular space, which is followed by their deposition into the adipocyte BM. This is hardly a passive precipitation reaction but is most likely actively and tightly spatially regulated by the timely appearance of integrin-type LM receptors, which were also studied. These matrix receptors anchor LMs to the adipocyte plasma membrane, forming initiation sites for subsequent precipitation and accumulation of the laminin BM scaffold (Sasaki et al. 2004).
Materials & Methods
Tissue Samples
Specimens of normal human subcutaneous fat were obtained from surgical operations. Permission was obtained from the local ethical committee.
Isolation and Cultures of Human MSCs
MSCs were obtained from bone marrow aspirates taken from the iliac crests of adult donors after informed consent. The study plan was accepted by the Ethical Committee of the Helsinki and Uusimaa Hospital district. Mononuclear cells were isolated with a density gradient (Ficoll-Paque; GE Healthcare Biosciences, Uppsala, Sweden) and plated at 4 × 10⁵/cm2 on a cell culture dish in DMEM-LG containing 10% fetal calf serum (FCS; Promocell, Heidelberg, Germany) tested to support the growth of MSCs, L-glutamine, and antibiotics. After 72 hr, the non-adherent cells were discarded and the plates were thoroughly washed with phosphate-buffered saline (PBS). The medium was changed twice a week until a confluency of 80% was achieved, whereupon the cells were harvested by incubation in PBS containing trypsin and EDTA for 5 min and thereafter replated at 1000 cells/cm2 (passage 1). Also, human bone marrow-derived MSCs (Poietics; Lonza Walkersville Inc., Walkersville, MD) from two donors were used for quantitative real time-polymerase chain reaction (qRT-PCR) experiments.
Adipogenic Differentiation
For adipogenic differentiation, MSCs were plated in the medium described above and expanded until confluency. The cultures were maintained at total confluency for an additional 3 to 5 days until the medium was changed to adipogenic induction medium consisting of DMEM-LG containing 10% FCS, 10 μg/ml insulin, 1 μM dexamethasone, 0.5 mM isobutylmethylxanthine, and 60 μM indomethacin (Pittenger et al. 1999). The cells were incubated in induction medium for 48 to 72 hr, after which it was changed to the maintenance medium consisting of DMEM-LG containing 10% FCS and 10 μg/ml insulin for 24 hr. This induction and maintenance cycle was repeated up to eight times.
Staining with Oil Red O
The cells on coverslips were washed twice with PBS, fixed in 5% formalin for 10 min at room temperature, washed twice with PBS, and incubated for 5 min in distilled water. Then, cells were incubated in Oil Red O solution (prepared by mixing three parts 1 mg/ml stock solution in isopropanol with two parts water, followed by filtering) for 10 min at room temperature. Stained cells were washed in distilled water and examined using an Olympus Provis AX70 microscope (Tokyo, Japan) coupled with a 12-bit digital image camera (Sensicam; PCO Imaging, Kelheim, Germany).
Quantitative Real Time-Polymerase Chain Reaction
Total RNA was isolated from the cells of three different patients at days 0, 1, 3, 7, 14, and 28 of adipogenic differentiation using TRIzol reagent (Invitrogen; Paisley, UK) and mRNA using magnetic Oligo(dT)25 polystyrene beads (Dynal; Oslo, Norway). Messenger RNA concentrations were measured spectrophotometrically, and complementary DNA (cDNA) was synthesized from 50 ng mRNA using oligo(dT)12-18 primers and SuperScript enzyme, followed by RNase H treatment (SuperScript Preamplification System; Invitrogen). Quantitative RT-PCR was run in a LightCycler PCR machine using LightCycler FastStart DNA Master SYBR Green I kit (Roche; Mannheim, Germany), twice with each sample. Primers were designed with Primer3 (S. Rozen and H.J. Skaletsky, 1998; code available at http://primer3.sourceforge.net/) from sequences searched for using the NCBI Entrez search system. Sequence similarity search was done using the NCBI BLASTn program. Primer sequences used were as follows:
LAMA1, GCTCTGTGACTGCAAACCAA, TTTCTGGGTCGCAGGTATTC, 275 bp; LAMA2, TTGTGTCGCAGAAGGACTTG, GCCAAGTCA CCGAGAAGAAG, 312 bp; LAMA3, CATTTCTAC GCCTGCTTTCC, CTATCGCTGGTGCTCAATT, 312 bp; LAMA4, TGAAGCCAATGAAACAGCAG, TGCTTAACGGCATCACTGAG, 249 bp; LAMA5, GGACACAGACGAGACAAGCA,GTTGAACTT CATGGGCACCT, 361 bp; LAMB1, TCCTCTGGGAACAATTCCTG, TTCCACTTCGTTGCACTGAC, 250 bp; LAMB2, CCATCGCATCCAGAATGTAG, TCAGTGGAT GGCTCAATCTC, 327 bp; LAMB3, GGGATTCCAGCA ACTCAAAG, TGTTGTAGAAGGGTGCACAG, 301 bp;LAMC1, TTTGCTGTAGGTGGCAGATG, AAGTAGCAT TCCTGGGATCG, 221 bp; LAMC2, TTCTGCTATG GGCATTCAGC, TCAAAGGACAGGCTTTGACC, 254 bp;COL4A1, TGGTGACAAAGGACAAGCAG, TAAGCCGT CAACACCTTTGG, 268 bp; PPARγ (peroxisome proliferator-activated receptor γ), GTGAAGGATGCAAG GGTTTC, TCAGCGGGAAGGACTTTATG, 303 bp; LPL (lipoprotein lipase), CCGGTTTATCAACTGGATGG, AATCACGCGGATAGCTTCTC, 349 bp; NID1 (nidogen 1), CAGGCAATGTGTTGCAGAAG, TTCTT GAATCCGTCCTGCTC, 255 bp; FN1 (fibronectin 1), TCCACAAGCGTCATGAAGAG, AATG TGAGATGGCTGTGGTG, 323 bp; β-actin, TCACCCACACTGTGCCCATCTACGA, CAGCG GAACCGCTCATTGCCAATGG, 295 bp.
For the qRT-PCR standard curve, the gene of interest was amplified using PCR, extracted from an agarose gel, and cloned into the pCRII-TOPO vector (Invitrogen). After identification of the plasmid by restriction enzyme analysis and sequencing, the concentrations were determined spectrophotometrically and serial dilutions were prepared for qRT-PCR analysis. For LAMA3, LAMB3, and FN1, only relative expression was studied without the use of a standard curve. The copy numbers of mRNA were determined in duplicates and normalized against β-actin gene.
Indirect Immunofluorescence Microscopy
For immunofluorescence microscopy, the cells were cultured on glass coverslips and fixed for 10 min in methanol, pre-cooled to −20C. The following monoclonal antibodies were applied for 30 min: monoclonal antibody (MAb) TS2/7 was used to detect (Int = Integrin) α1 subunit (Hemler et al. 1984), MAb 10G11 against Int α2 subunit (Chemicon, Temecula, CA), MAb J143 against Int α3 subunit (Fradet et al. 1984), MAb GOH3 against Int α6 subunit (Chemicon), MAb 9.1 against Int α7 subunit (Vizirianakis et al. 2001), MAb 102DF5 against Int β1 subunit (Ylänne and Virtanen 1989), and AA3 against Int β4 subunit (Tamura et al. 1990). MAb 161EB7 was used to visualize LM-α1 chain (Virtanen et al. 2000), MAb 5H2 LM-α2 chain (Leivo and Engvall 1988), MAb BM2 LM-α3 chain (Rousselle et al. 1991), MAb 168FC10 LM-α4 chain9 (Petäjäniemi et al. 2002), MAb 4C7 against LM-α5 chain (Engvall et al. 1986), MAb 114DG10 against LM-β1 chain (Virtanen et al. 1997), MAb S5F11 LM-β2 chain (Wewer et al. 1997), MAb 6F12 LM-β3 chain (Santa Cruz Biotechnology Inc.; Santa Cruz, CA), MAb 113BC7 LM-γ1 chain (Määttä et al. 2001), MAb D4B5 LM-γ2 chain (Mizushima et al. 1998), MAb M3F7 collagen type IV chain (Follmer et al. 1983), MAb A9 nidogen (Katz et al. 1991), and MAb 52DH1 fibronectin (Vartio et al. 1987). Secondary fluorescein isothiocyanate (FITC; Alexa 488)-coupled goat anti-mouse IgG or Alexa 594-coupled goat anti-rat IgG, as appropriate, were used for 30 min (Jackson Immunoresearch; West Grove, PA). After washes, the specimens were embedded in glycerol-veronal buffer (1:1).
For immunofluorescence of tissue samples, 6-μm tissue sections were fixed in acetone at −20C for 10 min. The specimens were first exposed to MAb against type IV collagen, LM-α4, nidogen, and Int α6, followed by FITC-coupled goat anti-mouse IgG (Jackson Immunoresearch) for 30 min. After washes, the specimens were embedded in sodium veronal:glycerol buffer (1:1, pH 8.4). All immunofluorescence-stained samples were analyzed with an Olympus Provis AX70 microscope (Tokyo, Japan), equipped with appropriate filters and coupled with a 12-bit digital image camera (Sensicam; PCO Imaging).
Immunoprecipitation and SDS-PAGE of LM Chains from the Culture Medium
Differentiated MSCs were labeled overnight with [35S] methionine (GE Healthcare; 50 μCi/ml).
For matrix immunoprecipitations, [35S] methionine labeled matrix was scraped off with a rubber policeman and solubilized in ice-cold RIPA buffer (10 mM Tris-HCl, pH 7.2; 150 mM NaCl, 0.1% SDS, 1.0% Triton X-100, 1.0% deoxycholate, 5 mM EDTA, and 1 mM PMSF).
For immunoprecipitation, the cell culture medium was collected and cleared by centrifugation and the supernatant supplemented with normal mouse serum and 0.5% Triton X-100.
Samples were first mixed with uncoupled GammaBind Plus Sepharose-5 (GE Healthcare), followed by exposure to GammaBind Plus Sepharose prebound with antibodies and incubated at 4C overnight. MAb 3H2 (Wondimu et al. 2004) was used to detect LM-α4 chain and 114DG10 for LM-β1 chain (Virtanen et al. 1997). The proteins were separated with SDS-PAGE by Laemmli’s procedure with reducing 5% to 8% gels using [14]C-methylated molecular weight marker (GE Healthcare). Immunoprecipitated bands from dried gels were detected on Hyperfilm MP (GE Healthcare).
Transmission Electron Microscopy
Cells cultured on coverslips for 28 days were fixed with 2.5% glutaraldehyde (Electron Microscopy Sciences; Hatfield, PA) in 0.1 M cacodylate buffer (pH 7.2) for 30 min, postfixed with 1% osmium tetraoxide for 60 min, dehydrated, and embedded in a thin layer of Epoxy resin. After polymerization, the coverslips were removed and a small square of embedded culture was cut out and embedded perpendicular to the surface in an Epoxy resin column. Toluidine Blue-stained, 0.5-μm-thick semithin sections were used for the selection of relevant areas for 75-nm ultrathin sections, which were post-stained with uranyl acetate and lead citrate and photographed with a JEOL 100S electron microscope.
Statistics
Quantitative RT-PCR results were analyzed using a one-way ANOVA.
Results
Adipogenic Differentiation of MSCs Assayed by Oil Red O Staining
Oil Red O staining of undifferentiated and control MSCs showed a lack of fat droplets, and after eight cycles of induction and maintenance, most of the cells were loaded with lipid droplets (Supplemental Fig. 1).
Analysis of Adipogenic Differentiation and LM Chain Expression by qRT-PCR
Quantitative RT-PCR reaction of human bone marrow-derived stem cells at day 28 during adipogenic differentiation showed 29.5 ± 19.2-fold increase in peroxisome-proliferator activated receptor γ (PPAR-γ), a 24.8 ± 2.8 increase in type IV collagen, and a 7394 ± 4977 increase in lipoprotein lipase (LPL) compared with control cells.
In parallel with the Oil Red O staining and adipogenic biomarker changes during adipogenesis, by day 28, LM-α1 mRNA levels, normalized using β-actin values, increased 0.50-fold, LM-α2 2.60-fold, LM-α3 1.75-fold, LM-α4 3.88-fold, LM-α5 1.25-fold, LM-β1 5.81-fold, LM-β2 1.19-fold, LM-γ1 2.76-fold, and LM-γ2 0.22-fold (Fig. 1). For comparison, the expression of nidogen was increased 4.29-fold, whereas fibronectin expression was decreased 0.21-fold. Overall, a statistical difference (p<0.05) was found only for increases in LM-α4, LM-β1, and LM-γ1 chain expression levels. When the absolute mRNA copy numbers were compared, we found that, at the initiation of the adipogenesis (in MSCs), the four most highly expressed LM chains were LM-α4, LM-β1, LM-β2, and LM-γ1. The expression of LM-β1, LM-α4, and LM-γ1 increased the most and achieved also the highest absolute values, whereas LM-β2 was expressed at slightly lower levels and relatively steadily (reaching the peak value of 1.5-fold increase by day 14) (Fig. 1).
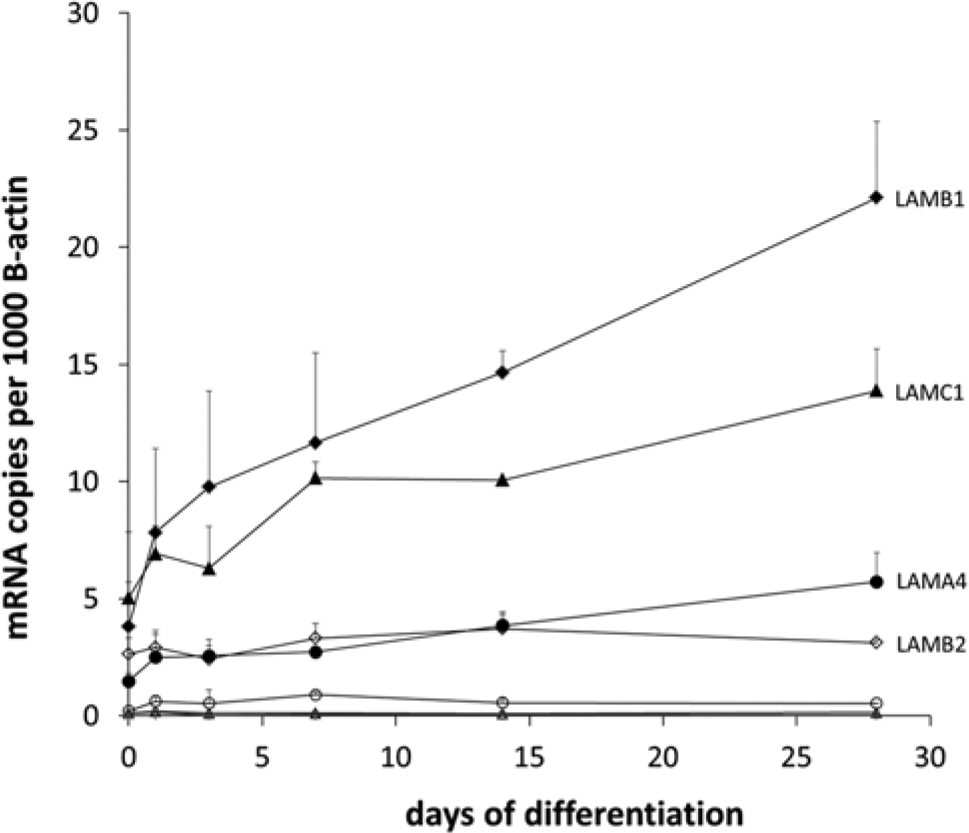
Quantitative real time-polymerase chain reaction of human bone marrow-derived stem cells during adipogenic differentiation. Messenger RNA copy numbers were normalized to 1000 β-actin mRNA copies coding for LM-α1 (plus), LM-α2 (empty circle), LM-α4 (black circle), LM-α5 (empty triangle), LM-β1 (black diamond), LM-β2 (empty diamond), LM-γ1 (black triangle), and LM-γ2 (x). Data are the mean ± standard error of the mean.
Analysis of LM and Integrin Expression by Immunofluorescence Microscopy in the Differentiating Cells
When the corresponding LM chains were analyzed by indirect immunofluorescence microscopy, a matching sequential appearance was detected. An illustrative example is the immunofluorescence staining for LM-α4 chain over time (Fig. 2). It is interesting that this protein was not detected in undifferentiated MSCs but, during successive induction and maintenance cycles, the immunoreactivity for the LM-α4 chain progressively increased (Fig. 2). Mature day 28 adipocytes displayed intense, cell-surface associated immunoreactivity for LM-α4.
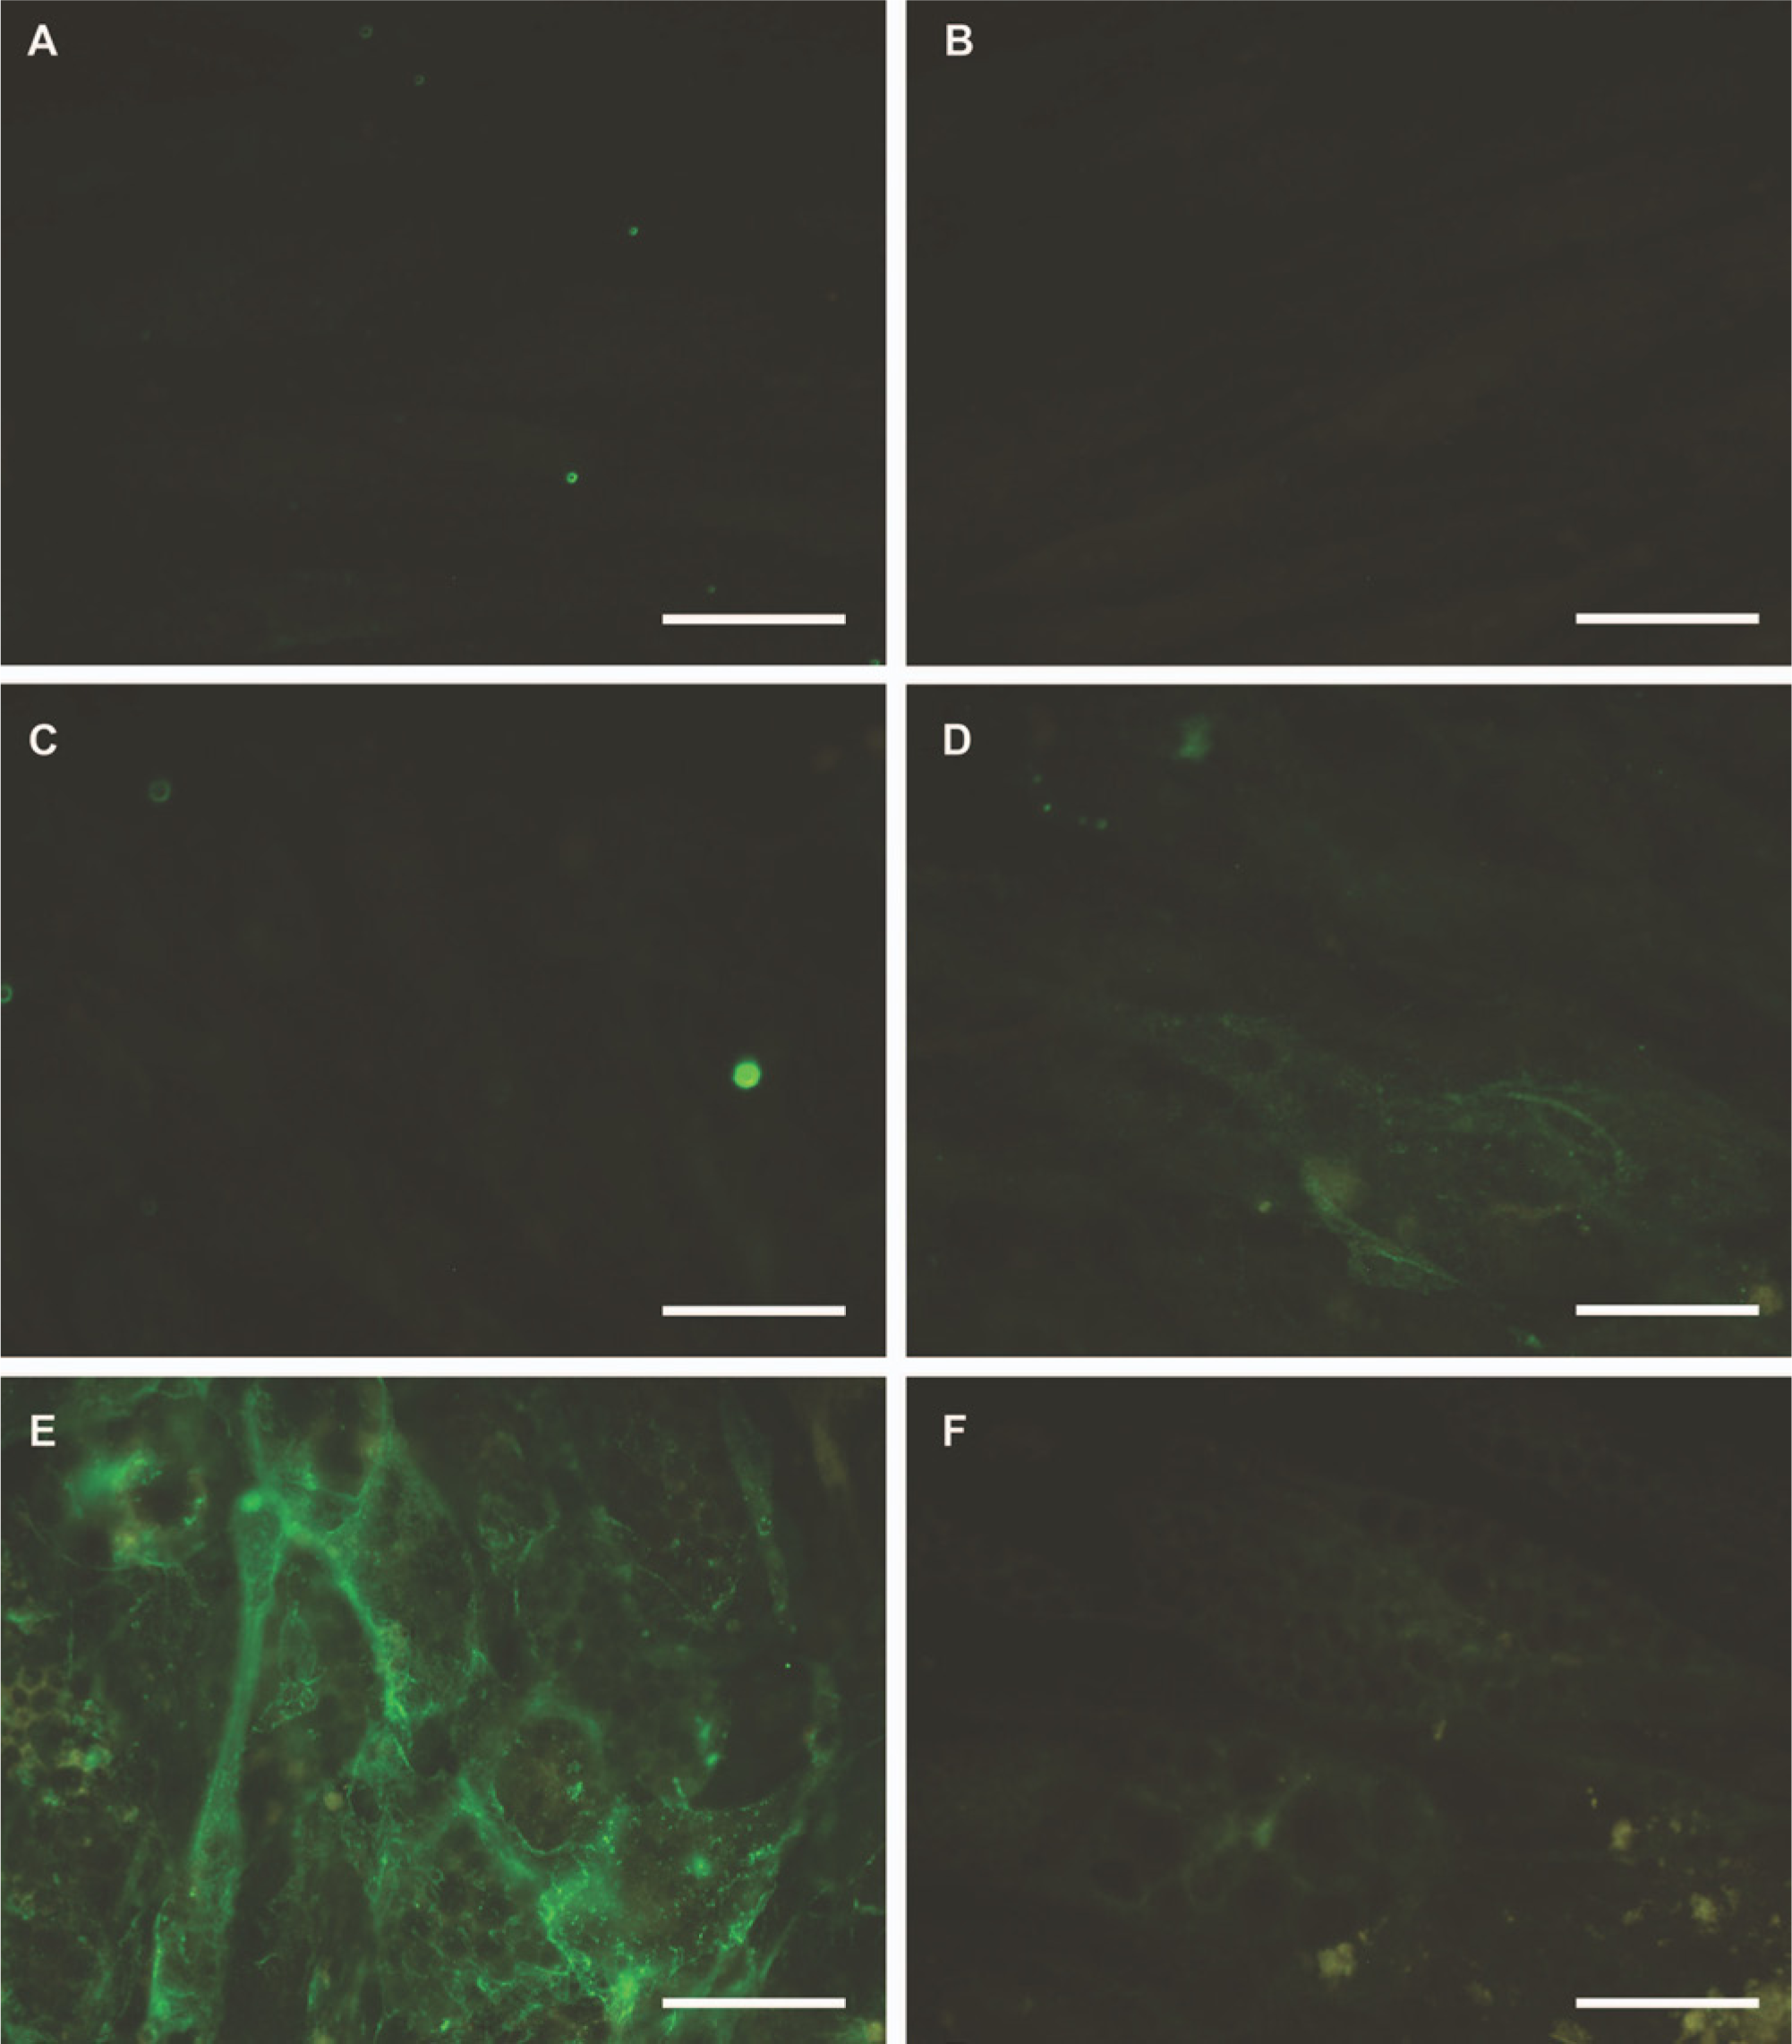
Immunofluorescence staining of LM-α4 at day 0 (A), day 3 (B), day 7 (C), day 14 (D), and day 28 (E) in mesenchymal stem cells undergoing adipogenic differentiation. Negative staining control of day 28 adipocytes is shown in panel F. Bars = 50 μm.
In non-differentiated MSCs, only cytoplasmic immunoreactivity for the LM-β1 and LM-γ1 chains was detected (Figs. 3A and 3C). During successive induction cycles, more extracellular immunoreactive deposits were seen, and day 28 adipocyte cells were enmeshed in rich extracellular matrix containing immunoreactive LM-β1 and -γ1 chains (Figs. 3B and 3D). Antibodies to LM-α1, LM-α2, LM-α3, and LM-α5 did not reveal immunoreactivity, whereas weak staining for LM-β2 was seen surrounding mature adipocytes (data not shown except for LM-β2; Figs. 3E and 3F).
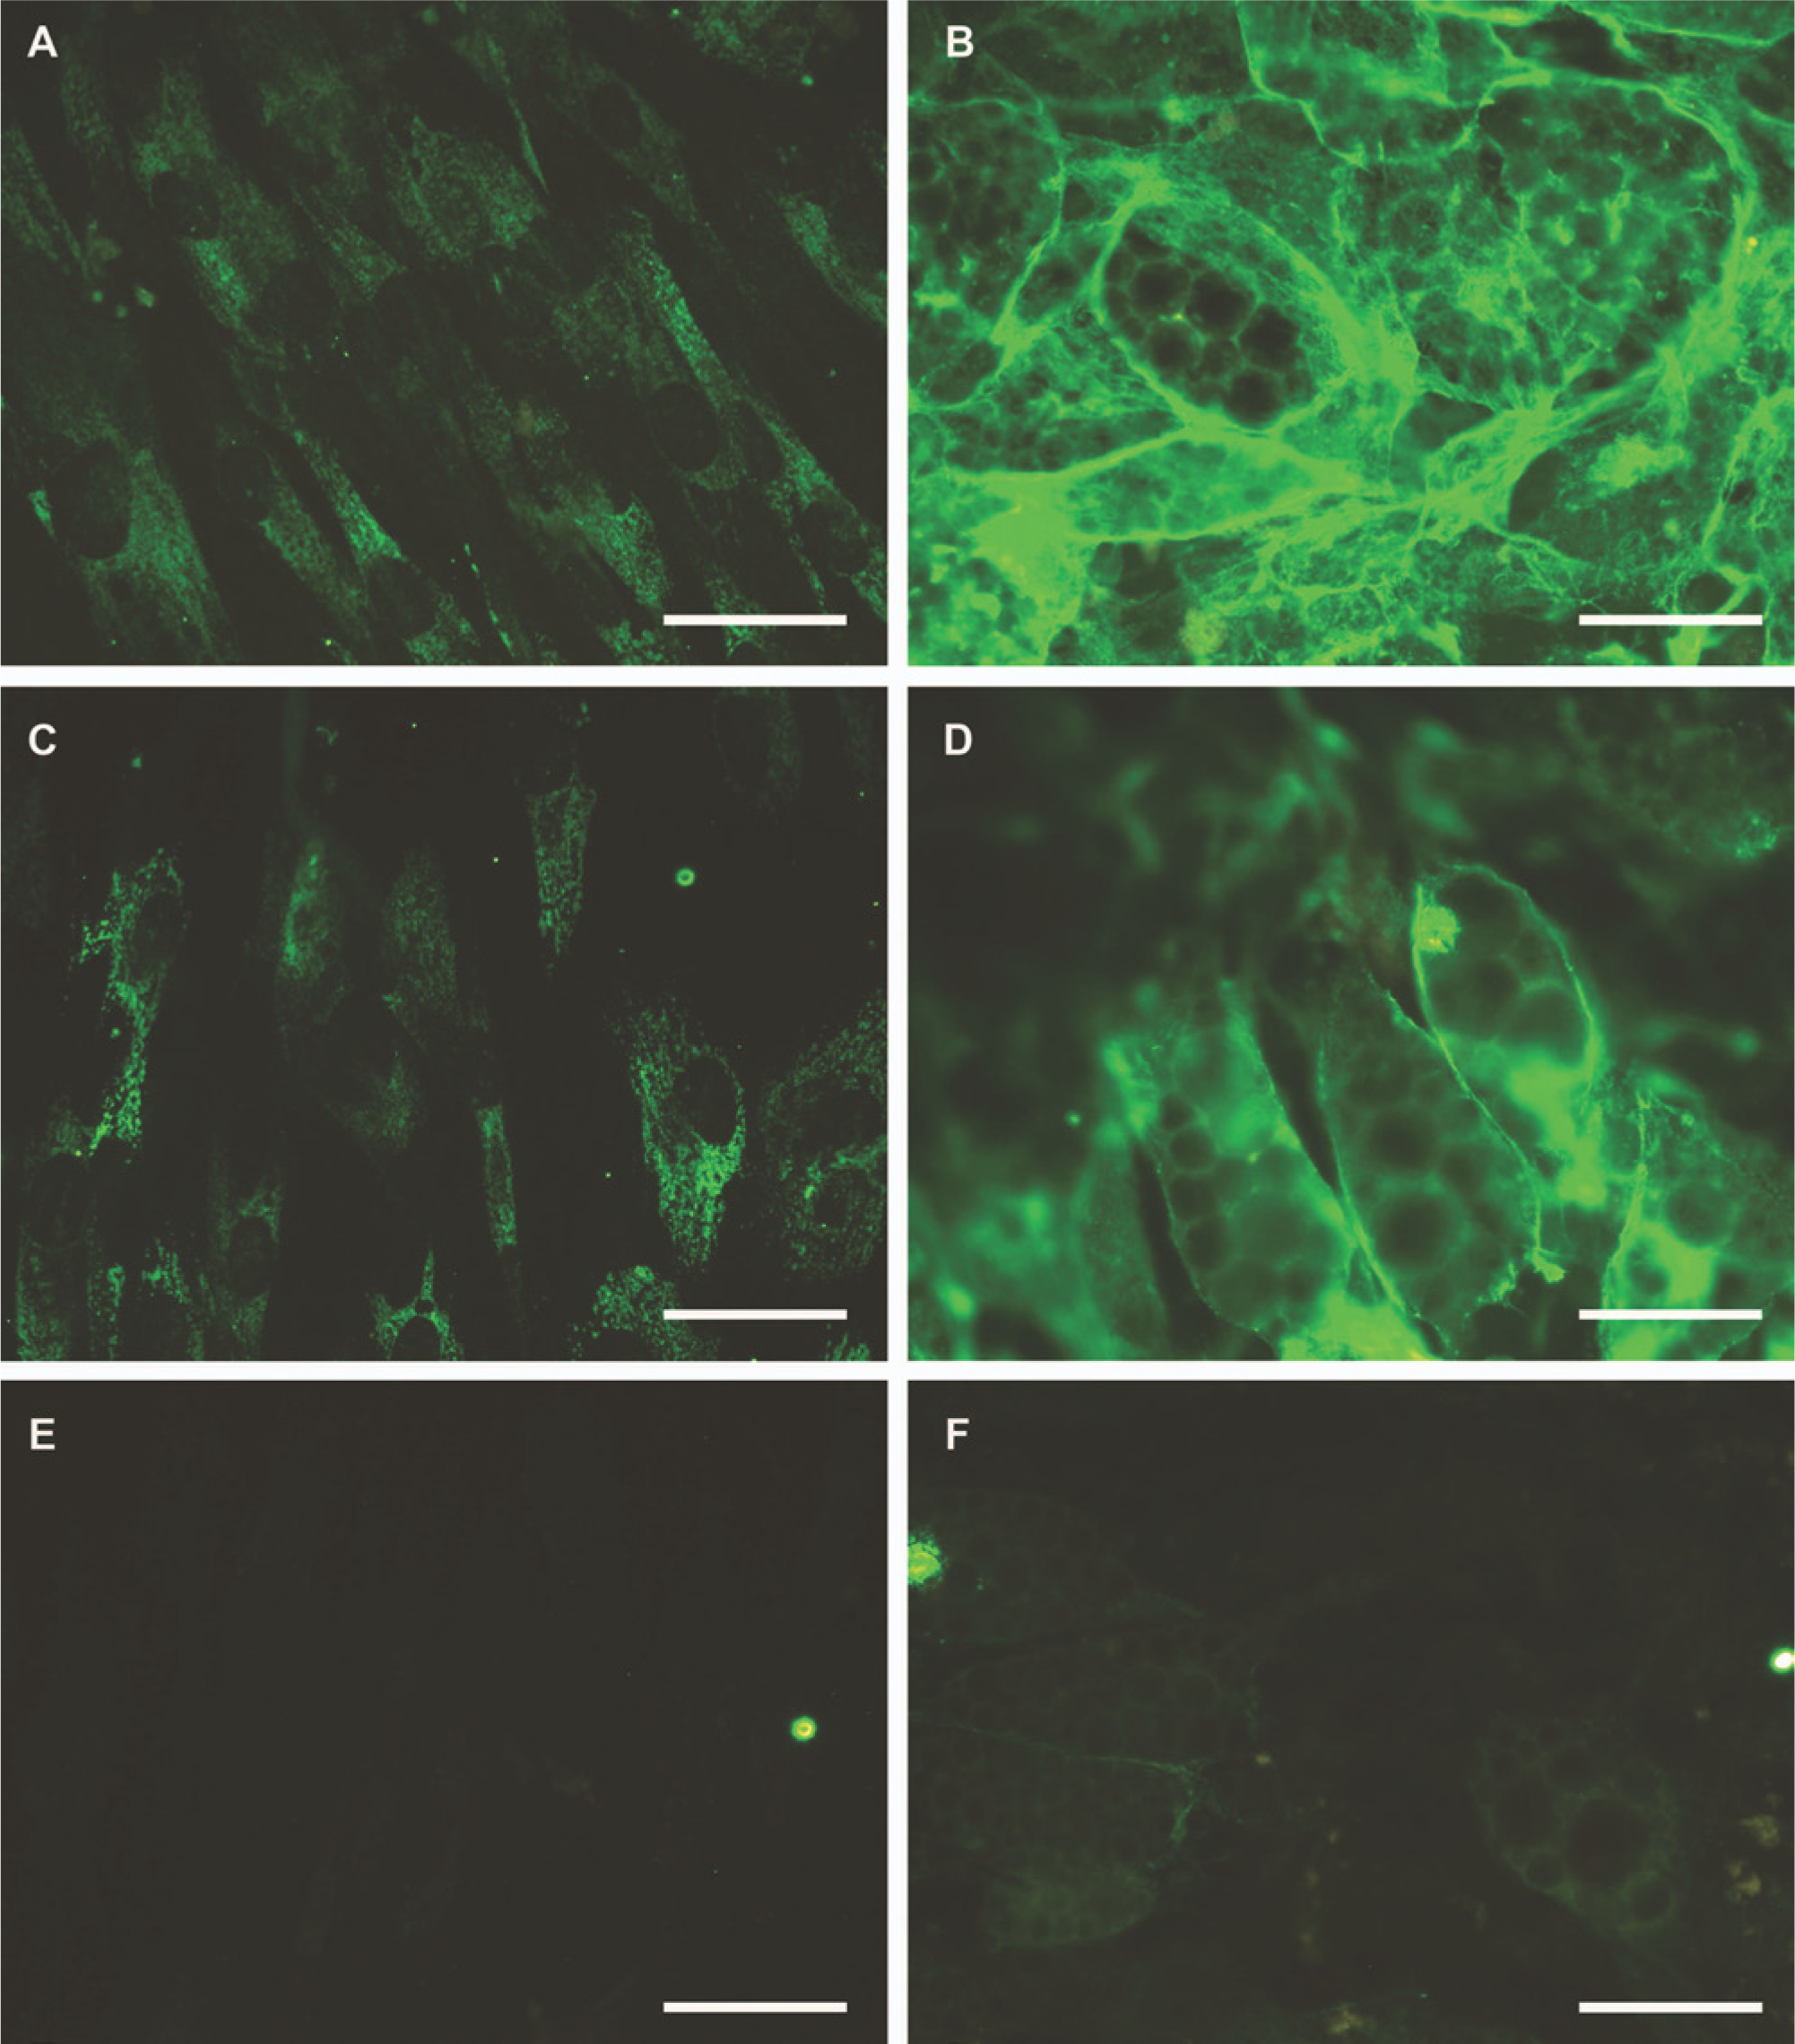
Immunofluorescence staining of LM-β1 at day 0 (A) and day 28 (B), LM-γ1 at day 0 (C) and day 28 (D), and LM-β2 at day 0 (E) and day 28 (F) in mesenchymal stem cells undergoing adipogenic differentiation. Bars = 50 μm.
Staining for collagen type IV, LM-α4 chain, nidogen (entactin), and fibronectin of fully differentiated day 28 adipocytes revealed that all the essential components of BMs were produced upon adipocytic differentiation. Copious immunoreactivity for fibronectin was noted in the ECM of both non-differentiated and differentiated cells (see Supplemental Fig. 2).
Immunofluorescence microscopic analysis of integrin receptors known to interact with LMs (some of which also bind collagen) revealed that while integrin α6 (Int α6; Fig. 4A) and Int α1 (Fig. 4E) were not found on non-differentiated MSCs, these integrin subunits, especially Int α6, were distinctly present in the plasma membranes of fat droplet-containing adipocytes (Figs. 4B and 4F). The Int β1 subunit was found to be ubiquitously located in fibrillar streaks on the dorsal surfaces of the non-differentiated MSCs (Fig. 4G) but covered the whole surfaces of mature, fat-containing adipocytes (Fig. 4H).
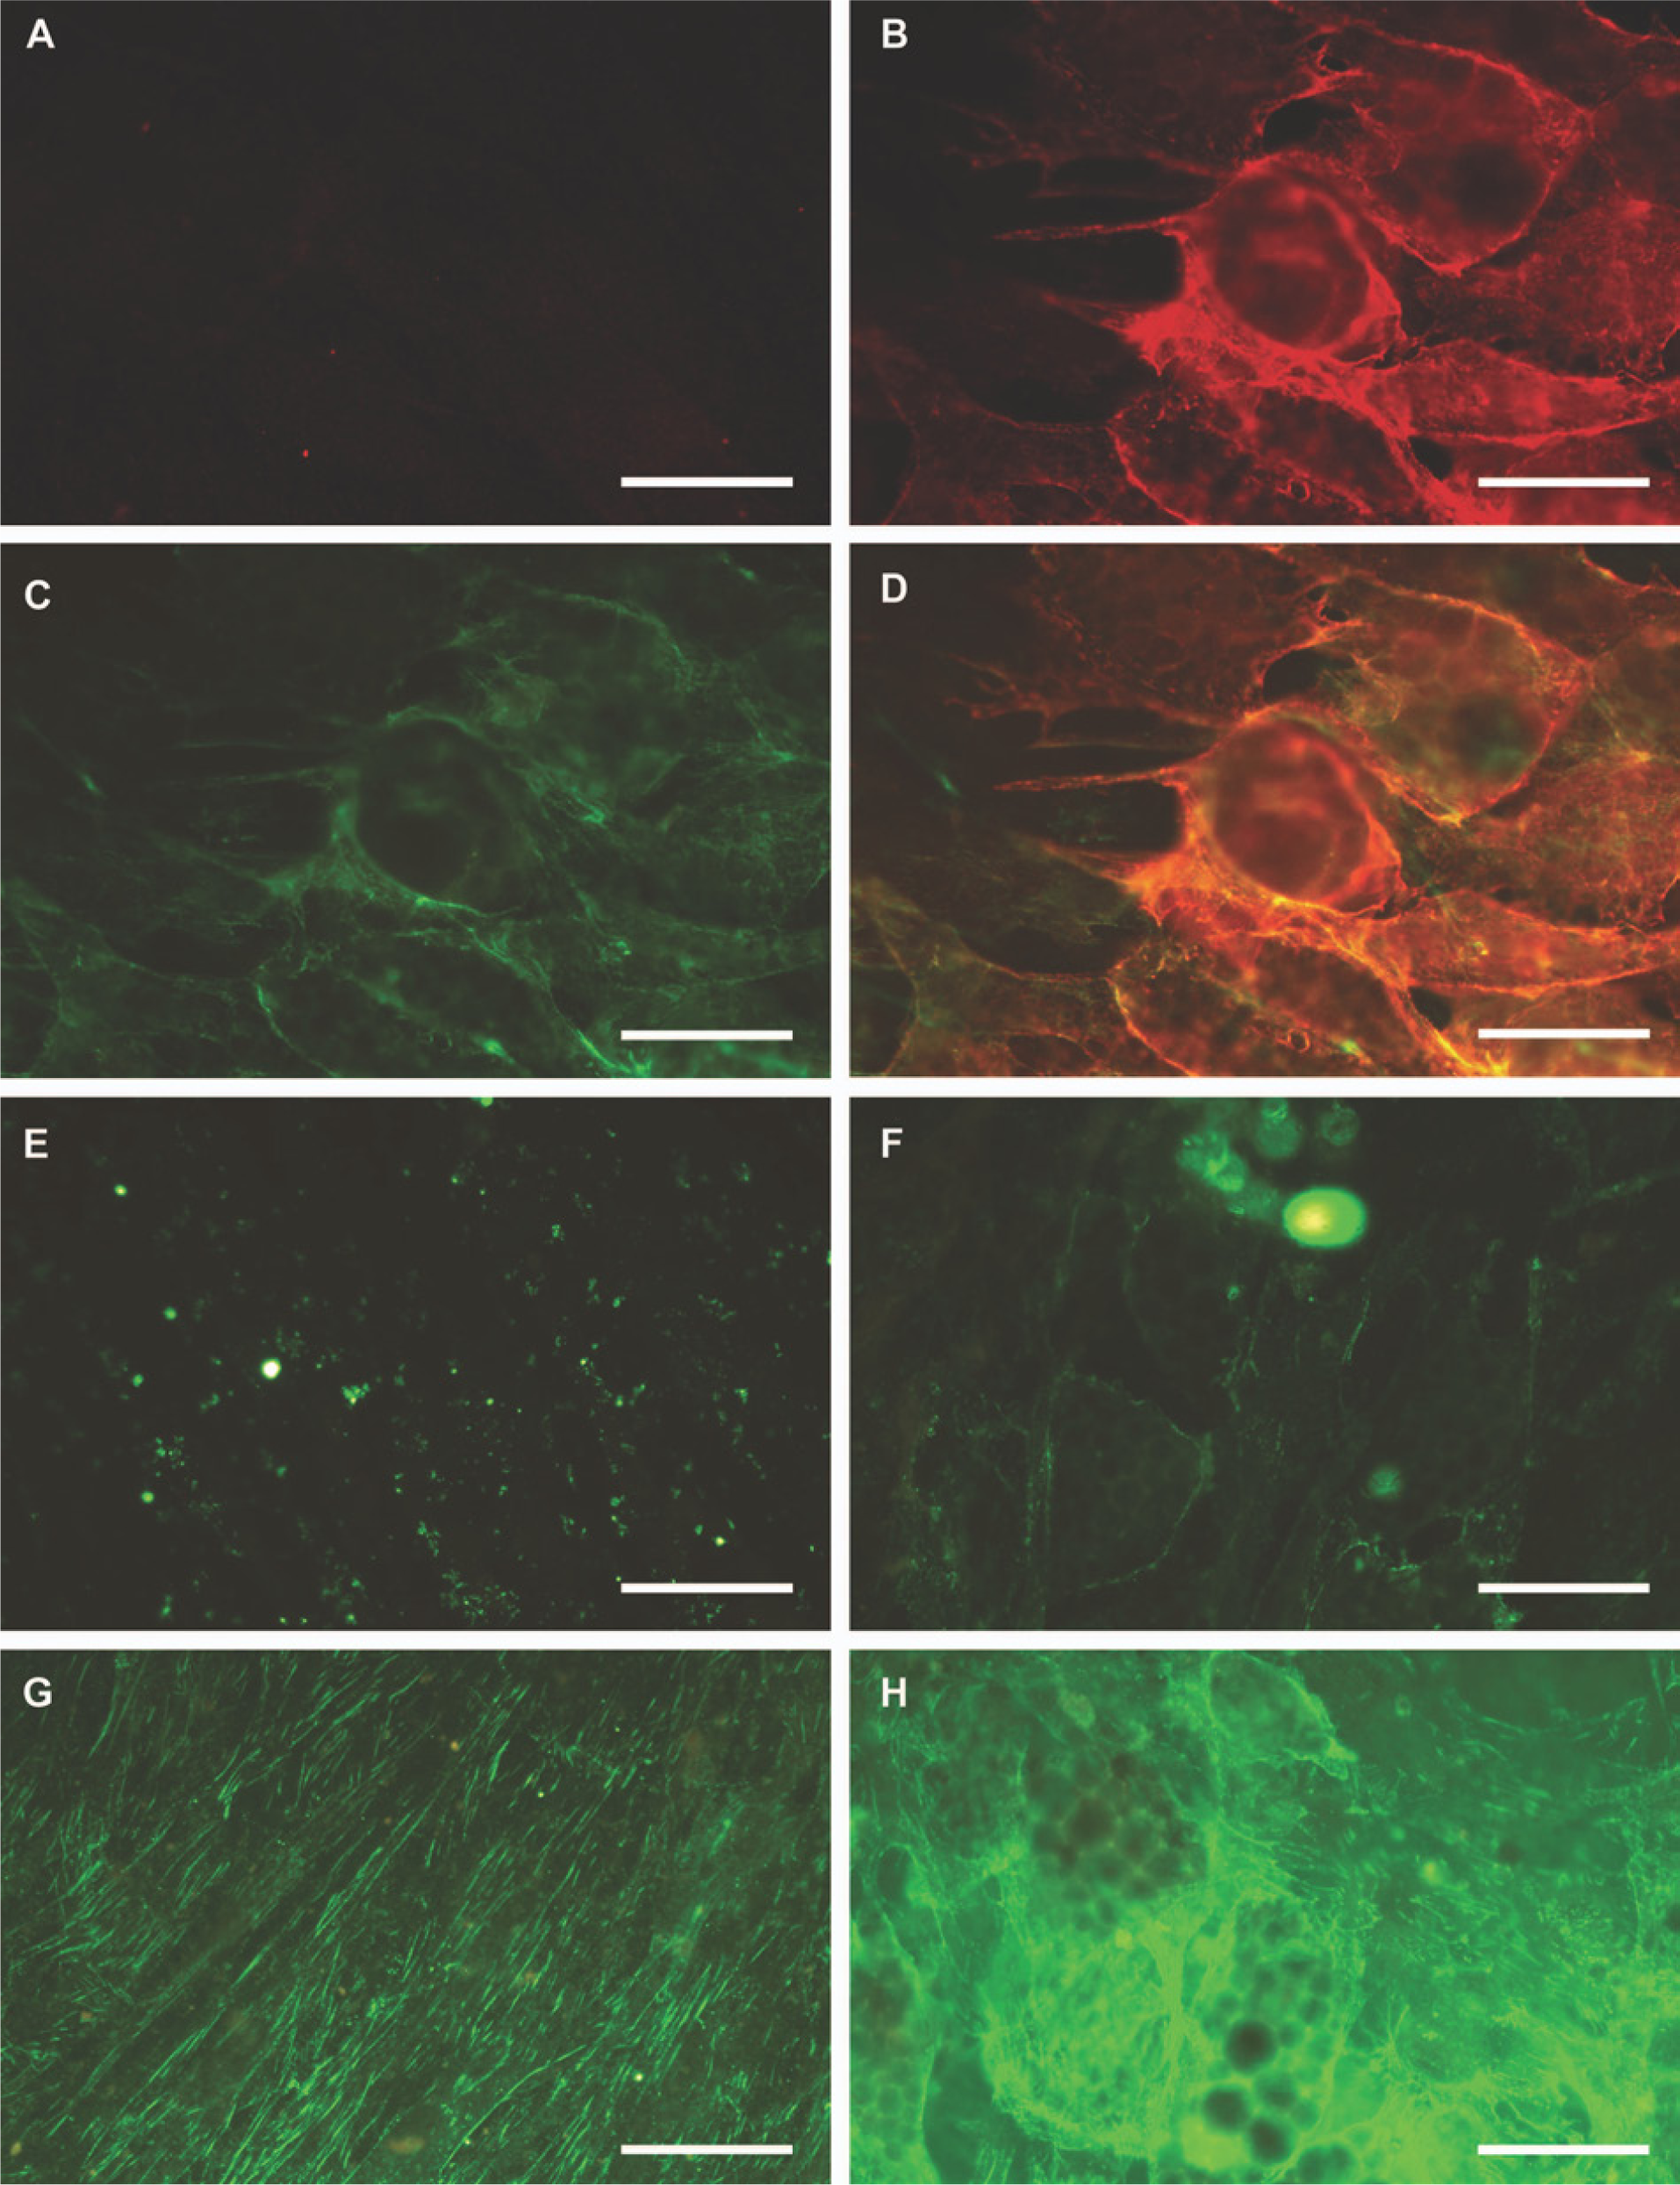
Int α6 subunit is not detected in mesenchymal stem cells at day 0 (A) but can be seen in apposition to the basement membrane of day 28 adipocytes (B). LM-α4 (C) is colocalized with Int α6 as seen in an overlay figure (D). Int α1 subunit is not detected in mesenchymal stem cells at day 0 (E), but weak immunoreactivity can be seen in the basement membrane of day 28 adipocytes (F). Int β1 subunit is seen in focal adhesions of day 0 mesenchymal stem cells (G) and at day 28 also in the plasma membrane of adipocytes (H). Bars = 50 μm.
The Int α3 subunit was detected in the plasma membranes of mainly non-adipogenic cells in both non-differentiated and differentiated cultures (data not shown). The α subunits of the other LM-binding integrin dimers, Int α2 and Int α7, were negative, whereas the Int β4, which is the alternative β subunit partner of Int α6, was not found on non-differentiated or differentiated cells. These results suggest that LM chains in the BM of adipocytes are mainly recognized by Int α6β1.
Immunoprecipitation of Matrix Proteins Secreted by MSCs during Adipogenic Differentiation
Immunoprecipitation of cell-free ECM at day 0, using antibodies to LMα4 and LMβ1 chains, showed no laminin chains (Fig. 5, lanes 1–2). The corresponding immunoprecipitates of the cell culture medium contained ca. 230 kDa and ca. 220 kDa bands (data not shown). At 2 weeks of differentiation, distinct bands corresponding to LM-α4 (ca. 200 kDa), LM-β1 (ca. 230 kDa), and LM-γ1 (ca. 220 kDa) were detected (Fig. 5, lanes 3–4). Corresponding immunoprecipitation of cell culture medium revealed the same LM-β1 and LM-γ1 bands and a partially degraded LM-α4 chain (Fig. 5, lanes 5–6).
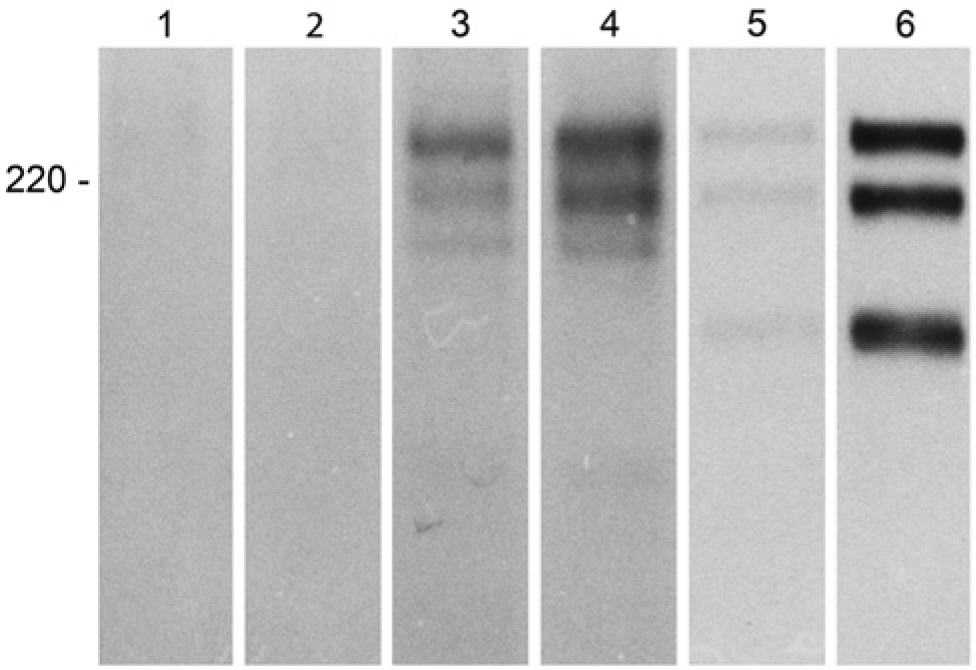
Immunoprecipitation of [35S] methionine-labeled cell-free matrix of human mesenchymal stem cells at day 0 with MAb against LM-α4 (lane 1) and LM-β1 (lane 2) disclosed lack of laminin chains. At 2 weeks, LM-α4- (lane 3) and LM-β1-specific MAbs (lane 4) precipitated ca. 230 kDa LM-β1 chain, ca. 220 kDa LM-γ1 chain, and ca. 200 kDa LM-α4 chain. LM-α4 (lane 5) and LM-β1 (lane 6) specific immunoprecipitates of the supernatant disclosed ca. 230 kDa LM-β1 chain, ca. 220 kDa LM-γ1 chain, and a partially degraded ca. 180 kDa LM-α4 chain.
Ultramorphology of Adipocytes Produced In Vitro
Day 28 adipocytes, produced from human bone marrow-derived MSCs in vitro, were surrounded by an immature BM-like structure, which was partially disrupted except where a nascent lamina lucida and lamina densa could be detected (Fig. 6).
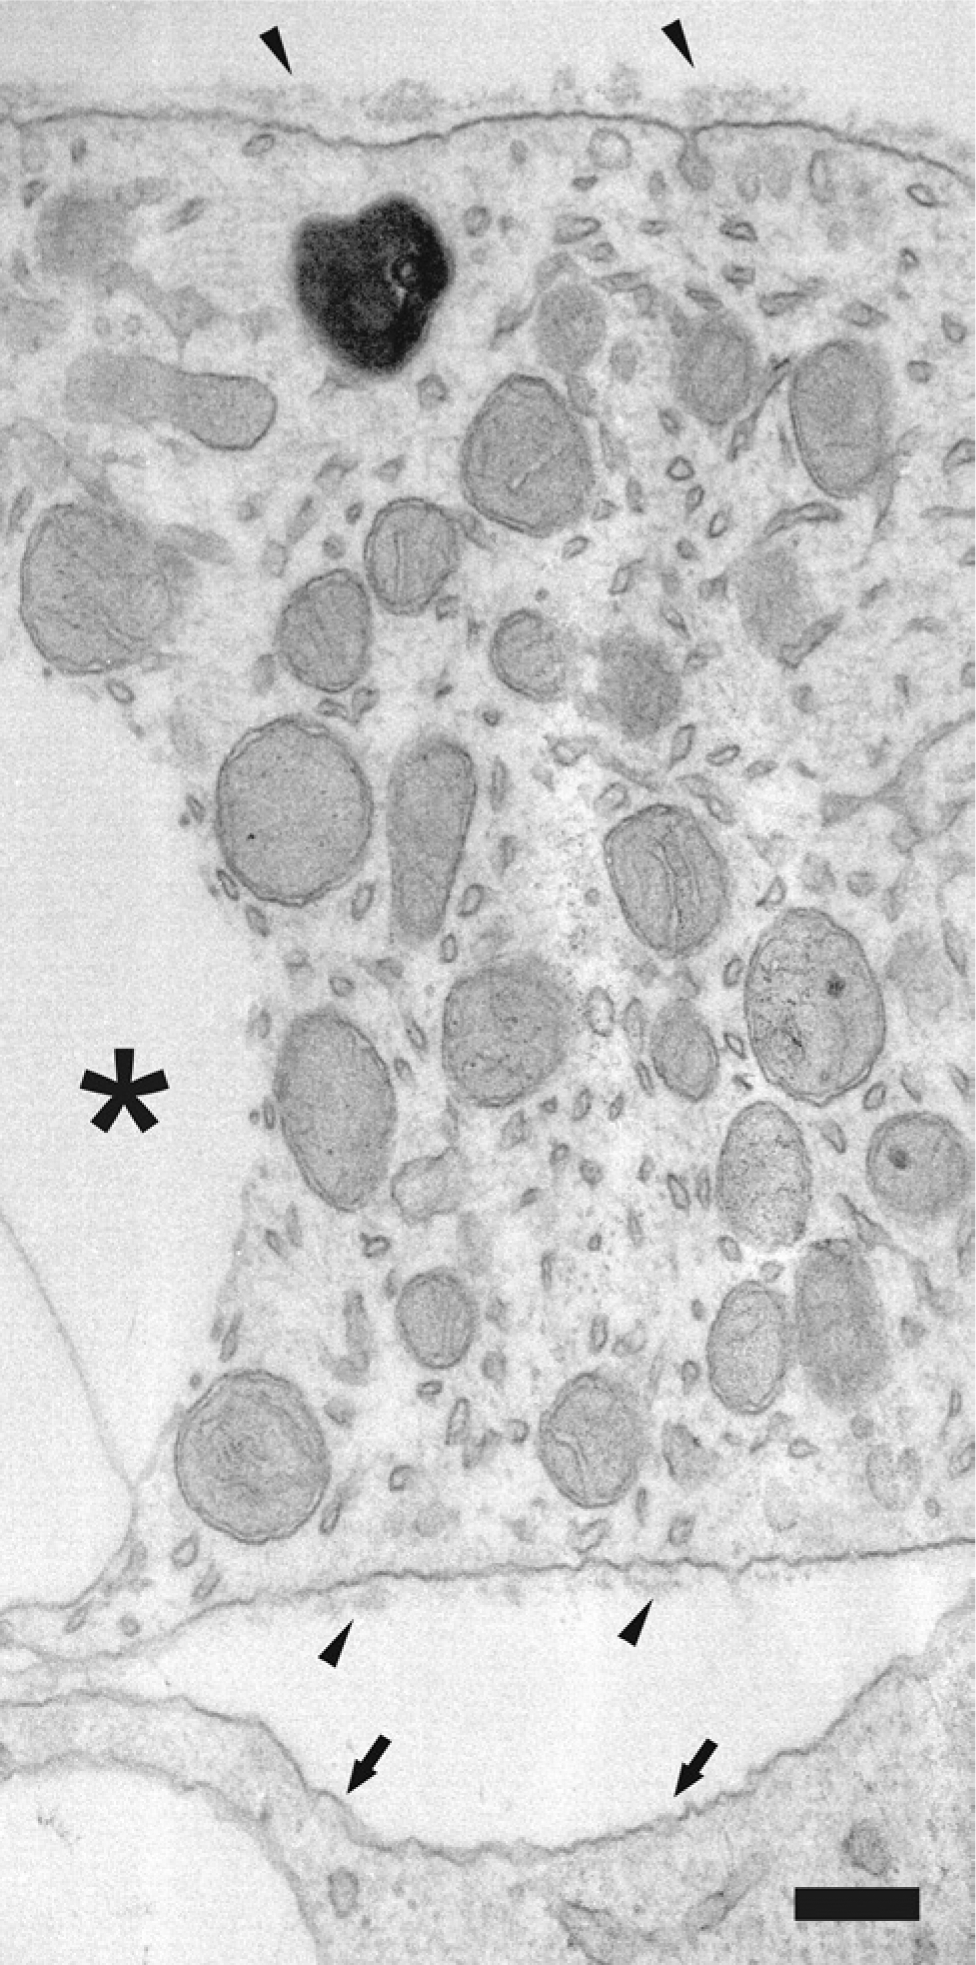
Transmission electron microscopy microphotograph of a day 28 adipocyte produced from human bone marrow-derived mesenchymal stem cells in vitro. This cell already contains a large fat droplet (*). This image shows deposition of a basement membrane-like structure (arrowhead), loosely organized to lamina lucida facing the plasma membrane of the fat cell, and a denser and still somewhat lumpy lamina densa on it. Some microvesicles can be seen, and one of them is just opening up and emptying its content to the forming basement membrane. An adjoining cell, which lacks fat droplets, also lacks the basement membrane (arrows). Bars = 10 μm.
Indirect Immunofluorescence Microscopy of Human Adipose Tissue
Immunofluorescence microscopy of human adipose tissue revealed a distinct linear distribution of type IV collagen, laminin (LM-α4 chain), and nidogen (entactin) in the BMs surrounding individual adipocytes. The integrin α6 subunit was detected in adipocyte plasma membranes over the same BM structures (Supplemental Fig. 3). Thus, analysis of immunofluorescence microscopy studies of human adipose tissue revealed a similar molecular composition as was seen in in vitro-produced adipocytes (Supplemental Fig. 2).
Discussion
Adipogenesis of the induced human bone marrow-derived MSCs was in the present work confirmed by using Oil Red O staining to demonstrate the accumulation of intracellular lipid droplets and by qRT-PCR to demonstrate the expression of differentiation markers. Using these measures to indicate adipogenesis, the production of BM LMs was, for the first time, systematically followed over time, in relation to the differentiation stage of the adipocyte formation. Transfer of the MSCs into an adipogenic differentiation medium induced marked changes in LM mRNA synthesis. This was later followed by synthesis of the corresponding LM chains during the differentiation stage, which was characterized by the appearance of intracellular lipid droplets. This suggests that the cells are growing rapidly in size and contain numerous fusing and increasingly voluminous fat droplets. At temperatures above 37C, that is, at body temperature, these fat droplets can assume a rather low viscous, liquid state, and therefore, the cells probably need some type of structural support in the form of a specialized extracellular matrix scaffold and make an attempt to synthesize a BM that can physically support the forming adipose cells.
We reported earlier that the adipocytes produced by adipogenic induction medium from human bone marrow-derived MSCs produced collagen type IV α1 and α2 mRNA molecules, which, by culture day 28, increased 18.6- and 12.2-fold, respectively, whereas the mRNA copy numbers of type IV collagen α3-α6 chains remained stable (Sillat et al. 2012). Confocal laser scanning microscopy of type IV collagen-stained cells showed that the type IV collagen mRNA was translated to the corresponding type IV collagen protein-rich BM-like structure. Preliminary studies revealed that a widely shared LM-specific antigenic determinant (a general LM biomarker) was present and co-expressed with type IV collagen around the forming adipocytes. In this work, quantitative RT-PCR was further used to show that LM-α4, LM-β1, LM-β2, and LM-γ1 were the highest expressed mRNA molecules at day 28 of adipogenesis. The same LM-α4, LM-β1, LM-β2, and LM-γ1 chains were found also as the corresponding proteins by immunofluorescence microscopy, apparently surrounding the forming adipocytes. According to the combinatorial rules, the above-mentioned LM chains can form LM-411 and LM-421 (earlier known as laminin-8 and -9). However, the amount of LM-β2 chain mRNA was less than that of β1, which was in accordance with the weaker and clearly restricted distribution of LM-β2 chain immunoreactivity in the cell cultures. These data suggest that LM-411 rather than LM-421 is the major LM isoform developing around the differentiating adipocyte BMs.
Immunoprecipitation experiments showed a lack of LM-containing ECM at day 0, whereas, at 2 weeks, the 200 kDa LM-α4, 230 kDa LM-β1, and 220 kDa LM-γ1 were precipitated. These chains probably represent the LM-411 of the forming adipocyte BM. The corresponding immunoprecipitates of the cell culture medium at 2 weeks revealed all three LM-411 chains but, in these precipitates, the molecular weight of the LM-α4 was 180 kDa. This suggests partial proteolytic degradation or post-translational modification (Wondimu et al. 2004) and perhaps release of the α4LG4-5 fragment (Talts et al. 2000). This suggests that partial degradation of the LM-α4 chain in the LM-411 heterotrimers in the BM leads to dissolution of the truncated LM-411 from the adipocyte surrounding BM to the cell culture medium. Another explanation for this difference in the molecular weight of LM-α4 in the BM and in the cell culture medium is partial degradation during the synthetic and secretory process or after temporary deposition of the intact LM-411 into the BM (followed by detachment and subsequent partial degradation of the LM-α4 in the solution). Based on the immunofluorescence staining, we concluded that the differentiating adipocytes produce LM-α4, LM-β1, and LM-γ1 chains. It seems that the preassembled LM trimers secreted by the forming adipocytes are effectively retained in and used for the formation of the adipocyte BM. This is particularly the case for the LM-α4 chain-containing trimers, for two different reasons. First, the quantitative RT-PCR data suggest that LM-α4 is the rate-limiting chain in the formation of the LM-411 heterotrimer, because LM-β1 and LM-γ1 mRNA molecules were produced in excess of LM-α4 mRNA. Second, LM-β1 and LM-γ1 chains may be retained inside the cell or they may have other potential binding partners. Because of the stoichiometric 1:1:1 ratio of LM-α4, LM-β1, and LM-γ1 chains in the mature LM-411, it seems that almost all LM-α4 chains produced are used for the formation of the LM-411 and BMs. This notion was also supported by immunoprecipitation of the ECM using LM-α4-specific precipitating antibodies, which suggested that all three components of LM-411 are increasingly found in the developing adipocyte BM.
It can be concluded that in the typical adipogenic culture conditions, confluent hMSC express several key components of the basement membrane even before the adipogenic induction starts, as we show in this work for LMs and nidogen and as we reported in an earlier work for collagen type IV (Sillat et al. 2012). These components seem to be, however, unable to produce BM and are either retained inside the cells or released to the cell culture medium (as was seen in immunoprecipitation experiments of the cell culture supernatants). After the induction was started, the expression of BM components increased several fold, but more importantly, the components produced were retained in the forming BM. Such transformation is at least partly achieved by proteolytic processing of ECM components, for example, by matrix metalloproteinases. This may be necessary not only for architectural processing but also to reveal potential integrin binding sites for the developing adipocyte (Mauney and Volloch 2010).
It is expected that the formation of BM requires active organization of the produced BM components by the cell rather than passive precipitation on the perimetry of the cell. In accordance with this assumption, both in vitro-produced adipocytes and/or tissue fat cells were shown to express LM-411 and specifically Int α6β1, which is one of the LM receptors and, according to the present work, the major one for adipocytes. In addition to its putative BM assembling and anchoring role, Int α6β1 may also be involved in the regulation of the adipocyte function via outside-in and inside-out signaling, such as adaptation of the adipocytes to their local tissue environment. Int α1β1 was weakly expressed and may play a role in the interactions between the adipocyte and its BM type IV collagen.
Of the LM-α chains, only LM-α4 was detected at the protein level during adipogenesis. Although LM-α2 mRNA also somewhat increased during differentiation, its absolute levels were significantly lower than those coding for the formation of LM-411 chains, and no corresponding LM-α2 protein was detected in the differentiating cultures by immunofluorescence microscopy. These observations raise interesting questions regarding the role of different LM-α chains in the assembly of the BM. It has been questioned whether LMs with truncated short arms, such as LM-411, can polymerize into BMs. Our results suggest that MSCs undergoing adipocytic differentiation in vitro are able to assemble BMs using apparently only LM-411 and possibly LM-421. It is likely that the cells are able to bind LM-411 at the cell membrane through Int α6β1, followed by the self-assembly of the other BM components (Sasaki et al. 2004).
Based on the previous (Sillat et al. 2012) and the present work, the α1α1α2 type IV collagen and the LM-411 are the main components in the BM produced during adipogenesis. Because of the presence of nidogen (entactin) in the pericellular matrix, all the structural components necessary and sufficient for the formation of a highly cross-linked adipocyte BM are produced during induced adipogenesis. The relevance of these in vitro findings is emphasized by the observation of a similar molecular BM composition of mature adipocytes in human subcutaneous fat tissue, where adipocytes expressed Int α6β1 on the surface and were surrounded by BMs containing LM-411. In our previous work, the successful assembly of the BM was indirectly visualized using confocal laser scanning microscopy (Sillat et al. 2012), and in the present work, this was directly confirmed by demonstration of the BM, albeit somewhat immature, around adipocytes using ultramorphological imaging (TEM). The developing adipocytes contained a distinct sandwiched lamina lucida–lamina densa type double layer, a BM-like structure around the developing adipocyte, whereas such structures were not seen in the same cultures around some of the remaining undifferentiated MSCs, which did not contain fat droplets.
Together with our previous work (Sillat et al. 2012), we have shown that upon adipogenic differentiation, MSCs switch on the expression of all the structural components that are required to form a BM, including LM-411 peptides, α1α1α2 type IV collagen, and nidogen. Concomitantly, Int α6β1 is expressed at the cell surface, probably facilitating the assembly of the proteins into a nascent BM that can be detected surrounding the differentiating adipocytes. Previous studies of BM assembly have described intricate molecular mechanisms that control BM self-assembly in cell-free systems (Yurchenco and Patton 2009) or the assembly of exogenously added LM onto the surface of embryoid bodies (Li et al. 2002). Our model of the differentiating adipocyte allows the analysis of endogenously generated BM assembly directly in situ on the cell surface.
Establishing in this work the key BM component genes that become expressed during adipogenesis forms a basis for future functional studies. These are needed in order to better understand the biological role of the developing BM in adipocyte differentiation.
Footnotes
Acknowledgements
We thank Pipsa Kaipainen for skillful technical assistance.
Declaration of Conflicting Interests
The author(s) declared no potential conflicts of interest with respect to the research, authorship, and/or publication of this article.
Funding
The author(s) disclosed receipt of the following financial support for the research, authorship, and/or publication of this article: This work was supported by the Nona and Kullervo Väre Foundation, Päivikki and Sakari Sohlberg Foundation, Sigrid Jusélius Foundation (290312), HUS-evo grants (TYH2013322), Orion-Farmos Tutkimussäätiö, Finska Läkaresällskapet (131210), TBDP PhD Graduate School (031111), the Danish Council for Strategic Research (4270289), Invalid Foundation (9310/407), Magnus Ehrnrooth Foundation, Perklén Foundation and Liv och Hälsa Foundation.
References
Supplementary Material
Please find the following supplemental material available below.
For Open Access articles published under a Creative Commons License, all supplemental material carries the same license as the article it is associated with.
For non-Open Access articles published, all supplemental material carries a non-exclusive license, and permission requests for re-use of supplemental material or any part of supplemental material shall be sent directly to the copyright owner as specified in the copyright notice associated with the article.