
Abstract
Two-color fluorescence in situ hybridization (FISH) with chromosome enumeration DNA probes specific to chromosomes 7, 11, 17, and 18 was applied to CAL-51 breast cancer cells to examine whether the fluorescence intensity of FISH spots was associated with cell cycle progression. The fluorescence intensity of each FISH spot was quantitatively analyzed based on the cell cycle stage determined by image cytometry at the single-cell level. The spot intensity of cells in the G2 phase was larger than that in the G0/1 phase. This increased intensity was not seen during the early and mid S phases, whereas the cells in the late S phase showed significant increases in spot intensity, reaching the same level as that observed in the G2 phase, indicating that alpha satellite DNA in the centromeric region was replicated in the late S phase. Thus, image cytometry can successfully detect small differences in the fluorescence intensities of centromeric spots of homologous chromosomes. This combinational image analysis of FISH spots and the cell cycle with cell image cytometry provides insights into new aspects of the cell cycle. This is the first report demonstrating that image cytometry can be used to analyze the fluorescence intensity of FISH signals during the cell cycle.
Introduction
Fluorescence in situ hybridization (FISH) is a very powerful technology in molecular cytogenetics. FISH using chromosome enumeration DNA probes (CEPs), which hybridize to the centromeric region of a specific chromosome, is very useful for the detection of chromosome copy number aberrations in interphase nuclei without preparation of metaphase spreads (Bayani and Squire 2007; Halling and Kipp 2007; Tibiletti 2007; Vorsanova, Yurov, and Iourov 2010); this is called interphase cytogenetics FISH (Cremer et al. 1986). This methodology is useful for analyzing not only cultured cells but also cytologic specimens, paraffin-embedded tissues and formalin-fixed tissues, and has been widely used in research and clinical fields.
Recent advances in image cytometry have enabled us to analyze FISH samples in more detail. However, although some studies have attempted to quantify the number of FISH spots (Truong et al. 1999; Truong et al. 2002), little attention has been paid to the fluorescence intensity of each FISH spot. In future cell biology research, techniques allowing us to obtain more information from cytometric images will be essential. In the case of FISH, such information may include not only the number of spots but also the intensity and changes in these variables, thereby providing more information for each cell in each image.
Kamentsky et al. (1997) analyzed FISH spots by image cytometry; however, they only counted the number of FISH spots. To our knowledge, analysis of FISH spot intensity has not yet been reported. In the current study, we analyzed the fluorescence intensity of each FISH spot using image-based cytometry, in combination with conventional DNA content analysis by nuclear staining.
Materials & Methods
Cell Culture
CAL-51 breast cancer cells were cultured in Dulbecco’s modified Eagle’s medium (Wako, Osaka) supplemented with 10% fetal bovine serum (FBS) in 5% CO2 at 37C in humidified culture conditions. Cells grown on glass slides were fixed in 70% ethanol.
For surgically removed tumor samples, touch-smear preparations were prepared by touching a representative part of the tumor tissue specimen to glass slides for subsequent FISH analysis and propidium iodide (PI) staining (Ikemoto et al. 2007). The touch-smear preparations were also fixed in 70% ethanol.
Image Cytometry
All wide-field images were collected using an Olympus CELAVIEW RS100 (Olympus, Japan), which captured the images automatically (Obara et al. 2009; Sakaue-Sawano et al. 2011). CELAVIEW imaging was performed with an image cytometer equipped with an LED illumination system, using wavelengths of 365 nm (UV), 470 nm (blue), and 530 nm (green) and a 20× objective. Because the system included feedback control to maintain a constant amount of light, the LED system provided accurate quantitative fluorescence. The fluorescence of PI was detected using an Olympus fluorescence mirror unit U-MWG2 (ex: BP510–550, em: BA590; Olympus) for cell cycle analysis, and that of DAPI, SpectrumGreen, and SpectrumOrange was detected by U-MWU2 (ex: BP330–385, em: BA420; Olympus), U-MGFPHQ (ex: BP460–480HQ, em: BA495–540HQ; Olympus), and U-MWG2 (ex: BP510–550, em: BA590; Olympus), respectively. The fluorescence intensities from these fluorescence dyes were measured for individual nuclei. DAPI, PI images, and FISH signals were captured through a CCD camera.
Images were quantitatively analyzed using CELAVIEW analysis software, which was designed for automated recognition of nuclear and FISH spots.
Cell Selection
PI-stained images and FISH images were overlapped by CELAVIEW software based on the XY-axis information. The software recognized more than 700 nuclei automatically, and experiments were repeated six times for each CEP under the same conditions. Moreover, we gated area, circularity factor, and two FISH counts for each nucleus, and the final cell cycle plot was drawn based on the analysis of more than 100 cells per experiment.
Cell Cycle Analysis
Nuclear DNA content was measured by laser-scanning cytometry as described previously (Miyazaki et al. 1999; Furuya et al. 2000). Briefly, glass slides with cells fixed in 70% ethanol were dipped in a PI solution (25 μg/ml in PBS) containing 0.1% RNase (Sigma-Aldrich; St. Louis, MO). DNA content (total intensity of each cell) was measured by CELAVIEW. The cell cycle phase was determined according to the DNA content of individual cells in the PI-stained preparation, and the S phase was further divided evenly into three subphases: early, mid, and late S phase.
FISH
After PI staining and image acquisition by CELAVIEW, glass slides were dipped in PBS overnight and refixed in 70% ethanol. FISH with four CEPs, alpha satellite probes D7Z1, D11Z1, D17Z1, and D18Z1 (Abbott; Chicago, IL), were applied to the same slides as those used for the measurement of DNA content. These alpha satellite probes hybridized to chromosomal regions 7p11.1-q11.1 [CEP@7(D7Z1)], 11p11.11-q11.1 [CEP@11(D7Z1)], 17p11.1-q11.1[CEP@17(D7Z1)], and 18p11.1-q11.1 [CEP@18(D7Z1)]. D7Z1 and D18Z1 were labeled with SpectrumGreen, and D11Z1 and D17Z1 were labeled with SpectrumOrange. Two-color FISH (combination of D7Z1 with D11Z1 or combination of D17Z1 and D18Z1) was performed according to the manufacturer’s instructions. CEP spots were identified by FISH as described previously (Kamentsky et al. 1997). FISH slides were counterstained with DAPI using standard procedures. Spots from chromosomes 7 and 11 and chromosomes 17 and 18 were examined in each nucleus. FISH was not affected by PI stain.
Measurement of the Relative Fluorescence Intensity of FISH Spots
The relative fluorescence intensity and size of each hybridization spot were measured for individual nuclei using image cytometry in relation to cell cycle distribution. SpectrumGreen and SpectrumOrange were excited by blue (470 nm) and green (530 nm) light, respectively, and green and orange fluorescence lights were detected, respectively.
Since the location of cells was recorded on the slide, FISH data were also obtained for individual cells using overlay between DAPI and PI staining. CELAVIEW software recognized each FISH spot automatically, and the relative fluorescence, total intensity, and count of hybridization spots were measured for cells in the G0/1, early S, mid S, late S, and G2 phases. We selected two FISH spots in the nucleus for each FISH color, and FISH spots that were close to each other or overlapping were excluded from analysis. Finally, we confirmed each cell using a gallery view. The fluorescence intensity of FISH spots in relation to the cell cycle distribution was determined by defining discrete windows in the DNA histogram. Means and standard deviations (SDs) were calculated from the results of six repeats of CEP experiments.
Statistical Analysis
Data were expressed as the mean ± SD, and significant differences were analyzed using Tukey’s method.
Results
DNA histograms were obtained by measuring PI-stained CAL-51 cells using the imaging cytometer, and the average coefficient of variation value of the G0/1 peak of histograms was 4.36%. Morphological observation of nuclei permitted the exclusion of mitotic cells from analysis. Cells were classified into subgroups according to DNA ploidy determined by cytometry. The relative fluorescence intensity of individual spots was measured for the cells in each subgroup. From this analysis, the cells were divided into five subpopulations, G0/1, early S, mid S, late S, and G2M phases, according to nuclear DNA content (Fig. 1). The nuclei of CAL-51 cells had two FISH spots for individual CEPs on each homologous chromosome, and a total of four spots (two green spots and two orange spots) was observed within an individual nucleus in two-color FISH preparations (Fig. 2).
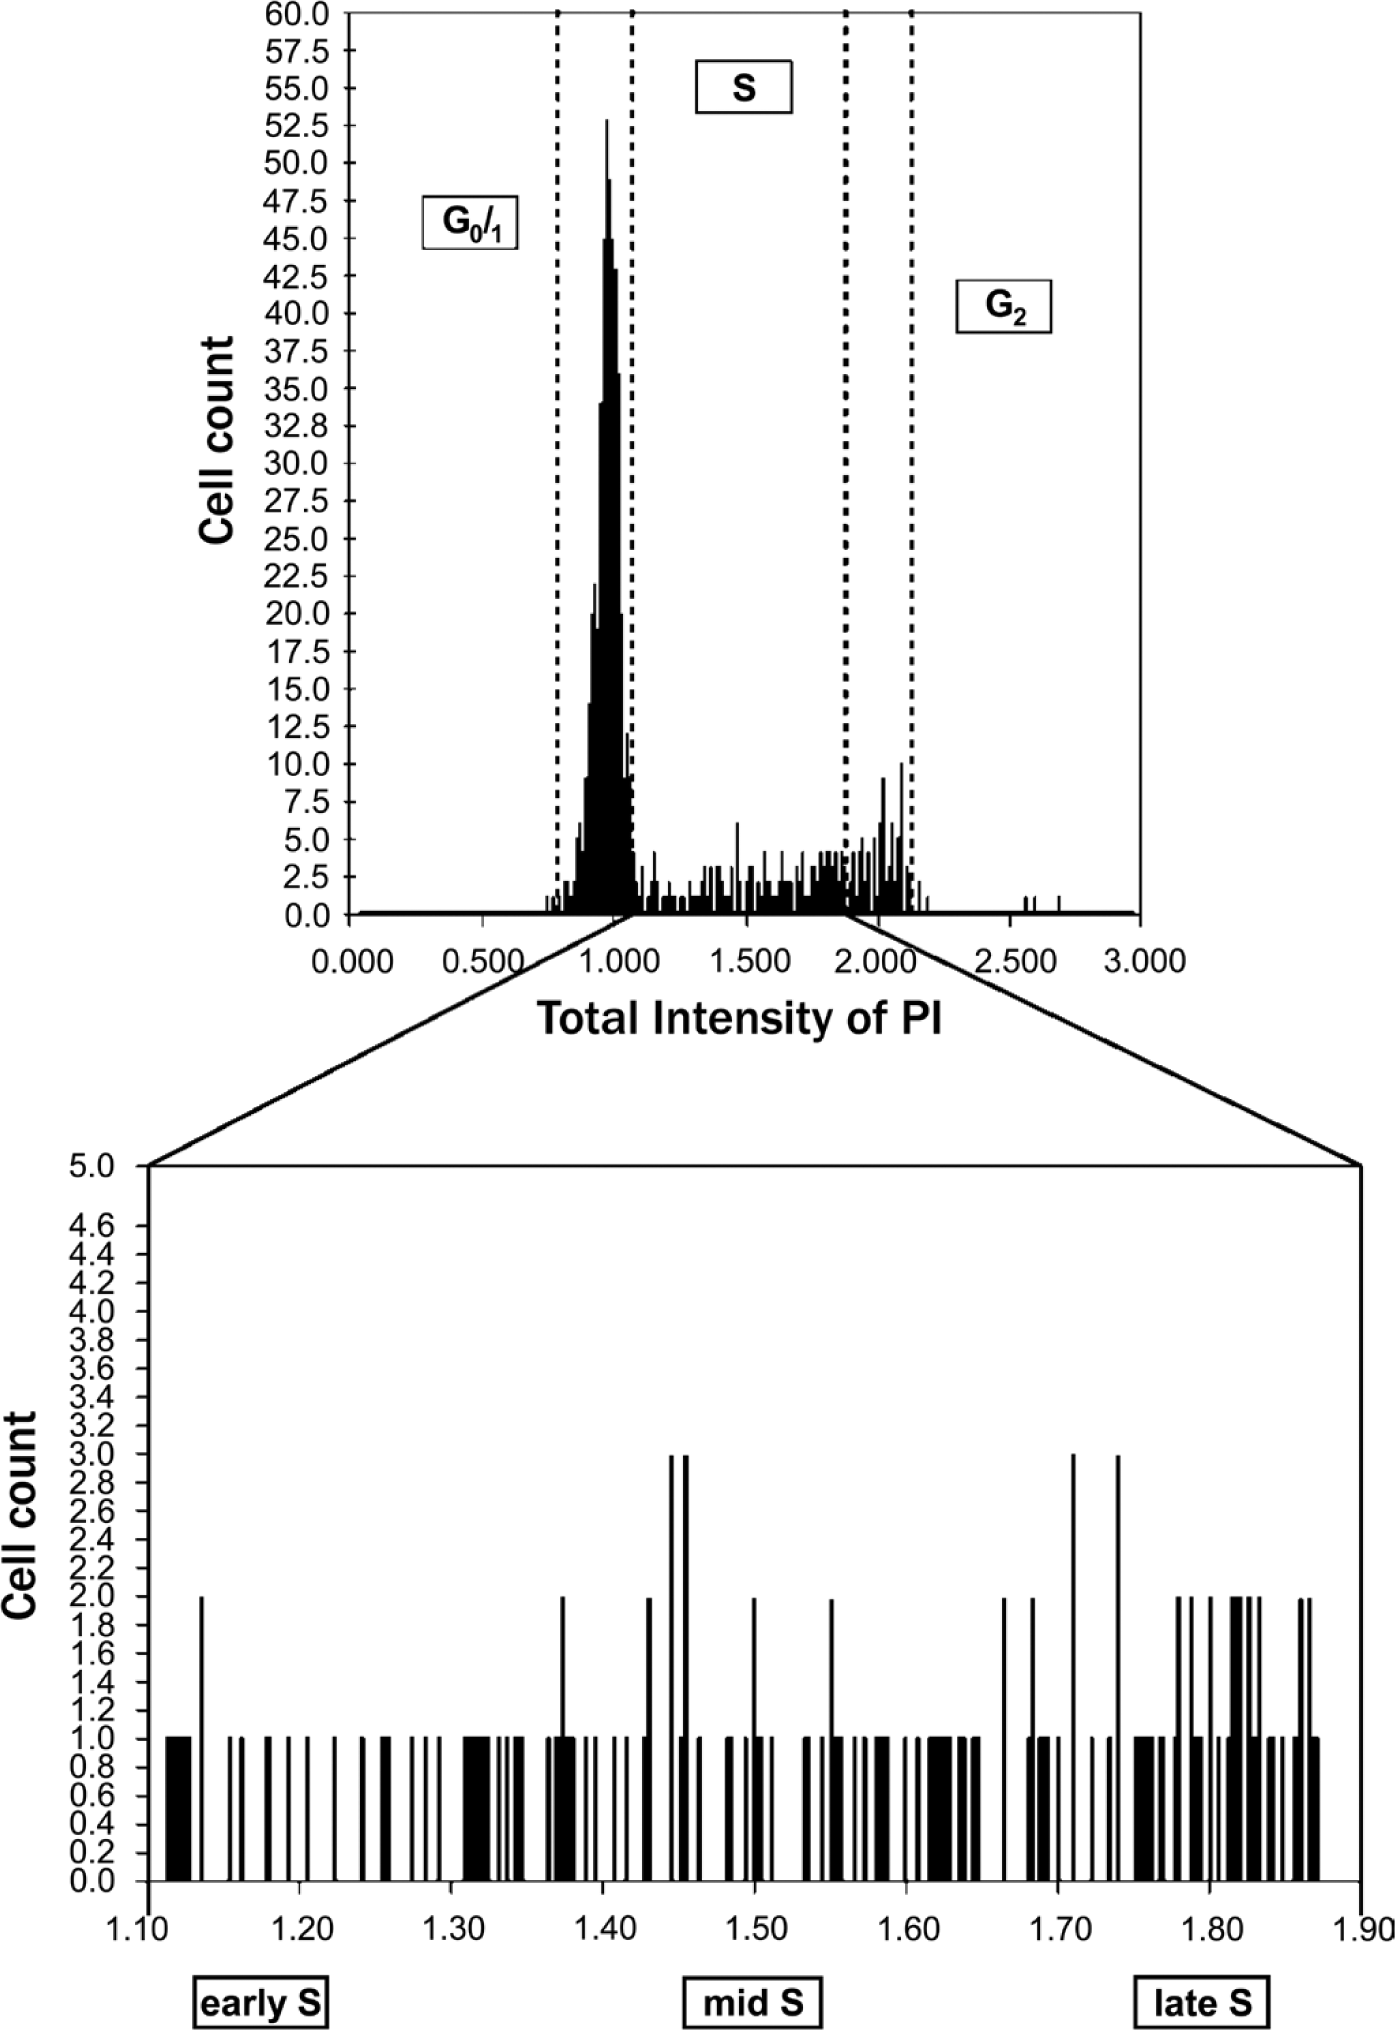
DNA histogram obtained by measuring nuclear DNA content in CAL-51 breast cancer cells stained with propidium iodide. Cells were divided into three groups according to DNA content (G0/1, S, and G2M phases), and cells in the S phase were further subdivided into three groups (early, mid, and late S phases).
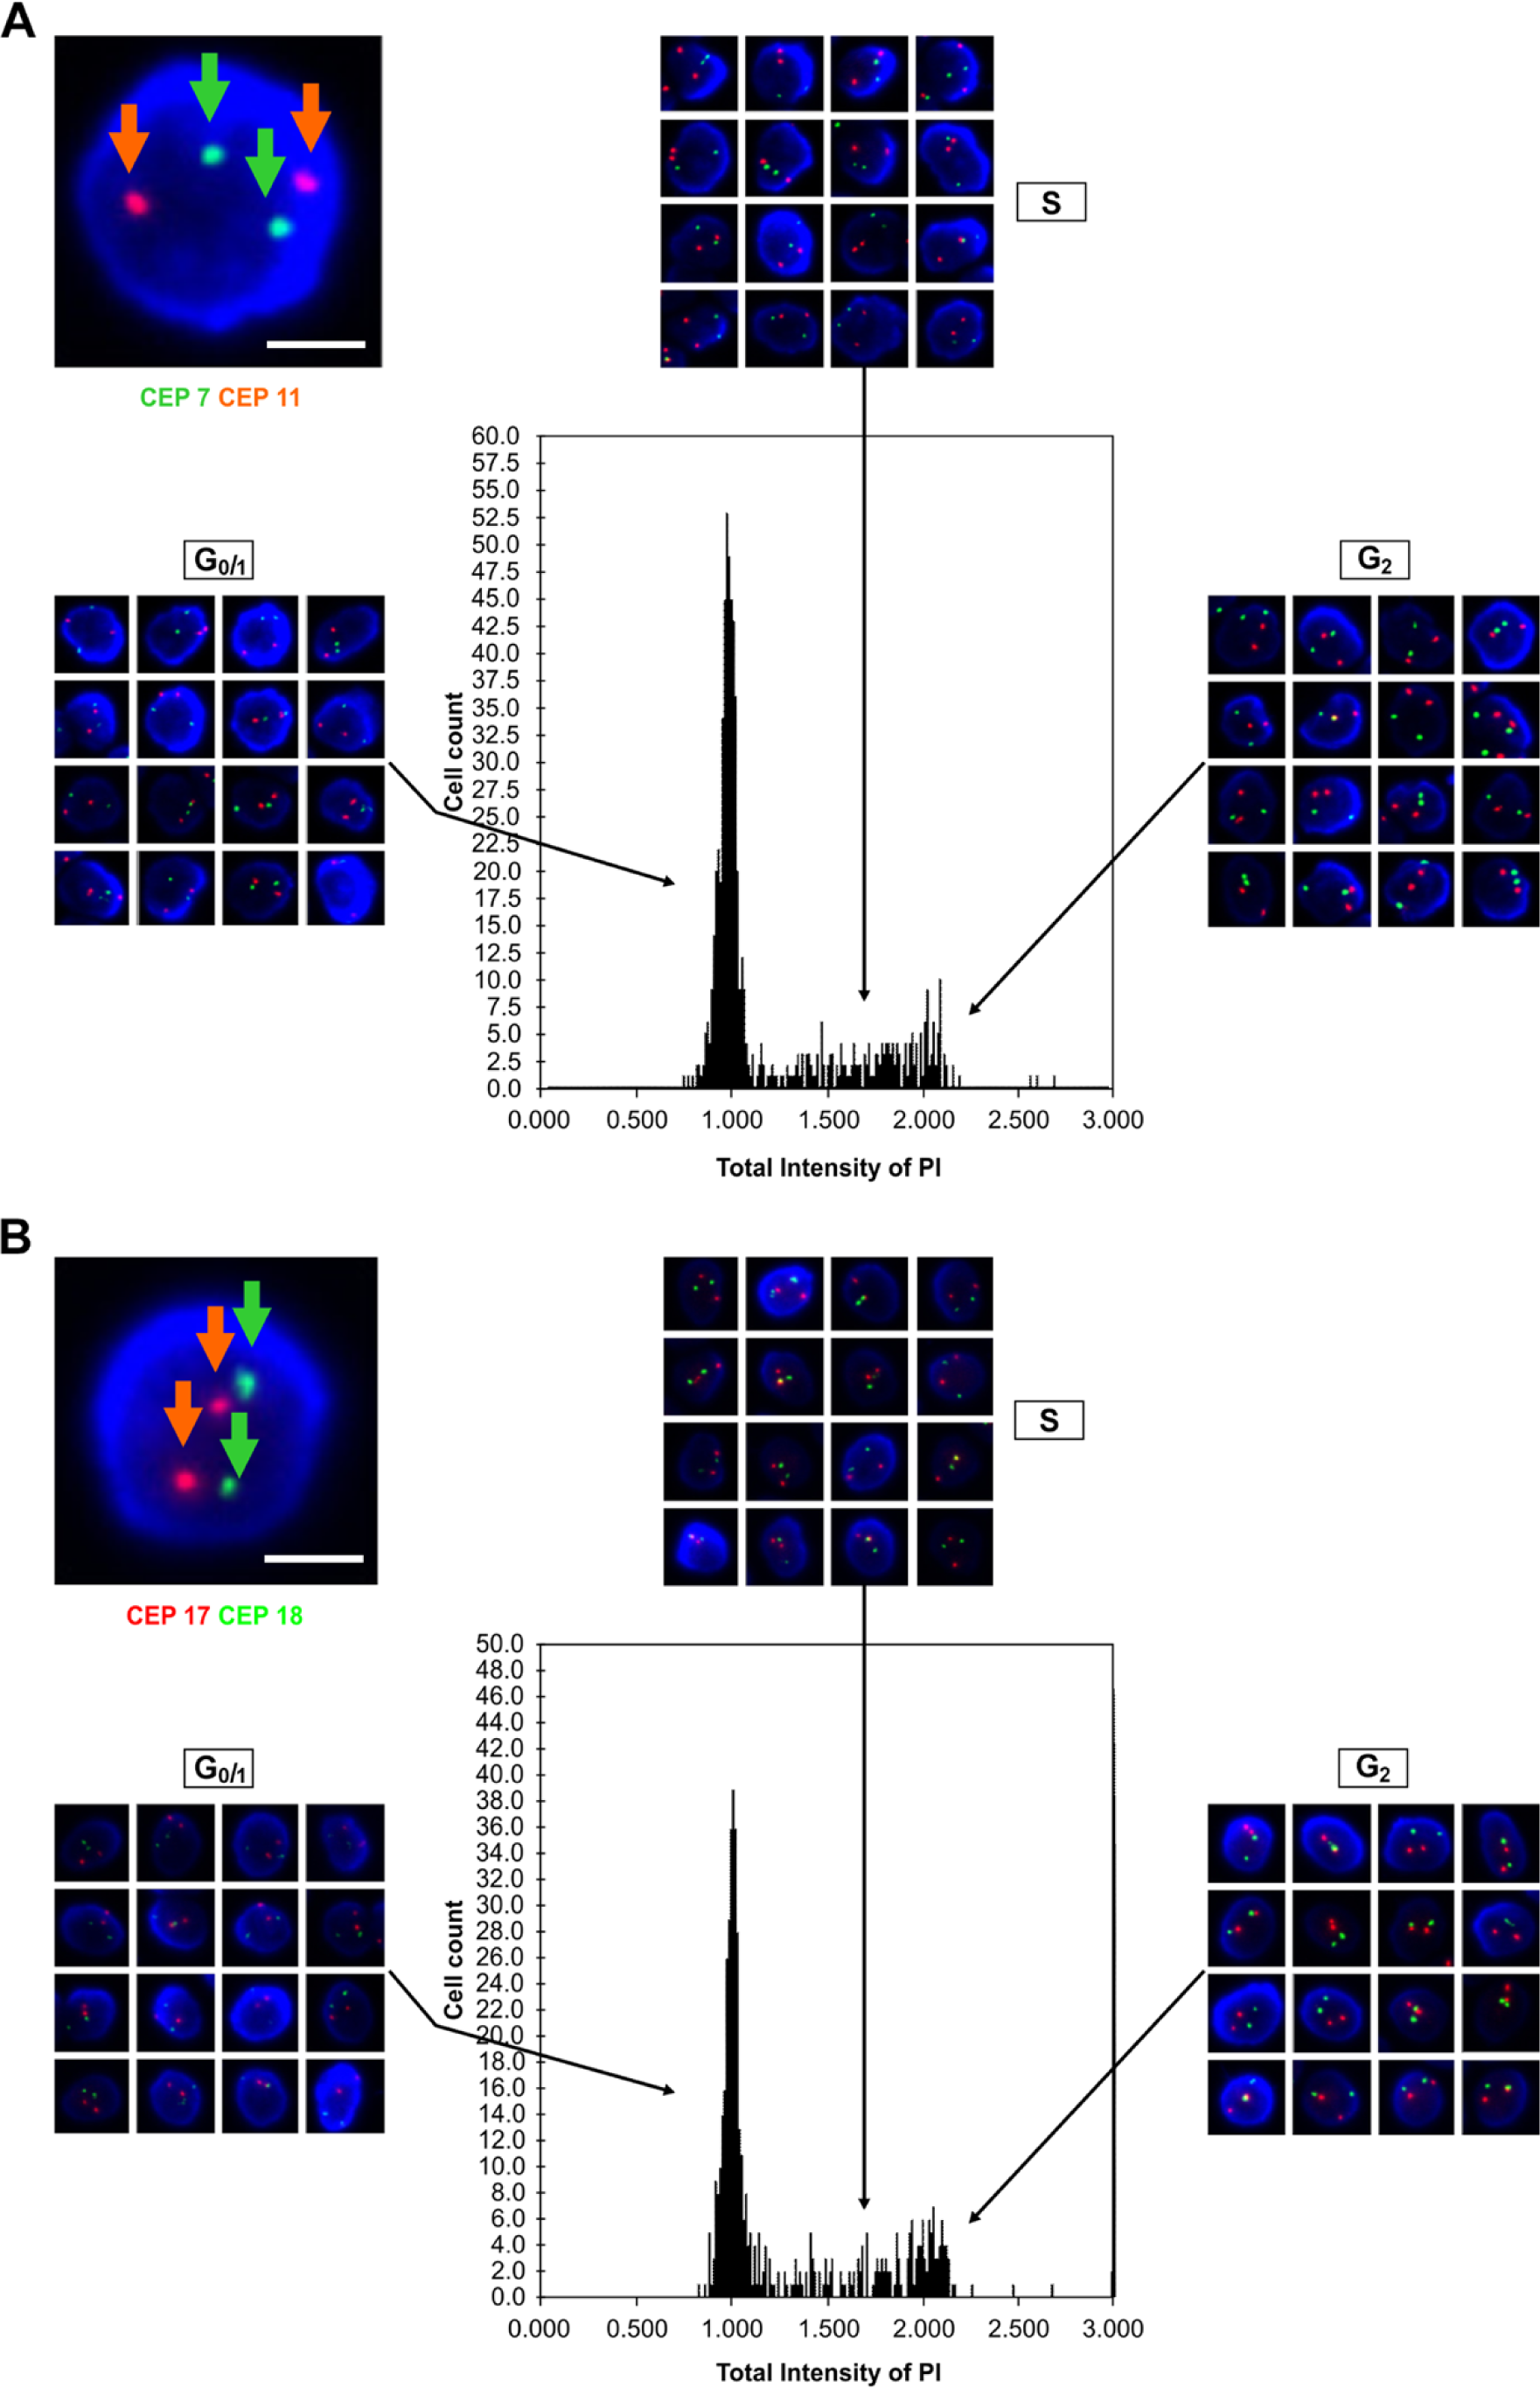
Alpha-satellite DNA probes D7Z1, D11Z1, D17Z1, and D18Z1, specific to chromosomes 7, 11, 17, and 18, respectively, were used. Fluorescence in situ hybridization showed two spots with bright green (chromosome 7 centromere 18) and orange fluorescence (chromosome 11 centromere 17), respectively, in the nucleus with blue fluorescence (stained with DAPI). The cell cycle phase was determined for individual nuclei based on DNA content, and cells representing each phase are shown in the labeled images. High-magnification cell images are shown. Bars A, B = 10 µm.
Although intercellular variation in chromosomal copy numbers in cells within the same cell cycle phase was not observed, the fluorescence intensity of each FISH spot was obviously different between cells. Image cytometry allowed for quantitative analysis of the fluorescence intensity of individual FISH spots in accordance with the cell cycle phase. The fluorescence intensity of FISH spots was 2 to 3 times greater in G2 cells than in G0/1 cells. The mean fluorescence intensities of FISH spots corresponding to CEP7, −11, −17, and −18 were 2.26 ± 0.17, 2.12 ± 0.23, 2.45 ± 0.13, and 2.62 ± 0.15, respectively, in G2 cells (Fig. 3, Table 1), when that of G0/1 cells was arbitrarily defined as 1.0. During the S phase, the fluorescence intensity of FISH spots gradually increased until cells entered the G2 phase. Whereas the increase in fluorescence intensity of spots was imperceptible during the early and mid S phases, a noticeable increase could be seen during the late S phase. Compared with spots in the G0/1 phase, the spot intensity of the cells after leaving the late S phase doubled (Fig. 3).
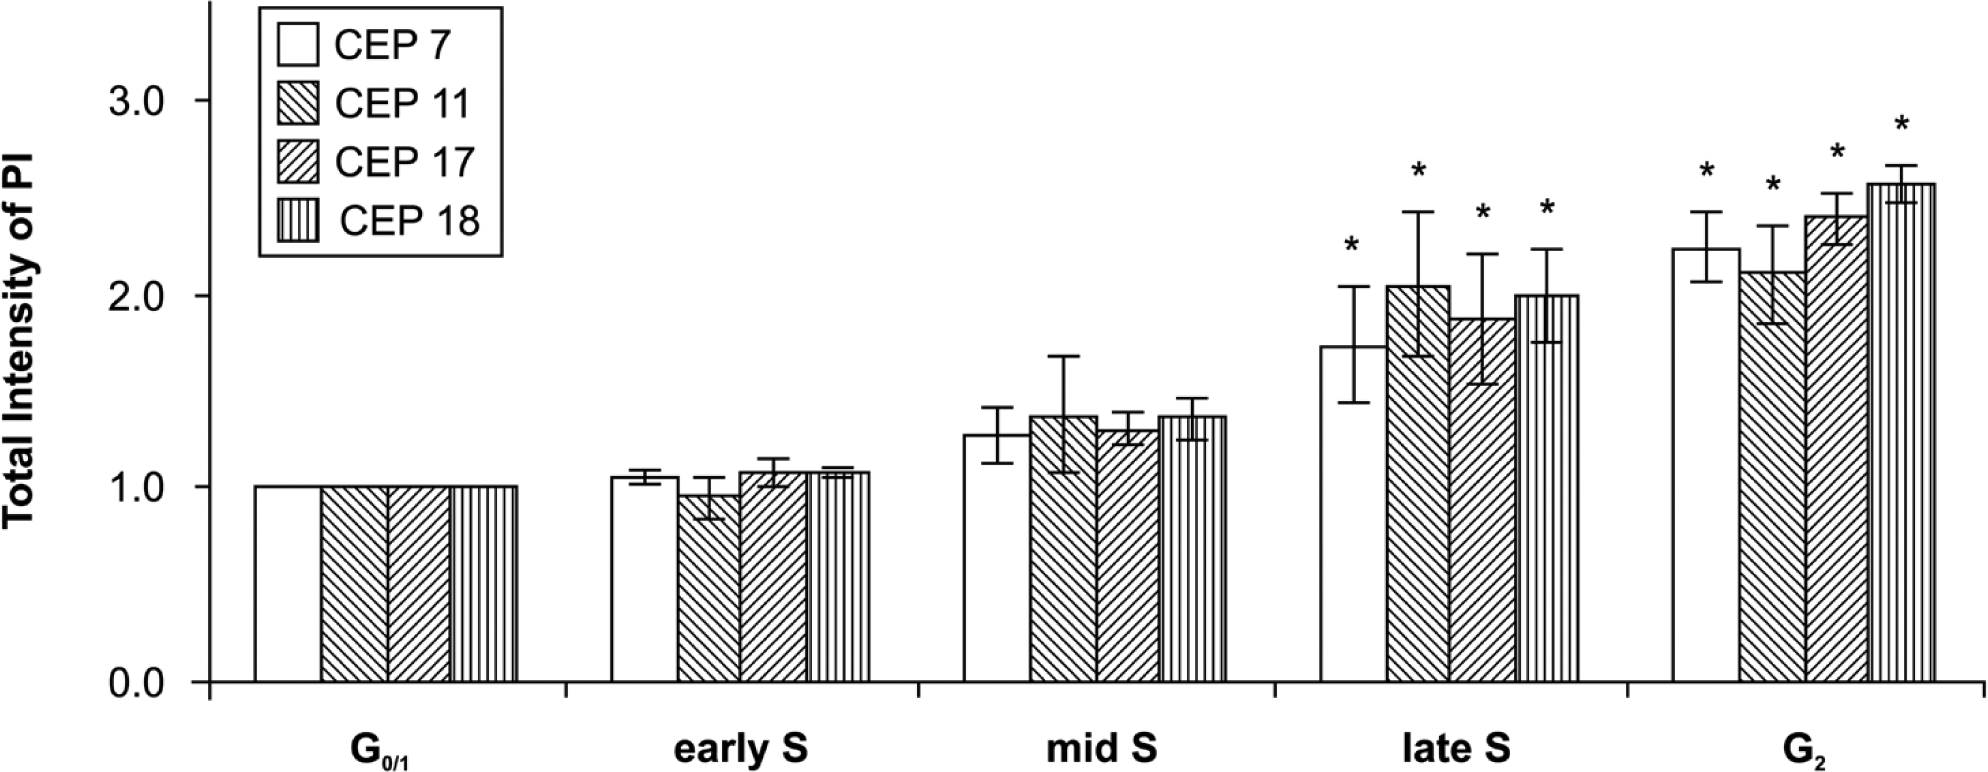
The relative fluorescence intensity was measured for individual spots, and the cell cycle phase was determined based on the cell’s DNA content. S-phase cells were further classified as early, mid, and late S phase. The increase in fluorescence intensity of spots was imperceptible during the early and mid S phase but was noticeable during the late S phase. Values represent the mean ± standard deviation (N=6). Fluorescence intensity increased during the G2 phase and late S phase compared with that in the G0/1 phase (p<0.01).
Fluorescence Intensities of Individual Fluorescence In Situ Hybridization (FISH) Spots for Cell Cycle Phases.
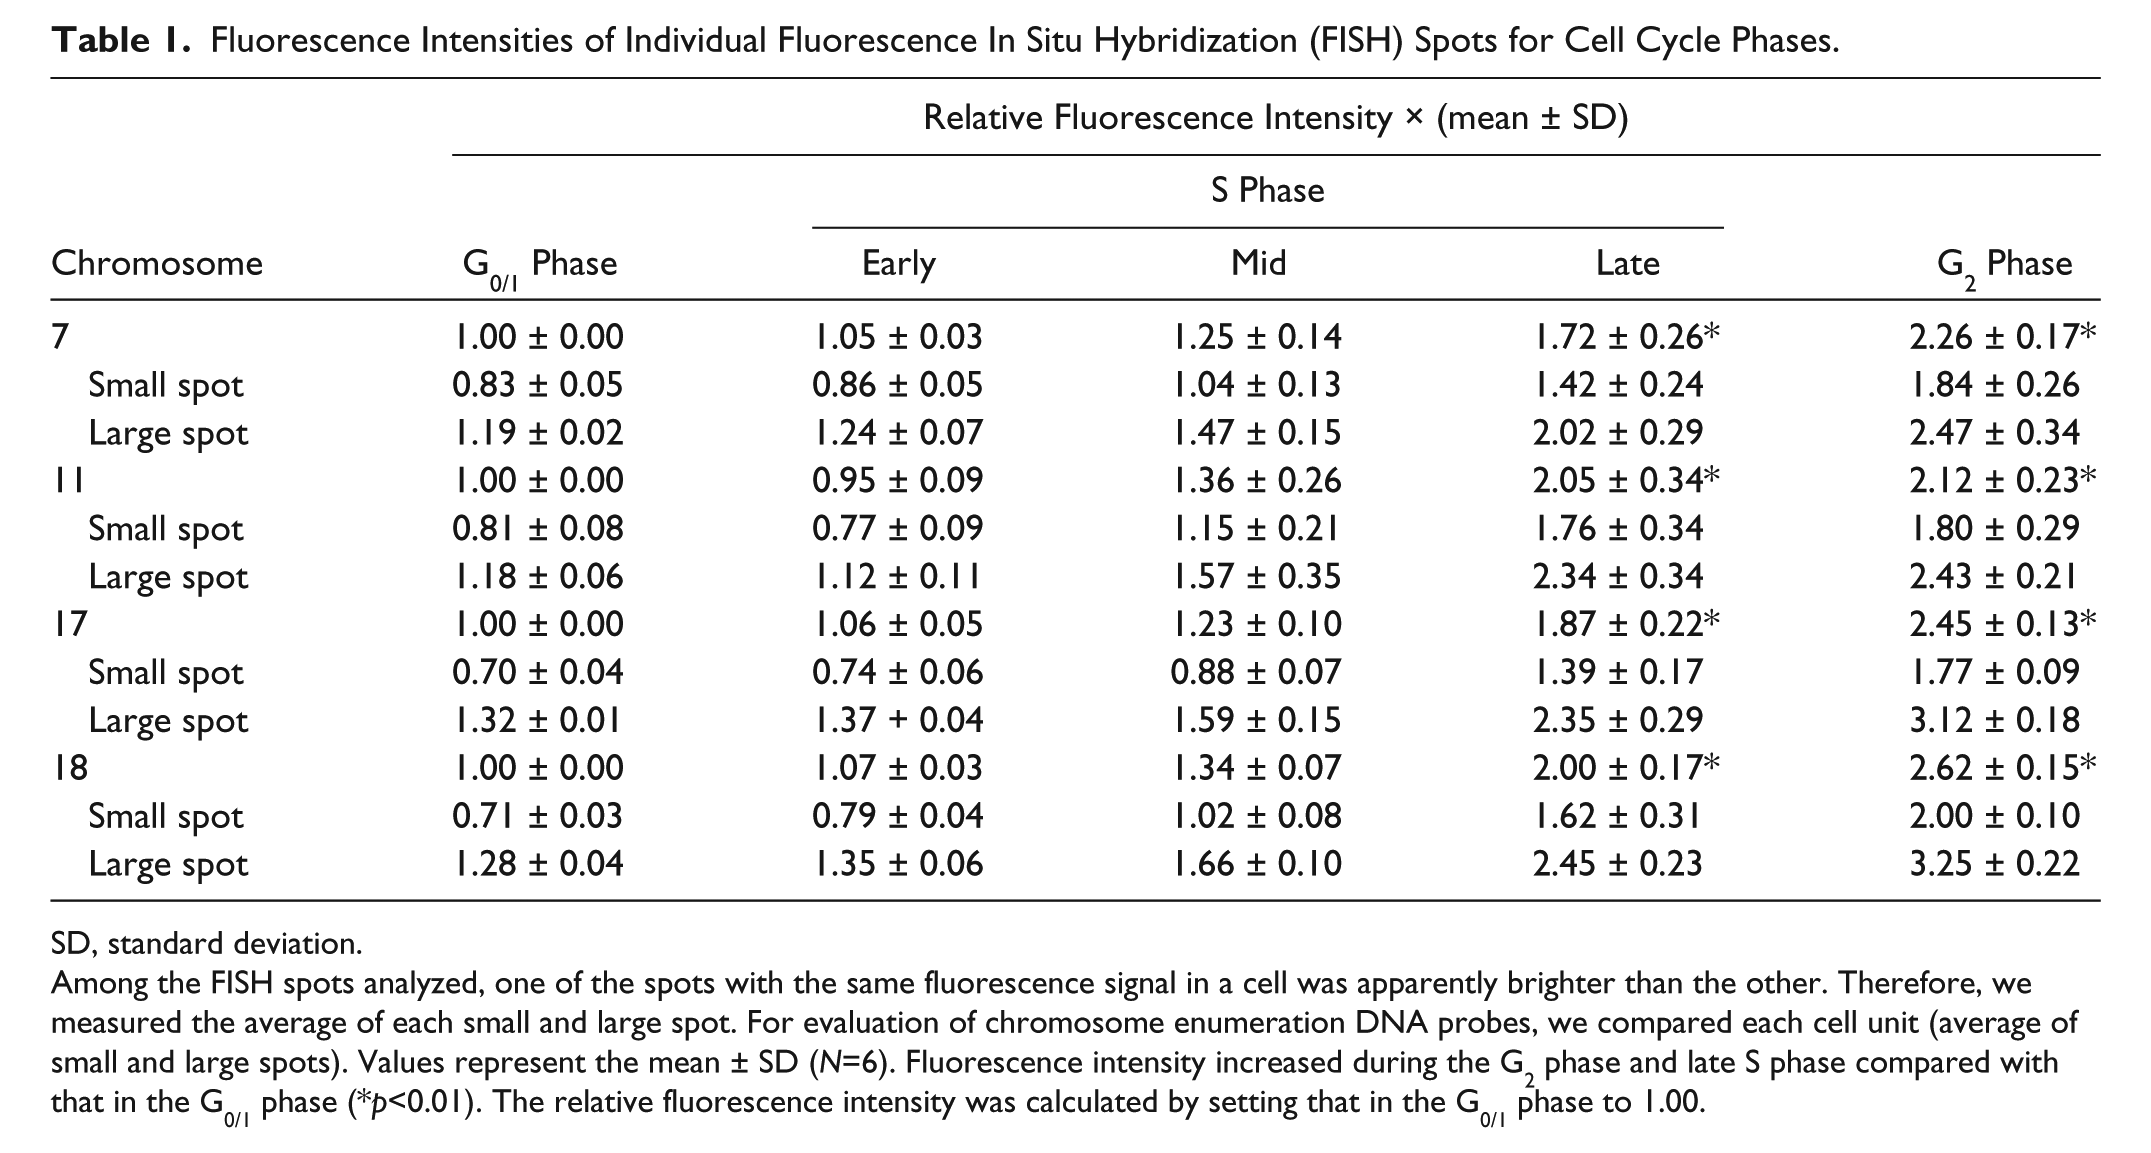
SD, standard deviation.
Among the FISH spots analyzed, one of the spots with the same fluorescence signal in a cell was apparently brighter than the other. Therefore, we measured the average of each small and large spot. For evaluation of chromosome enumeration DNA probes, we compared each cell unit (average of small and large spots). Values represent the mean ± SD (N=6). Fluorescence intensity increased during the G2 phase and late S phase compared with that in the G0/1 phase (*p<0.01). The relative fluorescence intensity was calculated by setting that in the G0/1 phase to 1.00.
Intriguingly, one of the spots with the same fluorescence signal in a cell was apparently brighter than the other one; this phenotype was seen at every stage of the cell cycle. The fluorescence intensity was different between these spots for homologous centromeres in the nucleus (Table 1). These results were not affected by the different fluorescent dyes used in this study.
Discussion
FISH spots reflect the location of a CEP on the chromosome. Changes in the number and location of FISH spots represent cell cycle position and chromosomal rearrangements. In cases of gene FISH, FISH spots may also represent gene amplification and translocation. FISH using CEPs is technically simple and provides valuable cytogenetic information. Therefore, this method is commonly used to detect copy number aberrations in various types of cells, including clinical samples (Bayani and Squire 2007; Halling and Kipp 2007; Tibiletti 2007; Vorsanova, Yurov, and Iourov 2010). However, the counting of FISH spots is cumbersome and time consuming (Bayani and Squire 2007; Halling and Kipp 2007; Tibiletti 2007; Kawauchi, Furuya, Ikemoto, et al. 2010; Kawauchi, Furuya, Uchiyama, et al. 2010; Vorsanova, Yurov, and Iourov 2010). Therefore, novel methods for the analysis of FISH spots are needed. Image cytometry, which has various applications in research and clinical fields, allows automatic enumeration of FISH spots corresponding to CEPs specific to individual centromeric regions, as reported previously (Kamentsky et al. 1997; Shah 2007; Wang et al. 2010). However, measurement of the fluorescence intensity of hybridization spots has not been extensively investigated. Whereas Iourov and colleagues (2005) reported an attempt to measure FISH signals with Scion Image software, which is usually applied for the analysis of electrophoresis gels, no studies have reported detailed analyses of the fluorescence intensity of FISH spots or examined changes in FISH spots in relation to the cell cycle. Therefore, we hypothesized that it may be possible to trace changes in the gene itself by analyzing FISH spot intensity using FISH analysis. In the present study, we demonstrated that image cytometry allowed for the quantitative analysis of the fluorescence intensity and the size of individual FISH spots in a large number of cells.
Although intercellular variation in the fluorescence intensity of FISH spots was considerable, as might be expected, the fluorescence intensity depended on the cell cycle phase, indicating that genetic changes in cell proliferation can be analyzed by measuring the intensity of FISH spots. Indeed, since the fluorescence intensity of FISH spots appeared to vary depending on the cell, we first considered that these intercellular variations may be artifacts of hybridization. However, the fluorescence intensity of FISH spots tended to have a certain value for each cell, and we determined that this was linked with the cellular DNA content. In other words, if the fluorescence intensity of FISH was linked with the cell cycle, the FISH spots represented the genetic change of DNA replication. The fluorescence intensity of spots gradually increased throughout the S phase, exhibiting a marked increase during the late S phase, and by the G2 phase rose to 2 to 3 times that in the G0/1 phase. It has been reported that centromeres with alpha satellite sequences are replicated synchronously during the late S phase (Vig, Sternes, and Paweletz 1989; Ten Hagen et al. 1990; Barbosa, Otto, and Vianna-Morgante 2000). This observation is in accordance with the results from the present study. These results demonstrated that alpha satellite DNA in the centromeric region was replicated in the late S phase. Thus, our study indicated that image cytometry permitted the detection of DNA replication timing for a specific chromosomal region using simple FISH analysis of the centromeric regions of cells without any complicated procedures.
In addition, we found differences in the FISH signal fluorescence intensity of spots on the two homologous chromosomes. The centromeric region is associated with a large number of 171-bp tandem-repeat alpha satellite DNA, and the number of repeats is different among individuals (Waye and Willard 1987). Therefore, it is easy to hypothesize that the difference in the fluorescence intensity of hybridization spots represents the difference in the number of repeats between two homologous centromeric spots in a nucleus. It follows that differences in the FISH signal fluorescence intensity of spots on the two homologous chromosomes in the nucleus may be due to the origin of its chromosome, for example, paternal and maternal chromosome 7. In this way, analysis of FISH signal fluorescence intensity may be useful in identifying the parental origin of chromosome homologs.
This novel image cytometry method for measuring the intensity of FISH spots in relation to the cell cycle adds new knowledge to the relationship between chromosomes and the cell cycle and has the potential to provide insight into the relationship between gene expression and gene replication timing with high efficiency. FISH analysis of chromosomes allows for measurement of differences in the gene amplification of each chromosome. Moreover, as we observed in our study, we were able to visualize differences between the maternal and paternal chromosomes using FISH spot analysis. In this way, the technique can be used to determine chromosomal abnormalities in specific chromosomes and identify the homologous chromosome causing the genetic disease. As far as we know, this is the first report to describe a method using image cytometry that allows for the measurement of the fluorescence intensity of FISH signals in relation to the cell cycle.
Footnotes
Declaration of Conflicting Interests
The author(s) declared no potential conflicts of interest with respect to the research, authorship, and/or publication of this article.
Funding
The author(s) received no financial support for the research, authorship, and/or publication of this article.