
Abstract
Computer-assisted analysis of DNA ploidy and nuclear morphology were used to elucidate changes in the cell nucleus that occur during the development of experimental pancreatic cancer. Ductal pancreatic adenocarcinoma was induced in 49 Syrian hamsters by SC injection of N-nitrosobis (2-oxopropyl) amine; twenty hamsters served as controls. Groups of animals were sacrificed every 4 weeks for 20 weeks and adjacent sections of pancreatic tissue were H&E and Feulgen-stained for light microscopy and computer assisted cytometry. Pancreatic ductal cells were classified as normal, atypical, or malignant; tissue inflammation (pancreatitis) was also noted when present. DNA ploidy and nuclear morphology evaluation (Markovian analysis) identified an atypical cell stage clearly distinguishable from either normal or malignant cells; pancreatitis preceded this atypia. The DNA ploidy histogram of these atypical cells revealed a major diploid peak and a minor aneuploid peak. The receiver operator characteristic curve areas for a logistic regression model of normal vs atypical cells was 0.94 and for atypical vs malignant was 0.98, numbers indicative of near-perfect discrimination among these three cell types. The ability to identify an atypical cell population should be useful in establishing the role of these cells in the progression of human pancreatic adenocarcinoma.
Keywords
T
Materials and Methods
Experimental Protocol
Eight-week-old female Syrian golden hamsters were divided into an experimental group of 49 and a control group of 20 animals. All animals were housed in a sealed room and offered hamster chow and water ad libitum. The experimental animals were given 10 mg/kg BOP SC each week for 20 weeks (Pour et al. 1977a,b). The control animals were given identical volumes of saline SC. Six experimental and two control animals were sacrificed each week for 20 weeks; all remaining animals were sacrificed at 22 weeks. After sacrifice (IP pentobarbital), the entire pancreas with associated tumors was removed and the peritoneal cavity was inspected for nonpancreatic tumors.
Tissue Preparation
A portion of the splenic and duodenal pancreatic segments were frozen. The remainder were placed in 10% buffered formalin for 24 hr and then prepared for light microscopy, deoxyribonucleic acid (DNA) analysis, and Markovian analysis using the CAS 200 computerized microscope (Becton Dickinson; Mountain View, CA) to determine surrogate end-point biomarkers (Pressman 1976; Bacus and Grace 1987; Linder et al. 1995; Dawson et al. 1993). In all cases, tissue from the most abnormal-appearing portions of the pancreas was sampled. Five-μm tissue sections were stained with H&E and evaluated for evidence of morphological abnormalities. Feulgen stains were prepared from the section of each block of tissue immediately adjacent to the H&E-stained section and used for DNA measurements and Markovian analysis.
Histology
Normal pancreatic ducts were lined by a single epithelial layer ranging from low cuboidal to tall columnar cells. The criterion for hyperplasia in this study was ductal epithelium two or more layers thick without atypia. Ductal atypia was defined as cellular loss of polarity and/or nuclear changes of hyperchromatism, irregularity of nuclear membrane, and an increased nuclear:cytoplasmic ratio. The term “carcinoma in situ” was used to describe atypia in hyperplastic ductular epithelium, and invasive disease was described as adenocarcinoma.
DNA Measurements and Markovian Analysis
The nuclei of Feulgen-stained cells were evaluated for DNA ploidy and for a specific array of morphometrical characteristics, including 26 size, shape, and texture features, using a Cell Measurement Program (Cell Analysis Systems; Elmhurst, IL) combined with the CAS 200 (Pressman 1976; Bacus and Grace 1987; Dawson et al. 1993). A total of 100–200 nuclei with clear boundaries appearing to have no loss of membrane integrity were identified for analysis from each tissue sample. Measurements were made using a magnification of X60 with 560-nm monochromic light. This analysis configuration permits operator-dependent selection and measurement of DNA content and morphological features for each cell. This interactive cell measurement system was calibrated before each analysis session using a slide of rat hepatocytes with known DNA content (Cell Analysis Systems). The data generated were downloaded to standard software packages for final analysis.
Multiple Logistic Regression and Receiver Operating Characteristics
The Markovian texture features were evaluated for relevance using backwards stepwise logistic regression analysis (SAS System software version 6.10). The resulting models were evaluated for discriminatory power (AccuRoc software; Accumetric, Montreal, Canada) by receiver operator characteristic (ROC) curves for continuous variables (Veltri et al. 1994). The area under an ROC curve can range from 0.5, indicating discrimination no better than random selection, to 1.0, which corresponds to perfect discrimination between groups of cells (i.e., normal compared to atypical cells, atypical compared to cancer cells).
Results
Pathology
Control animals, given only the carrier for BOP (saline), demonstrated normal pancreatic histology throughout the 22-week study period. In contrast, chronic pancreatitis was found in three of the six animals studied after 4 weeks of BOP administration (Table 1). Two of the three with pancreatitis also had ductal hyperplasia and the other was found to have ductal atypia. There were no detectable abnormalities in the pancreatic tissue from the other three hamsters of this 4-week group. At 8 weeks, the group response induced by the carcinogen was found to be similar to the response of the 4-week group in that three of the six hamsters had developed chronic pancreatitis and the pancreatic tissue from the remaining three was normal. However, evaluation of the tissue from one of the three affected hamsters revealed invasive, focal, ductal adenocarcinoma occurring concomitantly with an area of ductal atypia in the opposite pancreatic lobe.
The cell profile of the BOP-challenged animals significantly changed over the next 4 weeks. After 12 weeks all six animals were afflicted with chronic pancreatitis (Table 1). Ductal adenocarcinoma in situ was also found in one of these animals, and ductal atypia had developed in three of this group. After 16 weeks of exposure to BOP, chronic pancreatitis accompanied by invasive ductal adenocarcinoma was histologically established in all of the animals. Lymph node involvement occurred in one animal. In addition, ductal atypia was detected in the opposite lobe of three of the hamsters.
Temporal histological classification of pancreatic tissue collected from BOP-challenged hamsters removed from the study group at 4-week intervals
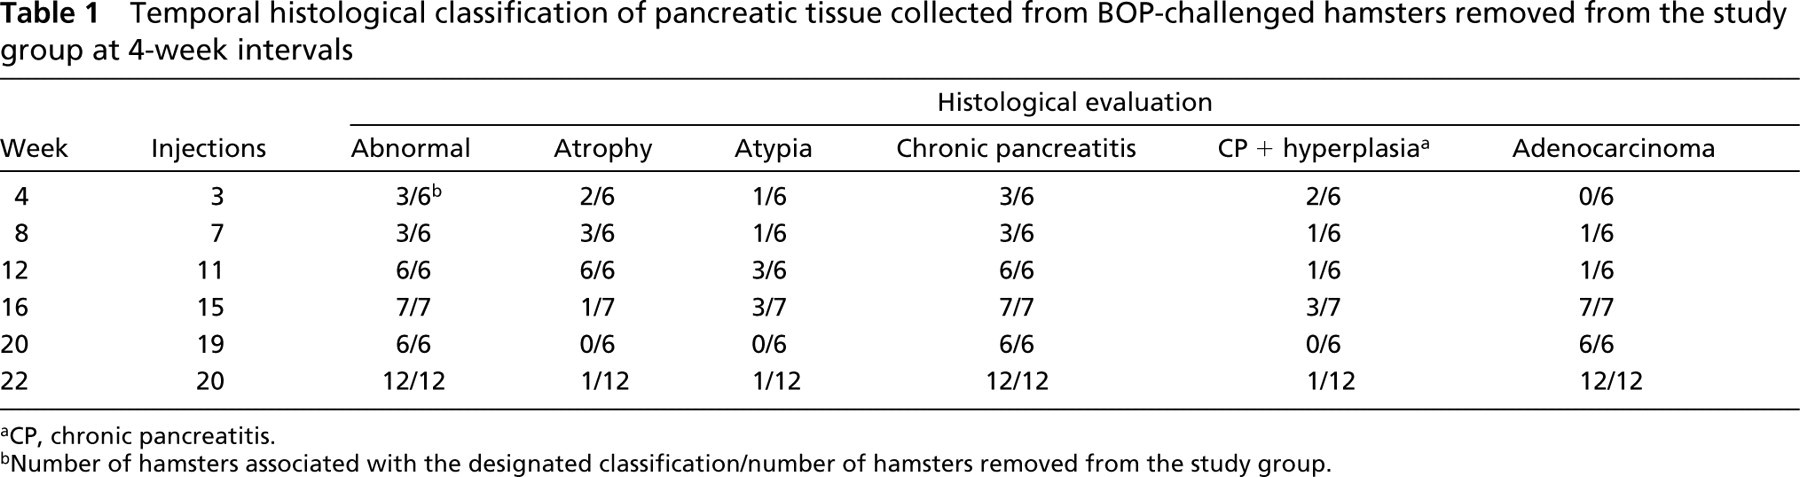
aCP, chronic pancreatitis.
bNumber of hamsters associated with the designated classification/number of hamsters removed from the study group.
Chronic pancreatitis and ductal adenocarcinoma were observed in the tissue taken from every animal in the groups exposed to BOP for 20–22 weeks before tissue collection (Table 1). An additional focus of ductal atypia was found in the pancreas of one animal at this time point. Chronic pancreatitis was first detected after 4 weeks of exposure to BOP and was present in all animals at 12 weeks; this condition persisted in all animals throughout the 22 week study. Ductal atypia and hyperplasia were initially observed at 4 weeks and were recurrent and associated with in situ and invasive ductal adenocarcinoma in a portion of the animals from the eighth through the twenty-second week. Invasive ductal adenocarcinoma was present in all animals beginning at the sixteenth week of BOP exposure.
Description of Histopathology
Representative pancreatic tissue from hamsters that were not challenged with BOP is shown in Figure 1A. The acini are normal and back-to-back, and the small duct is lined with a low cuboidal epithelium and is normal. The tissue in Figure 1B is typical of the chronic pancreatitis induced by BOP in this study, presenting with acinar loss, chronic inflammation, and the presence of ductal ectasia. The tissue classified as atypical hyperplasia is shown in Figure 1C. This pancreatic tissue was characterized by hyperplasia of ductal epithelium, as manifested by crowding of the nuclei, many mitotic figures, and mild hyperchromasia. Pancreatic adenocarcinoma from hamsters administered BOP is shown in Figure 1D. The micrograph representing this tissue is distinguished by the presence of a nodule of poorly differentiated ductal carcinoma and malignant cells that are jumbled and crowded with irregular hyperchromatic nuclei. Interestingly, these cells are surrounded by fibrosis and inflammation.
DNA Content
The pancreatic tissue from all control animals throughout the 22-week experimental protocol generated normal DNA histograms (Figure 2A), consistent with the benign histological evaluation (Figure 1A). Pancreatic ductal cells from animals challenged with BOP that appeared normal by light microscopy also had normal distributions of DNA mass. Significantly, eight of nine animals with BOP-induced ductal atypia (Figure 1C) were found to have an aneuploid peak in the near diploid region (Figure 2B), and three of these had an elevated G2/M-phase proliferative fraction. No hyperploid cells were detected in this group of animals. All 27 of the animals with ductal adenocarcinoma (Figure 1D) were found to have higher peaks, more aneuploid peaks, or both (Figure 2C) than the animals with ductal atypia. Hyperploid cells (>5C) were detected in five of the 27 adenocarcinomas.
Markovian Analysis
Multiple logistic regression with backward stepwise elimination of variables was used to determine a subset of the 26 Markovian texture features (Table 2) which best discriminated between normal and atypical cells and between atypical and malignant cells from hamster pancreatic tissue. The criterion for elimination of features was p>′0.10. Contrasting the normal and atypical cells revealed a combination of 14 of the features that significantly discriminated between the types (Table 2). Figure 3A demonstrates that the area under the ROC curve corresponding to the resulting model was 0.94 (95% CI, 0.92–0.97). The possible range is 0.5–1.0, with 1.0 being perfect discrimination between groups of cells and 0.5 being discrimination no better than random selection. A combination of 17 of the features was found to discriminate between the atypical and malignant pancreatic cells (Table 2). The area under the ROC curve for these cells was 0.98 (95% CI, 0.97–0.99), as shown in Figure 3B. These numbers are highly significant and discriminatory, demonstrating distinct morphological differences between normal and atypical cells and between atypical and malignant cells in this hamster model of BOP-induced pancreatic cancer.
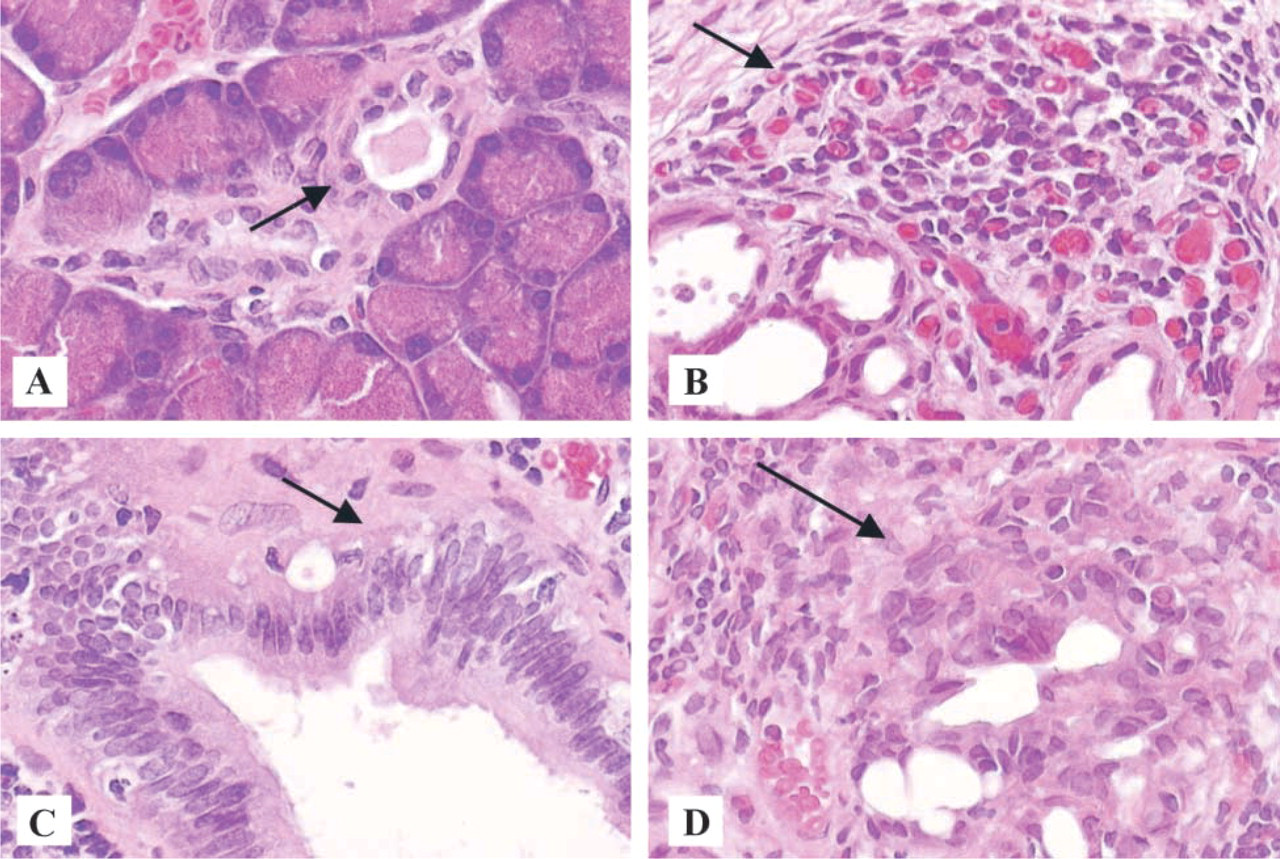
Representative histopathology of normal pancreas duct and acini (
Discussion
In this study we have evaluated a BOP-elicited premalignant lesion in the Syrian hamster pancreatic adenocarcinoma model. This lesion contains atypical ductal cells as observed by light microscopy, and a DNA histogram that shows an aneuploid peak in the near diploid range with an elevated G2/M-phase proliferative fraction. Pancreatic cancer in humans and in BOP-treated hamsters is believed to arise from pancreatic ductal cells in a progression from cellular atypia to adenocarcinoma (Alborea-Saavedra et al. 1994; Milchgrub et al. 1992; Sugio et al. 1996). These atypical cells can clearly be distinguished from both normal cells and malignant cells by Markovian analysis and most likely represent an intermediate or premalignant neoplastic stage of adenocarcinoma development. It is noteworthy that pancreatitis was detected in 50% of the animals at 4 weeks after BOP administration and was present in all animals from 12 weeks to the end of the study. This suggests a causal relationship between pancreatitis and the development of cellular atypia. These results demonstrate that computer-assisted cytometry can delineate the nuclear morphology and DNA ploidy abnormalities that arise in association with an intermediate lesion in the development of pancreatic adenocarcinoma. Such analyses have advantages over standard light microscopy in that they are less affected by observer subjectivity and more amenable to high-throughput screening. These Markovian and DNA analyses in the hamster complement molecular studies demonstrating K-ras mutations in this same hamster model (Fujii et al. 1990; Tsutsumi et al. 1993; Chang et al. 1995, Sugio et al. 1996; Yokomatsu et al. 1996, Majima et al. 1997). K-ras involvement in pancreatic cancer has been further implicated by studies using the transplantation of BOP-challenged hamster islet culture cells into hamsters. The ductal adenocarcinomas that were formed in the hamsters all had K-ras mutations accompanied by chromosome damage (Schmied et al. 1999). Studies in human colorectal neoplastic polyps and colorectal adenocarcinoma have shown that K-ras mutations occur early and are seen in neoplastic polyps, whereas p53 mutations commonly occur later in invasive adenocarcinoma (Fearon and Vogelstein 1990). Elevated p53 expression (which is indicative of p53 mutation) was also observed late in dysplastic progression and adenocarcinoma in Barrett esophagus, whereas p21WAF1/CIP1 expression appeared early and was sustained throughout the progression (Hanas et al. 1999). These same phenomenona may also occur in pancreatic adenocarcinoma. Human pancreatic tumors are known to contain mutations in the ras gene (Finkelstein et al. 1994; Kondo et al. 1994), and the p53 gene (Casey et al. 1993; Simon et al. 1994), as well as DNA ploidy abnormalities (Shyr et al. 1999). Interestingly, although K-ras mutations have been observed in human chronic pancreatitis (Yanagisawa et al. 1993), p53 mutations were not observed in chronic pancreatitis but were commonly observed in pancreatic cancer (Casey et al. 1993). Analysis of K-ras point mutations in pancreatic juice can be a reliable diagnostic indicator of pancreatic and biliary tract carcinomas (Yamashita et al. 1999). Abnormalities in DNA mismatch repair genes, such as hMLH1 and hMSH2, are seen in more than 90% of hereditary nonpolyposis colorectal cancers and are believed to constitute an initial abnormality that facilitates mutations in other genes and leads to adenocarcinoma development (Fishel et al. 1993; Papadopoulos et al. 1994). These mutations may also be occurring during the progression of pancreatic tumors. Determination of the genetic abnormalities in the pre-malignant neoplastic lesion, as identified by Markovian and DNA ploidy analysis, will help elucidate adenocarcinoma development in this hamster model.
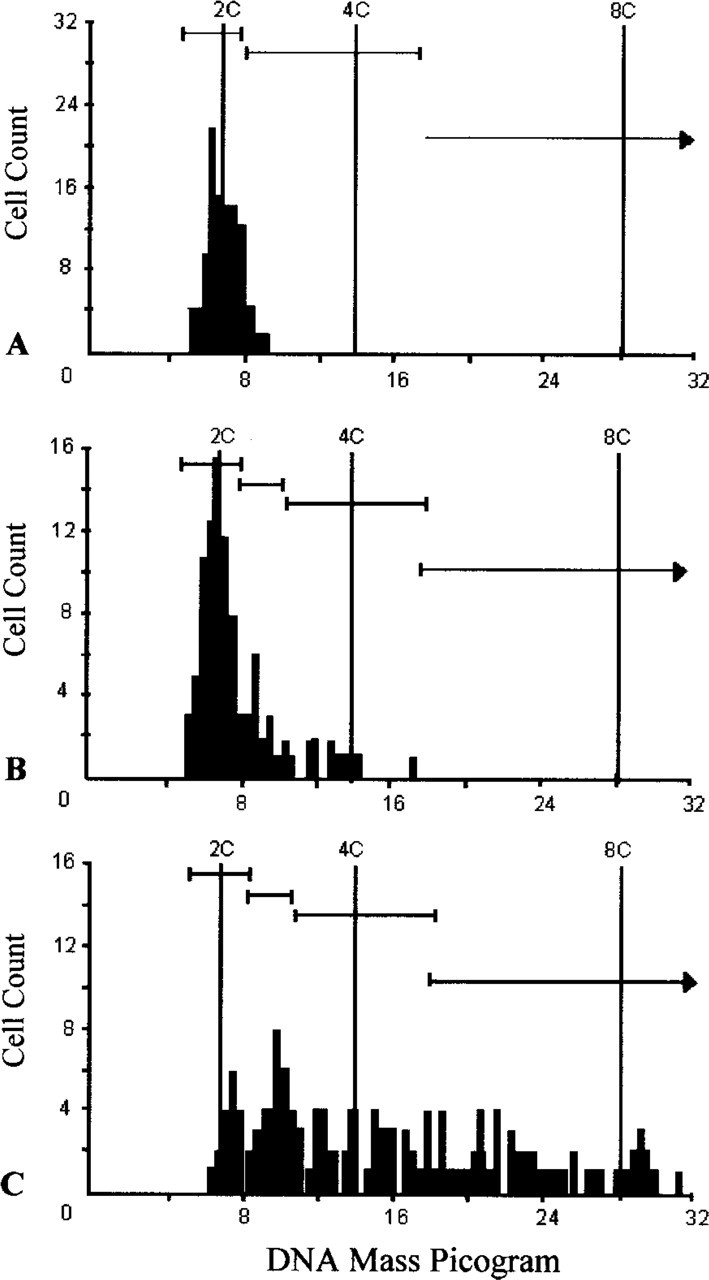
Representative DNA histograms generated by a CAS 200 computer-assisted cytometer of normal (
Markovian texture features measured to determine significant differences between nuclei comparing normal, typical, and cancer cells a
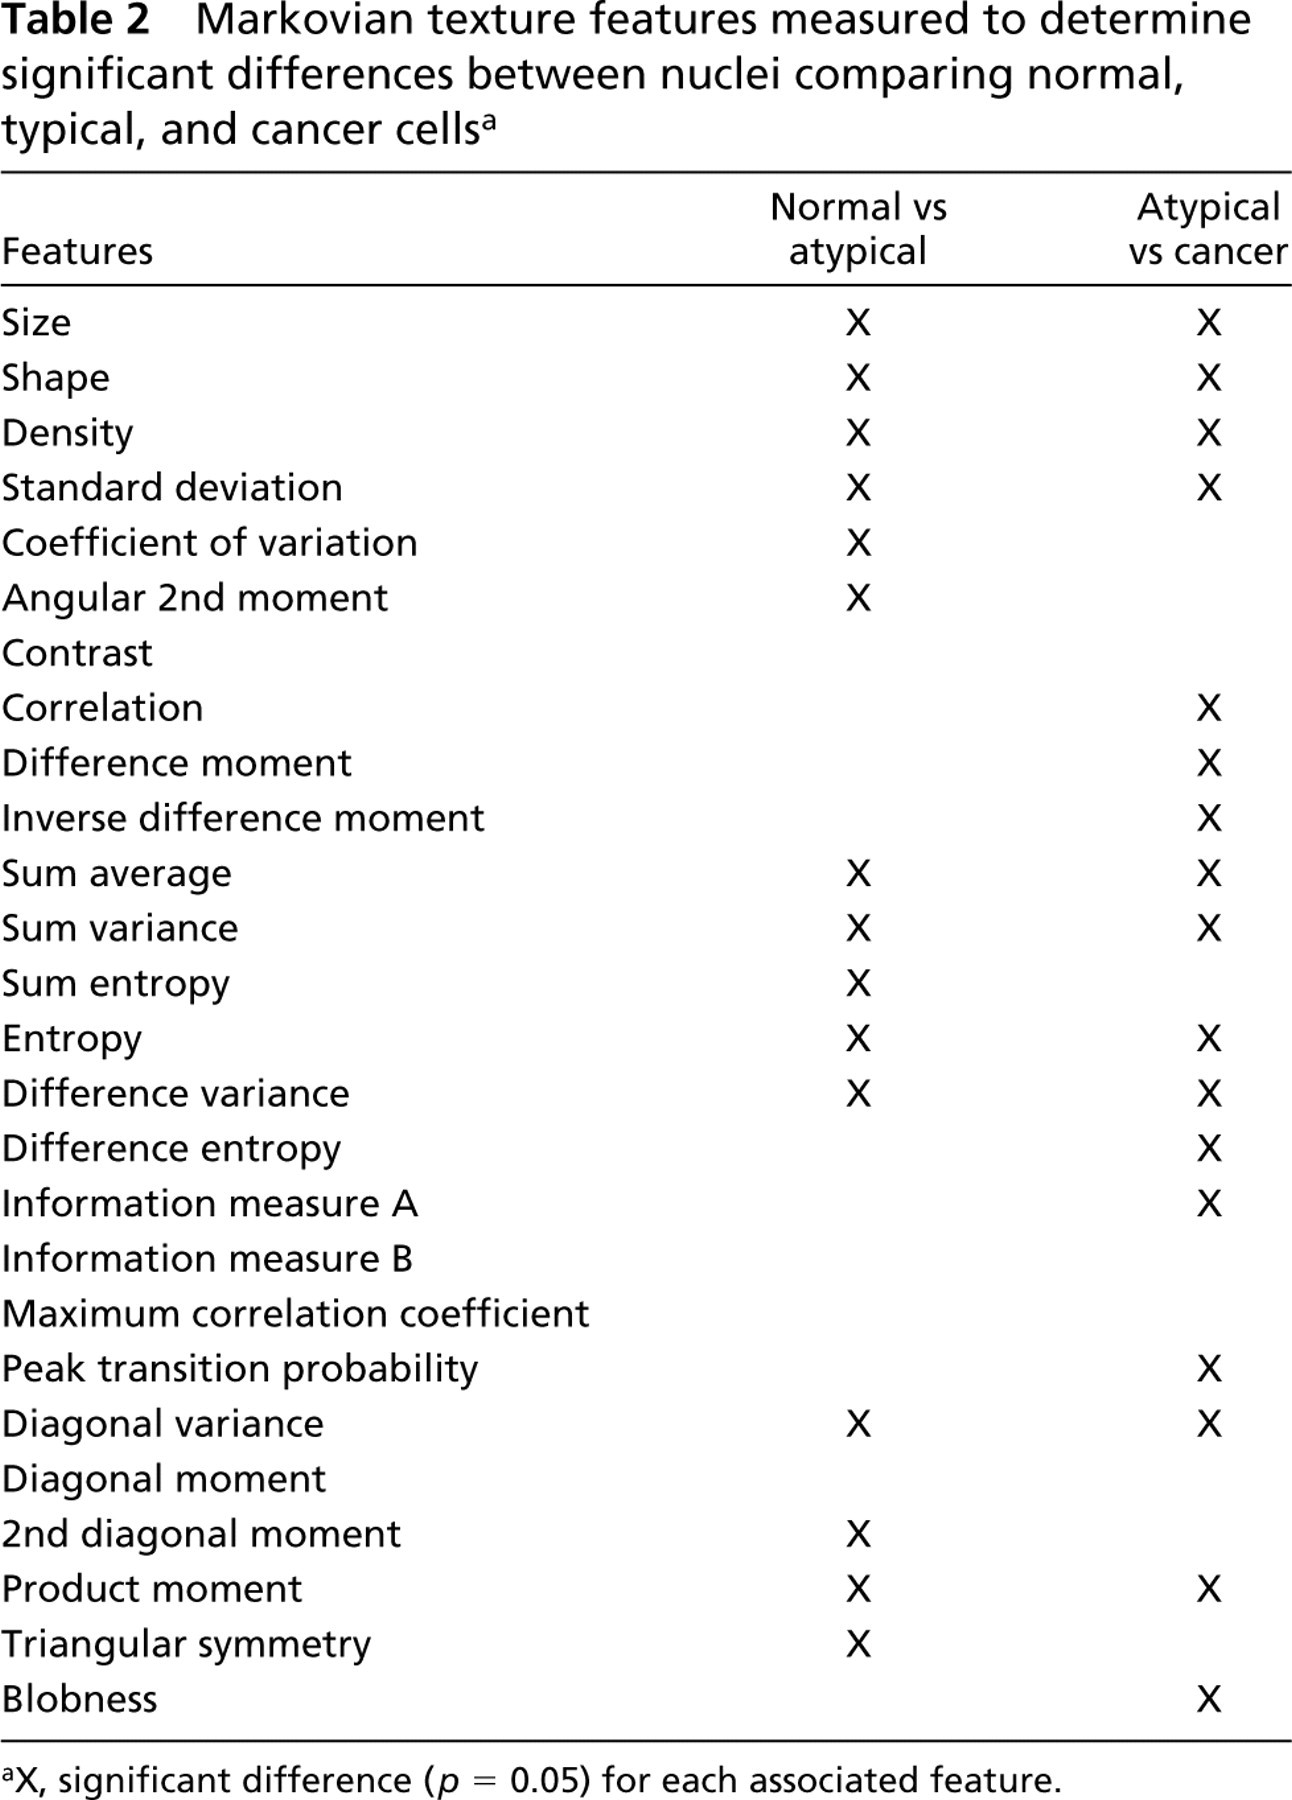
aX, significant difference (p = 0.05) for each associated feature.
Recent studies in hamster pancreatic adenocarcinoma cell lines have generated data demonstrating that p16, a tumor suppressor gene, and the associated p15 gene are homozygously deleted in these lines, implying that these deletions may be important in hamster tumorigenesis (Muscarella et al. 2001). This offers further evidence that the hamster pancreatic cancer model may yield mechanistic data relative to the human disease because these deletions are also found in human pancreatic adenocarcinomas and cell lines (Naumann et al. 1996; Kaino 1997; Capella et al. 1999).
Studies in humans have shown that pancreatic ductal cells retrieved either at endoscopic retrograde pancreatography or by duodenal intubation techniques and evaluated for cytologic abnormalities or the presence of mutations in the K-ras gene can be used to diagnose pancreatic cancer (Watanabe et al. 1993; Nakaizumi et al. 1995). The Markovian analysis results derived from the present study indicate that this technology should be helpful in these types of discriminations. In addition, a careful evaluation of oncogenes including K-ras, tumor suppressor genes, and DNA repair genes, combined with DNA ploidy and Markovian analysis, may lead to a diagnostic strategy to detect the premalignant state of pancreatic cancer and to determine which abnormalities are present early in this experimental premalignant neoplastic lesion.
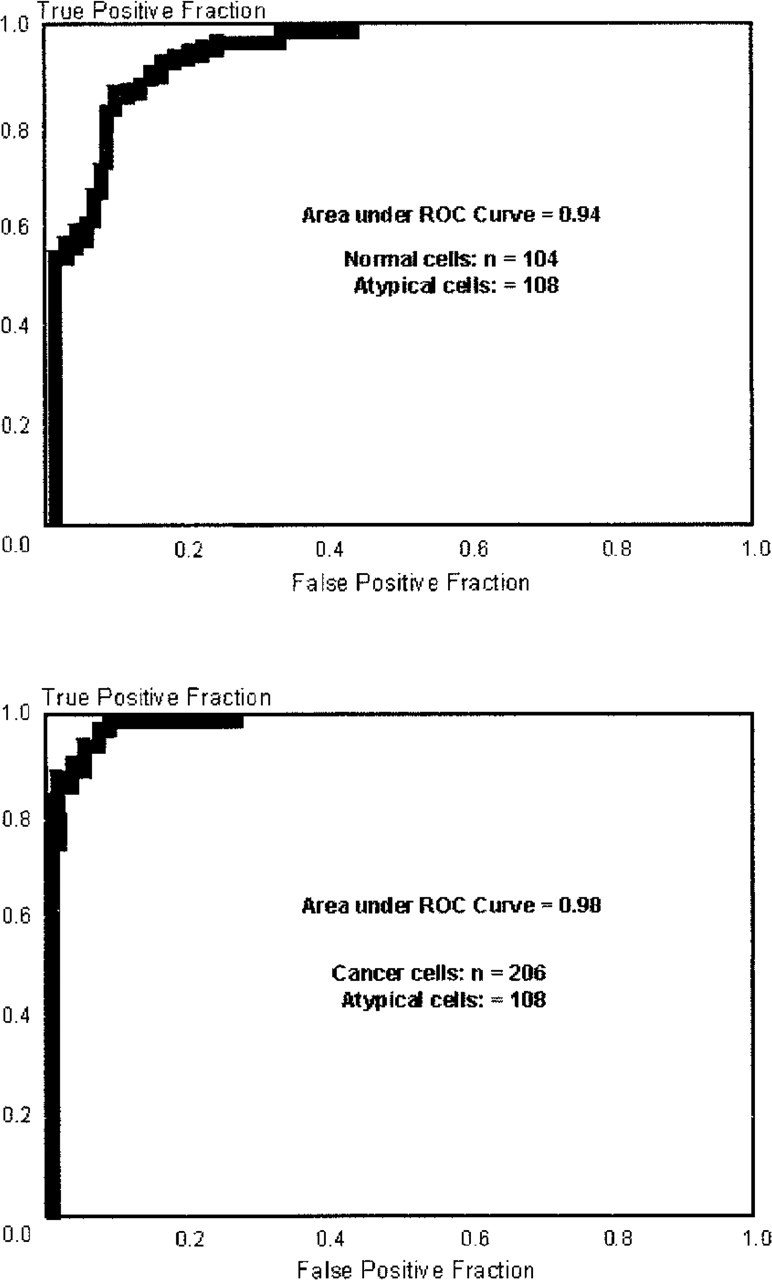
Receiver operator curves demonstrating distinct morphological differences between normal pancreatic cells collected from control hamsters and atypical pancreatic cells from hamsters challenged with BOP (
Footnotes
Acknowledgements
Supported by the Presbyterian Health Foundation, the Department of Veterans Affairs Medical Research Service, and the University of Oklahoma Department of Surgery Research Funds.