
Abstract
AgNORs are nucleolar proteins that interact specifically with silver salts. The size of silver precipitates measured by image analysis (ICM) in cycling cells proved to be inversely proportional to the cell cycle time and provided a significant correlation with prognosis for a large spectrum of cancers. Because ICM is time-consuming and poorly reproducible among laboratories using different imaging settings, this article presents a new approach to AgNOR quantitation based on flow cytometry (FCM). We report that silver precipitates caused a great decrease in the forward scattered light and that this effect was correlated with the AgNOR's relative area as measured by ICM. These results were confirmed by measuring cell lines having different cell cycle durations. Moreover, double staining using APase–Fast red fluorescence to reveal the Ki-67/MIB 1 antigen of cycling cells and silver nitrate to stain the AgNORs was successfully analyzed by FCM. The procedure makes it possible, for the first time, to validly and rapidly compare the growth fraction and cycling speed of partially proliferating cell populations, such as tumors.
Keywords
I
Two methods are now in use for AgNOR quantitation. The first consists of counting the number of silver-stained dots per nucleus. The second consists of automatic or semiautomatic measurement of the area occupied by the silver-stained structures per nucleus by computer-assisted image analysis (ICM) (Trerò 2000). However, counting proved to be poorly reproducible (Trerò et al. 1995) and imaging suffered from the limited number of analyzed cells and poor inter-laboratory reproducibility. Moreover, the tumor-to-tumor comparison of the AgNOR size should concern only the cycling cells, as emphasized by Bigras et al. (1996), thus making it necessary to use an additional marker for the cells in cycle, such as the KI-67/MIB1 antigen revealed by immunochemistry.
The aim of this study was to develop a new approach to AgNOR measurement based on flow cytometry (FCM). Silver-stained dots introduce into the organic environment of the cell a refractive index heterogeneity and are therefore expected to alter the scattered light pattern, such alteration being as pronounced as the volume of silver-stained dots is high. Combined with a marker of the cell cycle, the flow cytometry of AgNORs should then become a method of choice for the assessment of cell proliferation activity in advanced and routine pathology.
Materials and Methods
To investigate the effect of silver precipitates on the scattered light, cells were treated by the usual procedure described by Ploton et al. (1986) with (treated cells) or without (control cells) silver salts. The effect of silver precipitates was measured as the difference of the intensity of the forward scattered light between treated and control cells. To compare results obtained by FCM and results obtained by ICM and to verify the usual correlation between AgNOR area and cell cycle time, the experiments were performed on three different mammary cell lines (MCF-7, T47-D, and ZR 75-30) having different doubling times, which were 29.8 hr, 38 hr, and 150 hr, respectively. MCF-7 and T47-D cell lines were cultured in DMEM medium complemented with 10% fetal calf serum (FCS),
For FCM analysis, well-dispersed cells were fixed in 1% paraformaldehyde in PBS for 2 min at room temperature (RT) and then diluted in PBS. Fixed cells were precipitated by centrifugation for 10 min at 1000 × g, then dispersed and fixed again in glacial methanol for 10 min at −20C. The fixation solution was progressively diluted in PBS and centrifuged for 10 min at 1000 × g. The pellet was washed two times in PBS and finally suspended in PBS 3%–BSA 1%–Tritton X-100 (Solution A) at a final concentration of 1 million cells per milliliter. After 10 min of blocking incubation, MIB1 antibody was added at a dilution of 1:50 and incubated for 1 hr at RT. After two washes in Solution A, the GAM–alkaline phosphatase (APase) was added at a dilution of 1:50 in Solution A and incubated for 1 hr at RT. An aliquot of control cells was incubated only with the GAM–APase. All antibodies used were supplied by Immunotech (Marseille, France). The APase reaction was performed at RT for 8 min with the kit FR/Naphthol AS-MX (Sigma; Saint Quentin Fallavier, France). When cells were not stained for Ki-67/MIB1 detection, propidium iodide (PI) was incorporated by incubating fixed cells for 30 min in a solution of PBS, 10 μg/ml of PI, and 1 mg/ml of RNase A. For AgNOR staining, cells were washed two times in H2O UP and the pellet was suspended in 120 μl of a solution of 200% Ag(NO3) in H2O UP (Sigma) and transferred to 60 μl of a solution of 2% gelatin in 1% formic acid. After 12 min at 37C in the dark, 10 ml of H2O UP was added and slowly agitated for 10 min at RT in the dark. Cells were then precipitated, washed once in 5 ml of H2O UP for 10 min, precipitated, and suspended in 1 ml of PBS–5% sodium thiosulfate. For controls, fixed cells were suspended directly in PBS–5% sodium thiosulfate.
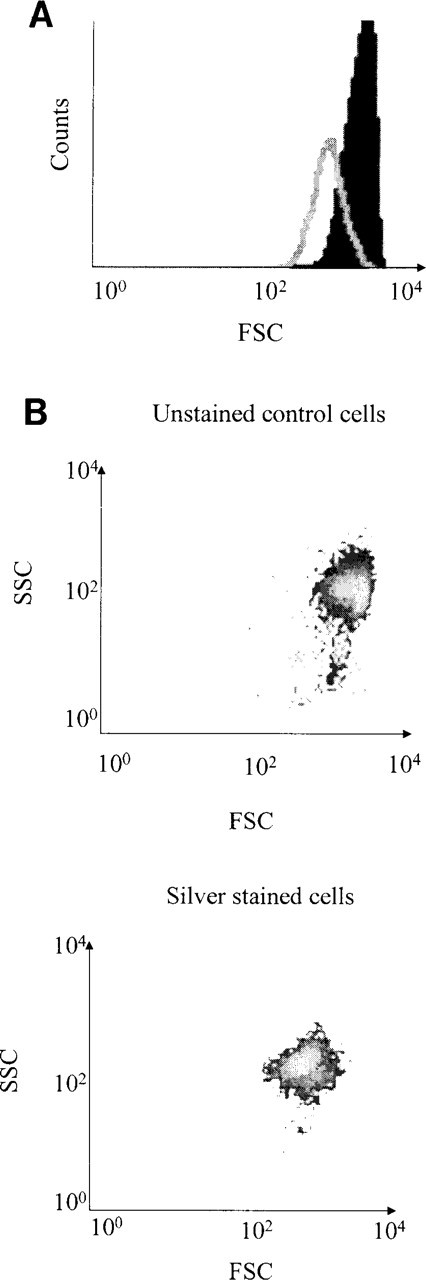
Effect of silver staining in the forward scattered light using the T47-D cell line. (
For ICM analysis, cell fixation and staining were carried out as described by Canet et al. (in press). Conditions for fixation and silver staining were exactly the same as those for cell suspension described above.
FCM was performed using a FACscan system (Becton–Dickinson; San Jose, CA) managed by CellQuest software (Becton–Dickinson). Acquisition was carried out on 5000 to 10, 000 events and was restricted to a gap defined with the double parameter FL2-A and FL2-W density dot-blot to exclude impurities. Briefly, PI fluorescence was detected by the FL2 captor and signal was treated for its intensity value (FL2-A) and its duration (FL2-W). As a consequence, for a given intensity, a single cell had a lower FL2-W value than an aggregate. FL3 captor was used for MIB1-stained cells. For each cell line, one silver-stained and one unstained control population was measured. The forward (FSC) and side (SSC) scatter channels were calibrated with the control cells and the same settings were used during acquisition of the silver-stained cells. The difference between the FSC of the control cells and that of the silver-stained cells was selected as representative of the AgNOR quantity. The experiments, from staining to measurement, were performed three times for each culture bath to calculate the average effect of Ag-NORs on FSC and the standard deviation.
ICM was performed as described by Canet et al. (2001) using a SAMBA 2005 system (SAMBA Technologie; Meylan, France). Briefly, for each slide, 300 cells were measured with a ×40 oil immersion objective for each culture bath. The AgNOR relative area (AgNOR area divided by nuclear area) was selected as representative of the AgNOR quantity.
Results
Before FAC acquisition, the staining was verified by microscopy (data not shown). We could observe the expected AgNOR silver staining specifically localized in the nucleolus. Figure 1 shows the FCM results obtained with the T47-D cell line. The FSC plotted against the SSC showed that both the control and the stained cell populations were homogeneous (Figure 1B). The mean value of the intensity in the FSC, evaluated by statistical analysis, was 1445 for the control cells and 616 for the silver-stained population (Figure 1A). Therefore, the AgNORs could be detected by a significant decrease in the FSC. As shown in Figure 2, the effect of silver staining on the FSC was linearly correlated (r 2 = 0.99) with the AgNOR relative area measured by ICM on the three different epithelial cell lines, MCF7, T47-D, and ZR-7530 (Figure 3). The coefficients of variation of the measurements were 51%, 65%, and 51%, respectively, by ICM compared to 13%, 15%, and 39%, respectively, by FCM. The FSC value obtained by FCM can therefore be considered as actually equivalent to the relative area of AgNOR, with a reproducibility better than that of ICM.
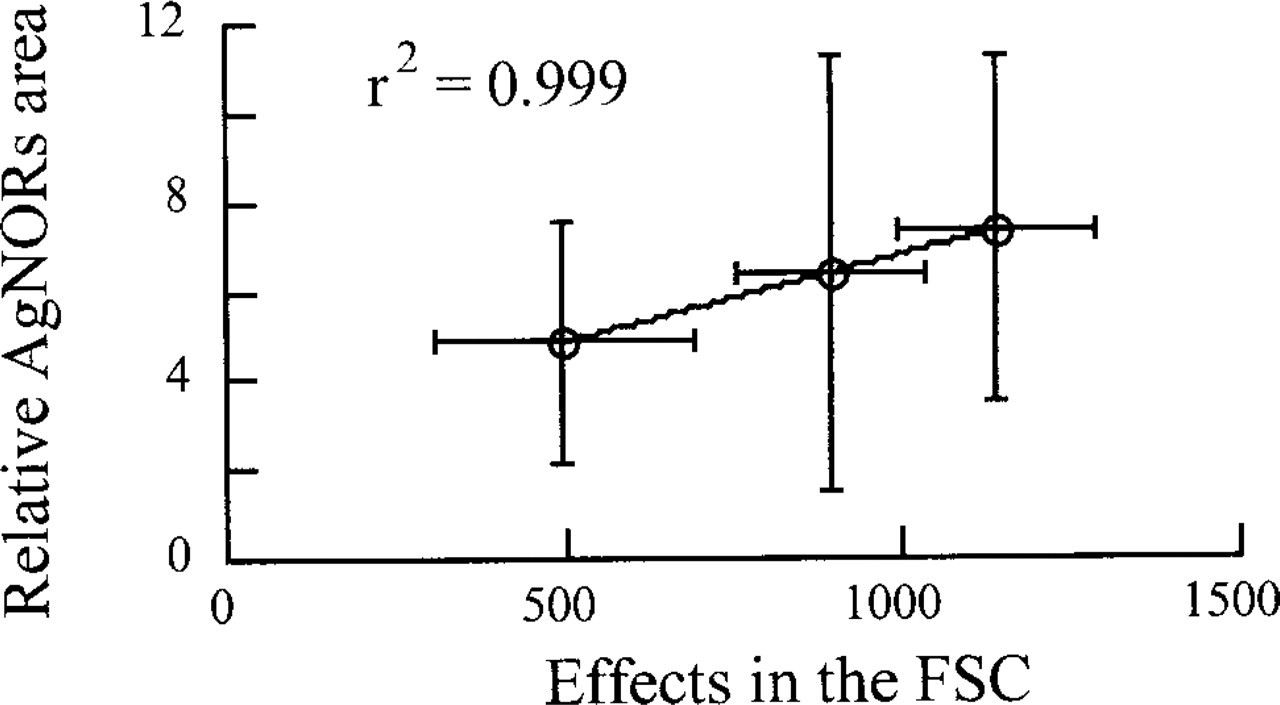
Comparison between the effect of silver staining in the FSC and the AgNOR relative area measured by ICM with the corresponding standard deviations.
Because AgNOR size has been shown by ICM to be negatively correlated with the cell doubling time, we verified whether similar results could be obtained by FCM using the FSC measurement. Figure 4 shows that the size of AgNORs measured by the FSC actually decreased as the cell population doubling time increased (r 2 = 0.94).
Unlike cells in culture, tumor cell populations are composed of cycling and non-cycling cells. Cycling cells are usually detected by Ki-67/MIB1 immunostaining (Gerdes and al. 1983). As shown Figure 5A, the red fluorescence of the Ki-67-MIB1–APase–Fast Red precipitate was detected in the FL3 channel, which detects wavelengths above 600 nm. Those cells with a fluorescence intensity lower or equal to that of the APase control cells were considered negative for Ki-67/MIB1. Interestingly, the APase–Fast Red precipitate did not interfere with the FSC measurement of unstained control cells because their respective histograms showed an obvious registration (Figure 5B).
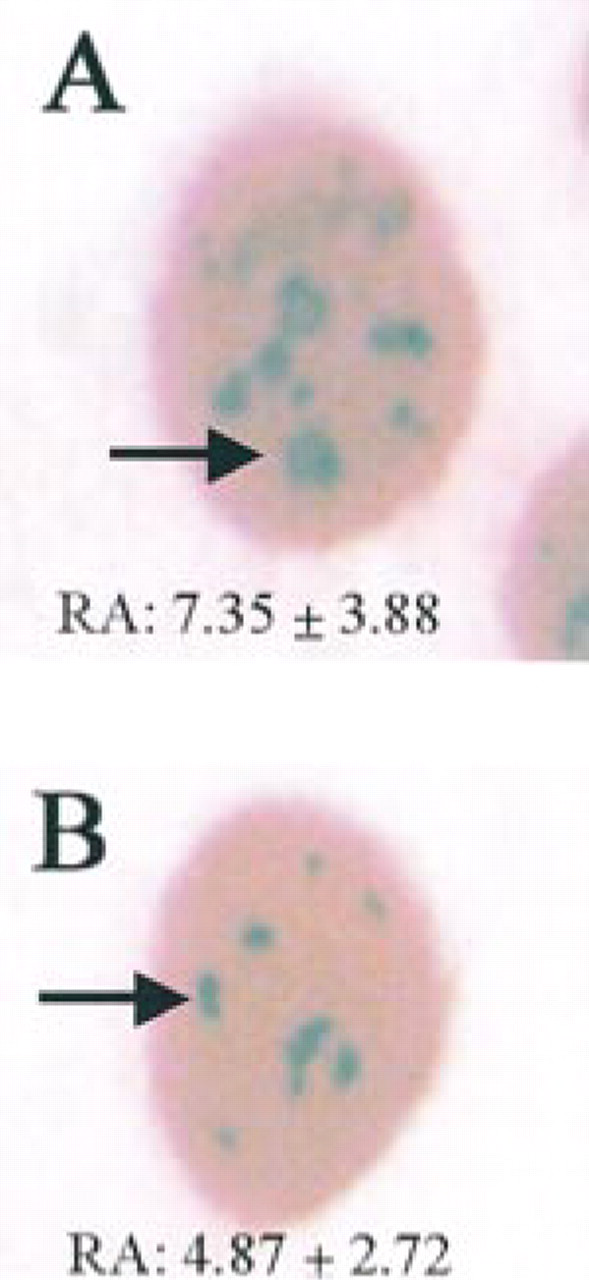
Example of MCF-7 (
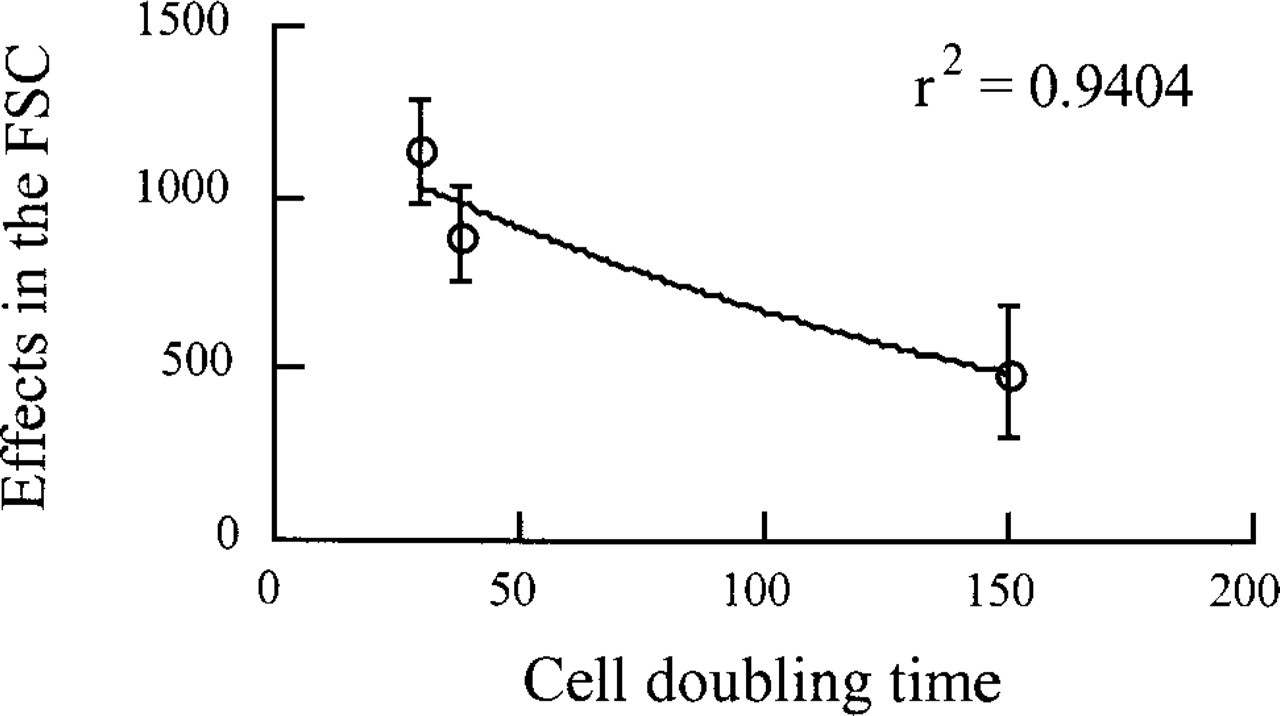
Correlation between effect of silver staining on the FSC and the cell doubling time with the corresponding SD.
Discussion
The results obtained in the experiments reported here suggest, for the first time, that the AgNOR size, which is conventionally measured by ICM on cycling cells, can also be measured by FCM.
Effects of Silver Precipitates on Scattered Light
It might be questioned whether the decrease in FSC actually results from the silver precipitates in the nucleolus or from any other structural alterations caused by the treatment. The controls showed that cells treated as silver-stained cells but with replacement of silver salts by H2O UP did not significantly decrease the FSC (data not shown). Moreover, the AgNOR relative area measured by ICM was linearly correlated with the effect of silver salts on the FSC. Given these observations, it can be concluded that the decrease in the FSC is equivalent to the AgNOR relative area measured by ICM. Mitsui (1992) reported that staining leukemia cells with silver nitrate at low concentration increased the SSC. This parameter was not selected in this study because it proved to be unstable (data not shown) and was known to be dependent on the shape and orientation of the scattering particles, unlike FSC.
Relevance of FCM vs ICM Measurements
The advantage of measuring AgNORs by FCM instead of ICM is a better representation of the results. In our experiments, ICM analysis was conventionally performed on 300 cells while three separate specimens, from staining to measurement and involving 5000 to 10, 000 cells each, were measured by FCM, and the analysis was less time-consuming. As reported, the CVs were on average three time better with FCM compared to ICM, and the representation was potentially improved because a much higher number of cells were analyzed. We noted that the CV between aliquots of one same experiment, from staining to measurement, was very similar to the CV between experiments (data not shown), thus indicating a satisfactory reproducibility of the AgNOR staining.
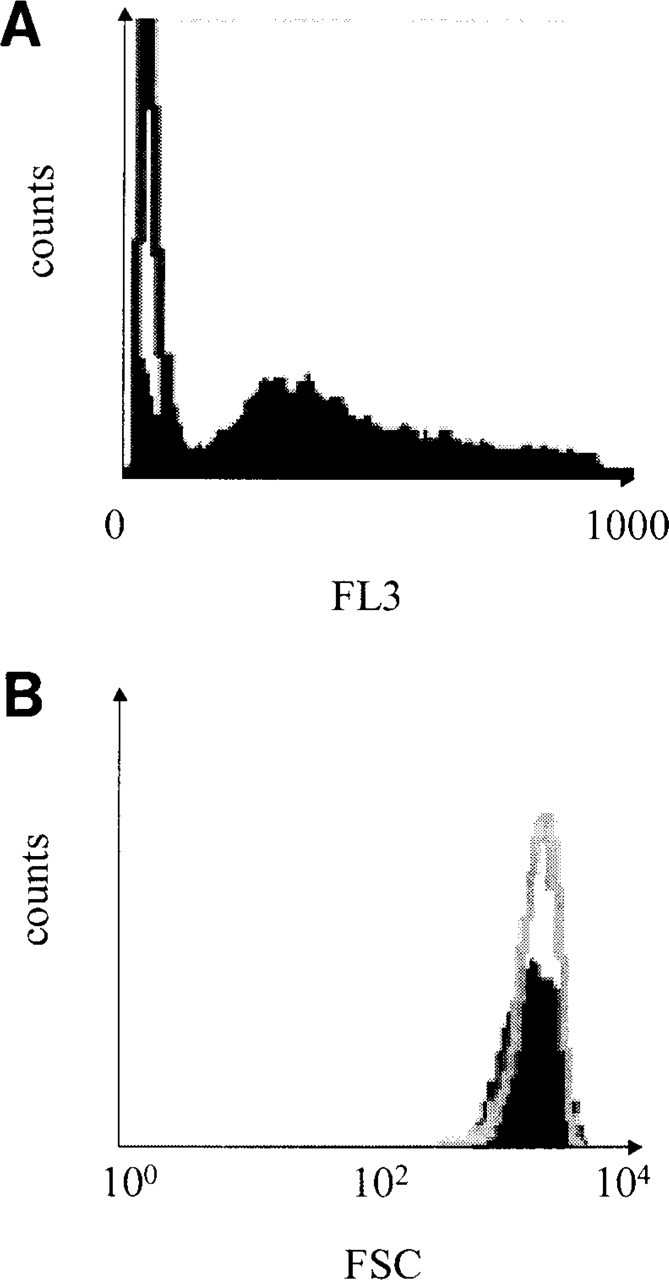
Ki-67/MIB1 staining with the APase–Fast Red procedure. (
Potential of FCM for Cancer Prognosis
It has been repeatedly reported that the AgNOR size is significantly greater in groups of patients with a short survival and/or relapse-free time (Pich et al. 2000). Much better correlations were obtained when Ag-NOR measurement concerned only the cycling cells, usually identified by marking with the Ki-67/MIB 1 antigen (Bigras et al. 1996; Lorenzato et al. 2000). Measuring both the fraction of cells in cycle (G) and the duration of the division cycle (T) is known to provide a complete and comprehensive assessment of proliferative activity in tumors defined as G∗1/T (van Diest et al. 1998). Until the present, quantitation of AgNORs has been performed exclusively by ICM, which is time-consuming, limited to a small fraction of the tumors, and poorly reproducible among laboratories using different imaging setups, and is therefore not in routine use. The FCM procedure reported here is a good candidate to support a standardized assessment of the cell proliferation status of tumors.