
Abstract
The accurate measurement of the morphological characteristics of cells with nonuniform conformations presents difficulties. We report here a straightforward method using immunofluorescent staining and the commercially available imaging program Adobe Photoshop, which allows objective and precise information to be gathered on irregularly shaped cells. We have applied this measurement technique to the analysis of human muscle cells and their immunologically marked intracellular constituents, as these cells are prone to adopting a highly branched phenotype in culture. Use of this method can be used to overcome many of the long-standing limitations of conventional approaches for quantifying muscle cell size in vitro. In addition, wider applications of Photoshop as a quantitative and semiquantitative tool in immunocytochemistry are explored.
Keywords
Accurate measurements of cell size and area are fundamental to the investigation of cellular growth and development in vitro. Cells of nonuniform shape obviously pose analytical and practical problems in trying to define their physical characteristics. In muscle cell research, the measurement of highly branching myotubes is particularly challenging (Sorci et al. 2003; Rouger et al. 2004; Yamamoto et al. 2008; Clow and Jasmin 2010); Table 1 summarizes many of these difficulties. A traditional method for measuring myotube size is the calculation of average myotube diameter derived from multiple measurements made along their length (Rommel et al. 2001; Jaquemin et al. 2004; Ohanna et al. 2005; Stevenson et al. 2005; Sotiropoulos et al. 2006; Trendelenburg et al. 2009; Morissette et al. 2009; Csibi et al. 2009; Fakhfakh et al. 2011; Garcia et al. 2011). While this technique may give an indication of dimension in cylindrical myotubes, it is incapable of dealing with the often irregular conformation of these cells in vitro (Maley et al. 1995; Huet et al. 2001; Jasmer and Kwak 2006; Zhu et al. 2007; Morgan et al. 2010). Furthermore, when a mix of myotube shapes is present, measuring only those with cylindrical forms is unrepresentative of the culture as a whole. Here, we describe an objective, planimetric method using immunofluorescence in combination with the commercially available and widely accessible imaging software Adobe Photoshop (CS5 Extended 12.0x32; Adobe Systems, San Jose, CA), which allows the accurate measurement of all myotubes in a micrograph, irrespective of morphology. We also extend its analytical potential to the measurement of the two-dimensional (2-D) myonuclear domain, area of labeled proteins in the nucleus, fluorescence intensity, and nuclear circularity. We believe that our approach is not technically challenging and has wide general utility that is not restricted to muscle cell research.
Difficulties in Myotube Size Analysis
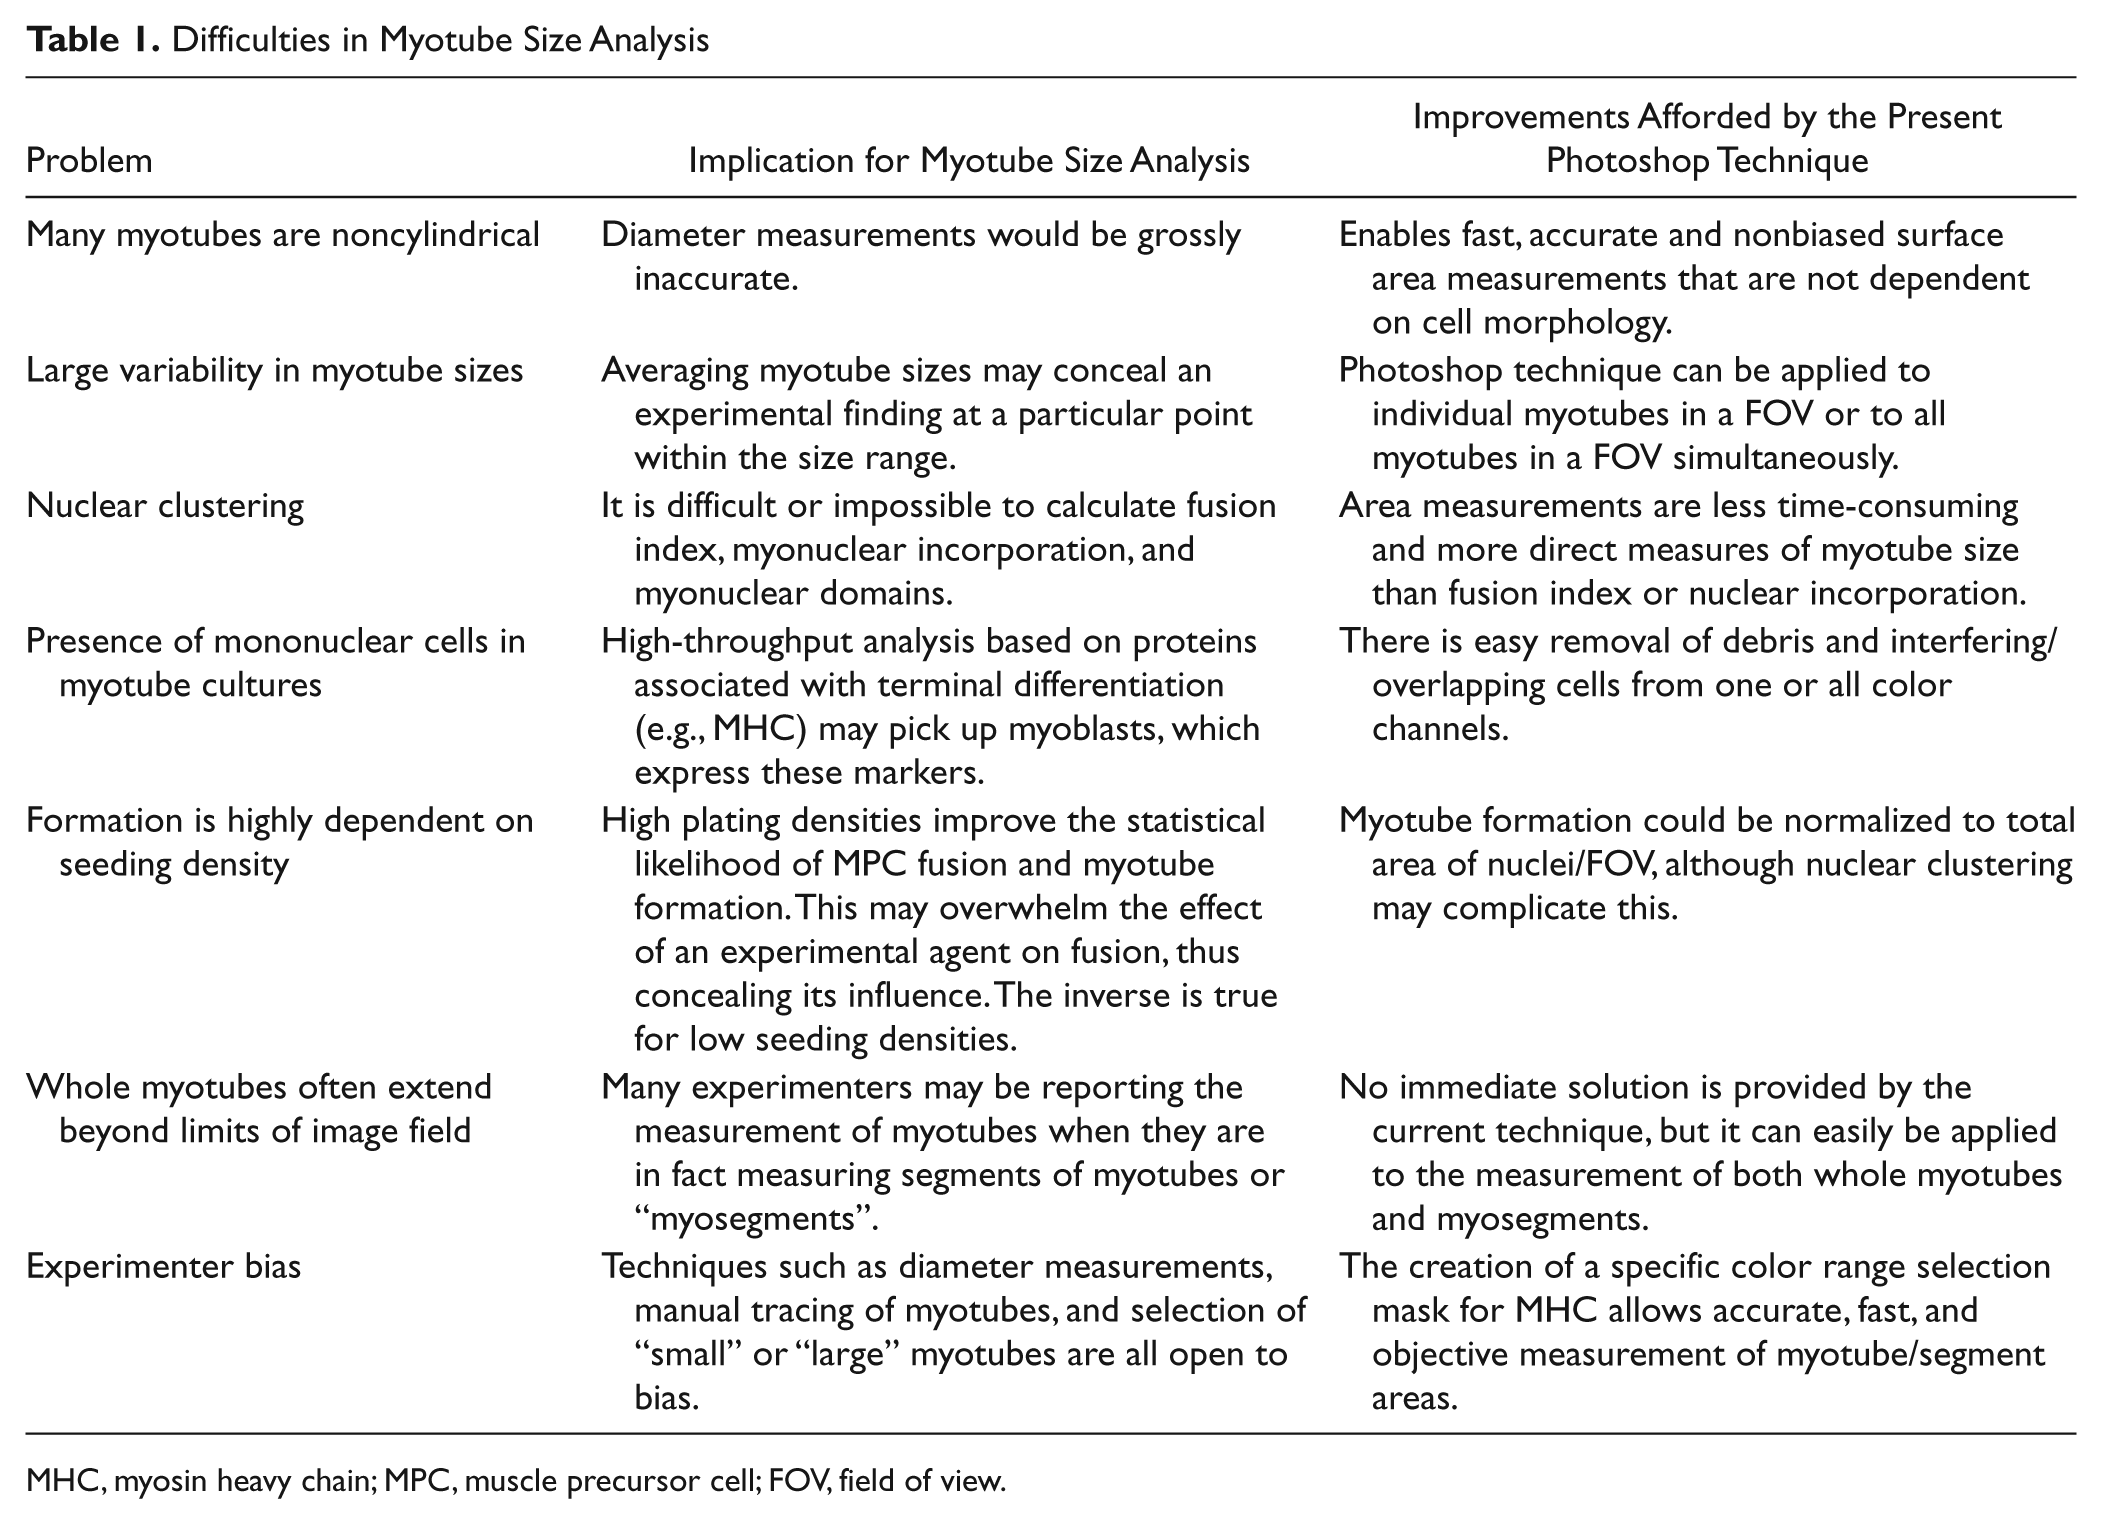
MHC, myosin heavy chain; MPC, muscle precursor cell; FOV, field of view.
Materials and Methods
Cell Culture
Data in mouse cell lines have shown that stimulation of canonical Wnt signaling promotes myotube formation (Rochat et al. 2004; Brack et al. 2009; Han et al. 2011; Pansters et al. 2011). A Photoshop-based image analysis method was used to quantify changes in the surface area coverage of human primary muscle precursor cell (MPC)–derived myotubes exposed to human recombinant Wnt-3A (rh-Wnt3A) in culture. To obtain primary human MPCs (myoblasts), a muscle biopsy was taken from the vastus lateralis of two young (25 and 26 years), healthy male subjects who gave written and informed consent to take part in the study. All procedures were approved by the local Research Ethics Committee and performed in accordance with the UK Human Tissue Act and the Declaration of Helsinki. Cells were isolated by collagenase D (Roche; Basel, Switzerland) and dispase II (Sigma-Aldrich; St. Louis, MO) digestion (2 mg/ml each) and cultured as described previously (George et al. 2010) with some modifications. Specifically, for myotube experiments, MPCs were proliferated for 1 week and then differentiated for 1 week in the presence or absence of rh-Wnt3A (100 ng/ml) (R&D Systems; Minneapolis, MN). For myoblast experiments, after dissociation, cells were maintained in proliferation medium and plated for experiments at passage 2.
Immunocytochemistry
Myotubes and myoblasts were fixed in their wells by the addition of 3.7% paraformaldehyde in phosphate-buffered saline (PBS) for 10 minutes. After removal of the fixative, cells were permeabilized by the addition of 0.2% Triton-X-100 in PBS containing 1% bovine serum albumin (BSA) (Sigma-Aldrich). Cells were then blocked with 1% BSA in PBS for 1 hour before being incubated overnight at room temperature with an anti-pan myosin heavy chain (MHC) antibody (MF20, 1:200 dilution; Developmental Studies Hybridoma Bank, Iowa City, IA). A secondary goat anti-mouse immunoglobulin (Alexa Fluor 488, 1:1000 dilution; Invitrogen, Carlsbad, CA) antibody was used to detect the MF20 primary. For MPC experiments after blocking, cells were labeled with a monoclonal mouse anti-human desmin antibody (clone D33, 1:250 dilution; Dako, Glostrup, Denmark) and a rabbit anti-human Ki67 antibody (MP-325, 1:250 dilution; A. Menarini Diagnostics, Florence, Italy) overnight at room temperature. The corresponding secondary antibodies were then applied overnight (Alexa Fluor goat anti-mouse 488 green and Alexa Fluor goat anti-rabbit 594 red; Invitrogen). In all cases, once primary and secondary antibody labeling was complete, cells were incubated for 10 minutes with 1 μg/ml Hoechst 33342 (Sigma-Aldrich) to identify the nuclei.
Image Acquisition
Prior to imaging cells, the light path to the camera was blocked, and a “black reference” was performed using AxioVision software (Carl Zeiss; Oberkochen, Germany). For myotube cultures, separate digital images (13,000 red, green, blue) of MHC (green light) and DNA (Hoechst 33342; blue light) staining were captured at ×10 objective (×100 magnification) from the same five nonoverlapping microscopic fields per well by an AxioCam CCD digital camera (Carl Zeiss) mounted to an inverted epifluorescence microscope (AxioVert 135; Carl Zeiss). Image capture for myoblast cultures was the same except, in addition to capturing blue (DNA; Hoechst) and green (desmin) wavelengths of light for each field of view (FOV), red light (Ki67) was also captured. A ×32 objective lens was used for myoblast image acquisition. Focus was adjusted for each new field, but fluorescent illumination (X-Cite; Lumen Dynamics Group, Mississauga, Canada) and exposure were kept constant to enable accurate analysis. Scale bars were calibrated using a standard microscope graticule, and 100-μm (myotube images) or 50 μm (myoblast images) scale bars were inserted into every micrograph using AxioVision software (release 4.6.3; Carl Zeiss). Files were saved in an 8-bit tagged image file format (.tif).
Image Calibration
To perform area analysis, unmodified, uncompressed .tif image files of myotube cultures were accessed in Photoshop, and blue (DNA; Hoechst 33342) and green MHC image channels from the same FOV were overlaid using the layers function (supplementary material). The set measurement scale dialog box was accessed, and using the ruler tool, the scale bar of known linear distance (50 μm or 100 μm) was traced, and the number of pixels corresponding to its length was given by the software. When measurements were made subsequently, the software automatically converted pixel number into square micrometers (supplementary material). In earlier versions of Photoshop, the pixel number of measurements can be obtained from the histogram window (Window > Histogram > Expanded view > Pixel number).
Creating a Color Range Mask
Human myotubes were classified as such based on a set of standard criteria (Table 2), and all the myotubes in each FOV were included in the analysis. To permit unbiased selection of myotube areas and increase the throughput of analysis, a representative myotube-specific color range selection mask was created using an equal number of random images from both control and rh-Wnt3A conditions (supplementary material). A color range mask is a palette of manually selected color tones, which when applied to an image or gated region (area inside marching lines) serves as a command to select those precise tones. In this case, the mask contains a comprehensive and representative panel of color tones that are specifically expressed by MHC-labeled myotubes. Notably, these tones need not be in any sequential range or even from the same color; the only prerequisite is that tones selected for a mask are different in the target item when compared to those in the immediate background, by either hue or density.
Criteria for the Identification of a Single Human Myotube and Myosegment
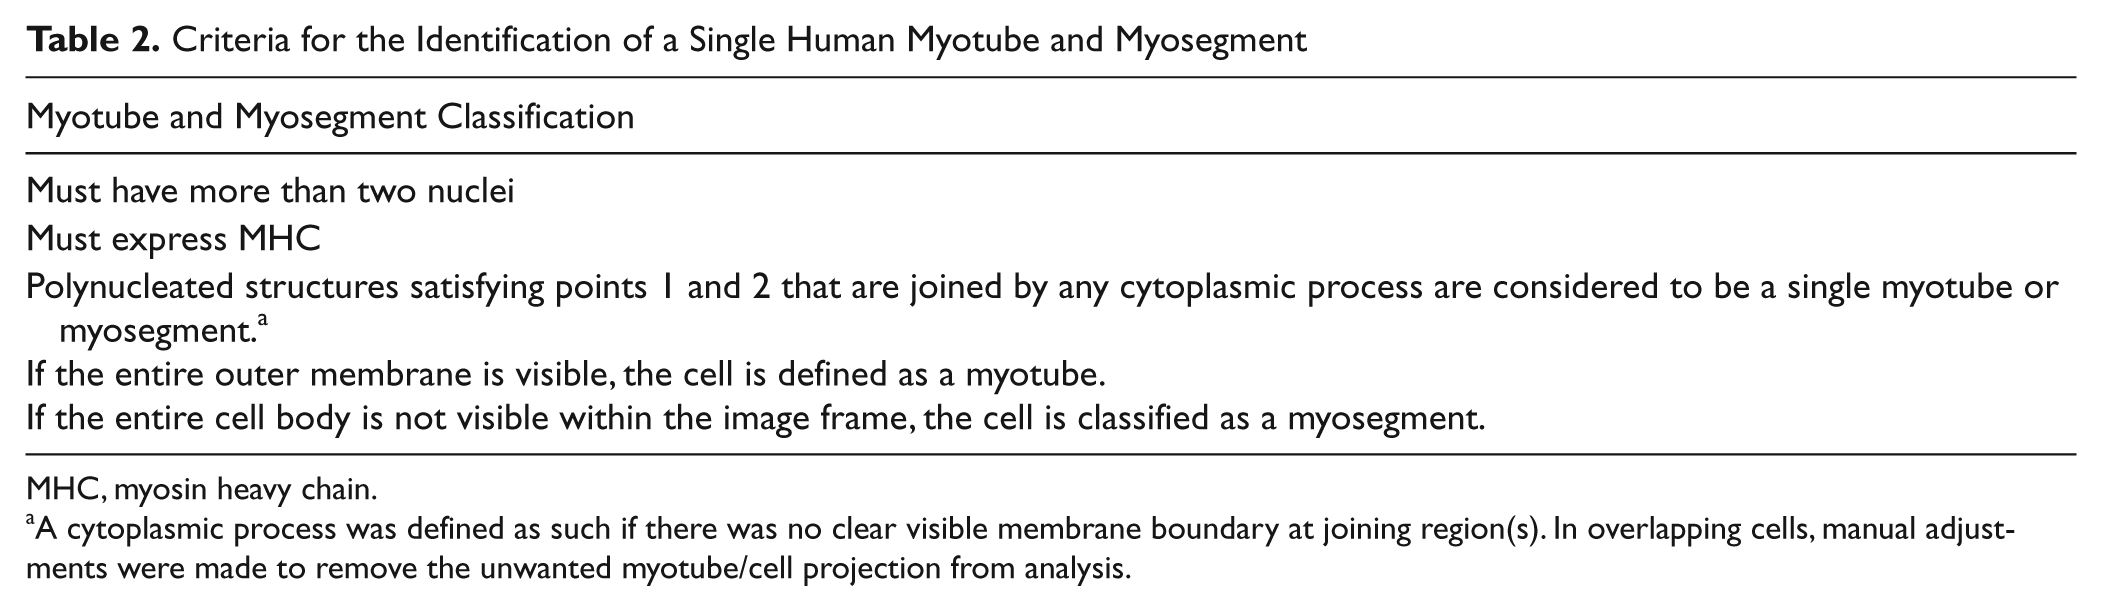
MHC, myosin heavy chain.
A cytoplasmic process was defined as such if there was no clear visible membrane boundary at joining region(s). In overlapping cells, manual adjustments were made to remove the unwanted myotube/cell projection from analysis.
At the time of analysis, green midtone color balance was shifted to +100 to facilitate clear identification of the myotube area; however, brightness and contrast were not altered, and no filters (e.g., sharp or unsharp mask) were applied. Any obvious debris or unfused single cells that could hinder selection were removed from the image by selecting them with the lasso tool and then pressing delete or by right clicking and then filling the selection with 100% black (supplementary material). Once the desired (MHC, green channel; and nuclei, blue channel) images were overlaid, opacity of the layers was altered (50% top blue channel layer; 100% bottom green channel layer) such that both MHC and DNA staining were visible (supplementary material) to aid in the identification of myotubes (Table 2).
While holding the shift key depressed, all the myotubes in the image were sequentially added to a live selection by drawing loosely around them with the lasso tool (myotube gating). Once all myotubes had been loosely gated, the blue nuclei channel was hidden (by clicking the eye adjacent to the layer). The color range dialog box was then opened, and with the selection preview set to “quick mask”, all the green color tones within the myotubes were selected by holding the shift key (+ sign appears) and clicking within the gated myotubes using the eye dropper tool. If unwanted tones were selected, these could be removed by depressing the Alt key (– sign appears) and clicking on them (supplementary material). The fuzziness scale was maintained at zero so that only manually selected color tones were included in the measurement. This color range mask was then saved to the computer’s hard disk drive as a Photoshop extract file (.axt file). With another random myotube field open, myotubes were again gated as above, and the color range mask was updated and saved; this was done for all random myotube fields. This same procedure was performed to construct a color range mask for nuclear area measurements made in the blue channel. Altering color balance was not necessary for the analysis of nuclei.
Quantification of Myotube and Myonuclei Surface Area
The MHC and Hoechst images for each FOV were accessed and overlaid. As above, opacity of the layers was altered such that both MHC and DNA staining were visible to aid in the identification of myotubes. Debris and unwanted cellular artifacts were removed. Individual myotubes were gated with the lasso tool, and the myotube color range mask was loaded from the color range dialog window. This resulted in tight selection of myotube surface area (fuzziness set to zero), and the number of pixels in this selected area (an individual myotube) was then obtained from the measurement log (supplementary material). Measurements made here were manually recorded or exported as a .txt file for further analysis in Microsoft Excel (Redmond, WA).
Once the myotube area had been measured, the green channel layer was made invisible, and with the blue channel layer in view, nuclei within the myotube were loosely gated. The nuclei-specific color range selection mask was then loaded from the color range dialog window and applied to the gated nuclei. Data on nuclear area inside the myotube were then obtained from the measurement log (supplementary material). Only the desired color channel was in view at the time of color range analysis to avoid pixel contamination from other channels. The MHC and nuclear areas of all myotubes in each 1300 × 1030–pixel FOV were measured. Total area of nuclei in each FOV was also measured.
Primary Human Myoblasts: Cytoplasmic and Nuclear Area Measurements
Micrographs were captured as for myotubes, and red (Ki67), green (desmin), and blue (DNA) .tif files were opened and overlaid in Photoshop. For analysis of myoblast cytoplasmic area, red (Ki67) and blue (Hoechst) channel layers were switched off, and with the green channel in view, the chosen cells were captured in a selection gate using the lasso tool. The color range dialog was opened, and the green tones corresponding to cytoplasmic desmin staining were manually selected by holding the shift button and clicking within the myoblasts using the eye dropper tool. Using the same technique, nuclear area was then selected and measured in the blue channel. With the nuclear selection area maintained, the red channel was brought into view, and the blue channel layer was switched off, allowing selection of red Ki67 focal tones within the defined nuclear boundary.
Primary Human Myoblasts: Ki67 Fluorescence Intensity and Nuclear Circularity
Three myoblast nuclei with varying levels of Ki67 fluorescence were chosen from a representative field of proliferating MPCs to demonstrate the quantification of fluorescence intensity using our Photoshop approach. Desmin, Hoechst (nuclei), and Ki67 image channels were overlaid as described. Potential uneven field illumination was controlled for by means of a Photoshop-based flat field correction procedure; briefly, this involved duplicating the Ki67 image layer, filtering it (Gaussian blur = 150) to create a mask, and then subtracting this mask from the original image. Following this correction, the nuclear layer was selected, and all other layers were hidden. Individual myoblast nuclei were then loosely gated with the lasso tool, and nuclear area was selected using the nuclear color range selection mask created earlier. The record measurements button was then pressed, and nuclear area was automatically recorded in the measurement log window in addition to nuclear circularity, which was calculated by the Photoshop software using the following equation: 4pi(area/perimeter2). With this equation, a circularity value of 1.0 corresponds to a perfect circle, and values approaching 0 indicate a progressively more elongated polygon. The nuclear selection area was then translated to the corresponding area on the Ki67 channel by clicking on the Ki67 channel layer and “hiding” the Hoechst channel layer. In the channels window (Window > Channels), the red channel (Ki67 signal) was selected, and green and blue channels were hidden. The red channel was then gray scaled, and the record measurements button in the measurement log window was clicked to obtain an integrated density value (sum of all pixel gray values); this value was taken to represent total fluorescent intensity emanating from the selected nuclei. The intensity of Ki67 staining in each nucleus was normalized to its respective nuclear area. Measurements made on each of the myoblast nuclei were repeated three times; however, due to the perfectly reproducible color range selection process, values were exactly the same.
In the micrographs that appear in this article, color balance was altered slightly, and an unsharp mask was applied; all formatting was in accordance with suggested guidelines for digital images (Rossner and Yamada 2004). Only raw, unadjusted images were used for analysis.
Results
We demonstrate here three applications of the Photoshop-based image analysis approach: the measurement of areas (cell area, nuclear area fluorescently stained nuclear antigens), the semiquantitative measurement of fluorescence intensity, and the calculation of nuclear circularity. Use of the color range select function to perform these measurements is a defining feature of this method, as it does not limit users to continuous sequential color ranges or gray pixel values like many basic thresholding approaches. Thus, the precise tones associated with a region of interest can be selected, discriminated from background tones, and quantified; moreover, this can be done objectively with the use of color range masks.
Myotube Size Analysis
The expression profile and abundance of MHC in terminally differentiated myotubes permit its use as a close index of surface area. Figure 1A shows a representative micrograph of a Wnt-treated human myotube. The precise selection of colored pixels corresponding to immunofluorescent MHC staining and nuclear-bound DNA staining can be seen in Figure 1B and 1C, respectively. Using this method, any pixel that can be discriminated from the background, as shown in Figure 1, can be measured and translated into real-world units of measurement by the Photoshop software. Although the nuclear area per myotube was measured, it is not presented, as nuclear clustering and overlapping were frequently observed (Fig. 1C, black arrows). The cytoplasmic area (MHC staining area) data for all individual myotubes in both control and rh-Wnt3A conditions are plotted in Figure 2. These data show that freshly isolated MPCs expanded and differentiated in the presence of rh-Wnt3A are formed with a larger size range than untreated control cells and have a greater average size. There is a clear difference in the size frequency distribution of rh-Wnt3A myotubes when compared to the control population.
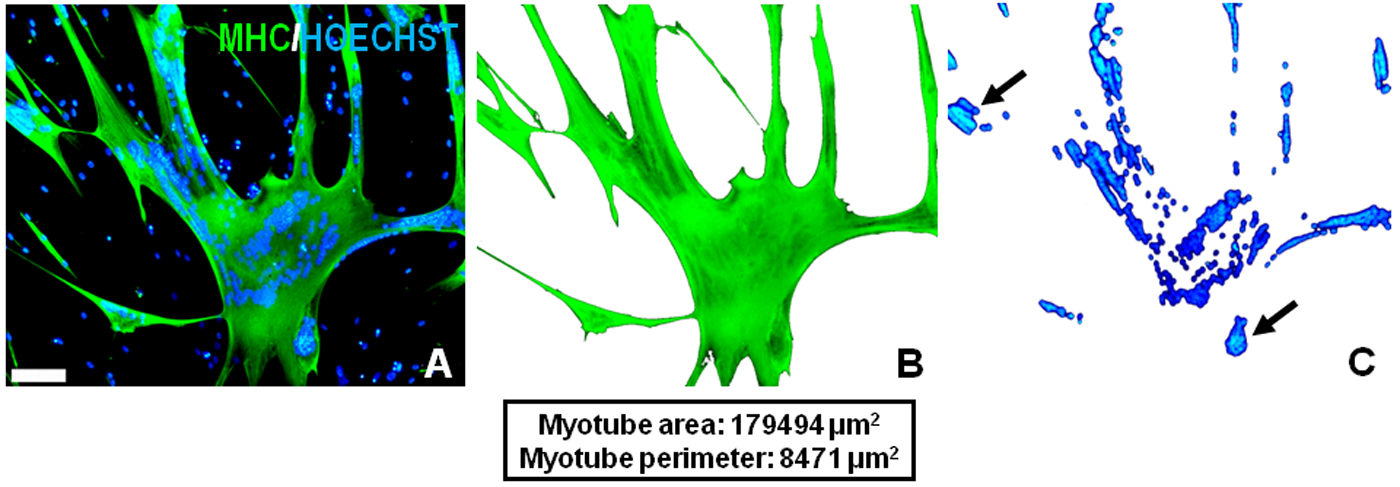
Demonstration of precise area selections using the Adobe Photoshop method. (A) A representative field of view (×10 objective) from rh-Wnt3A–supplemented human myotube culture. Using the method described in the text, the cytoplasmic area (B) and nuclear area (C) of a single large Wnt-treated myotube were selected based on staining and measured. Green: myosin heavy chain; blue: Hoechst. In order to demonstrate the efficiency of myotube and nuclear area selections, the selected pixels were cut and transferred into new blank layers. The black arrows in C point to the phenomenon of nuclear clustering, a common feature of cultured myotubes. Scale bars = 100 μm.
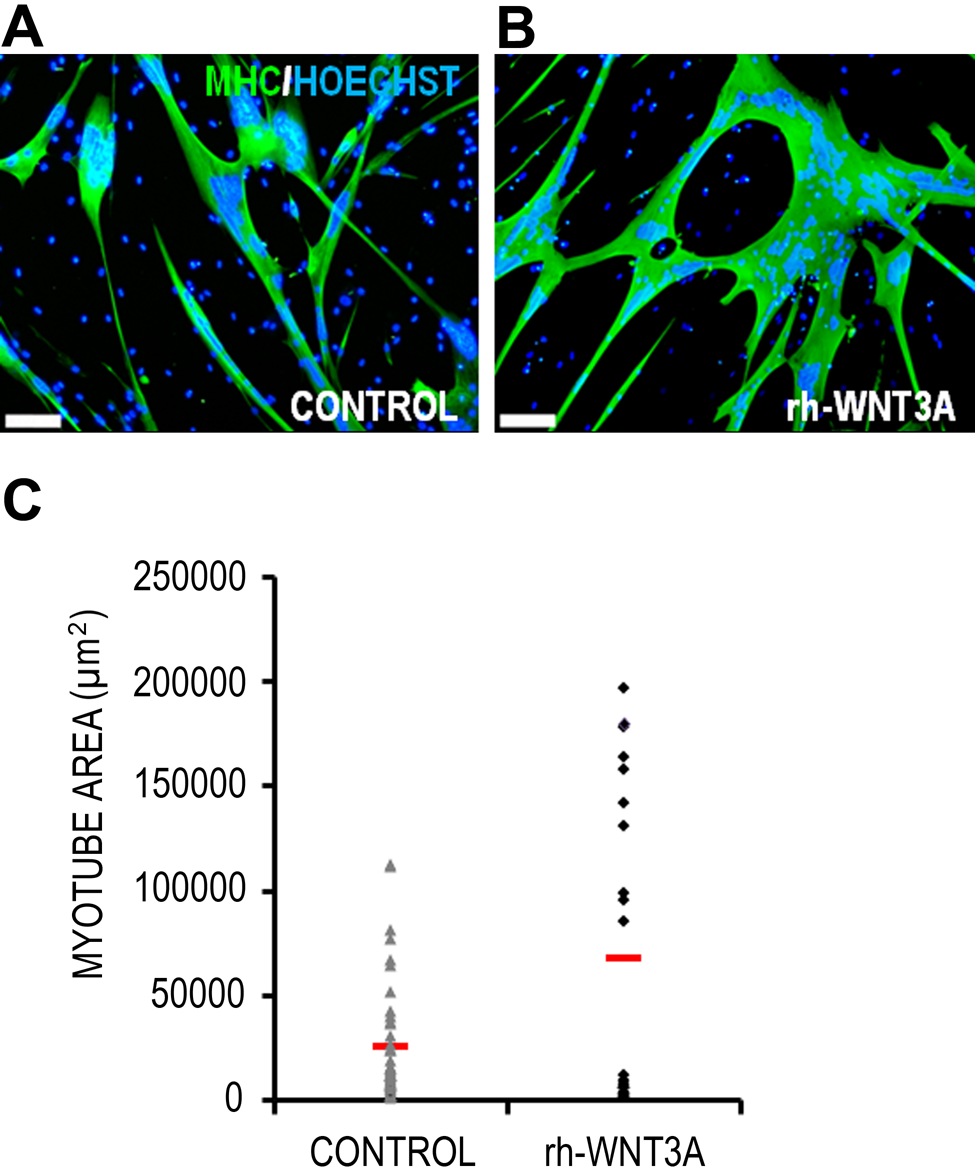
Quantification of myotube size and nuclear area using the Photoshop imaging method. Representative micrographs of a control myotube (A) and myotube cultured with 100 ng/ml rh-Wnt3A (B) are shown. Scale bar = 100 μm. (C) Individual data points for all measured myotubes in control and rh-Wnt3A conditions; horizontal red lines indicate the mean values. rh-Wnt3A–treated myotubes form myotubes over a larger size range than controls. Due to nuclear clustering, data were not presented on nuclear area/myotube (see text for discussion). Where significant clustering does not occur, the measurement of nuclear area using the proposed method would allow quantification of the two-dimensional myonuclear domain of these syncytia.
Measurement of Primary Myoblast: Cytoplasmic and Nuclear Areas
Figure 1C shows the phenomenon of nuclear overlapping preventing the accurate determination of the myonuclear domain, the amount of cytoplasm managed by a single nucleus (Liu et al. 2009). Therefore, we chose to demonstrate the measurement of the myonuclear domain using mononucleated myoblasts of differing morphology (Fig. 3A, arrows M1 and M2). Myonuclear domain was simply calculated in two dimensions (2-D) using the cytoplasmic and nuclear area values (2-D myonuclear domain = cytoplasmic area ÷ nuclear area), and the data are presented in Figure 3B. Myoblast M2 had a larger cytoplasmic area than M1, and as nuclear area was similar between the two cells, this translated into a larger myonuclear domain (Fig. 3B). The area of Ki67 foci (Fig. 3C) within the two selected myoblasts was measured and expressed as a percentage of nuclear area (Fig. 3D). According to these measurements, the nuclear area covered by Ki67 foci was greater in myoblast M2 when compared to myoblast M1. In all cases, highly reproducible area selections were achieved (Fig. 3B and 3D).
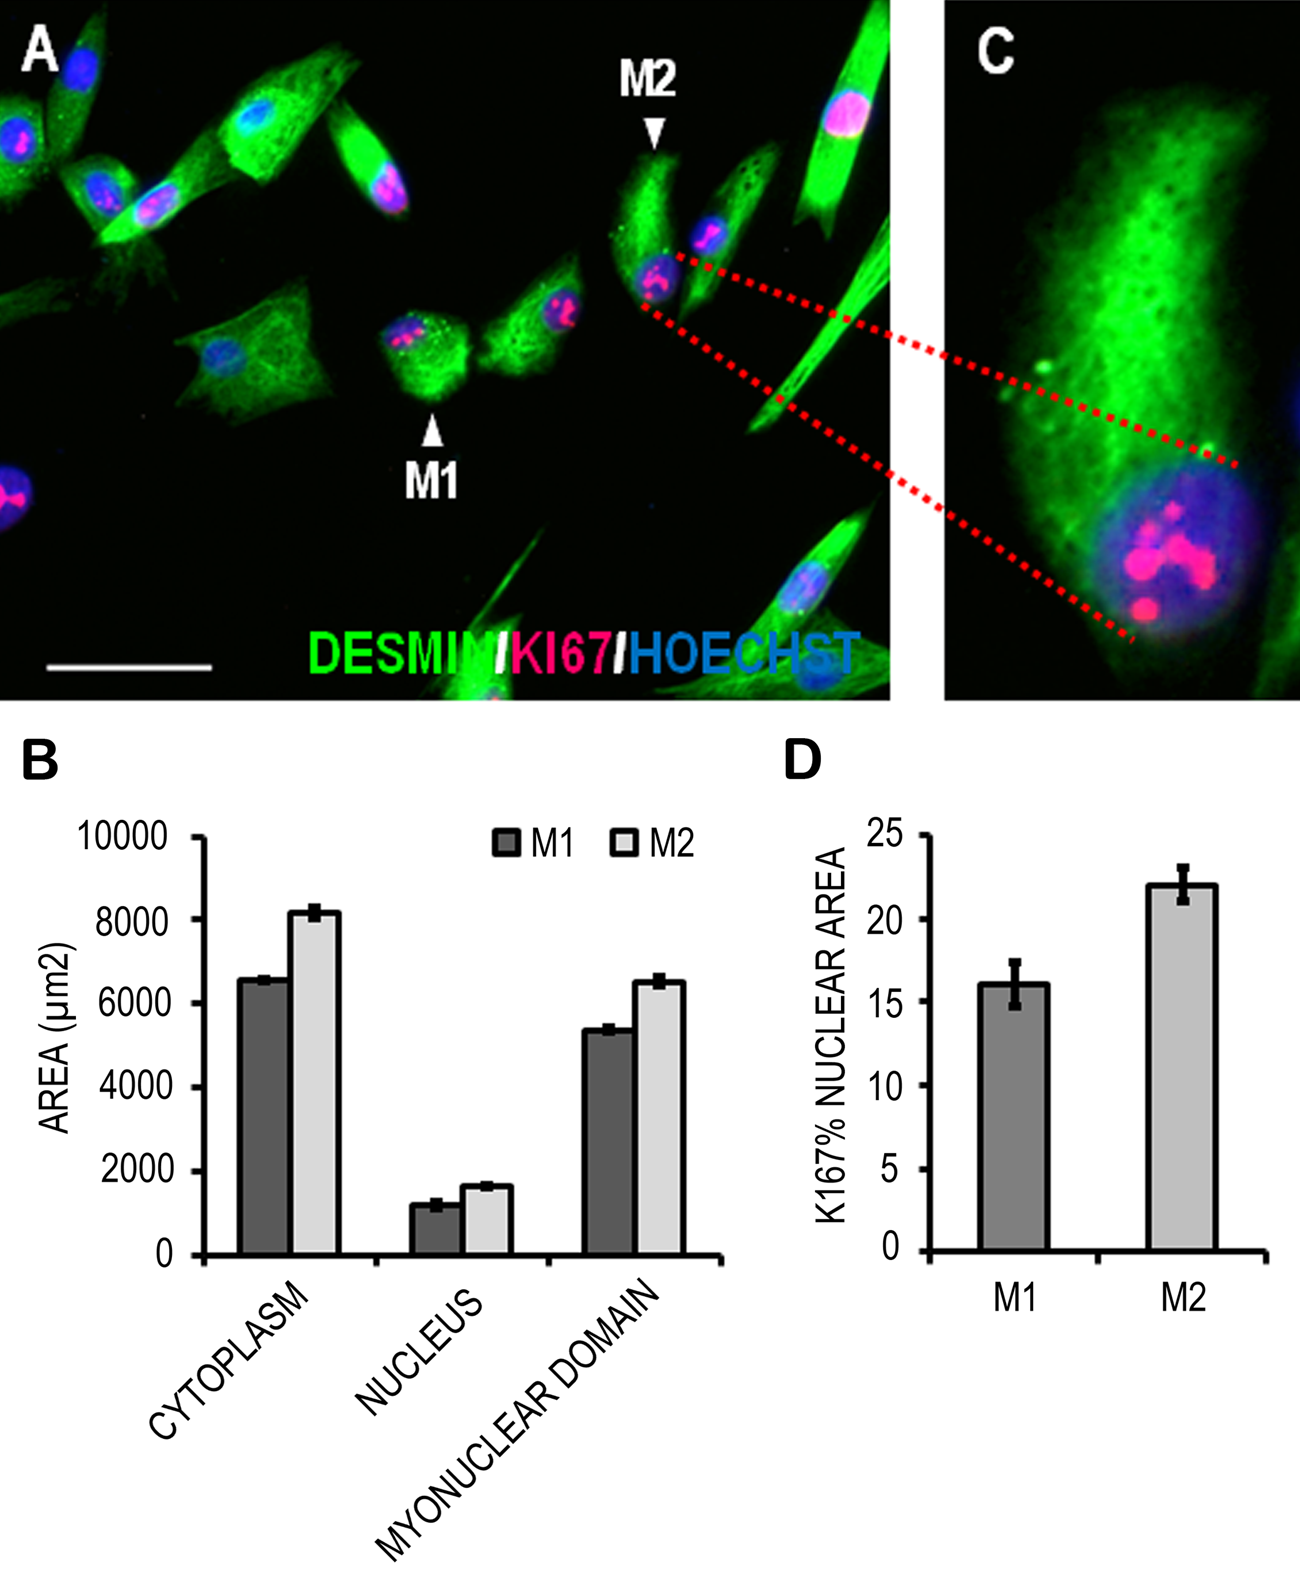
Quantitation of cytoplasmic and nuclear staining in cultured human primary muscle precursor cells (MPCs). Two individual MPCs (M1 and M2) with differing morphologies were chosen (A), and their cyotplasmic and nuclear areas were measured based on desmin (green) and DNA (blue; Hoechst) staining. These are graphed in B, as is the two-dimensional myonuclear domains of these cells. The area of Ki67 foci in the nuclei of the two myoblasts was measured and normalized to their respective nuclear area (D). Data are mean ± standard deviation of three replicate measurements performed on the same cells (M1 and M2). Scale bar = 50 μm.
Data are means ± standard deviations of three replicate measurements performed on the same cells (M1 and M2). Scale bar = 50 µm.
Fluorescence Intensity and Nuclear Circularity
Researchers are often interested in quantifying the intensity of immunofluorescent staining. Figure 4 shows the semiquantitative measurement of Ki67 fluorescence intensity in human myoblast nuclei. We selected three myoblast nuclei: one with ostensibly low (N1), one with medium (N2), and another with high (N3) Ki67 staining. The area of these nuclei was selected and measured in the blue (Hoechst) channel as described, and an index of their circularity was calculated by the software (Fig. 4C). By exploiting the layer and color range select functions of Photoshop, the live nuclear area selections could then be transferred to the corresponding locations on the red Ki67 staining channel, which had been gray scaled prior to measurement. In gray scale mode, pixels are associated with a value between 1 to 255 if 8 bit, or 1 to 65,535 if 16 bit, which represents their “lightness” and corresponds to the intensity of the fluorescent signal. The data in Figure 4D show that the relative (normalized to nuclear area) intensity of Ki67 fluorescence could be graded as follows: N1 < N2 < N3.
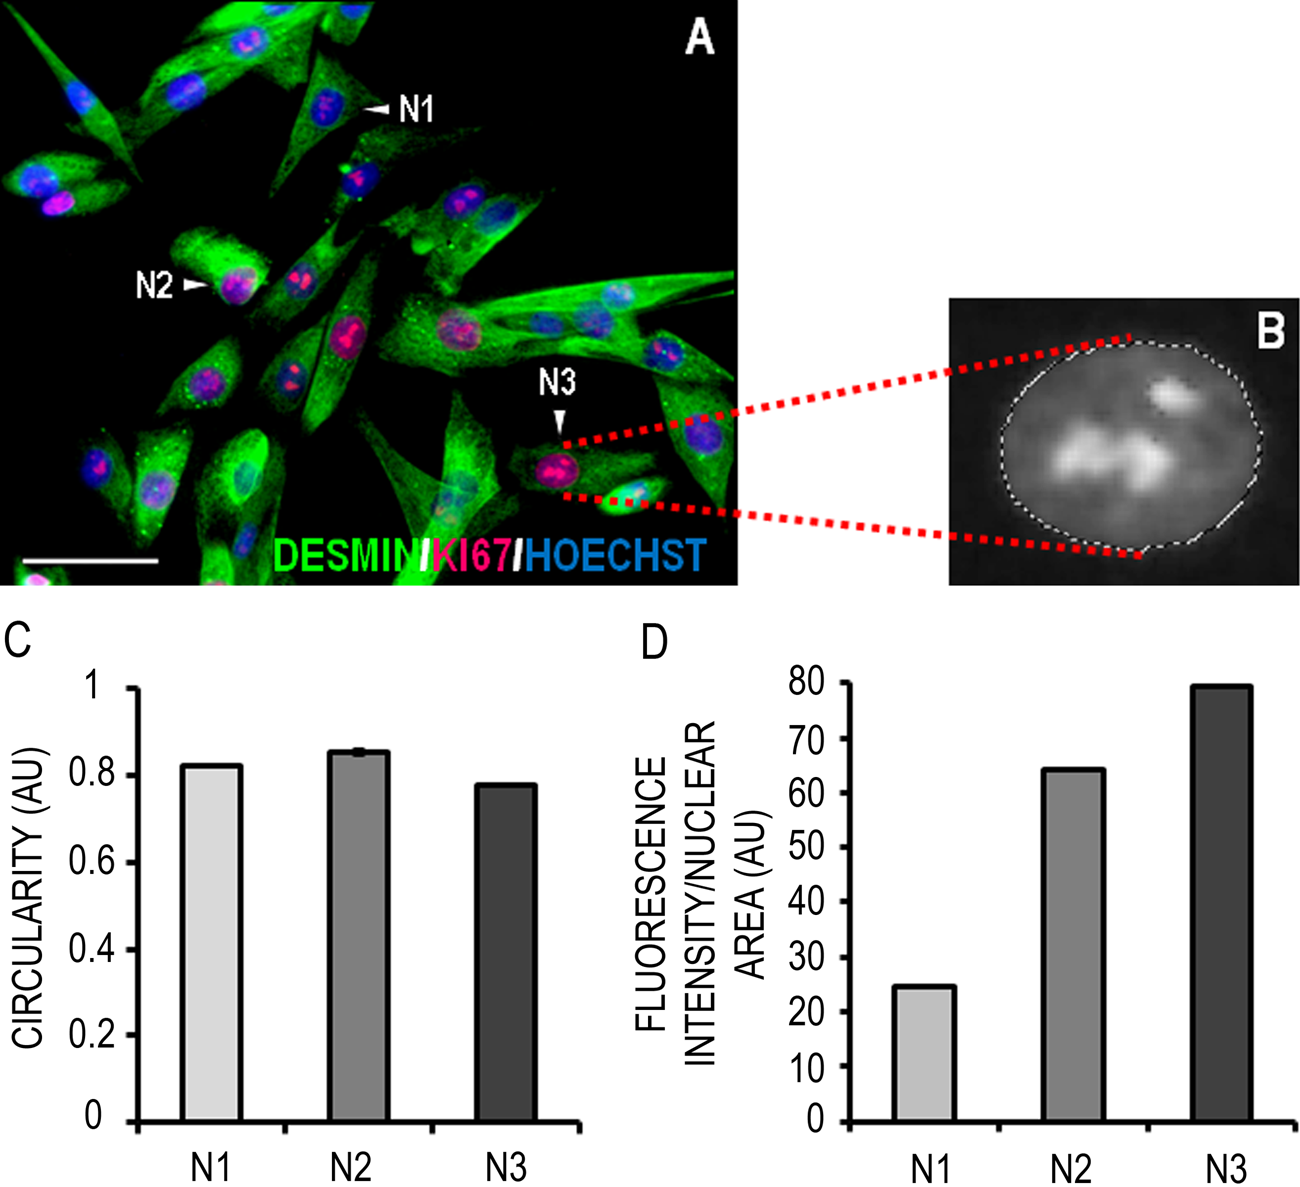
Quantification of Ki67 fluorescence intensity in the nucleus of proliferating muscle precursor cells (MPCs). (A) Representative micrograph of human MPCs under proliferation conditions expressing desmin (green) and Ki67 (red); DNA is labeled with Hoechst (blue). Scale bar = 50 μm. (B) Magnified gray scale image showing marching lines gating an individual nucleus in the Ki67 channel layer. (C) Once nuclei were selected based on Hoechst staining, an index of their circularity could be calculated. (D) The fluorescence intensity of Ki67 staining in three myoblast nuclei (N1, N2, and N3) was measured. Data are presented as mean ± standard deviation of three replicate measurements performed on the same cells (N1, N2, and N3). Note that although this analysis was performed on individual cells, it can also be applied to entire fields of view.
Discussion
The present article has detailed a simple and practical imaging method using Adobe Photoshop, which is able to measure the 2-D area of immunolabeled cells from micrographs. We have applied this method to the measurement of human myotubes and MPCs to demonstrate its competence with intricate cell morphologies. The results of the present study show that our method can be utilized to quantify the surface area of individual myotubes across a broad size range, measure nuclear areas, and quantify staining within individual nuclei.
The precise quantification of myotube size and volume is made difficult by their complex morphology, which precludes the use of techniques otherwise used for mononucleate cells, such as forward scatter analysis with flow cytometry (Fingar et al. 2002). Many existing techniques for the measurement of myotube size (e.g., diameter measurements) are very time intensive, open to bias, and do not account for the noncylindrical forms of these cells (Fakhfakh et al. 2011; Rakhilin et al. 2011). The method demonstrated here circumvents many of these issues (Table 1) and improves the throughput and precision of myotube size analysis when compared to other current manual and basic threshold approaches. Remarkably faithful selection of myotube area can be achieved with this technique (Fig. 1), without the need to generate complex mathematical algorithms or macros, and results are highly reproducible. The specificity of the color range select feature of Photoshop increases the sensitivity of measurements, while the selection system and use of layers permit the same areas (e.g., individual nuclei) to be gated and measured in any color channel or image.
A frequently used marker of muscle cell size and stage of differentiation is the “fusion index” (Metzinger et al. 1993; Kandalla et al. 2011). A fusion index describes the number of nuclei inside myotubes as a percentage of the total number of nuclei in a FOV. However, this may be difficult or impossible to determine in situations of nuclear clustering or overlapping, two common features of cultured myotubes (Duca et al. 1998; Zhu et al. 2007) (Fig. 1 and Table 1). Furthermore, while a fusion index provides a measure of the proportion of the total cell populace that has fused, it is only truly meaningful with pure or almost pure myogenic populations. Thus, calculation of the fusion index is problematic in the case of primary muscle cell cultures due to the presence of muscle resident fibroblasts that infiltrate many of these cultures, without extensive purification strategies, in highly varying amounts (Yoles et al. 1984; Yablonka-Reuveni et al. 1988; Rando and Blau 1994). Comparatively, the measurement of surface area coverage is a more time-efficient and direct measure of myotube size.
Another popular analysis method used with myotube cultures is the summation of the total area of myotubes relative to a defined area of the culture dish (Wilson et al. 2004; Long et al. 2006; Markworth and Cameron-Smith 2011; Gardner et al. 2011). Although this approach is likely to be fast, it cannot reveal alterations in the size spectrum of a myotube population because it is possible to cover the same area with either many small myotubes or a few very large ones. Thus, the option of individual myotube analysis is a useful component to any measurement technique.
Although we attempted to calculate nuclear area for each myotube or myosegment with the aim of providing numerical information on the 2-D myonuclear domain, it was decided that the degree of nuclear overlap would, in many cases, generate erroneous results (Fig. 1C, Table 1). Nevertheless, in myotubes/segments where the nuclei do not encroach on each other, quantification of myonuclear domains would be simple using the proposed method; this is demonstrated by the measurements made in Figure 3 on mononucleated MPCs. Using our method, we measured the cytoplasmic area of MPCs via desmin staining, an important structural protein in muscle, and related this to the cell’s nuclear area (Fig. 3). In addition, full details of obtaining a myotube’s nuclear area are provided in the supplementary material.
To demonstrate the ability of this method to measure nuclear staining, we quantified the expression of Ki67, a nuclear antigen associated with cell proliferation that is widely used in cancer diagnostics (Gerdes et al. 1983). Specifically, we measured the surface area and magnitude of the fluorescent signal produced by Ki67 labeling and normalized this to the cell’s nuclear area (Fig. 4). The ability to maintain selection areas across different layers makes it possible to confine measurements to defined regions, which aids target recognition and reduces bias. We also measured the circularity of nuclei in normal human myoblasts to show the ease at which additional morphometric data can be generated from a single selection (Fig. 3). This type of analysis could be useful for those interested in conditions that alter nuclear morphology such as nuclear laminopathies (Filesi et al. 2005).
One limitation of the myotube analysis performed here (and of myotube analysis in general) was that it was not always possible to measure whole myotubes, as even with a ×10 objective, they frequently extended beyond the limits of the image field (Table 1). Ultimately, this meant that instead of measuring whole myotube area, we were in fact often measuring the size of both complete myotubes (entire membrane perimeter visible) and segments of the myotube that we have termed “myosegments” (Table 2). This notwithstanding, in situations where images of the entire well cannot realistically be obtained or analyzed, measuring both myotube and myosegment size, as done here, is likely to be the next most appropriate indicator of a size-altering effect (Fig. 2). Researchers should be encouraged to clarify whether myotubes or myotube segments (or both) were measured to permit comparison between studies. Another approach taken to address this issue has been to measure the diameter of only those myotubes small enough to be fully visible from “end to end” within the defined image frames (i.e., only whole myotubes) (Vyas et al. 2002). However, in addition to the stated limitations of diameter measurements (Table 1), this approach heavily favors the measurement of small myotubes, and due to the large intrawell range of myotube sizes and known heterogeneity of responses, this approach may not reveal the true effect of a treatment on the size distribution of a cultured muscle cell population.
Although the reported technique can reliably measure cell area, it is not capable of directly quantifying myotube cell volume, which could provide further useful information in the context of myotube hypertrophy or atrophy. It is anticipated that with further development, this method could be combined with others (such as laser scanning confocal microscopy with z-stacking) to generate information on both the surface coverage and depth of cultured myotubes. Nonetheless, it is likely that a positive relationship exists between the 2-D area of a myotube and its volume, such that area measurement may be a more rapid and pragmatic means of indicating changes in total cellular mass. Indeed, geometry informs us that in most cases, volume increases at a faster rate than surface area (Cohen-Fix 2010); thus, differences detected in surface area coverage may be a more conservative measure of real alterations in cellular mass. A recent method for estimating myotube thickness using bioelectrical impedance has been reported (Rakhilin et al. 2011); however, this method is only capable of measuring all the cells within the culture, and thus, changes in the size range of myotubes would be lost.
The highly transferable basic principles underpinning the described imaging technique mean that it could easily be applied to the measurement of any fluorescently labeled protein, organelle, or cellular structure, and therefore, its use is not limited to the muscle field. To demonstrate the applicability of this technique, we used it to measure the surface area of a primary rat hippocampal neuron expressing a DAGLα-GFP fusion protein (M. Oudin, unpublished data) (Suppl. Fig. S1). The ability to measure the surface area covered by the intricate projections of primary neurons would be expected to be of use to neuroscientists interested in assessing neuronal outgrowth in response to neurotrophic agents.
It is important to note that the present measurement technique may not be suitable for some types of cytochemical or histochemical staining; in particular, the method does not work as well if staining intensity is very low or the level of background staining is high. For this reason, the technique is better at dealing with fluorescent rather than bright field staining; however, it could be applied successfully to these scenarios under favorable conditions (strong staining, good differentiation between region of interest and background).
Conclusion
With the aid of Adobe Photoshop imaging software, we have developed a straightforward approach for quantifying the fluorescent staining of cells in culture. Many laboratories across the world make use of this software for the preparation of images and figures for publication, but few have recognized its potential for quantitative image analysis. The use of Photoshop in this regard has been highlighted previously for the analysis of immunohistochemical staining (Lehr et al. 1997, 1999), and we have now demonstrated its applicability to immunolabeled cells in culture by using tools within the software package in a novel way to facilitate faster, more objective, and highly sensitive image quantitation.
In the latest extended versions of the program, there has been an obvious attempt by developers to enhance its capacity for medical and scientific measurements, and an increase in its application within these arenas is anticipated. The methods used in the present study were able to overcome many of the long-standing problems in myotube size analysis, principally their very irregular, nonsymmetrical forms. The scope of this approach is such that it could potentially be used to measure the 2-D area or fluorescent intensity of any fluorochrome-labeled cell protein or organelle. It is hoped that this technique will be a useful tool for any researchers wishing to track the morphometric and protein expression characteristics of their cells in culture.
Footnotes
Acknowledgements
The authors thank Dr. Madeline Oudin for kindly providing the images of rat hippocampal neurons in Supplementary Figure S1. They extend their thanks to Dr. Anthea Rowlerson for her comments on the article and to Mr. Carl Hobbs for his technical assistance. The MF20 antibody developed by D.A. Fischman was obtained from the Developmental Studies Hybridoma Bank developed under the auspices of the National Institute of Child Health and Human Development (NICHD) and maintained by the University of Iowa, Department of Biology (Iowa City, IA).
The authors declared no potential conflicts of interest with respect to the research, authorship, and/or publication of this article.
C.A. was funded by a studentship provided by King’s College London. The authors acknowledge financial support from the Department of Health via the National Institute for Health Research (NIHR) comprehensive Biomedical Research Centre award to Guy’s and St Thomas’ NHS Foundation Trust in partnership with King’s College London and King’s College Hospital NHS Foundation Trust.
References
Supplementary Material
Please find the following supplemental material available below.
For Open Access articles published under a Creative Commons License, all supplemental material carries the same license as the article it is associated with.
For non-Open Access articles published, all supplemental material carries a non-exclusive license, and permission requests for re-use of supplemental material or any part of supplemental material shall be sent directly to the copyright owner as specified in the copyright notice associated with the article.