
Abstract
Pleiotrophin (PTN) is an extracellular matrix–associated growth factor and chemokine expressed in mesodermal and ectodermal cells. It plays an important role in osteoblast recruitment and differentiation. There is limited information currently available about PTN expression during odontoblast differentiation and tooth formation, and thus the authors aimed to establish the spatiotemporal expression pattern of PTN during mouse odontogenesis. Immortalized mouse dental pulp (MD10-D3, MD10-A11) and odontoblast-like (M06-G3) and ameloblast-like (EOE-3M) cell lines were grown and samples prepared for immunocytochemistry, Western blot, and conventional and quantitative PCR analysis. Effects of BMP2, BMP4, and BMP7 treatment on PTN expression in odontoblast-like M06-G3 cells were tested by quantitative PCR. Finally, immunohistochemistry of sectioned mice mandibles and maxillaries at developmental stages E16, E18, P1, P6, P10, and P28 was performed. The experiments showed that PTN, at both the mRNA and protein level, was expressed in all tested epithelial and mesenchymal dental cell lines and that the level of PTN mRNA was influenced differentially by the bone morphogenetic proteins. The authors observed initial expression of PTN in the inner enamel epithelium with prolonged expression in the ameloblasts and odontoblasts throughout their stages of maturation and strong expression in the terminally differentiated and enamel matrix–secreting ameloblasts and odontoblasts of the adult mouse incisors and molars.
Pleiotrophin (PTN) (Deuel et al. 2002) (also called heparin-binding growth-associated molecule [HB-GAM] or osteoblast-specific factor–1 [OSF-1]; Tezuka et al. 1990) is a secreted extracellular matrix–associated protein. PTN is in the same growth factor family as midkine (MK), and the two proteins share ~50% sequence homology (Rauvala 1989) but are structurally unrelated to other heparin-binding factors such as fibroblast growth factors (FGFs) and hepatocyte growth factor (Maruta et al. 1993; Arai et al. 1994). PTN exhibits neurite outgrowth activity, mitogenic activity, and angiogenic properties (Deuel et al. 2002; Hamma-Kourbali et al. 2008). It is expressed in mesodermal and neuroectodermal cells and appears to play a number of roles in the human body, including organ development and regulation of cell differentiation. PTN is also involved in tumor growth and breast cancer (Vanderwinden et al. 1992; Mitsiadis et al. 1995; Meng et al. 2000).
PTN is suggested to play a role in bone formation by mediating recruitment and attachment of osteoblasts/osteoblast precursors to the appropriate substrates for deposition of new bone (Imai et al. 1998). PTN has also been proposed to act as an accessory signaling molecule, which may enhance or inhibit primary responses depending on the prevailing concentrations, the primary stimulus, and the availability of appropriate PTN receptors (Tare et al. 2002). PTN has been found in abundance in fetal and juvenile cartilage but is undetectable in mature cartilage. In the early stages of osteoarthritis, however, PTN is reexpressed in chondrocytes and appears to be involved in chondrocyte differentiation, inducing chondrogenesis. PTN’s role in chondrocyte proliferation, reducing proinflammatory factors and repair of osteoarthritic cartilage, makes it a plausible target for the treatment of osteoarthritis (Mentlein 2007).
PTN has two known physiological receptors, protein tyrosine phosphatase β/ζ (RPTPRZ1) (Maeda et al. 1996) and N-syndecan (or syndecan-3) (Kinnunen et al. 1998). Osteoblasts have recently been found to express the short transmembrane isoform of RPTP β/ζ (Imai et al. 1998; Schinke et al. 2008), but nothing is known regarding RPTP β/ζ expression during tooth development. However, N-syndecan/syndecan-3 is known to be expressed in the tooth germ during odontogenesis (Hikake et al. 2003). PTN overexpression in transgenic mice had a protective effect on bone loss and resulted in an increase in bone density (Imai et al. 1998). PTN has also been found in fracture calluses, indicating its role in bone fracture healing through the stimulation of angiogenesis (Petersen et al. 2004). A spatiotemporal relationship of N-syndecan and PTN expression in osteoblasts and osteoblast precursors suggests that interaction of this receptor-ligand pair plays a role in the osteoblast recruitment and attachment to their target substrates (Imai et al. 1998).
Although a number of reports describe MK in tooth development, only a few studies describe the presence of PTN protein during tooth development (Vanderwinden et al. 1992; Mitsiadis et al. 1995; Thesleff et al. 1995; Mitsiadis et al. 2008), especially postnatally, and only one report exists on PTN expression after the root is formed and in the adult. This recently published study showed that PTN is expressed in the continuously growing rodent incisor and also shows that other growth factors such as the bone morphogenetic proteins (BMPs) and fibroblast growth factors (FGFs) regulate PTN expression (Mitsiadis et al. 2008). Our study therefore focused on determining the comprehensive spatiotemporal expression pattern of PTN in developing and adult mice teeth, including molars, using immunohistochemistry. The immunohistochemical expression pattern of the PTN protein, as well as its regulation by BMP2, BMP4, and BMP7, was thereafter studied in immortalized mouse dental cell lines, as well as human pulp cells, using immunocytochemistry, Western blots, quantitative (q-PCR) and conventional RT-PCR.
Materials
Antibodies
A primary rabbit polyclonal antibody raised against recombinant human PTN (ab14025) was purchased from Abcam (Cambridge, MA), together with another goat polyclonal PTN antibody raised against human PTN produced recombinantly in Sf 21 insect cells (Abcam; ab10849). A primary mouse monoclonal antibody against amino acids 94 to 168 of human PTN was purchased from Santa Cruz Biotechnology, Inc. (Santa Cruz, CA), PTN (H-6).
Methods
Localization of PTN Protein Using Immunohistochemistry
Mice (C57BL/6) embryonic day 16 (E16) to day 18 (E18), newborn, and postnatal days 1, 6, 10, and 28 were sacrificed and fixed in 4% paraformaldehyde for shipment from The Scripps Research Institute (Dr. Deuel’s laboratory) to The Institute of Oral Health at the University of Alabama at Birmingham. The mouse heads were sectioned into mandibles and maxillaries and demineralized in 10% EDTA if older than 5 days, processed, embedded in paraffin, sectioned and mounted on silane-treated slides. Immunohistochemistry (IHC) was performed with the rabbit polyclonal antibody PTN antibody (ab14025) at a dilution of 1:50 or 1:100, followed by the corresponding secondary antibody horseradish peroxidase (HRP) conjugate system, visualized by 3–3′ tetrachloride diaminobenzidine (DAB) oxidization, counterstained with hematoxylin (P28 only), and photographed using a Nikon Eclipse 80i inverted microscope (Nikon, Melville, NY). Ten percent BSA in 1× PBS buffer was used instead of primary antibody for negative controls.
Cell Cultures
Mouse immortalized dental pulp mesenchymal cells, pre-odontoblasts (MD10-D3, MD10-A11), and odontoblast-like (M06-G3) cells were plated and cultured to 30% to 100% confluency under culture conditions as previously described (MacDougall et al. 1998) and further grown on four-chamber glass slides (Lab Tek II; Nalge Nunc International, Rochester, NY) until confluent for further use with immunocytochemistry (ICC). The cells were fixed in methanol and blocked using 10% BSA. ICC was performed as described above for IHC using the HRP-conjugated system and DAB staining before being photographed.
Immunofluorescence
Immunofluorescence was performed as for ICC above with the goat polyclonal PTN primary antibody (Abcam; ab10849) at 1:50 dilution with overnight incubation and using an Alexa Fluor 388–conjugated, anti-goat IgG secondary antibody. The cells were then counterstained with 4,′6-diamidino-2-phenylindole (DAPI) to visualize the nuclei, before being photographed using a Roper Scientific (Trenton, NJ) digital camera at the same exposure time for the different cell lines. The FITC and DAPI images were merged using the NIS-Elements software (Nikon).
Isolation of RNA
Cells were harvested at 100% confluency for isolation of total RNA using the RNA STAT-60 Total RNA/mRNA isolation reagent kit according to manufacturer’s protocol (Tel-test, Inc., Friendswood, TX). The isolated RNA was resuspended in 10 µl sterile water and the concentration determined.
Treatment of Cells with Recombinant BMPs
The mouse immortalized odontoblast-like cell line M06-G3 was cultured as previously described (MacDougall et al. 1998) with or without recombinant human BMP2, BMP4, or BMP7 (R&D Systems, Inc., Minneapolis, MN) (200 ng/ml). Total RNA was isolated from parallel cell cultures at day 14, as outlined above.
Reverse Transcription/PCR Amplification
In total, 1 µg RNA was converted to cDNA using Multiscribe Reverse Transcriptase (Applied Biosystems, Foster City, CA) with random hexamers. An aliquot of the resulting cDNA was amplified with REDTaq DNA Polymerase and specific PTN and glyceraldehyde 3-phosphate dehydrogenase (GAPDH) primer sets (10 pM each primer, Table 1) during 35 cycles of RT-PCR (Rappolee et al. 1989). The RT-PCR primers were designed using the accession codes NM_008973 (Mus musculus PTN) and NC_000072 (M. musculus GAPDH). The RT-PCR PTN primers were designed to cover several exon/intron boundaries to distinguish mRNA amplicons and alternative splicing forms and rule out genomic DNA contamination. The PCR products were separated on a 2% agarose gel. Gels were stained with ethidium bromide and images captured with an Alpha Imager 2000 gel documentation and analysis system (Alpha Innotech, Santa Clara, CA).
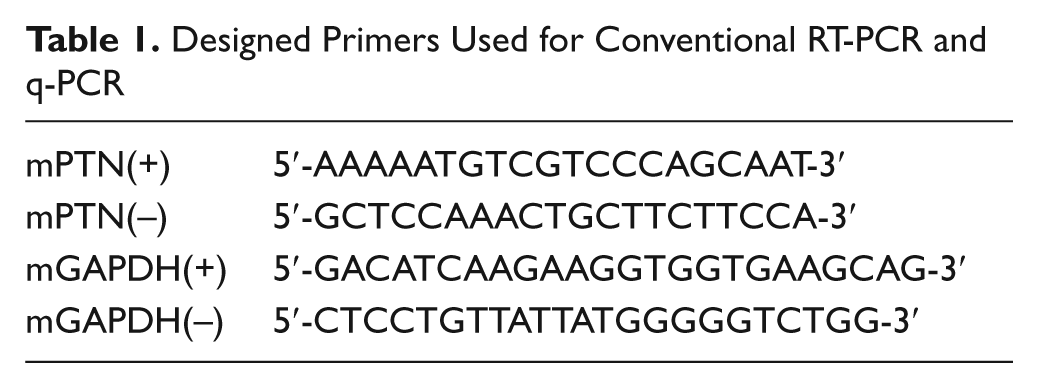
Designed Primers Used for Conventional RT-PCR and q-PCR
PTN Protein Expression and Western Blot Analysis
Dental cell lines were lysed in cell lysis buffer (0.4% SDS, 0.4 M urea, 10 mM dithiothreitol [DTT], 10% glycerol, 10 mM Tris-HCl [pH 6.8]), 0.06 mM bromophenol blue, Complete protease inhibitor cocktail mix (Roche, Basel, Switzerland), and 0.025 mM MG132 (proteasome inhibitor) and boiled for 5 min. Total amount of soluble proteins from cell cultures was quantified using the BCA Protein Assay kit (Pierce, Rockford, IL), SDS-PAGE resolved using 4% to 12% precast gels (Invitrogen, Carlsbad, CA), and electroblotted to poly(vinylidene difluoride) (PVDF) membranes using a semi-dry transfer apparatus. Bound proteins were detected with the PTN primary antibody (Abcam; ab14025, 1:1000 dilution) and goat anti-rabbit IgG-HRP-conjugated secondary antibody (Santa Cruz Biotechnology; 1:2000 dilution) using the SNAPi.d. immunodetection apparatus (Millipore, Billerica, MA). PTN on the membrane was illuminated with the enhanced chemiluminescence Chemiglow system and imaged on an AlphaImager 2000 (Alpha Innotech).
Quantitative PCR
cDNA was produced as described above and used for q-PCR analysis in 25-µL reaction volumes containing SYBR green (SA Biosciences, Frederick, MD) as well as 1 µL commercial mouse-specific oligonucleotide primer sets, as per the manufacturer’s protocol, or our own primer set (Table 1) to detect PTN (SA Biosciences) and GAPDH (Invitrogen). Each reaction was performed in triplicate. Amplifications were carried out on an Applied Biosystems 7500 Real Time PCR instrument (Applied Biosystems, Foster City, CA) according to the manufacturer’s instructions. Cycle threshold (CT) values for transcription levels were obtained and normalized to GAPDH to determine the ΔCT value using experiments from the same 96-well plate.
Results
PTN expression was first tested in dentally derived mouse cell lines at the mRNA level by conventional RT-PCR (Fig. 1A) and later by q-PCR (Fig. 1B). PTN mRNA transcripts were detected in all ectomesenchymally derived cell lines tested at similar relative levels, after normalization to the GAPDH gene. We also quantitated PTN expression by q-PCR using commercial primers for PTN (SA Biosciences) and similarly found little difference in PTN mRNA levels between the different cell lines (data not shown) when normalized to GAPDH. Upon treatment of M06-G3 cells with three different recombinant BMPs (BMP2, BMP4, and BMP7) for 14 days, we did see a statistically significant increased level of PTN transcripts upon treatment with BMP2 and BMP7 versus a decreased PTN transcript level upon BMP4 treatment (Fig. 1C).
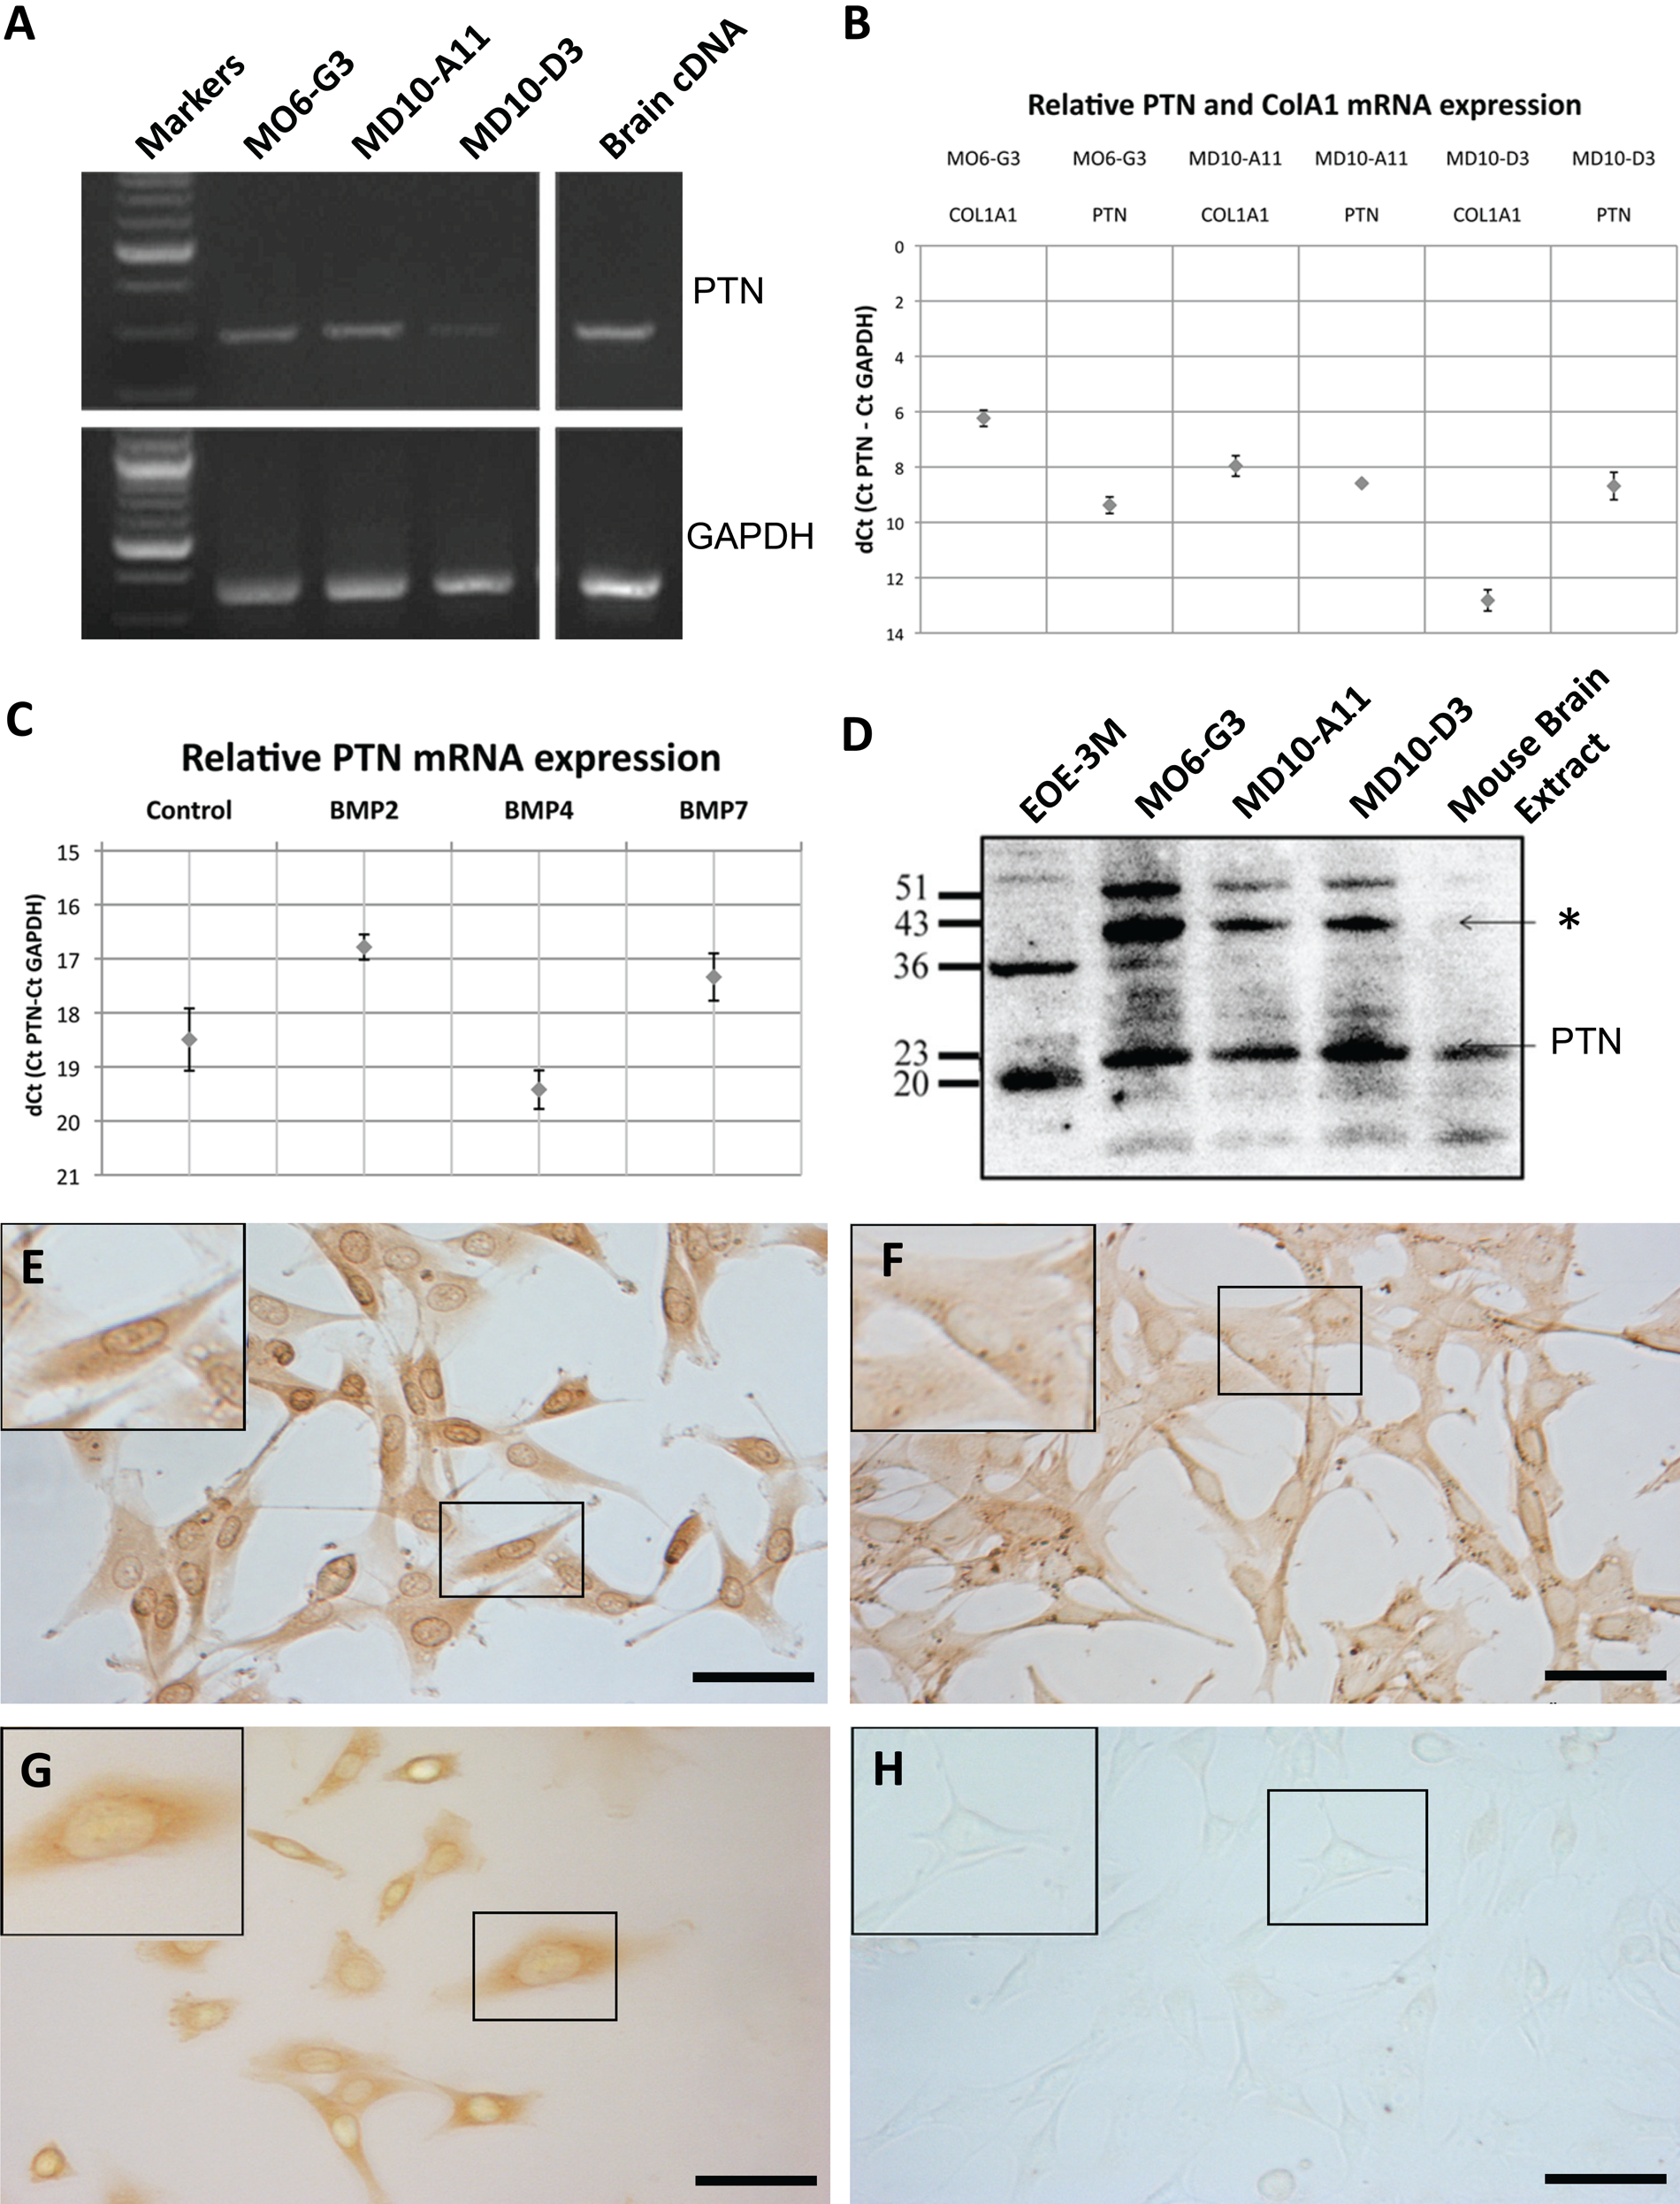
(A) (Top) Conventional RT-PCR using pleiotrophin (PTN) mouse primers and cDNA from M06-G3 (lane 2), MD10-A11 (lane 3), MD10-D3 (lane 4), and mouse brain cDNA (PTN positive control, lane 5). (Bottom) Positive control with glyceraldehyde 3-phosphate dehydrogenase (GAPDH) primers. (B) Quantitative PCR (q-PCR) showing relative expression of PTN and another extracellular, secreted molecule, collagen A1 (C01A1), in M06-G3, MD10-A11, and MD10-D3 cells, normalized against GAPDH mRNA levels. Standard deviation was calculated with three experiments. (C) q-PCR showing relative mRNA levels normalized against GAPDH mRNA levels for M06-G3 cells treated for 14 days with 200 ng BMP2, BMP4, or BMP7 (control is non-treated M06-G3 cells). Standard error was calculated with a minimum of three experiments performed. (D) Western blot of cell lysates from M06-G3, MD10-D3, MD10-A11, and EOE-3M cells. Positive control is shown in the right lane; mouse brain extract (Santa Cruz Biotechnology). (E–H) Immunocytochemistry of cells grown in culture until 80% to 90% confluent and stained with an antibody for PTN (Abcam; ab14025). The boxed areas are enlarged in the top left of the pictures. (E) U87MG cells. (F) M06-G3 cells. (G) EOE-3M cells. (H) Negative control M06-G3 cells (10% BSA used instead of primary antibody). Scale bars = 50 µm.
The size and the complexity of the PTN protein were next analyzed by Western blot. The presence of PTN protein in the mouse odontoblast-like cell lines M06-G3, MD10-D3, and MD10-A11, as well as the ameloblast-like cell line EOE-3M, was confirmed (Fig. 1D). The protein migrated as a major monomer of ~23 kDa in the mesenchymal-derived cells as well as the mouse brain extract positive control. However, within the ameloblast-like epithelial cells EOE-3M, the protein was slightly smaller at ~20 kDa. Furthermore, what we believe is PTN dimers and trimers can be seen at ~43 kDa and ~51 kDa in the dental mesenchymal cells only (M06-G3, MD10-A11, and MD10-D3, marked with an asterisk in Fig. 1D). Within the ameloblast-like cells (EOE-3M), a second peptide fragment of ~36 kDa was detected. Interestingly, the PTN dimers and trimers were not detected within the control mouse brain extract sample.
We next confirmed the presence of PTN at the protein level by immunocytochemistry and immunofluorescence in the same cell lines (Fig. 1E–H and Fig. 2). PTN at the protein level was detected using a rabbit polyclonal antibody raised against human pleiotrophin (Abcam; ab14025) as well as a mouse monoclonal antibody raised against amino acids 94 to 168 of human PTN (Santa Cruz Biotechnology; PTN [H-6]) (data not shown), but the first one was far superior in recognizing the PTN protein. In general, PTN was expressed in both the epithelial (EOE-3M cells; Fig. 1G) and mesenchymal-derived dental cell lines tested: M06-G3, MD10-A11, and MD10-D3 (Fig. 1F; data not shown for the MD10-A11 and MD10-D3 cell lines). U87MG (glioblastoma) cells were used as a known PTN positive control (Fig. 1E). Fluorescence imaging using a different clone of the PTN antibody (Abcam; ab10849) detected PTN throughout the cell (Fig. 2), similarly as for the HRP-based staining (Fig. 1E–H), but shows more intense staining in areas that appear perinuclear (endoplasmic reticulum) and cytosolic (transport vesicles) (Fig. 2), which is in agreement with a protein that is secreted after packaging into secretory vesicles and contains posttranslational modifications (disulfide bonds).
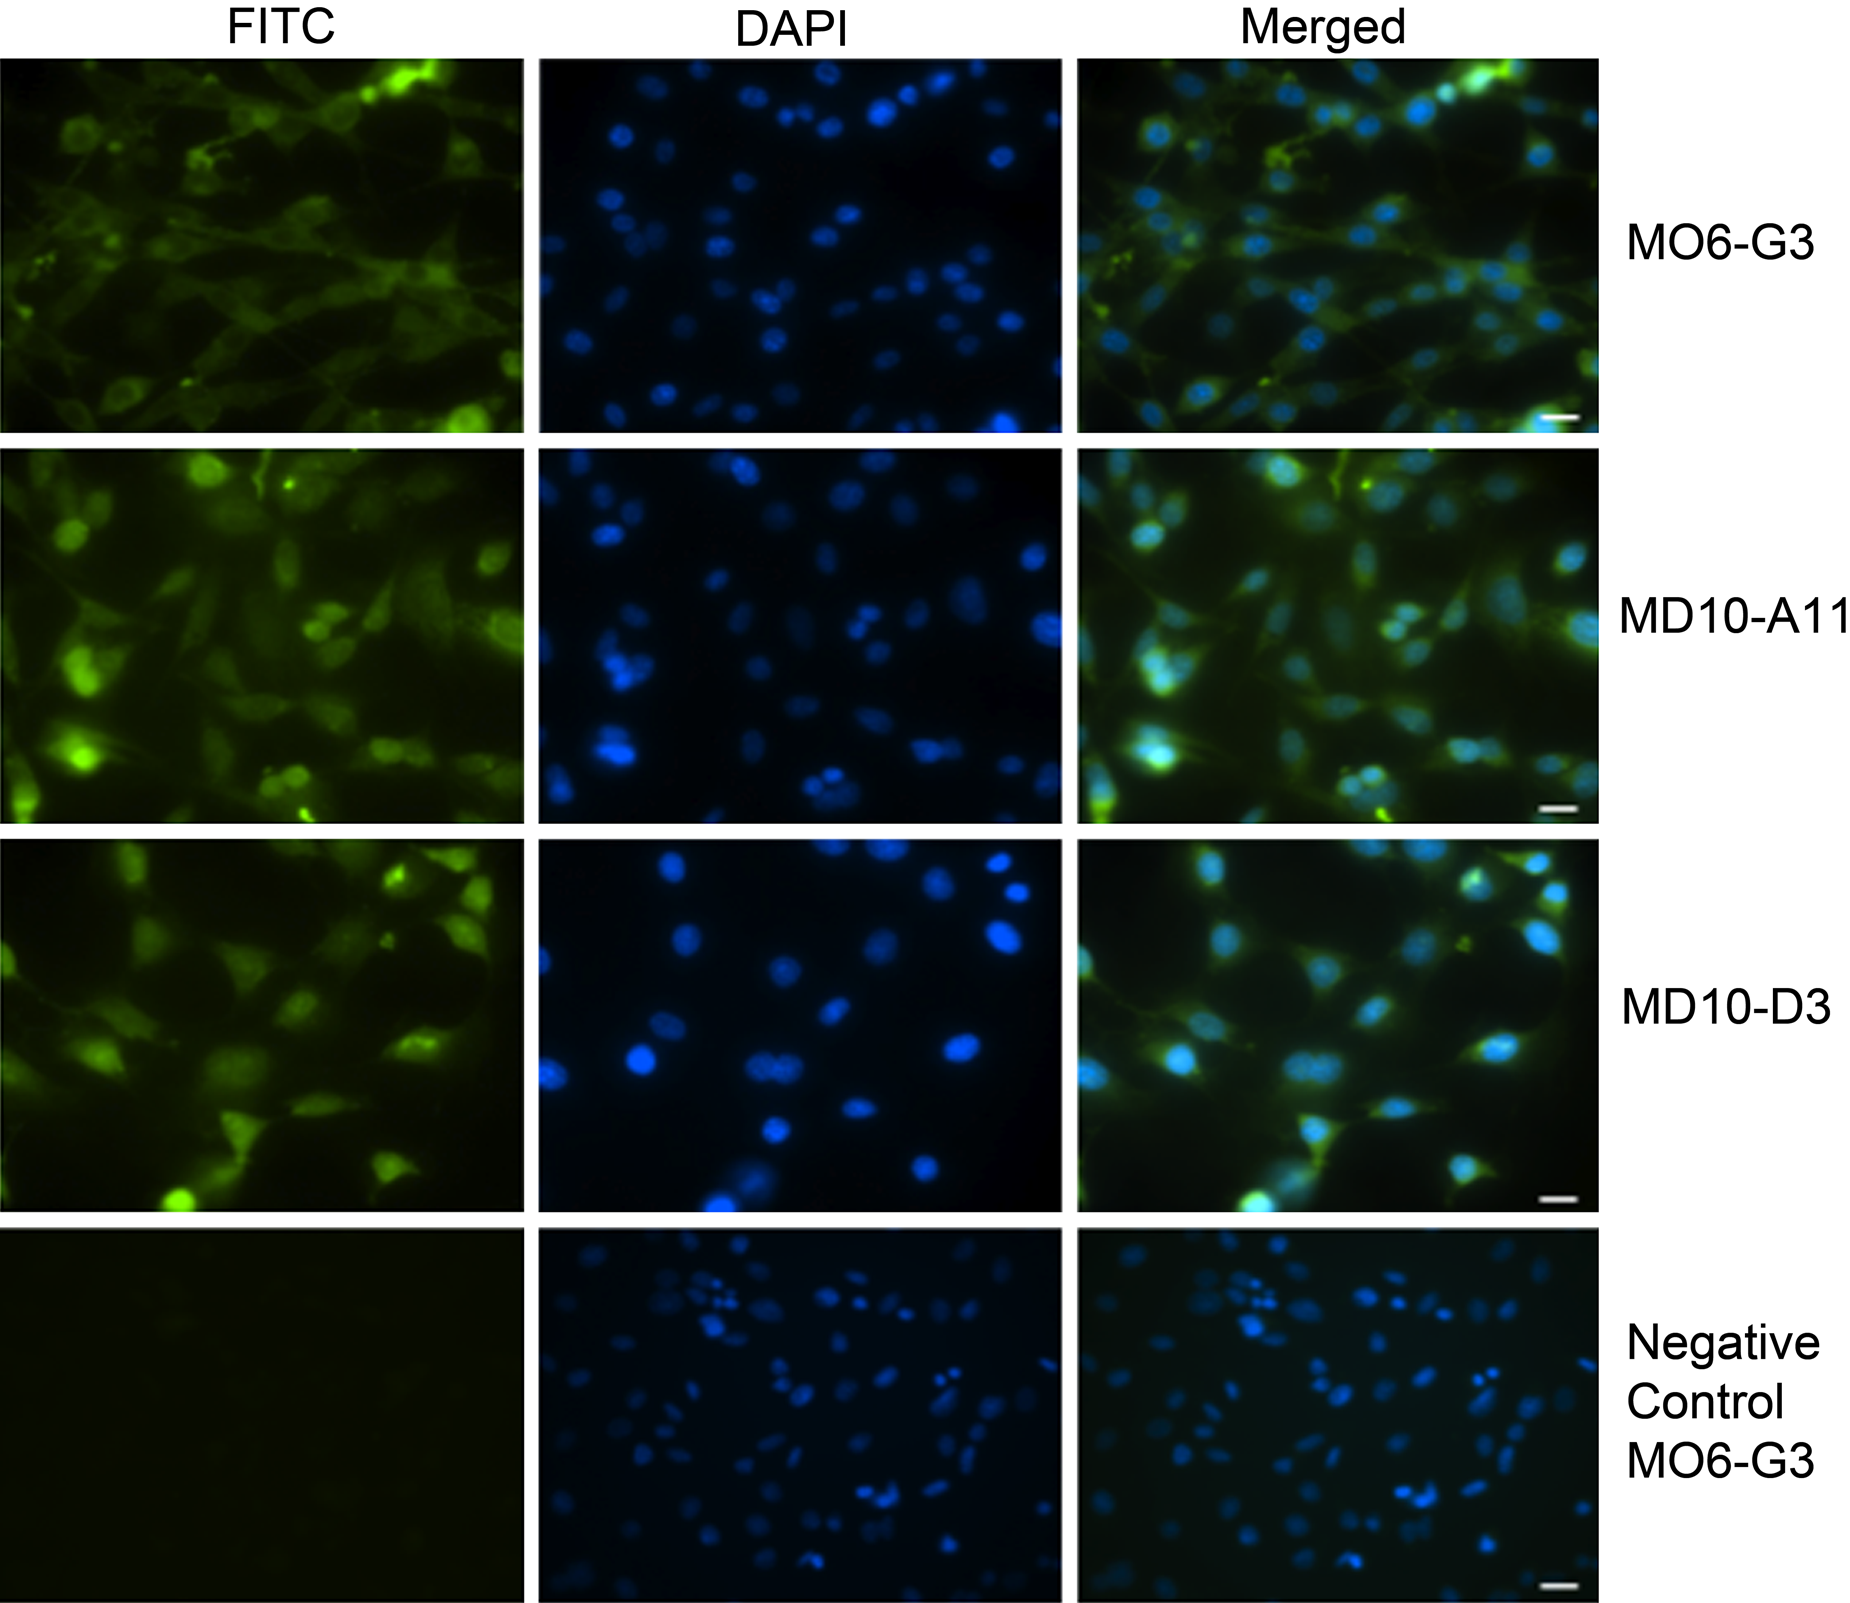
Immunofluorescence of mouse M06-G3, MD10-A11, and MD10-D3 cells stained with the pleiotrophin (PTN) antibody (Abcam; ab10849) at a 1:50 dilution. The secondary antibody was tagged with Alexa Fluor 388, followed by DAPI counterstaining. The same exposure time was used for all images. The negative control is with BSA instead of primary antibody, and only the M06-G3 control is shown as an example. Scale bars = 50 µm.
Finally, a more thorough spatiotemporal investigation of PTN protein by immunohistochemistry revealed that PTN is present throughout the stages of tooth development (Figs. 3–5). We saw an initial expression of PTN protein in the inner enamel epithelium (E16) and along the dental follicle with prolonged expression in the ameloblasts throughout their stages of maturation (days 1–28 postnatal; Fig. 3). PTN was also expressed at lower levels in the dental pulp mesenchyme (E16) with increased staining associated with odontoblast cytodifferentiation (Fig. 3). Expression was also detected within subpopulations of the stellate reticulum, the dental follicle, and the periodontal ligament. Strong staining was seen in the adult mouse incisor at P28 (Fig. 4), specifically in the odontoblasts, in the enamel (including Tomes’ processes), at the dentino-enamel junction (DEJ), at the secreting end of the ameloblast layer, and in the stratum intermedium (SI). Immunohistochemistry on adult (P28) mouse molars also detected strong staining especially in the odontoblasts, in dentin tubules/odontoblast processes, periodontal ligament, and at the root apex (Fig. 5). Positive staining was detected as expected within the forming alveolar bone within the osteoblasts and embedded osteocytes (Figs. 3 and 5).
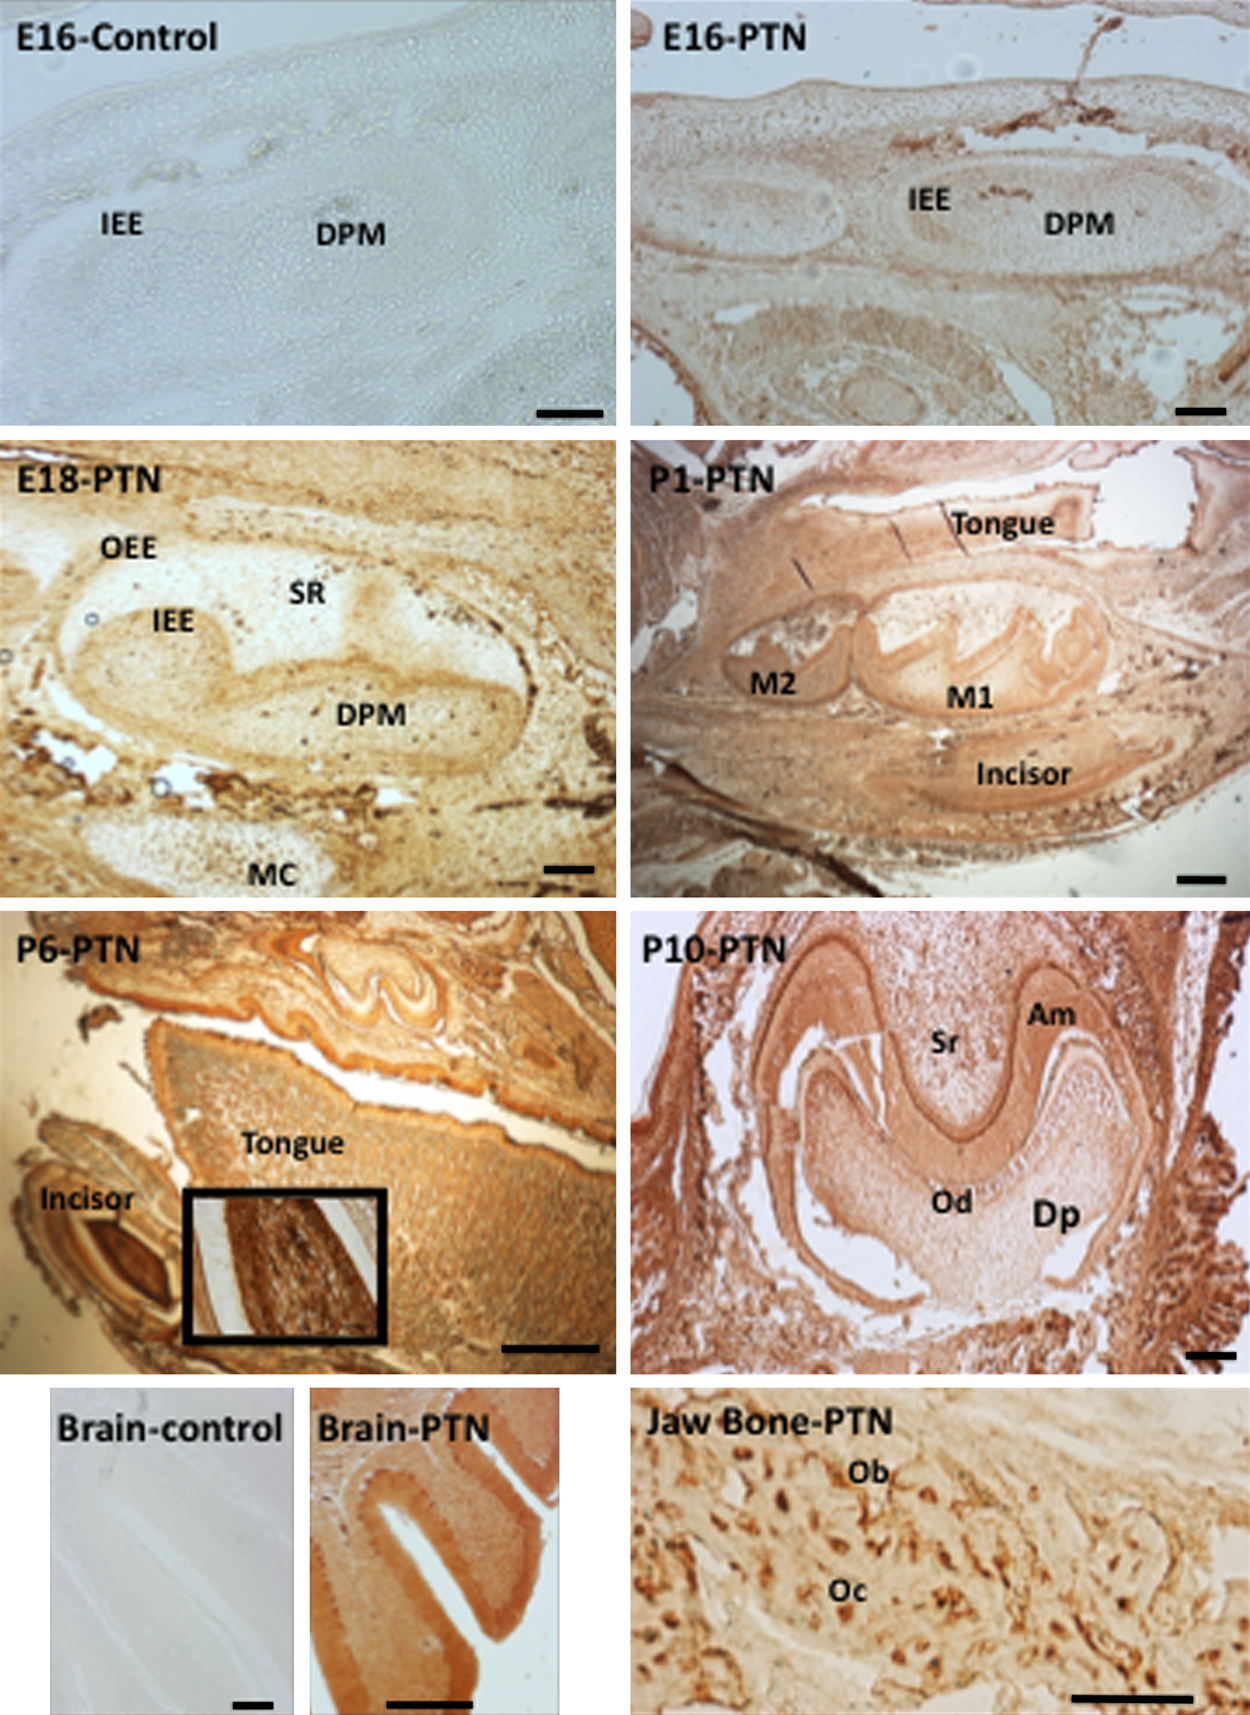
Immunohistochemistry of mouse tissue sections at developing stages E16, E18, P1, P6, and P10. Pleiotrophin (PTN) antibody (Abcam; ab14025) dilutions were 1:50. Positive PTN controls for brain and bone as well as representative negative controls (using BSA instead of primary antibody) are shown. IEE, inner enamel epithelium; OEE, outer enamel epithelium; DPM, dental pulp mesenchyme; SR, stellate reticulum; MC, Meckel’s cartilage; M1 and M2, molar 1 and 2; Dp, dental pulp; Od, odontoblasts; Am, ameloblasts; Ob, osteoblasts; Oc, osteocytes. Scale bars = 50 µm.
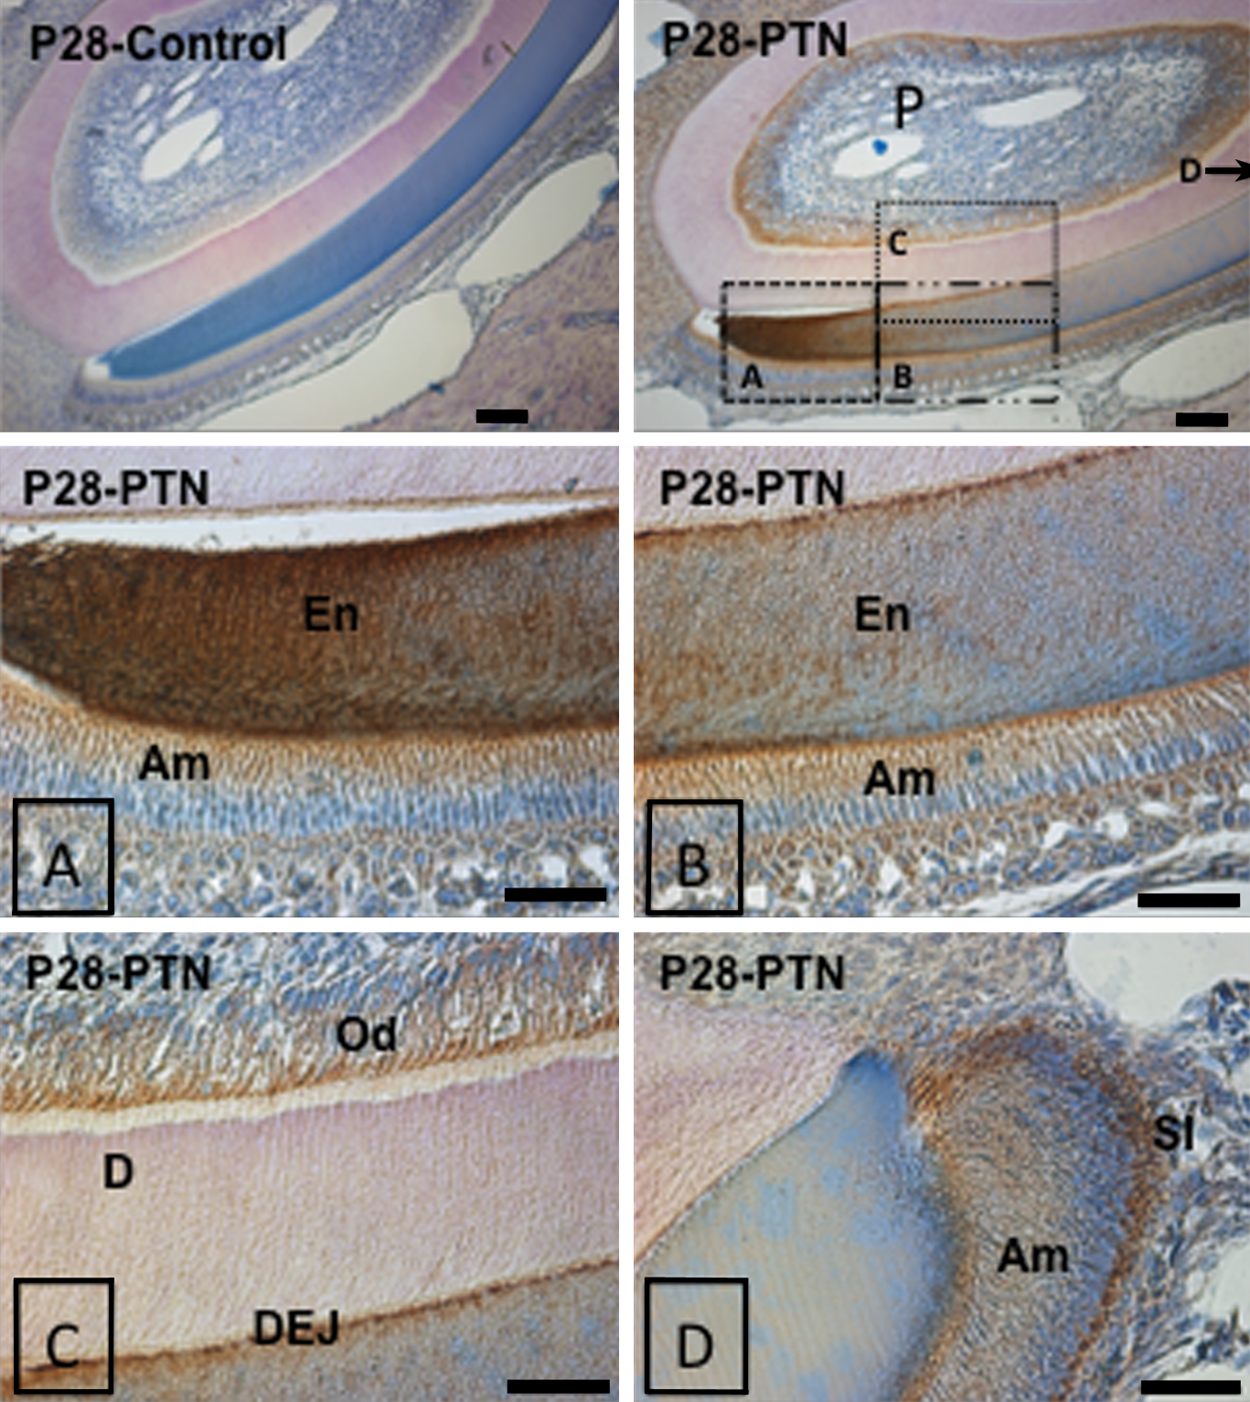
Immunohistochemistry of mouse tissue sections in adult mouse incisor (P28). Pleiotrophin (PTN) antibody (Abcam; ab14025) dilutions were 1:50. Positive PTN controls for brain and bone as well as representative negative controls (using BSA instead of primary antibody) are shown. P, pulp; En, enamel; Am, ameloblasts; Od, odontoblasts; D, dentin; DEJ, dentino-enamel junction; SI, stratum intermedium. Scale bars = 50 µm.
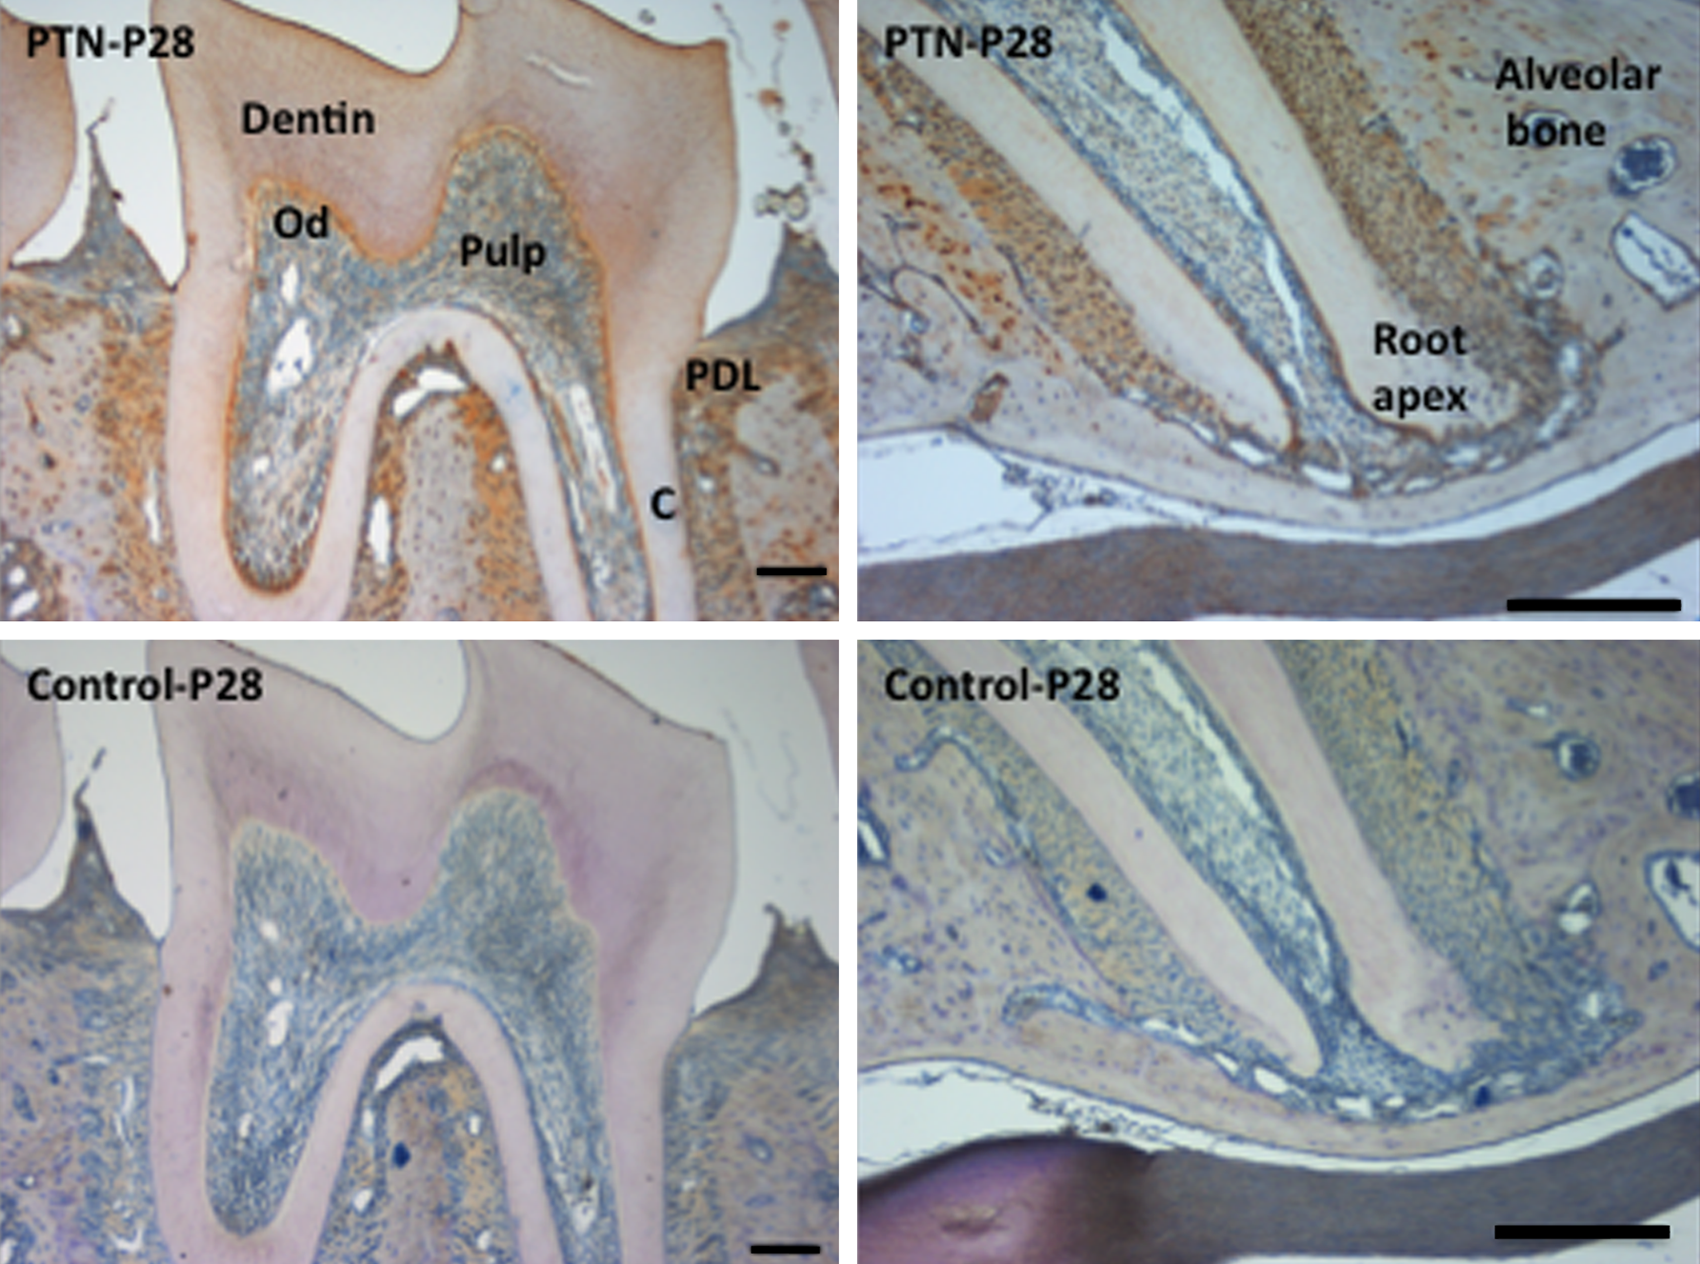
Immunohistochemistry of mouse molar and root tissue sections in the adult mouse (P28). Pleiotrophin (PTN) antibody (Abcam; ab14025) dilutions were 1:50. Negative controls (using BSA instead of primary antibody) are shown. C, cementum; Od, odontoblasts; PDL, periodontal ligament. Scale bars = 50 µm.
Discussion
This study demonstrates that PTN is widely expressed during tooth development and also in the adult mouse molar and incisor. Using an assortment of cell biology techniques, such as polymerase chain reaction (both conventional and quantitative), immunohistochemistry, immunocytochemistry, and Western blots, we detected PTN within a large number of dental cells and tissues both of epithelial and mesenchymal origin, at varying developmental stages, especially in the ameloblasts, odontoblasts, dental follicle, and periodontal ligament (Figs. 1–5). There was an increase in PTN staining associated with the terminal cytodifferentiation of both ameloblasts and odontoblasts and also at the enamel matrix–secreting ends of the polarized ameloblasts and odontoblasts, which suggests that PTN is an extracellular enamel matrix molecule and could be involved in enamel matrix maturation. PTN expression in odontoblasts and ameloblasts was also confirmed by both RT-PCR and Western blot analysis on immortalized mouse cells.
During the bud stage of tooth development (E11-E13 in mouse), proliferation of the epithelium into the underlying ectomesenchyme is taking place. Initiation of enamel and dentin formation begins in the early crown stage through the Wnt and BMP signaling pathways (P0 and onwards in mouse). This is a critical step in terminal cell differentiation that leads to dentin matrix formation. We observed strong PTN expression in the inner enamel epithelium (E16) and the dental pulp mesenchyme during the early time point (E16 and E18) but an even stronger and continued PTN staining in the terminally differentiated odontoblasts and ameloblasts (P1 and onwards) (Fig. 3). We observed a very intense staining in the pulp of the incisor and molar ameloblasts at the intermediate days P6 and P10. The adult mouse incisor has even stronger and more defined PTN staining compared with the developing mouse teeth, particularly in the enamel, the matrix-secreting ameloblasts and the Tomes’ processes of the ameloblasts, the odontoblasts, and the odontoblast processes protruding through the dentin and at the dentino-enamel junction (P28) (Figs. 4 and 5). We did not detect PTN expression in the pre-dentin next to the odontoblasts (Fig. 4).
PTN has the ability to promote migration, expansion, adhesion, and differentiation of human osteoprogenitor cells (Yang et al. 2003), and it is likely that PTN also has this function during ameloblast and odontoblast cytodifferentiation and maturation. We observed strong PTN staining in the pulp chamber in the mouse incisors at postnatal day 6 (P6) (Fig. 3), which is a source of mesenchymal cells. Both the epithelially derived ameloblast cells and the ectomesenchymally derived odontoblast cells showed strong staining for PTN at P28 (Fig. 4). PTN has been shown to have multiple effects on bone formation, and the effects are dependent on the concentration of PTN and the timing of its presence. To explain the multiple effects, it has been proposed that PTN is an accessory-signaling molecule, which is involved in a variety of processes in bone formation (Tare et al. 2002). PTN can thus enhance or inhibit primary responses depending on the prevailing concentrations, the primary stimulus, and the availability of appropriate receptors (syndecans and/or RPTP β/ζ) (Tare et al. 2002). One of the most prevalent integrins, αvβ3, is expressed on almost all the cells originating from the mesenchyme, and the presence of integrin αvβ3 seems to be a key factor that determines whether PTN will have a stimulatory or inhibitory effect on endothelial cell migration (Mikelis et al. 2009).
We detected strong and specific staining in the incisor at PN28 in the region where the mature ameloblasts and the stratum intermedium meet, as well as in the mature enamel, but not in the dentin or pre-dentin, which could be due to all tissue older than P3 being decalcified using EDTA. In general, proteins interacting with the hydroxyapatite in the lesser calcified pre-dentin and dentin may be removed together with the calcium upon this three-week EDTA treatment but still remain to some extent within the more calcified enamel. The observed lack of PTN in the pre-dentin and the dentin is interesting, because of a previous report where incisors cultured in neutralizing antibodies against the PTN homologue MK were unable to form dentin. This was suggested to be due to the pulp cells being unable to differentiate into odontoblasts and to participate in mineral formation and deposition (Mitsiadis et al. 2008). Several growth factors, such as BMP2, BMP4, and EGF molecules, have been shown to activate expression of both PTN and MK in the dental mesenchyme (Mitsiadis et al. 2008). We found that after a two-week treatment of M06-G3 dental pulp/odontoblast cells with the osteogenic BMPs, BMP2 and BMP7, the expression of PTN was increased significantly as compared with untreated M06-G3 cells in our q-PCR experiments. This is in accordance with the results of Mitsiadis et al. (2008). Conversely, BMP4 treatment in the M06-G3 cells decreased the PTN transcript level, contrary to what was seen in the mesenchymal explant culture bead assay of Mitsiadis et al. (2008). The difference may be due to the lengths of treatment (two weeks of BMP treatment in our cultured cells vs. 20 hours of BMP4-soaked beads in the mesenchymal explants [Mitsiadis et al. 2008]). A more detailed study using several different dental cell lines at varying stages of differentiation as well as times and amounts of BMP treatment will be necessary to further delineate the effect of other growth factors on PTN and MK and the basis of the differential regulation of BMPs on PTN.
Interestingly, we detected PTN dimers (~43 kDa), trimers (~51 kDa), and monomers (~23 kDa) in the Western blots of dental cell lysates treated with DTT on an SDS-PAGE. PTN dimers and trimers have previously been described in other SDS-PAGE Western blots from rat brain extracts and cerebral Purkinje cells (Maeda et al. 1996; Bernard-Pierrot et al. 1999; Shimazaki et al. 2005; Taravini et al. 2005) and are believed to be a result of PTN being cross-linked by heparin or with chondroitin sulfate (CS) by transglutaminase (Maeda et al. 2006). In fact, the Western blot for all three odontoblast cell lines (M06-G3, MD10-A11, and MD10-D3) looked exactly like the one reported in Bernard-Pierrot et al. (1999). The fact that the EOE-3M cells do not show the same dimer-trimers could mean a different level or kind of heparin/oversulfated receptors present in the different cell lines. Both the PTN receptors syndecan-1 and -3 and RPTP β/ζ are known to have multiple CS chains; the size and extent of CS oversulfation vary during vertebrate developmental stages. Syndecan-1 and -3 are known to be present in tooth epithelium during development and are both cell-surface heparan sulfate proteoglycans that act as receptors for not only PTN but also several matrix molecules and growth factors, such as FGF (Thesleff et al. 1995).
It is clear that both PTN and MK are expressed throughout odontogenesis and later on in the adult mouse. This study on PTN expression in mouse teeth serves as a model for the localization of PTN in human teeth. As it is difficult to carry out immunohistochemical studies in humans, a further and more detailed analysis that will involve the double knockout mouse (for both MK and PTN) (Muramatsu et al. 2006) will be necessary to elucidate the exact involvement of the two-member family of redundant function growth factors PTN and MK during tooth formation and their regulation by BMPs.
Footnotes
Acknowledgements
We are very grateful to Dr. Dobrawa Napierala for help and discussion during the manuscript preparation and for Angela Gullard for expert help with some of the quantitative PCR experiments. We would like to acknowledge help from the University of Alabama at Birmingham Histomorphometry and Molecular Analyses Core with processing and sectioning of mouse tissue.
The authors declared no potential conflicts of interest with respect to the research, authorship, and/or publication of this article.
The authors disclosed receipt of the following financial support for the research and/or authorship of this article: The work presented here was funded in part by the NIDCR (R03DE019497–01A1).