
Abstract
The increased use of immunohistochemistry (IHC) in both clinical and basic research settings has led to the development of techniques for acquiring quantitative information from immunostains. Staining correlates with absolute protein levels and has been investigated as a clinical tool for patient diagnosis and prognosis. For these reasons, automated imaging methods have been developed in an attempt to standardize IHC analysis. We propose a novel imaging technique in which brightfield images of diaminobenzidene (DAB)-labeled antigens are converted to normalized blue images, allowing automated identification of positively stained tissue. A statistical analysis compared our method with seven previously published imaging techniques by measuring each one's agreement with manual analysis by two observers. Eighteen DAB-stained images showing a range of protein levels were used. Accuracy was assessed by calculating the percentage of pixels misclassified using each technique compared with a manual standard. Bland-Altman analysis was then used to show the extent to which misclassification affected staining quantification. Many of the techniques were inconsistent in classifying DAB staining due to background interference, but our method was statistically the most accurate and consistent across all staining levels.
T
Computer-assisted analysis of immunostains has been shown to lessen the variation in analysis of staining levels (Seidal et al. 2001). Advanced digital image processing systems have become more readily available and easier to use and could become an important tool for IHC analysis. A variety of computer-assisted methods have been developed to aid in the analysis of digital images of immunostains (Goto et al. 1992; Huang et al. 1996; Montironi et al. 1996; Kohlberger et al. 1999; Lehr et al. 1997,2001; Ruifrok 1997; Smejkal and Shainoff 1997; Ma and Lozanoff 1998; Vilaplana and Lavaille 1999; Matkowskyj et al. 2000; Ruifrok and Johnston 2001; Underwood et al. 2001; King et al. 2002; McGinley et al. 2002).
Horseradish peroxidase (HRP) is an enzyme marker frequently used for IHC staining. Diaminobenzidene (DAB), followed by a hematoxylin counterstain, can be used to identify the HRP-labeled antigen. DAB reacts with HRP to give a brown coloration and hematoxylin stains the background tissue blue. Visually, an observer can differentiate between the two colors when the antigen staining is high. However, low levels of stained antigen are difficult to separate from areas of dark counterstain. This difficulty in differentiating between these areas of staining leads to variations in the results of manually analyzed staining patterns. Imaging methods that reduce dependence on observer analysis would decrease the time of analysis and lessen the variation in results among different laboratories.
In the development of image-processing methods for the delineation of DAB-stained tissue from background hematoxylin, conventional techniques are hampered by high levels of nonspecific selection (Ruifrok 1997; King et al. 2002). Various investigators have developed more advanced imaging methods using both interactive (Lehr et al. 1997; Vilaplana and Lavaille 1999; Underwood et al. 2001; King et al. 2002; McGinley et al. 2002) and automated imaging techniques (Goto et al. 1992; Montironi et al. 1996; Kohlberger et al. 1999; Ruifrok 1997; Smejkal and Shainoff 1997; Ma and Lozanoff 1998; Ruifrok and Johnston 2001). Fully automated methods would allow rapid analysis of IHC staining with limited observer bias, but none of the previous methods has shown the statistical accuracy required of an analysis standard.
We have developed a method of image analysis that permits automated selection of positively stained tissue areas using digital images of DAB-labeled immunostains. Brightfield (24-bit) images of DAB-labeled stains are converted to 8-bit normalized blue images (BN), which accurately delineate stained tissue from background counterstaining. This method is simple and can be performed with most conventional image-processing software programs. Here we describe our method and seven other published techniques. A statistical analysis is presented comparing the methods on the basis of their agreement with manual selection of stained tissue.
Materials and Methods
Animal Model and Surgery
New Zealand White rabbits have been used as an animal model to study growth factor localization in a healing tooth extraction socket (Lalani et al. in press). Slides from this study were used to evaluate the imaging techniques. Four incisor teeth (two maxillary and two mandibular) were extracted atraumatically from each animal using dental elevators and general anesthesia. The resultant tooth extraction sockets were allowed to heal for selected time frames (for this study, all samples were taken after 2 weeks of healing), at which time the animals were sacrificed. The jaw bone containing the tooth extraction sockets was harvested from each rabbit and processed for IHC analysis (Bourque et al. 1993; Mori et al. 1988). Animal surgery, postoperative care, and sacrifice were carried out per National Institute of Health guidelines and with the approval of The University of Texas Health Science Center at Houston Animal Welfare Committee (HSC-AWC-99–107).
Immunohistochemistry
The harvested tissue was fixed with paraformaldehyde-lysine-phosphate fixative (McLean and Nakane 1974), decalcified using ethylenediaminetetraacetic acid-glycerol (Bourque et al. 1993; Mori et al. 1988) for 5 weeks, washed to remove the glycerol, and frozen in OCT embedding medium (Tissue-Tek; Torrance, CA). Sections were cut 10-μm thick on a cryostat and placed on 3-aminopropyltriethoxysi-lane-coated slides.
IHC staining was performed using the avidin-biotin complex (ABC) technique for detection of antibodies to the following growth factors: vascular endothelial growth factor (VEGF), bone morphogenetic protein-type 2 (BMP-2), and fibroblast growth factor type 2 (FGF-2). These growth factors were selected because after 2 weeks of healing their levels in the tooth socket are expected to differ from one another. Slides were incubated in 3% H2O2 in methanol for 1 hr to quench endogenous peroxidase activity. The sections were washed twice with PBS for 5 min each and then incubated with normal blocking serum for 1 hr. This was followed by incubation with goat anti-human (BMP-2 and FGF-2; Santa Cruz Biotechnology, Santa Cruz, CA) and mouse anti-human (VEGF; Upstate Biotechnology, Lake Placid, NY) primary antibodies overnight at 4C in a humidity chamber. Then sections were washed with PBS, again twice for 5 min each, and incubated with biotinylated rabbit anti-goat (BMP and FGF-2) or horse anti-mouse (VEGF) secondary antibody (Vectastain ABC Elite kit; Vector Laboratories, Burlingame, CA) for 1 hr. Sections were then treated with ABC solution (Vectastain ABC Elite kit) for 1 hr, washed with PBS, and incubated with DAB substrate for 10 min. Counterstaining was carried out with Harris hematoxylin (Sigma-Aldrich; St Louis, MO). Controls were routinely included.
An additional image (a generous gift from Guido Sclabas, MD) is presented to show the applicability of this technique to a cytoplasmic DAB stain. The image is a section of human pancreatic cancer stained with goat anti-human Trk B (Santa Cruz Biotechnology), an antibody that stains the cytoplasmic domain of the Trk B receptor. The secondary antibody used was HRP-conjugated anti-goat (DAKO; Carpinteria, CA), and the image was acquired on a Nikon ECLIPSE E400 microscope and using a Sensys digital camera.
Imaging
Brightfield images were captured from immunostains of the healing socket using an Olympus IX-50 inverted microscope (Olympus; Melville, NY) with a X20 objective lens (NA 0.40) and an Olympus 750 color CCD camera. IPLab 3.5 image analysis software (Scanalytics; Fairfax, VA) allowed computer control of image acquisition and all image processing. Four images were acquired from a randomly selected location in each slide, white-balanced, and averaged to minimize noise. No further image processing was performed before image analysis. The resulting images were 637 × 480 pixels, with a pixel resolution of 0.61 μm. Six slides were analyzed per growth factor, resulting in 18 total images analyzed in the study.
Manual Selection
Manual selection is currently accepted as the most accurate technique for classifying an area as stained positively for DAB chromogen. To allow for variation between observers, images of DAB-stained tissue were examined and positively stained areas were selected by two independent observers (EMB and ZL) using the “paintbrush” and “region of interest” tools in IPLab. Selection was repeated on 3 different days to allow for intraobserver variation.
Automated Techniques
In conventional digital imaging, brightfield images are a composite of three 8-bit monochromatic channels (red, green, and blue), resulting in a 24-bit color image. The imaging techniques discussed below are based on converting these images into a format that allows maximal separation of DAB-stained pixels from background tissue (i.e., largest dynamic range). Imaging software can then be used to set thresholds for automated DAB selection and quantitation of staining parameters (e.g., percentage of area stained, intensity, integrated optical density).
The red, green, and blue channels of brightfield images can be normalized by the sum of the three channels. Pixel values of 8-bit BN images are calculated using the following equation:
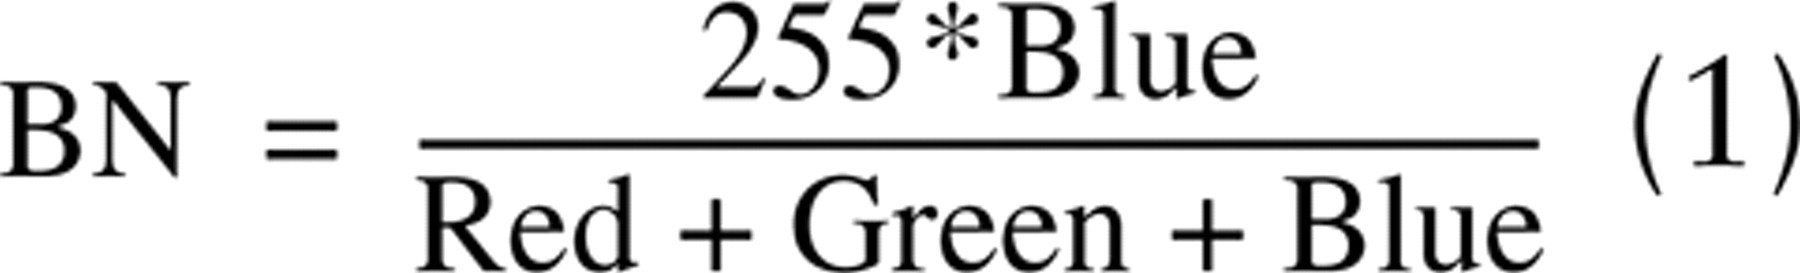
where Red, Green, and Blue are the pixel values of the three monochromatic channels, and ∗ indicates multiplication.
We analyzed our images by converting them to BN images for automatic classification of tissue stained for the DAB chromagen and compared our results to seven other published automated selection methods: blue channel (Blue) (King et al. 2002), green filtered (Green) (Smejkal and Shainoff 1997), Hue (Ma and Lozanoff 1998), Hue-Saturation Intensity (HSI) (Goto et al. 1992; Kohlberger et al. 1999), Green divided by Blue (G/B) (Montironi et al. 1996), Brown (Ruifrok 1997), and Color Deconvolved (CD) (Ruifrok and Johnston 2001).
Selection of DAB-stained pixels by setting a threshold on the blue channel values is the best option of the RGB monochromatic channels, but background interference can be considerable (Kuyatt et al. 1993; Ruifrok 1997; King et al. 2002).
A green filter in the light path enhances the sensitivity of Western blotting analysis to low DAB staining levels and decreases the inclusion of background staining (Smejkal and Shainoff 1997). The green channel of the filtered brightfield image was extracted and used to set thresholds and identify DAB-stained pixels.
The HSI coordinate system is intended to more closely correspond with the way humans perceive color (Goto et al. 1992; Castleman 1996; Ma and Lozanoff 1998; van der Laak et al. 2000), and conversion of RGB images to the three 8-bit HSI images is an option available on most modern imaging systems (including IPLab). Hue is a measurement of the dominant wavelength (van der Laak et al. 2000) or color quality (Ma and Lozanoff 1998). Hue images may provide a more useful means for assessing color change and have been suggested to enhance the separation of DAB and hematoxylin staining (Ma and Lozanoff 1998). There are many mathematical techniques for calculating the image Hue from RGB images (Goto et al. 1992; Castleman 1996; Ma and Lozanoff 1998; van der Laak et al. 2000), all of which give similar results (unpublished data).
Although the Hue image has been used alone, other investigators have selected DAB-stained tissue using combined thresholding along all HSI channels (Goto et al. 1992; Kohlberger et al. 1999). For one analysis, we set a threshold for the Hue image only, and in another we classified DAB-stained pixels by combining the thresholds of all three HSI images, which allowed maximal selection of the DAB-labeled tissue.
Brown, G/B, and CD are mathematical translations of RGB information obtained from brightfield images. Brown images are proposed to allow maximal separation of DAB and hematoxylin (Ruifrok 1997). Pixel values for Brown images are calculated by the following equation:

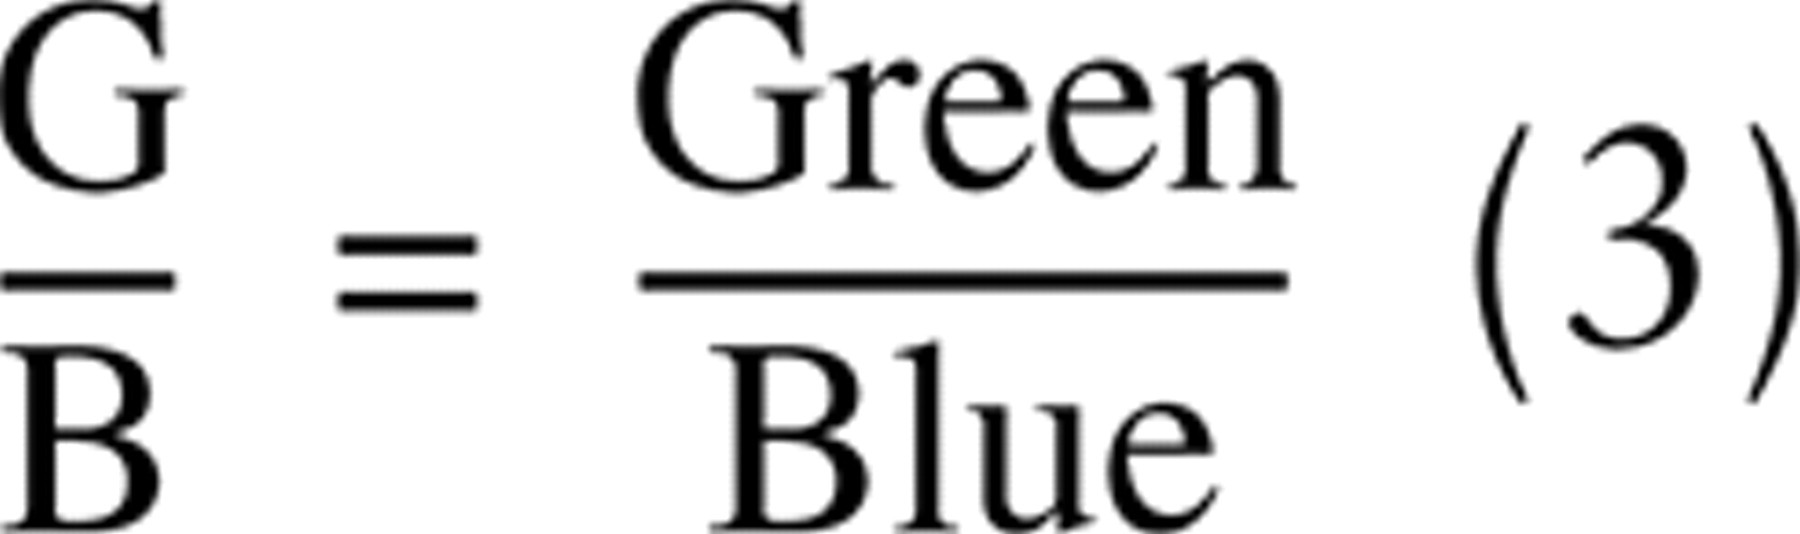
G/B images have been used in the study of DAB-stained endothelial cells, and the technique is said to allow clear distinction between DAB-stained area and background hematoxylin (Montironi et al. 1996). Quite simply, G/B images are calculated by dividing the green channel of the bright-field image by the blue channel:
CD was developed through deconvolution mathematics to determine the relative contributions of each of the RGB color channels to DAB staining (Ruifrok and Johnston 2001). Parameters are given in the original article for calculating CD, but they will vary for different staining and imaging protocols. To use this technique appropriately, new parameters were determined for the protocols of our laboratory. Briefly, the monochromatic pixel values (Red, Green, Blue) are first converted to optical density (OD) values. Typically, a density standard is used to calibrate imaging systems for conversion to OD values, but Ruifrok and Johnston (2001) propose capturing a control image of a blank field of view and using it to calculate OD values according to the following equation:
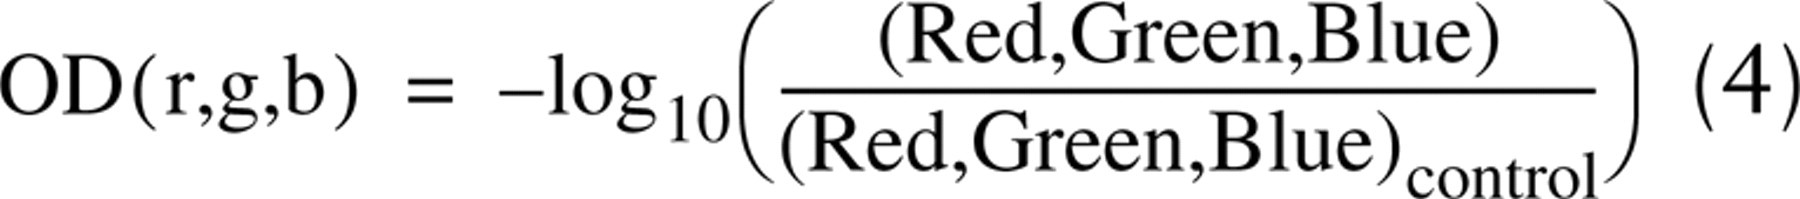
where r, g, and b are the optical density values for each monochromatic color and (Red, Green, Blue)control are the pixel values for the image of the blank field. Samples stained for DAB only were used to determine the mean OD values for DAB-stained tissue in the absence of hematoxylin. The same was done for tissue stained with only hematoxylin or eosin. Using these values and the mathematical procedure given by Ruifrok and Johnston (2001), we determined CD images for our laboratory to be calculated as:

Threshold values for each of the methods were set after examining preliminary images stained at the same time as the 18 images used in the statistical study. For any IHC staining procedure, control slides of tissue with a known staining pattern should be included to verify the accuracy of the results. Images of these control tissues are examined to determine the threshold. Values should be selected that maximize selection of the known positive tissue in the control while minimizing background interference. These images were used only for determining threshold parameters and were not included in the statistical study. The threshold values of each technique were held constant in the analysis of all 18 images. Scripts were written in IPLab that allowed automatic analysis of the 18 images, including conversion of RGB images to the required formats, pixel classification with constant threshold values for each technique, and analysis of staining. Once thresholds were set, the process was completely automated for the analysis of all 18 images using all techniques. Again, all of these processes can be automated using most image processing software programs.
Analysis
The accuracy of these methods was assessed based on the percent agreement with manual selection of stained tissue and by calculating the variation in quantitation of a staining parameter. For calculation of percent agreement, a gold standard for each image was constructed from the six (two observers, 3 days each) manual analyses. Any pixel selected as DAB-stained by three or more of the manual observations was designated as DAB-positive. The automated methods were compared to this manual gold standard and the percentage of misclassified pixels (i.e., pixels not in agreement with the gold standard) was calculated for each method. This is a direct measurement of the agreement of each technique with manual analysis.
It is important to understand how this misclassification affects the measurement of staining parameters (e.g., percent area, integrated optical density, mean intensity). IHC staining levels have been shown to correlate with protein measurements (Aasmundstad et al. 1992; Lehr et al. 1997; Podhajsky et al. 1997; Bhatnagar et al. 1999; Dias et al. 2000; Simone et al. 2000) and even DNA measures (Venter et al. 1987; Ratcliffe et al. 1997; Gerdes et al. 1998; Jacobs et al. 1999; Lehr et al. 2001) of highly amplified genes. There are a number of ways to measure the “level” of IHC stains. In some instances, the area of tissue stained for DAB is used (percent area). This is the area of the image classified as DAB stained, divided by the total image area:
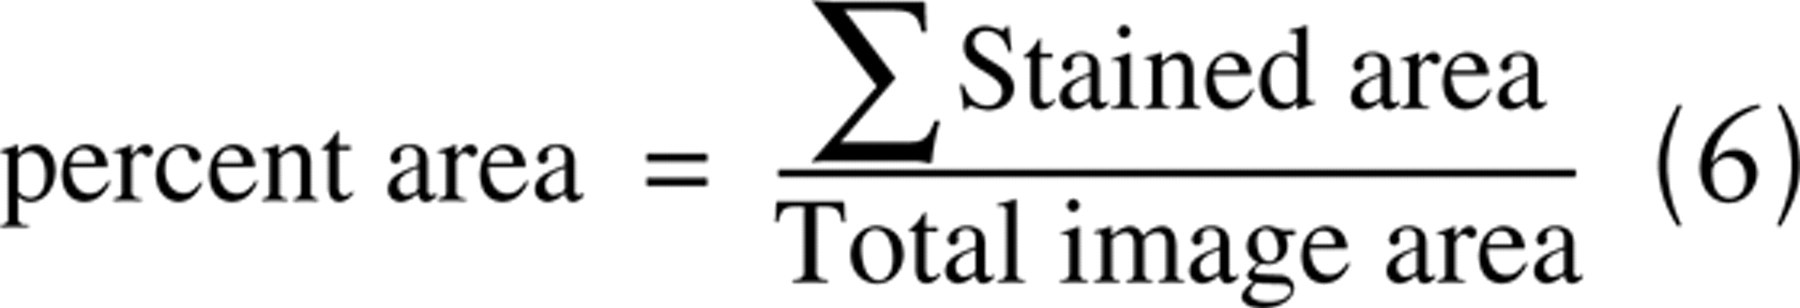
The percent area of DAB-stained tissue for all images was determined for each manual observation and the eight automated methods. The statistical determination of agreement in percent area between manual analysis and the automated techniques is described below.
Statistics
The mean (±SEM) of percentage misclassified pixels was determined for each technique. Lower values indicate more accurate methods, with 0% representing exact agreement with manual analysis. Difference testing was performed using a paired Student's t-test. Statistical significance was defined as p≤0.05.
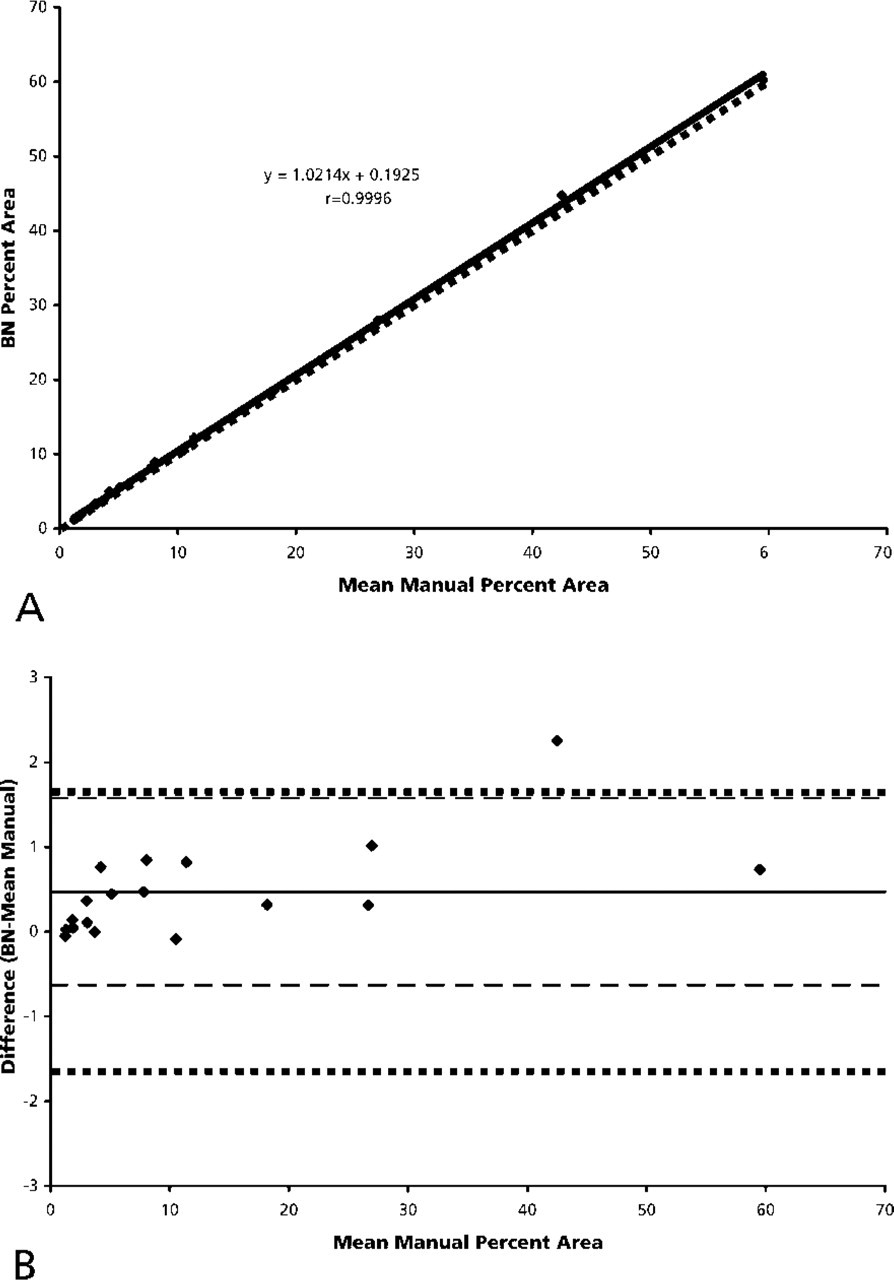
Manual measurement of the percent area of stain is not absolute because of inter- and intraobserver differences. Concordance correlation (r) and the slope of the regression line for the mean percent area of each observer were calculated and the data plotted against the line of perfect agreement (observer one mean = observer two mean). Linear regression provides a graphical representation of agreement and correlation measures the linearity of the data. This method gives insight into the accuracy of the data but cannot be used as an independent measure of agreement (Hansen et al. 1998; Daly and Bourke 2000; King et al. 2002).
Calculation of 95% confidence intervals using Bland-Altman analysis is the most direct way to measure agreement between the observers (Bland and Altman 1996; Daly and Bourke 2000; King et al. 2002). The mean percent area value across all six manual measurements was calculated for each image. The mean difference () and standard deviation (s) between each observer value and this mean value were calculated. The mean manual value then has a 95% confidence interval of ± 1.96s (Bland and Altman 1996; Daly and Bourke 2000; King et al. 2002).
Pixel misclassification results in inaccuracies in stain quantitation. Results of percent area measurements by the automated techniques were compared with mean manual values using similar analyses: concordance correlation and Bland-Altman agreement analysis. When two techniques (in this study, manual and each individual automated method) are compared, automated percent area measurements are expected, with 95% confidence, to differ from the mean manual value by the following interval:

This range is the confidence limit for the techniques when the percent area is measured. The more narrow the range of agreement, the more precise the method. The closer these values are to zero, the more accurate the method. A fundamental assumption for Bland-Altman analysis is that must be independent of the measurement magnitude. This was verified by calculating correlation coefficients for plots of against mean observer values (data not shown).
Results
Images
Two weeks after tooth extraction, a healing socket is characterized by the formation of bone spicules within the soft tissue matrix. Figure 1A shows a representative image of a healing socket stained for VEGF. Areas of DAB-labeled tissue are seen close to dark hematoxylin-stained nuclei. The 8-bit processed images resulting from the automated techniques evaluated in this study are shown in Figures 1B-1H.
Hue (Figure 1B) clearly differentiates between the dark nuclei and DAB-stained tissue. However, distinguishing DAB staining patterns in the bone spicule is difficult. The pattern of differential staining in the bone is lost. The Blue (Figure 1C) and Green (Figure 1D) images provide a clearer picture of the overall tissue morphology. Variations in staining within the spicules are evident, but stained nuclei are not easily distinguished from low-intensity areas of DAB stain. The Brown technique (Figure 1E) enhances areas of low staining compared to the Green and Blue methods. Differentiation between some nuclei and DAB-stained tissue is improved but the majority of nuclei remain indistinguishable from low-intensity DAB staining.
In the G/B (Figure 1F), CD (Figure 1G), and BN images (Figure 1H), cell nuclei are converted to a distinctly different intensity level and are easily distinguished from the stained tissue. Unlike with the Hue method (Figure 1B), this is accomplished while maintaining the differential staining pattern within the tissue. DAB staining can easily be separated from both the dark blue nuclei and the light hematoxylin intensity in the background, while maintaining the staining pattern in the tissue.
Misclassification
All methods allowed rapid analysis of the 18 images using programs written in IPLab. Staining levels in all 18 images with all techniques were analyzed in less than 5 min using the preset thresholds.
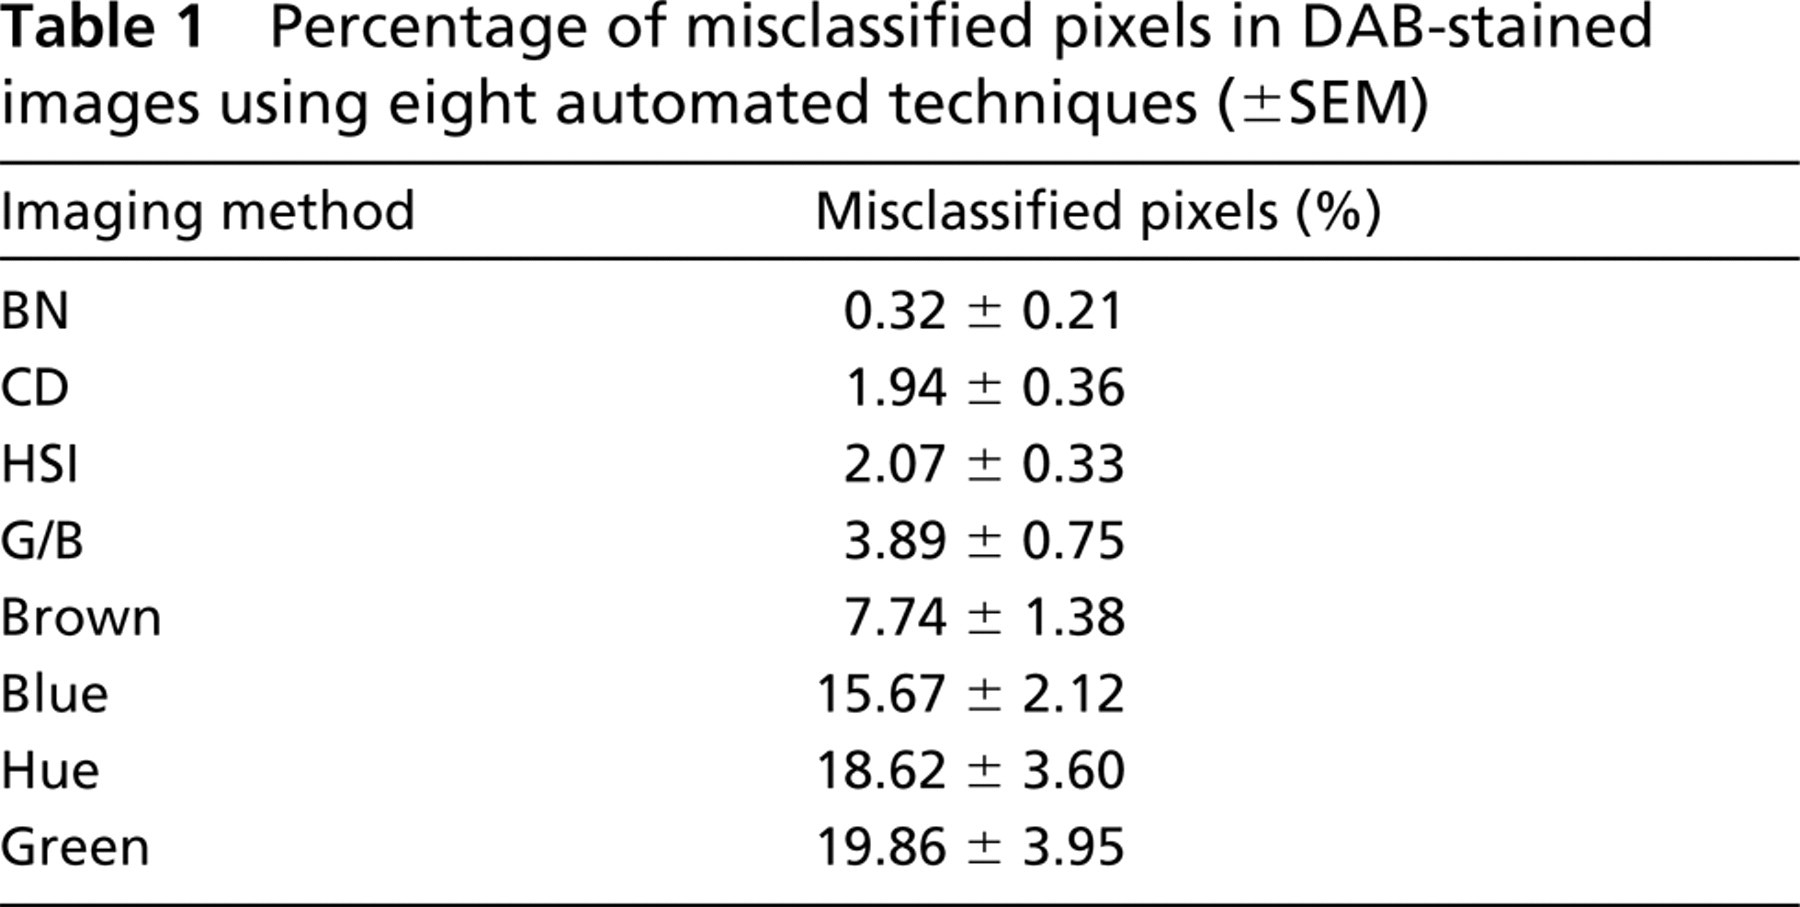
Table 1 reports the mean percentage of pixels misclassified using each image processing technique. The BN method resulted in the lowest percentage of pixels misclassified (0.32 ± 0.21%). The CD method resulted in the second lowest level of misclassification (1.94 ± 0.36%). Hue alone resulted in higher misclassification (18.62 ± 3.60% misclassified), but thresholding along all HSI images greatly reduces the misclassification (2.07 ± 0.33% misclassified). Images from B/G were misclassified by 3.89 ± 0.75%, with the Brown method slightly higher at 7.74 ± 1.38%. Blue and Green images yielded levels of misclassification similar to Hue (15.67 ± 2.12% and 19.86 ± 3.95%, respectively).
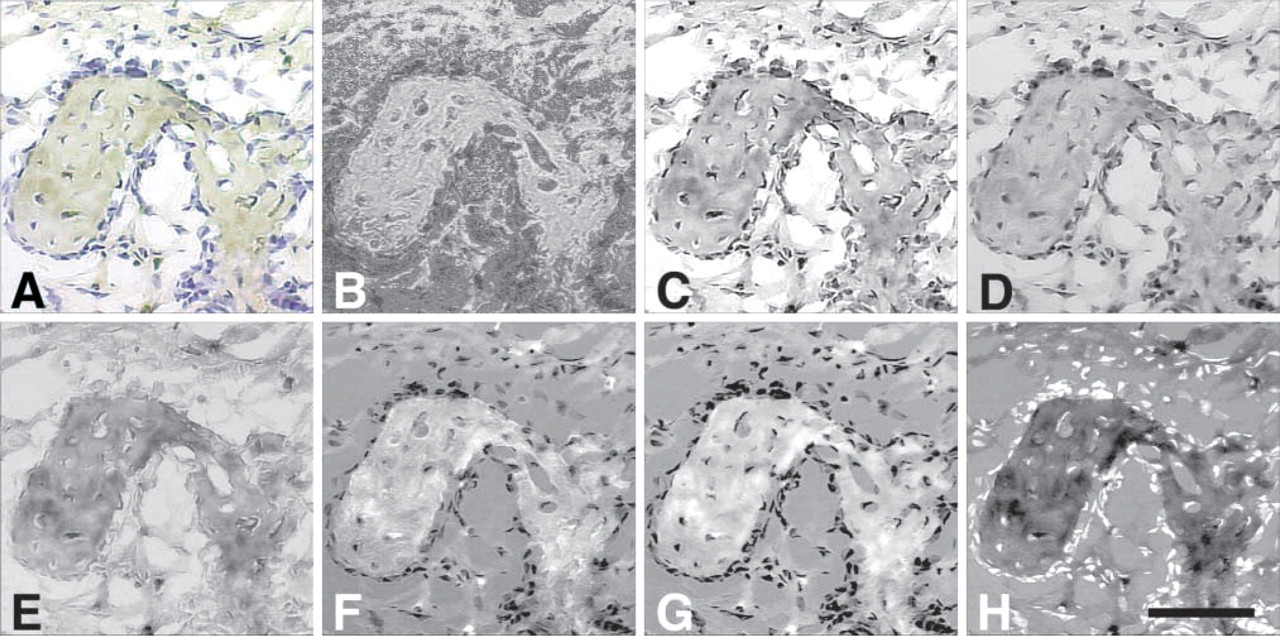
Example brightfield images of VEGF immunostaining in a tooth extraction socket. The socket at 1 week after extraction is characterized by the formation of spicules of bone within the soft tissue matrix. Brown is positive VEGF stain and blue is hematoxylin counterstain. (
Percentage of misclassified pixels in DAB-stained images using eight automated techniques (±SEM)
Observer Variation
Table 2 summarizes the concordance correlation, Bland-Altman analysis, and 95% confidence ranges using manual and automated methods to quantitate staining via measurement of the percent area of DAB stain. Figure 2A is a plot of the mean values for percent area from each observer. The data indicate almost perfect agreement between observer one and observer two (r = 0.9979; slope of regression line = 1.02). According to Bland-Altman analysis, the confidence interval for manual measurements of percent area is ±1.64 percentage points (Figure 2B). This indicates that any single manual measurement of percent area is within 1.64 percentage points (95% confidence) of the gold standard.
Percent Area
The mean differences () between the automated and manual measurements of percent area were less than 3 percentage points for all methods (Table 2). A better determination of accuracy is the 95% CI because it includes the entire range of possible values. Automated measurements of percent area using BN strongly correlated with manual measurements (r=0.9996) but were slightly higher on average (=0.47 percentage points). BN measurements of percent area fell between −0.63 and 1.58 percentage points (95% CI) of the mean manual measurement. This interval is within the CI of the mean manual value (±1.64 percentage points), indicating that the BN technique was as accurate as the gold standard.
Correlation coefficients, mean differences, and confidence intervals of manual and automated measurements of the percent area of DAB staining a
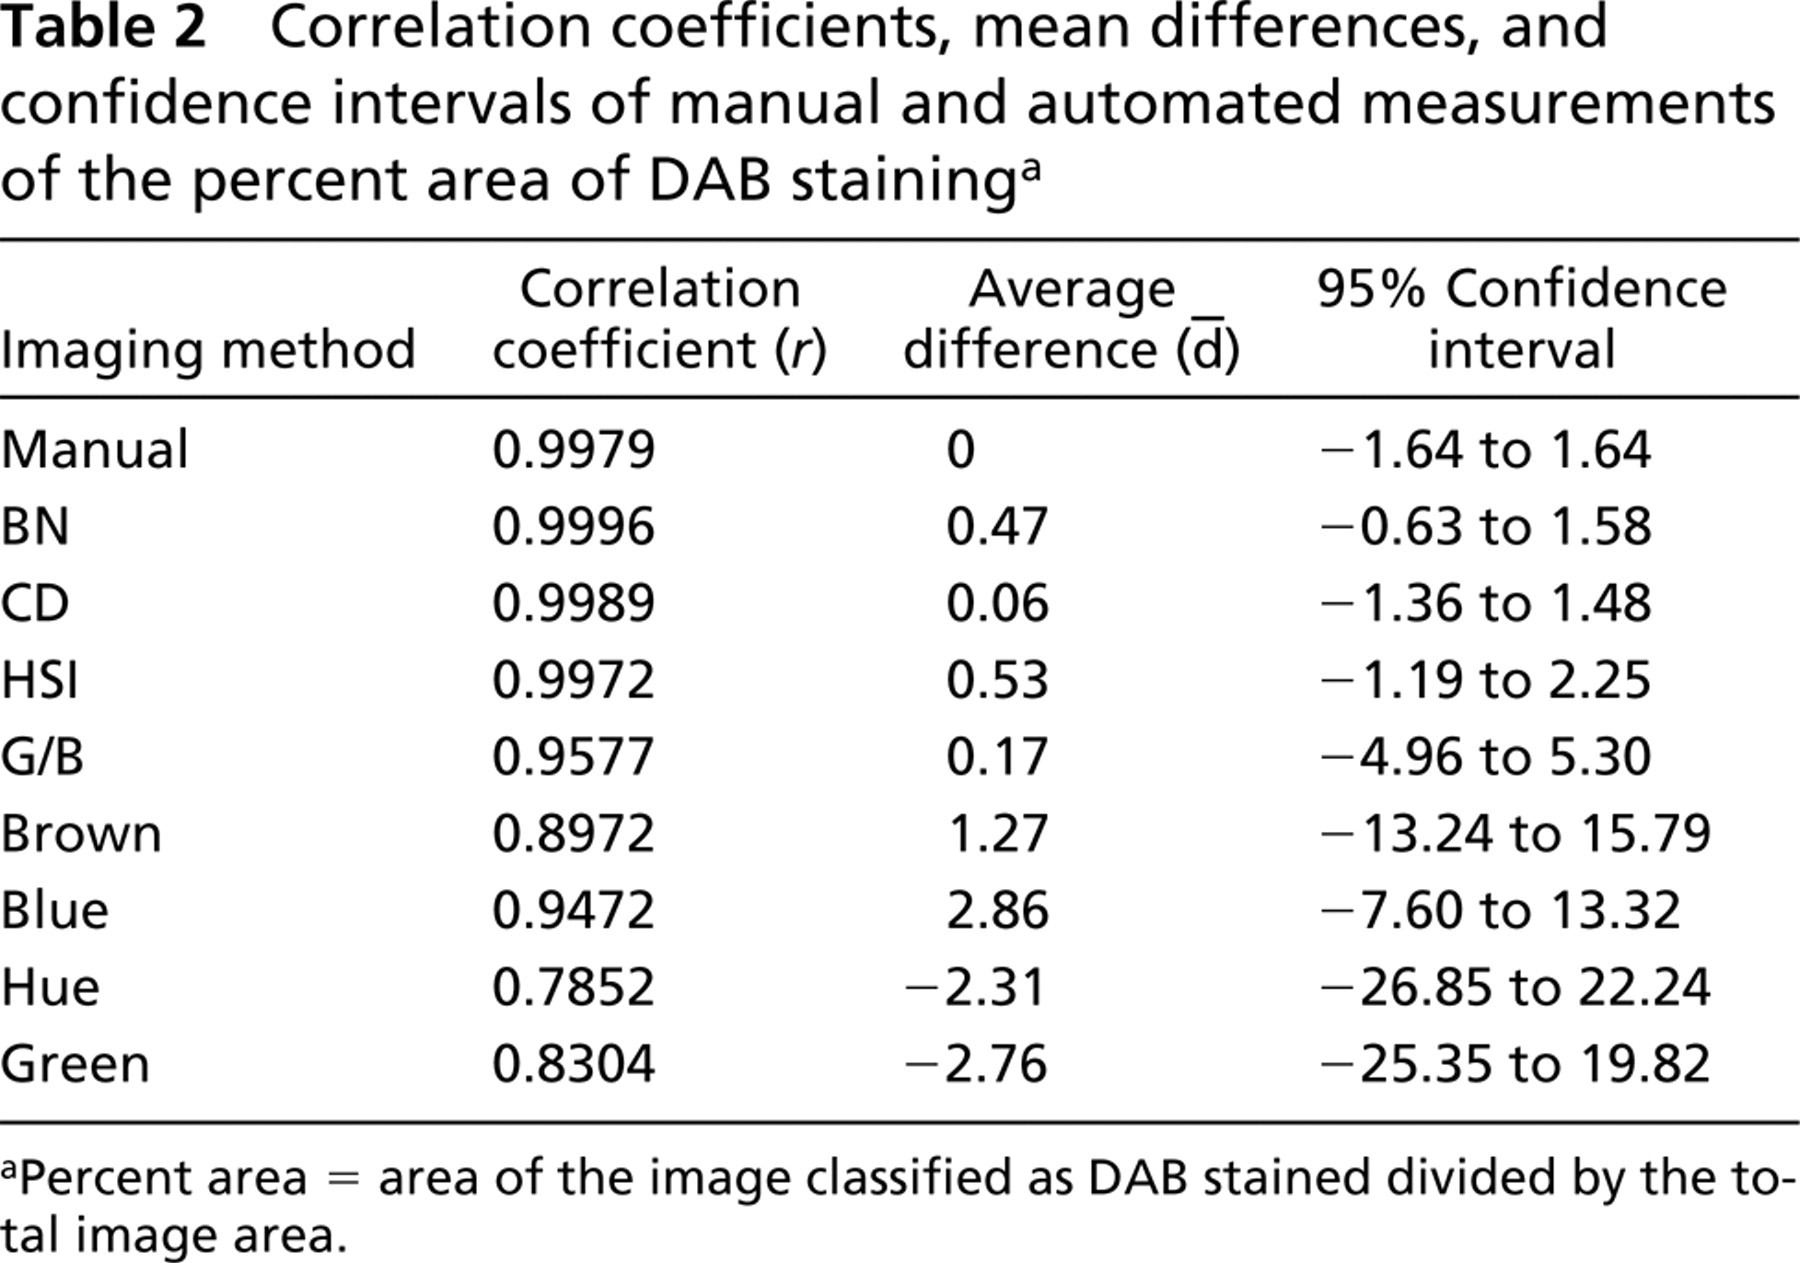
aPercent area = area of the image classified as DAB stained divided by the total image area.
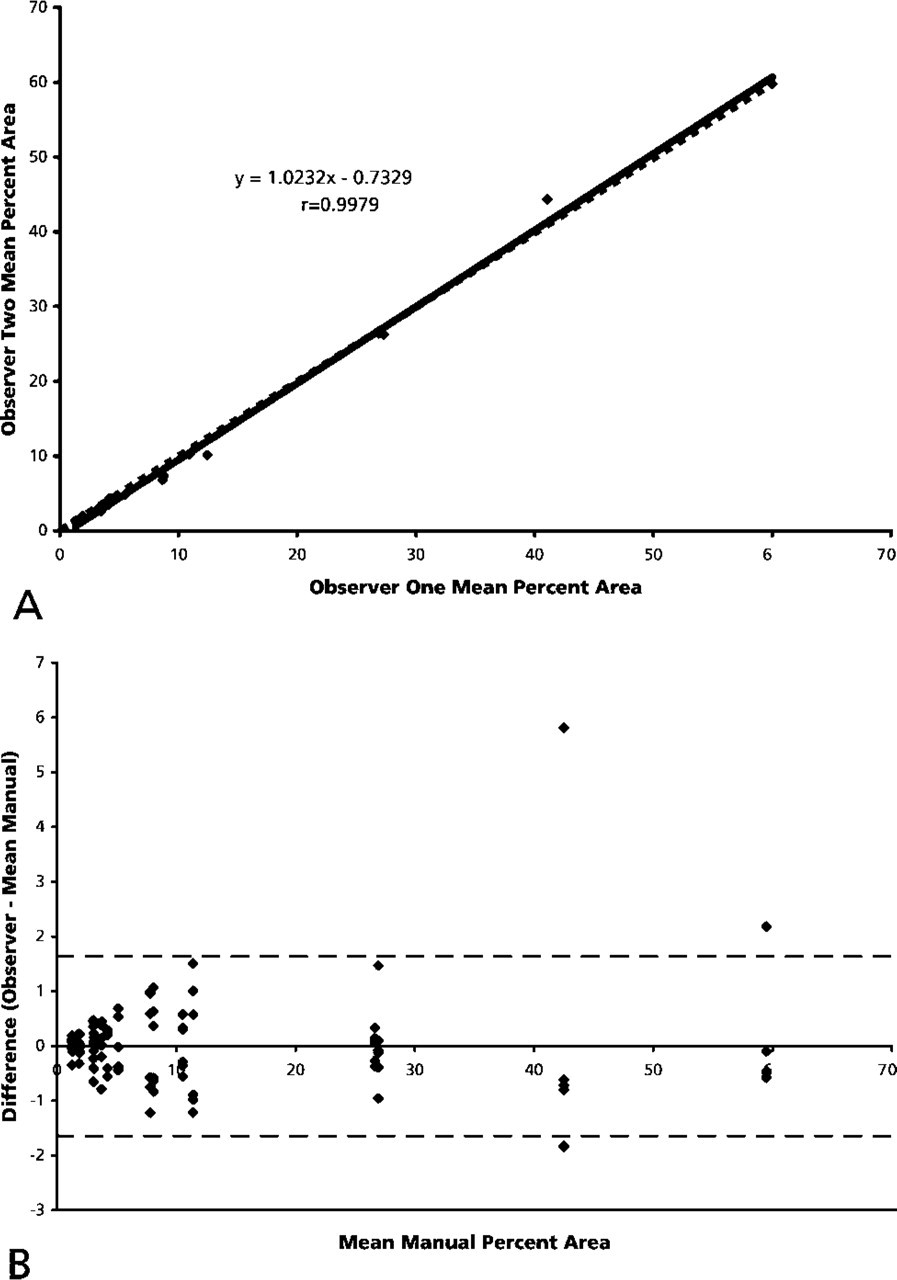
Observer comparison. (
The CD method was also as accurate as the gold standard. The measurements strongly correlated with manual measurements (r=0.9989), with a very low average difference (=0.06). Although the CI for the CD method (-1.36 to 1.48 percentage points) is more broad than the BN method, it is still within the CI of the mean manual value. All other methods yielded CIs falling outside the range of the manual value.
Combined thresholding of all HSI images had the third highest correlation with manual measurements (r=0.9972) (Table 2). HSI measurements were slightly higher on average than manual values (=0.53) and approximated the mean manual value with a narrow confidence range (-1.19 to 2.25 percentage points). This range was 1.23 percentage points more broad than that of BN, and the maximal value (2.25) was slightly higher than the maximal confidence value of the manual measurements (1.64).
BN vs manual. (
The average differences using CD and G/B images were low (=0.07 and =0.17, respectively). Although the mean percent misclassification from G/B images was low, the CI for measuring percent area was very broad (-4.96 to 5.30 percentage points). All other methods resulted in extremely poor results and CI ranges broader than 20 percentage points.
Figure 3A is a plot of the BN values against the mean manual measurements. Strong agreement is indicated, as most of the points and the regression line fall near the line of perfect agreement (BN = mean manual). Figure 3B is a scatterplot of the BN values compared with the mean manual measurements for all 18 images. The confidence range of the BN technique (dashed lines) falls within the confidence range of the manual value (dotted line).
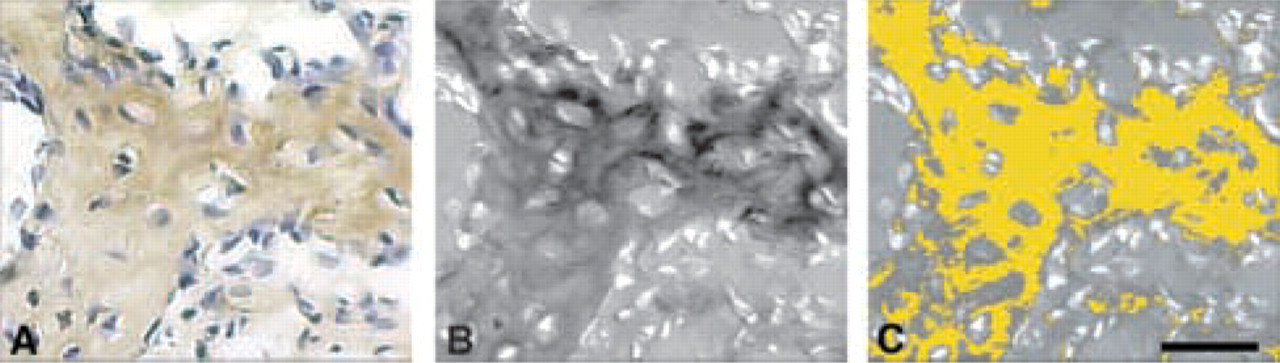
Figure 4 is an example of the automated selection of DAB-labeled tissue from an area of a VEGF immunostained sample. In the brightfield image (Figure 4A), areas of DAB-labeled tissue are seen along with dark hematoxylin-stained nuclei. The brightfield image is converted to a BN image (Figure 4B) and, using preset thresholds, areas of DAB stain are selected and pseudo-colored yellow (Figure 4C). Staining parameters (e.g., percent area, mean optical density) can then be calculated from these yellow pixels. These processes (conversion to BN, setting thresholds, calculation of stain properties) can be performed and automated using one of many image processing systems.
Discussion
This study presents a technique for automated selection and analysis of DAB-stained samples. The use of BN images is simple and allows rapid, user-independent analysis. In addition, we present a review and analysis of seven previously published automated methods. This work should provide a starting point for research laboratories seeking automated imaging techniques for quantitative immunohistochemistry.
A complex spatial and temporal expression of proteins influences both normal tissue physiology and the evolution of many pathologies. IHC is a great advantage to biomedical studies because it allows antigen-specific analysis while maintaining overall tissue morphology. However, it is difficult to compare results among laboratories because of different methods of staining and analysis. Standardization of methods is essential for effective communication among investigators.
Manual selection is currently accepted as the most accurate method for classifying tissue as DAB positive or negative, but these measurements are subject to observer variation. The manual values are not absolute and have a limited confidence range. Our study agrees with those of previous investigators who have reported low but significant variations in the manual analysis of IHC stains (Jagoe et al. 1991; Kay et al. 1996; Giatromanolaki et al. 1997; Polkowski et al. 1997; Hansen et al. 1998; Belien et al. 1999).
Brightfield image of VEGF immunostaining in a tooth extraction socket. (
Many methods have been developed to rapidly differentiate DAB-stained tissue from background staining levels (Goto et al. 1992; Montironi et al. 1996; Lehr et al. 1997; Ruifrok 1997; Smejkal and Shainoff 1997; Ma and Lozanoff 1998; Kohlberger et al. 1999; Ruifrok and Johnston 2001; Vilaplana and Lavaille 1999; King et al. 2002; McGinley et al. 2002), but a consensus on the most accurate method has not been reached. We present our method and seven other methods found in the literature. This study indicates that converting brightfield images to 8-bit BN images allows for rapid, automated selection of DAB-labeled tissue from background hematoxylin. Fewer than 1% of the pixels are misclassified when the BN images are used with a constant threshold to select DAB-stained areas, and quantitation of the percent area is accurate within the confidence intervals of manual analysis. The BN method has been used to study the spatial and temporal localization of growth factors in a tooth extraction socket (Lalani et al. in press) and to assist in the reconstruction of microvascular networks from immunostains for CD31 (Brey et al. 2002).
The CD method also allows separation of DAB-stained areas from background staining with a low level of pixel misclassification. The confidence range for percent area measurements is also accurate within the CIs of manual analysis. This method could also be used in automated analysis but requires the determination of parameters unique to the imaging and staining protocols of each individual laboratory. Careful technique must be employed in parameter determination. In the initial work single Red, Green, and Blue pixel values found in a pure stain of DAB (Ruifrok and Johnston 2001) were used in determining the CD parameters. In practice, there will be a range of values for each color channel, depending on the level of DAB staining. In our work, parameter values and analysis results varied with the particular values selected from the pure stain, with optimal results achieved using mean values (unpublished results). We suggest using the mean values from the pure stains in parameter determination to optimize the results when the CD technique is used.
Combined thresholds for all HSI images or single thresholds for G/B images give the next lowest levels of misclassification. HSI quantitation of percent area has a CI only 1.43 percentage points greater than that of BN. This range falls slightly outside the CI of manual analysis. HSI may not be as accurate as BN, but it has good accuracy and could be considered for automated analysis. Although visual inspection of G/B images indicates good color separation, pixel misclassification leads to a confidence range of more than 10 percentage points for measuring percent area. This is unacceptable for precise differentiation of staining areas. Published results using G/B for analysis only state that it allows “almost clear-cut separation,” but quantitative verification is not given (Montironi et al. 1996).
Many of the other methods investigated result in high percentages of pixel misclassification. Although combining thresholds for all HSI images results in 2% misclassification, setting thresholds along the hue image alone resulted in 18% of pixels being misclassified and led to inaccurate quantitation. A study has suggested advantages to the Hue method (Ma and Lozanoff 1998), but a statistical analysis of results was not performed.
As expected, the Blue, Brown, and Green methods yielded poor results. The Blue channel is the most accurate of the conventional RGB channels but it is known to require user interaction to eliminate nonspecific selection (King et al. 2002). The Brown method was developed based on specific staining data. A study of the automated Brown method showed 2.4% pixel misclassification (Ruifrok 1997), but interactive evaluation of the images and deletion of problem areas were required before analysis. In the present study, the Brown method was employed without prior image manipulation. The Green method (Smejkal and Shainoff 1997) was designed to improve sensitivity to low levels of DAB staining, but in the absence of hematoxylin counterstaining. These results are not useful for quantitation of stains with low antigen levels (percent area <10%).
The IHC stains studied here were for VEGF, BMP-2, and FGF-2, all secreted proteins present in the stroma of the healing socket. The BN method is not limited to secreted proteins. Figure 5 is an example image of an immunostain for the intracellular domain of the Trk B receptor and its conversion to an 8-bit image using the BN technique. The DAB-positive area is clearly separated from the dark nuclei within the cell.
Nuclear stains, however, will confound the results of any of the imaging techniques presented. As shown in Figure 1, the successful methods clearly separate DAB-stained tissue from dark blue nuclei. Although all DAB-positive tissue areas receive some contribution from hematoxylin, it is typically low intensity. Nuclear stains with mixed high-intensity hematoxylin and DAB staining will result in inconsistent results.
The selection of BN is based on the color theory of additive primary colors (i.e., R, G, B), also referred to as machine color space. In this color space, equal proportions of R, G, and B produce white, equal proportions of two of the three additive colors produce the three secondary colors (cyan, magenta, and yellow), and unequal proportions of two or three create other colors. DAB-positive areas result in brown pigmentation, which is produced from 1 part blue, 1 part green, and 4 parts red (i.e., 1B + 1G + 4R). Blue or background-stained areas are produced from pixels predominantly B, with low contributions from R and G in creating different shades. The B values for brown DAB- and dark blue-stained nuclei are similar, but the contributions from G and R are much greater for the DAB. Therefore, normalizing the B value by the sum of all the color values (i.e., BN) will give values that allow clear separation of brown from blue coloration.
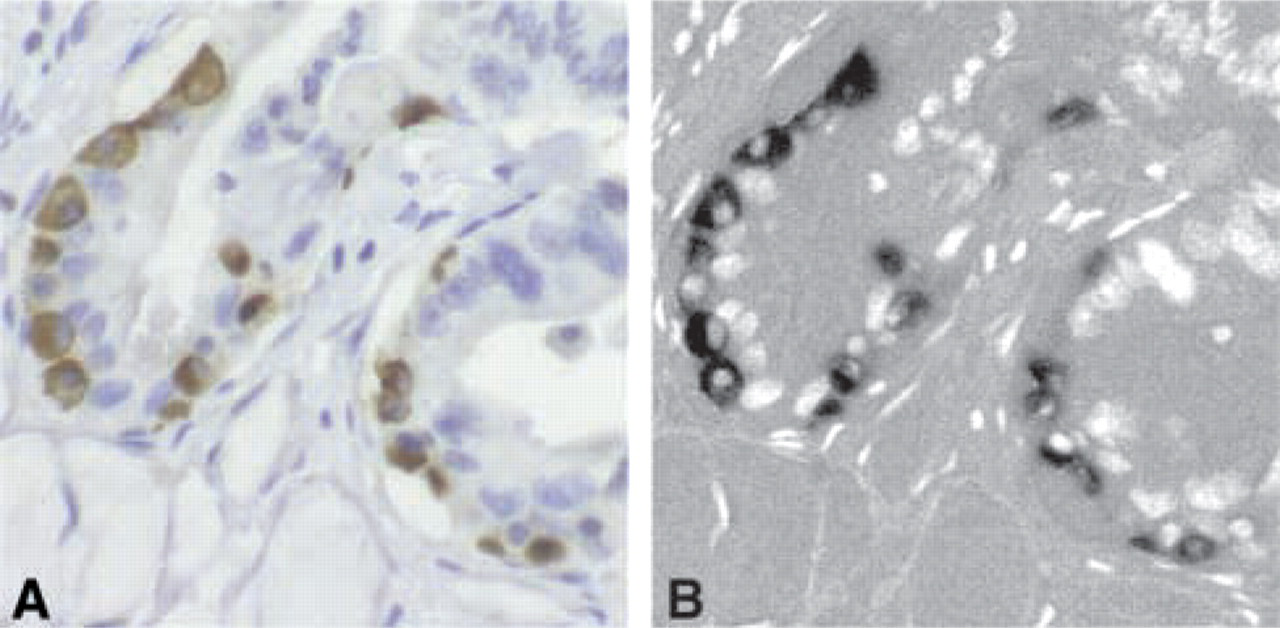
Brightfield image of pancreas immunostained for the cytoplasmic domain of Trk B. (
A technique that accurately analyzes images is only one of many steps in the IHC analysis process that must be standardized. Others include staining protocols (e.g., fixative, dilutions), the selection of appropriate control slides (Seidal et al. 2001), and determination of the staining parameters that best correlate with the amount of protein present. Automated imaging methods are sensitive to laboratory technique. Although the BN imaging technique is highly accurate in delineating brown areas of tissue from the background hematoxylin, it cannot separate nonspecific stain from specific stain. Rigorous staining and imaging protocols must be employed to ensure accurate results. In addition, this technique may not work in tissue with high brown pigmentation such as high-melanin skin, as these areas will most likely be interpreted as positive for DAB. This method can be applied using most image processing and microscopy systems. However, pilot studies should provide statistical verification at each individual laboratory before the technique is used as a research tool.
The methods presented here are automated. Once a threshold is selected from trial images, all subsequent images are analyzed using the same preset threshold. Interactive evaluation of each individual image is not required as it is with other methods (Lehr et al. 1997; Vilaplana and Lavaille 1999; Underwood et al. 2001; King et al. 2002; McGinley et al. 2002). Writing a script, or program, in IPLab that performs this task is simple and straightforward. In addition, this method can be easily employed using other image analysis software, including NIH Image (although the programming is more complex with this software).
Footnotes
Acknowledgements
Supported by grants from the NIH (T32-GM08362, HL 18672, HL 62341, CA 16672, P30-CA16672), Army Department of Defense (DAMD 17–99-1-9268), Whitaker Foundation, and Robert A. Welch Foundation Grant (C-938).
We would like to thank Dr Guido Sclabas from the Department of Surgical Oncology at The University of Texas M. D. Anderson Cancer Center for the Trk B immunostain.