
Abstract
Mitotic index (MI) is an indirect measure of cell proliferation that has been demonstrated to be a strong predictor of outcome for several human and canine cancers. The purpose of this study was to evaluate the utility of MI as a predictor of biologic behavior and survival in dogs with cutaneous mast cell tumors (MCTs). Medical records from 148 dogs with histologically confirmed MCTs were reviewed. Information regarding tumor grade, local recurrence, metastatic disease, date of death/last follow-up, and outcome was obtained. The region of the tumor with the highest overall mitotic activity was chosen for evaluation, and the MI value was defined as the number of mitotic figures/10 high-power fields (400X, 2.7 mm2). A Cox proportional hazards regression model was used to compare MI with survival data. A Mann-Whitney test was used to compare MI on the basis of the development of local recurrence and metastatic disease. The MI correlated directly with tumor grade (P < .0001). The median survival time for dogs with an MI ≤5 was significantly longer (70 months) than for those with an MI >5 (2 months), regardless of grade (P < .001). For grade II tumors with an MI ≤5, the median survival time (MST) was 70 months, compared with 5 months for those with an MI >5 (P < .001). For grade III tumors with an MI ≤5, the MST was not reached, compared with <2 months for those with an MI >5 (P < .001). In conclusion, MI is a strong predictor of overall survival for dogs with cutaneous MCTs and should be included as a prognostic indicator when determining therapeutic options.
Keywords
Mast cell tumors (MCTs) are one of the most frequently occurring malignant tumors in dogs, representing 7–21% of all cutaneous tumors in the species.8,9,24 This is in direct contrast to humans where neoplastic disease of mast cells is extremely rare. The reason for such a high incidence of mast cell neoplasia in the dog is not known, but it is clear that this cancer represents a source of frustration for both dog owners and veterinarians. The biologic behavior of these tumors is highly dependent on tumor grade. Those patients with grade I tumors are likely to experience long-term survival, while those with grade III tumors have a reported median survival time of only 6 months.5,18,19,22,28,30 Although most grade II MCTs are considered benign, a proportion of these will metastasize to local lymph nodes and distant sites.18 While tumor grade is often used to determine prognosis, there is widespread disagreement on standardization of grading, as evidenced by a recent publication in which there was significant variation among 10 pathologists in the grading of the same set of 60 MCTs.21
There are several other characteristics of canine MCTs that may contribute to potential outcome. It has been suggested that MCTs that develop in the oral cavity, nail bed, and inguinal, preputial, and perineal regions behave in a more malignant fashion regardless of histologic grade, although definitive proof for this is lacking.7,12,18,31 Evidence indicates that tumors present for long periods of time (months to years) may be more likely to behave in a benign manner.5 Certain breeds such as Boxers and Pugs have a high incidence of MCTs, but these tend to be more well differentiated and carry a better prognosis.4,5
Several markers of tumor proliferation have been employed to help differentiate benign from malignant tumors. The relative frequency of argyrophilic nucleolar staining organizing regions (AgNORs) correlated with histologic grade and was predictive of postsurgical outcome: the higher the AgNOR count, the poorer the prognosis.6,15,28 MCTs possessing an abnormal DNA content (aneuploidy) exhibited a trend toward shorter survival times.2 Proliferating cell nuclear antigen (PCNA) was significantly higher in recurrent-versus-nonrecurrent tumors and metastatic-versus-nonmetastatic tumors and was a good predictor for tumor recurrence at 6 months.28 Last, in 1 study, the mean number of Ki-67–positive nuclei/1,000 tumor nuclei was significantly higher for dogs that died of MCTs than for those that survived.1 The potential utility of Ki-67 in distinguishing benign from malignant grade II MCTs was also recently demonstrated.27
Other factors investigated for their possible prognostic value include the levels of active matrix metalloproteinase 2 and 9, tryptase, and chymase, as well as p53 overexpression.11,13,14,17,33 Unfortunately, none of these were shown to be useful in predicting the biologic behavior of MCTs. One recent study attempted to correlate Kit staining patterns with prognosis of grade II MCTs. While there was a subset of dogs with MCTs possessing particular Kit staining patterns (1, 2, or 3) that did not do well, none of the groups reached a median survival time (i.e., >50% of all dogs in each group did not die of disease), with most dogs in each category surviving >20 months, indicating that this method was unable to definitively identify the grade II tumors that were more likely to result in death of affected patients.33 In summary, there is no clear consensus on how to identify those MCTs likely to behave in an aggressive manner.
Mitotic index (MI) is an indirect measure of cell proliferation based on the quantification of mitotic figures in a histopathologic specimen and is easier to perform than AgNOR and Ki-67 assessment, which both require additional staining techniques and may necessitate the use of automated image analysis that is not currently widely available. It has been demonstrated that MI is a strong predictor of outcome for a variety of human and canine cancers, including thyroid carcinoma, breast carcinoma, sarcomas, among others.3,16,26,32 Therefore, the purpose of the following study was to determine whether MI is a useful predictor of the biologic behavior of canine MCTs, as this would provide a relatively simple method for assessing MCTs during routine histopathologic examination.
Materials and Methods
Source of MCTs
The cutaneous MCTs evaluated in this study were part of a database that had been used in a previous study to investigate the role of c-kit mutations in this disease and consisted of MCTs evaluated at UC Davis from 1989 to 2000.10 Those dogs for which there was adequate information, including signalment; location of tumor; staging of tumor; dates of local recurrence, metastasis, death, or last follow-up examination; prior or subsequent occurrence of mast cell tumors; prior surgery, adjuvant therapy; and cause of death were eligible for inclusion in the study. Follow-up information was obtained via direct communication with owners or referring veterinarians. After final review, MCTs from 148 dogs were deemed appropriate for inclusion in the study. New HE sections were obtained for each tumor sample, and a single pathologist (PFM) reviewed each by means of light microscopy. Tumors were graded in accordance with the Patnaik scheme.22
Evaluation of MI
A single pathologist evaluated the HE sections via light microscopy and generated an MI per 10 high-power (400×) fields (HPFs), field size 2.7 mm2. The region of the tumor sample with the highest overall mitotic activity was chosen for evaluation (field selection method). A single count of 10 HPFs was obtained for each tumor sample.
Statistical analysis
A Kruskal-Wallis 1-way analysis of variance and Jonckheere-Terpstra and Wilcoxon-Mann-Whitney tests were used to evaluate the relationship between MI and tumor grade. Additionally, a Wilcoxon-Mann-Whitney test was used to compare MI based on dogs' presence or absence of local recurrence and metastatic disease. Finally, a Cox proportional hazards regression model was used to compare MI with survival data. Of the original 148 dogs, 49 were excluded from survival analysis because they were immediately lost to follow-up (n = 10) or died of other/unknown causes (n = 39). Kaplan-Meyer (KM) survival curves were generated evaluating MI in all patients, MI in patients without metastatic disease, MI within grade II MCTs, and MI within grade III MCTs. Statistical significance was set at P < .05.
Results
Patient and tumor characteristics
A total of 148 MCTs were evaluated in this study, of which 11 were grade I tumors, 113 were grade II tumors, and 24 were grade III tumors. The MCT specimens were obtained from dogs that ranged from 0.4 to 16.5 years of age (mean, 8.3 years; median, 8.7 years). The most common breeds from which MCT were obtained were Labrador Retriever (n = 37), Boxer (n = 12), Golden Retriever (n = 12), Cocker Spaniel (n = 10), Staffordshire Bull Terrier (n = 6), Boston Terrier (n = 5), Chinese Shar-Pei (n = 5), Miniature Schnauzer (n = 5), German Shepherd Dog (n = 4), and Bernese Mountain Dog (n = 4). The remaining 48 dogs comprised various breeds including 3 Pugs.
MI and tumor grade
All tumors were evaluated to determine the average MI (number of mitoses/10 HPFs). Figure 1 shows the distribution of MI within grade I, II, and III cutaneous MCTs. Grade I tumors exhibited a mean of 1.2 (range, 0–6), grade II tumors exhibited a mean of 2.0 (range, 0–45), and grade III tumors exhibited a mean of 19.3 (range, 0–87). A Kruskal-Wallis 1-way analysis of variance revealed a significant association between at least 1 of the 3 grades of MCTs with respect to MI (P < .0001). Furthermore, a Jonckheere-Terpstra test found a “dose-response” or “trend” relationship between grade and MI where the MI significantly increased as the grade of the tumor increased (P < .0001). However, a Wilcoxon-Mann-Whitney test indicated there was no significant difference in the distribution of MI between grades I and II. This test was not used to compare grade I with III or grade II with III as the difference in MI was obvious.
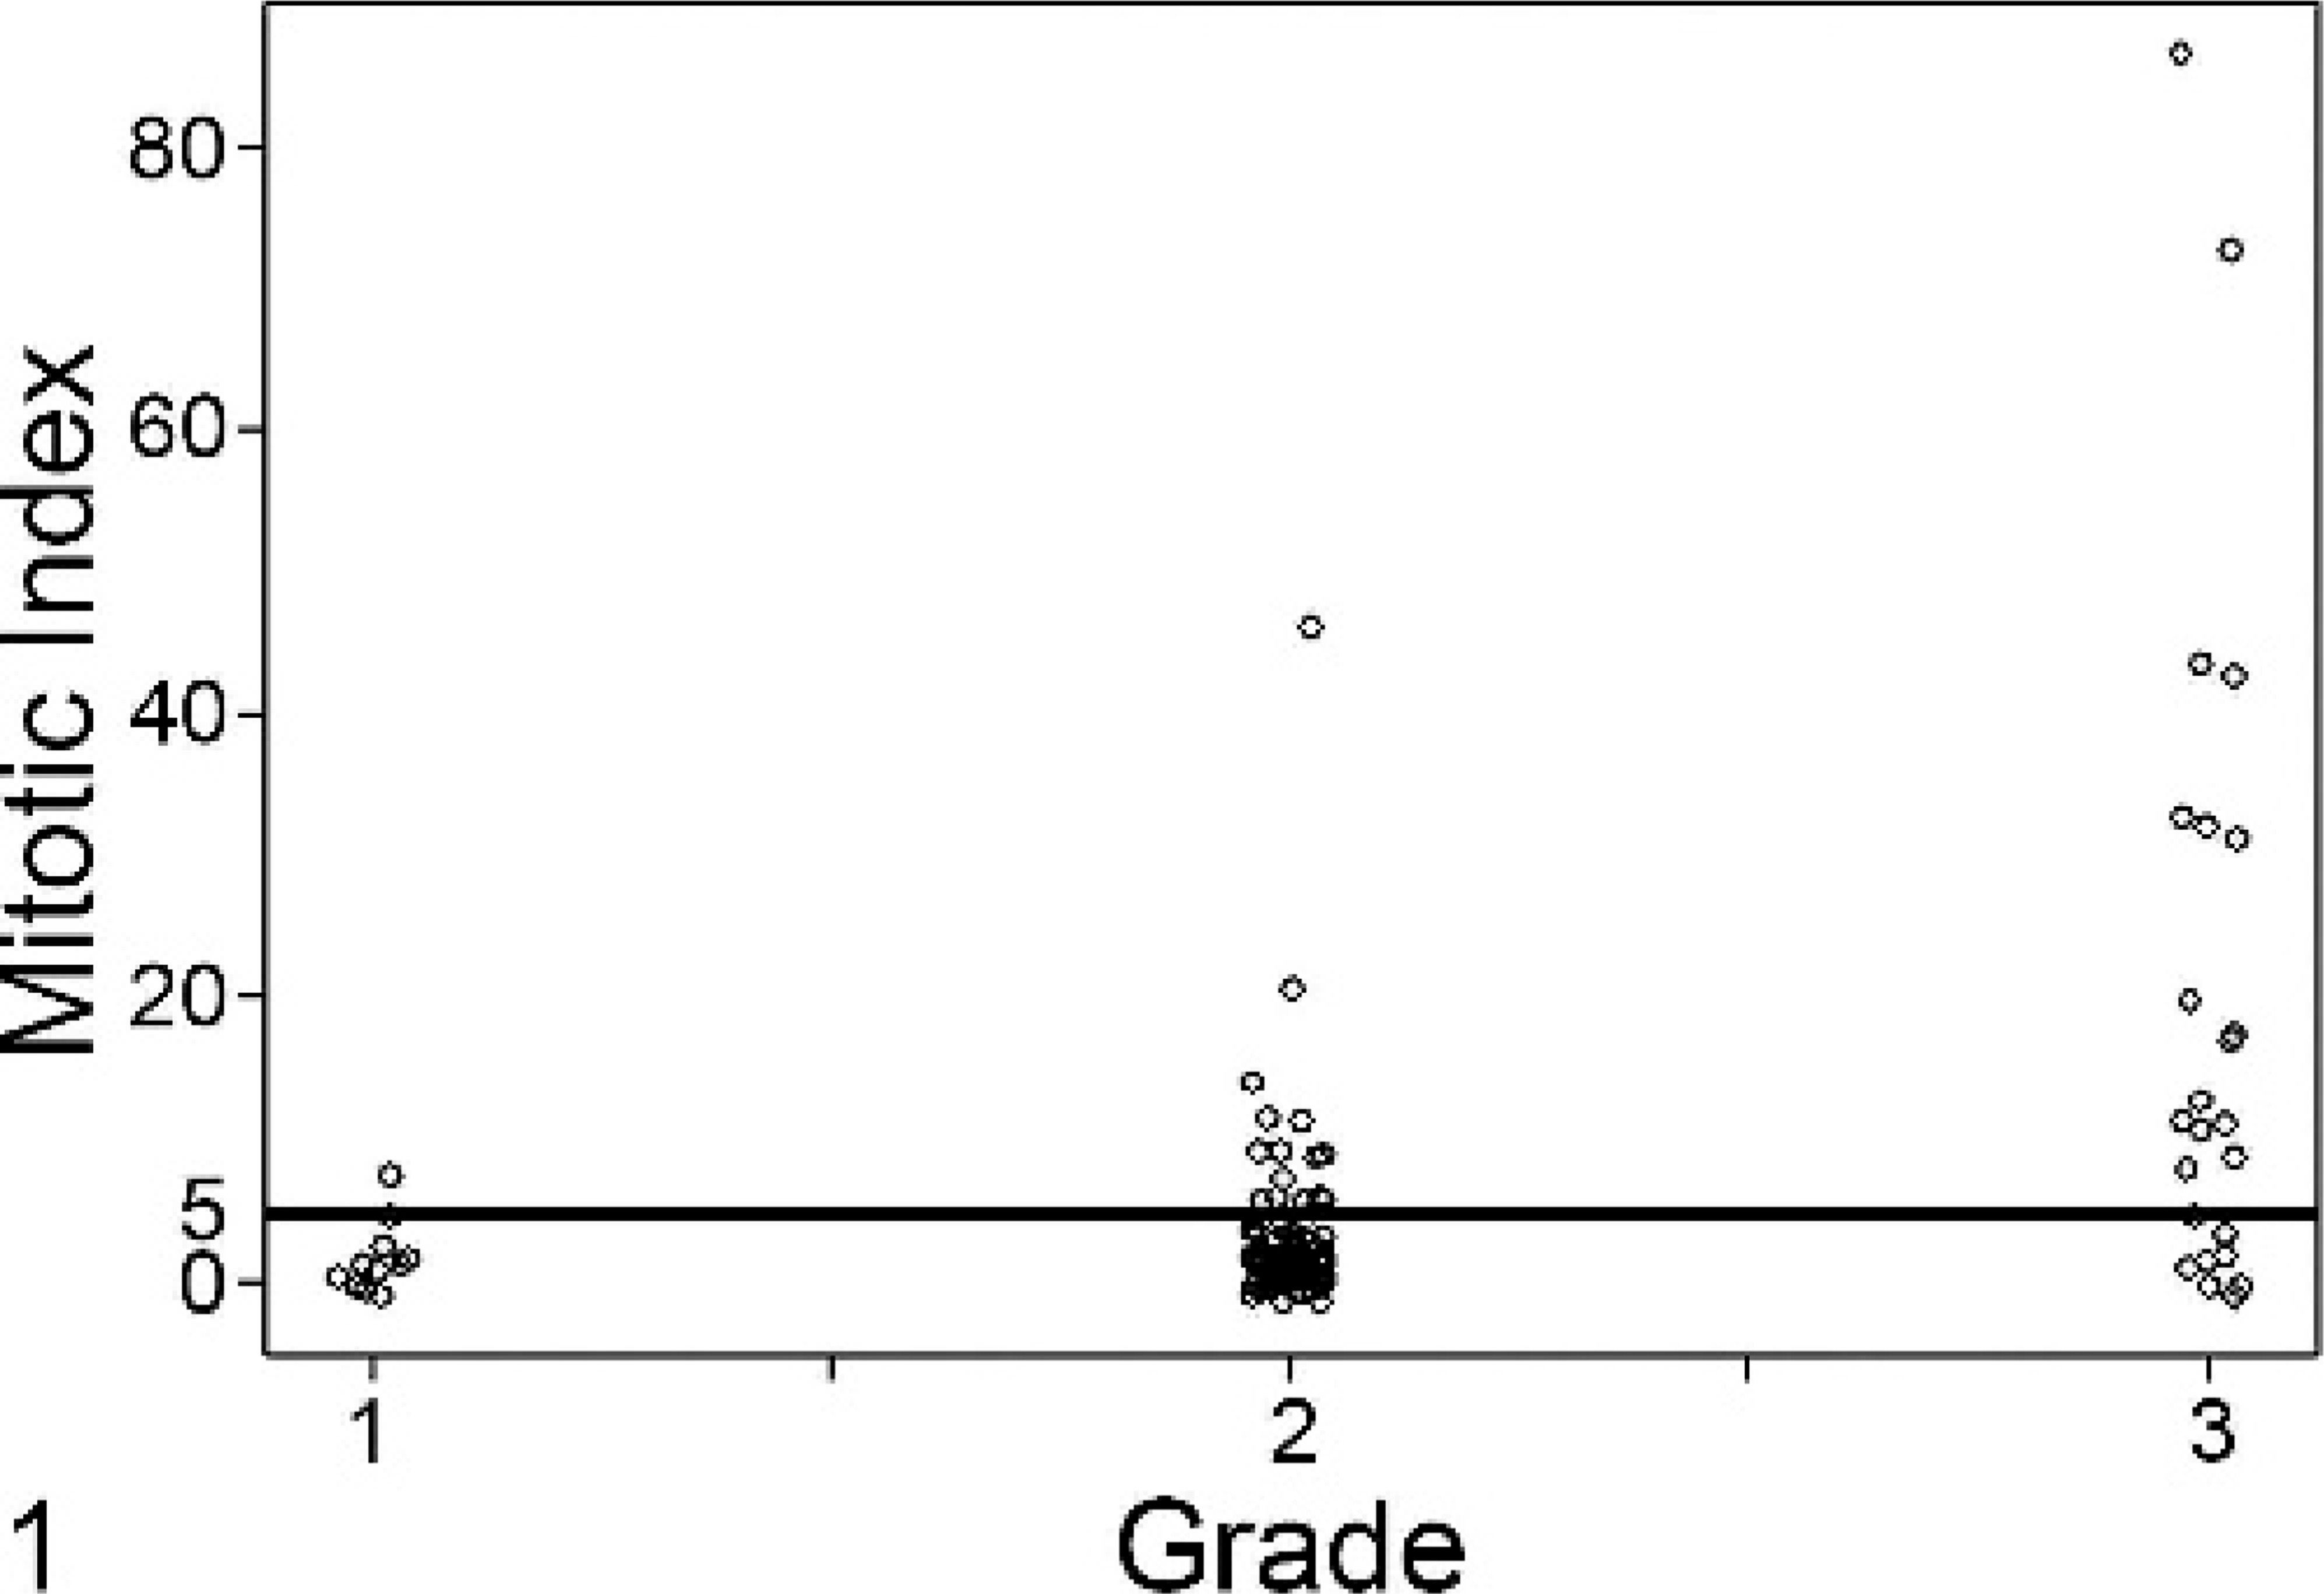
Fig. 1. Mitotic index (MI) correlates with tumor grade. Shown is a jitter plot demonstrating the spread of MI among grade I, II, and III tumors. An MI of 5 (dashed line) was used to separate cases into 2 groups (group A, MI 0–5; group B, MI >5). Using the Jonckheere-Terpstra test, we identified a trend relationship between grade and MI, where the MI significantly increased as the grade of the tumor increased (P < .0001).
MI and tumor outcome
Using a Wilcoxon-Mann-Whitney test, we found no significant difference between MI and local tumor recurrence (P = .97). However, there was a significant association between MI and rate of metastatic disease, where the higher the MI, the greater was the risk of metastatic disease (P < .0001). For survival analysis, 49 dogs were excluded because they were immediately lost to follow-up (n = 10) or died of other/unknown causes (n = 39). A Cox proportional hazards regression model was used to correlate survival with MI, grade, and the presence of metastatic disease. Overall survival was significantly associated with all 3 variables (P < .001).
The 99 cases were then stratified into 4 individual MI groups based on the distribution of MI as well as previously documented MI categories from other tumor types, namely canine soft-tissue sarcoma and dermal melanoma.16,29 Group 1 (n = 80) was cases with an MI ≤5; group 2 (n = 5), MI 6–9; group 3 (n = 7), MI 10–29; and group 4 (n = 7), MI ≥30. Groups 2, 3, and 4 had rates of death secondary to MCT that were 9.98 (P = .0011), 7.51 (P = .0011), and 14.47 (P < .001) times higher than that of group 1, respectively. Dogs presenting with metastatic disease had a rate of death due to MCT 4.99 times higher than those without metastatic disease (P = .0031). For all dogs in this study, the median survival time (MST) for group 1 (70 months) was significantly longer (P < .001) than that for group 2 (1 month), group 3 (3.5 months), and group 4 (<1 month). There was no statistically significant difference in MST between groups 2, 3, and 4; therefore, these cases were consolidated into 1 group (MI >5) for generation of KM curves.
Four KM curves were generated using 2 groups of cases: Group A had an MI ≤5, whereas group B had an MI >5. In Fig. 2, the KM curve for all patients (n = 99) included in the survival analysis is shown. The MST of group A (n = 80) was 70 months and that of group B (n = 19) was only 2 months (P < .001). When only those patients without metastatic disease were included in the analysis, the MST of group A (n = 71) was 80 months compared with 3 months for group B (n = 7) (P < .001, Fig. 3). For those patients with grade II tumors, group A (n = 72) had an MST of 70 months compared with 5 months for group B (n = 7) (P < .001, Fig. 4). Finally, for those patients with grade III tumors, the MST of group A (n = 3) was not reached at 16 months, while the MST of group B (n = 14) was less than 2 months, with no patients living beyond 4 months (P = .001, Fig. 5).
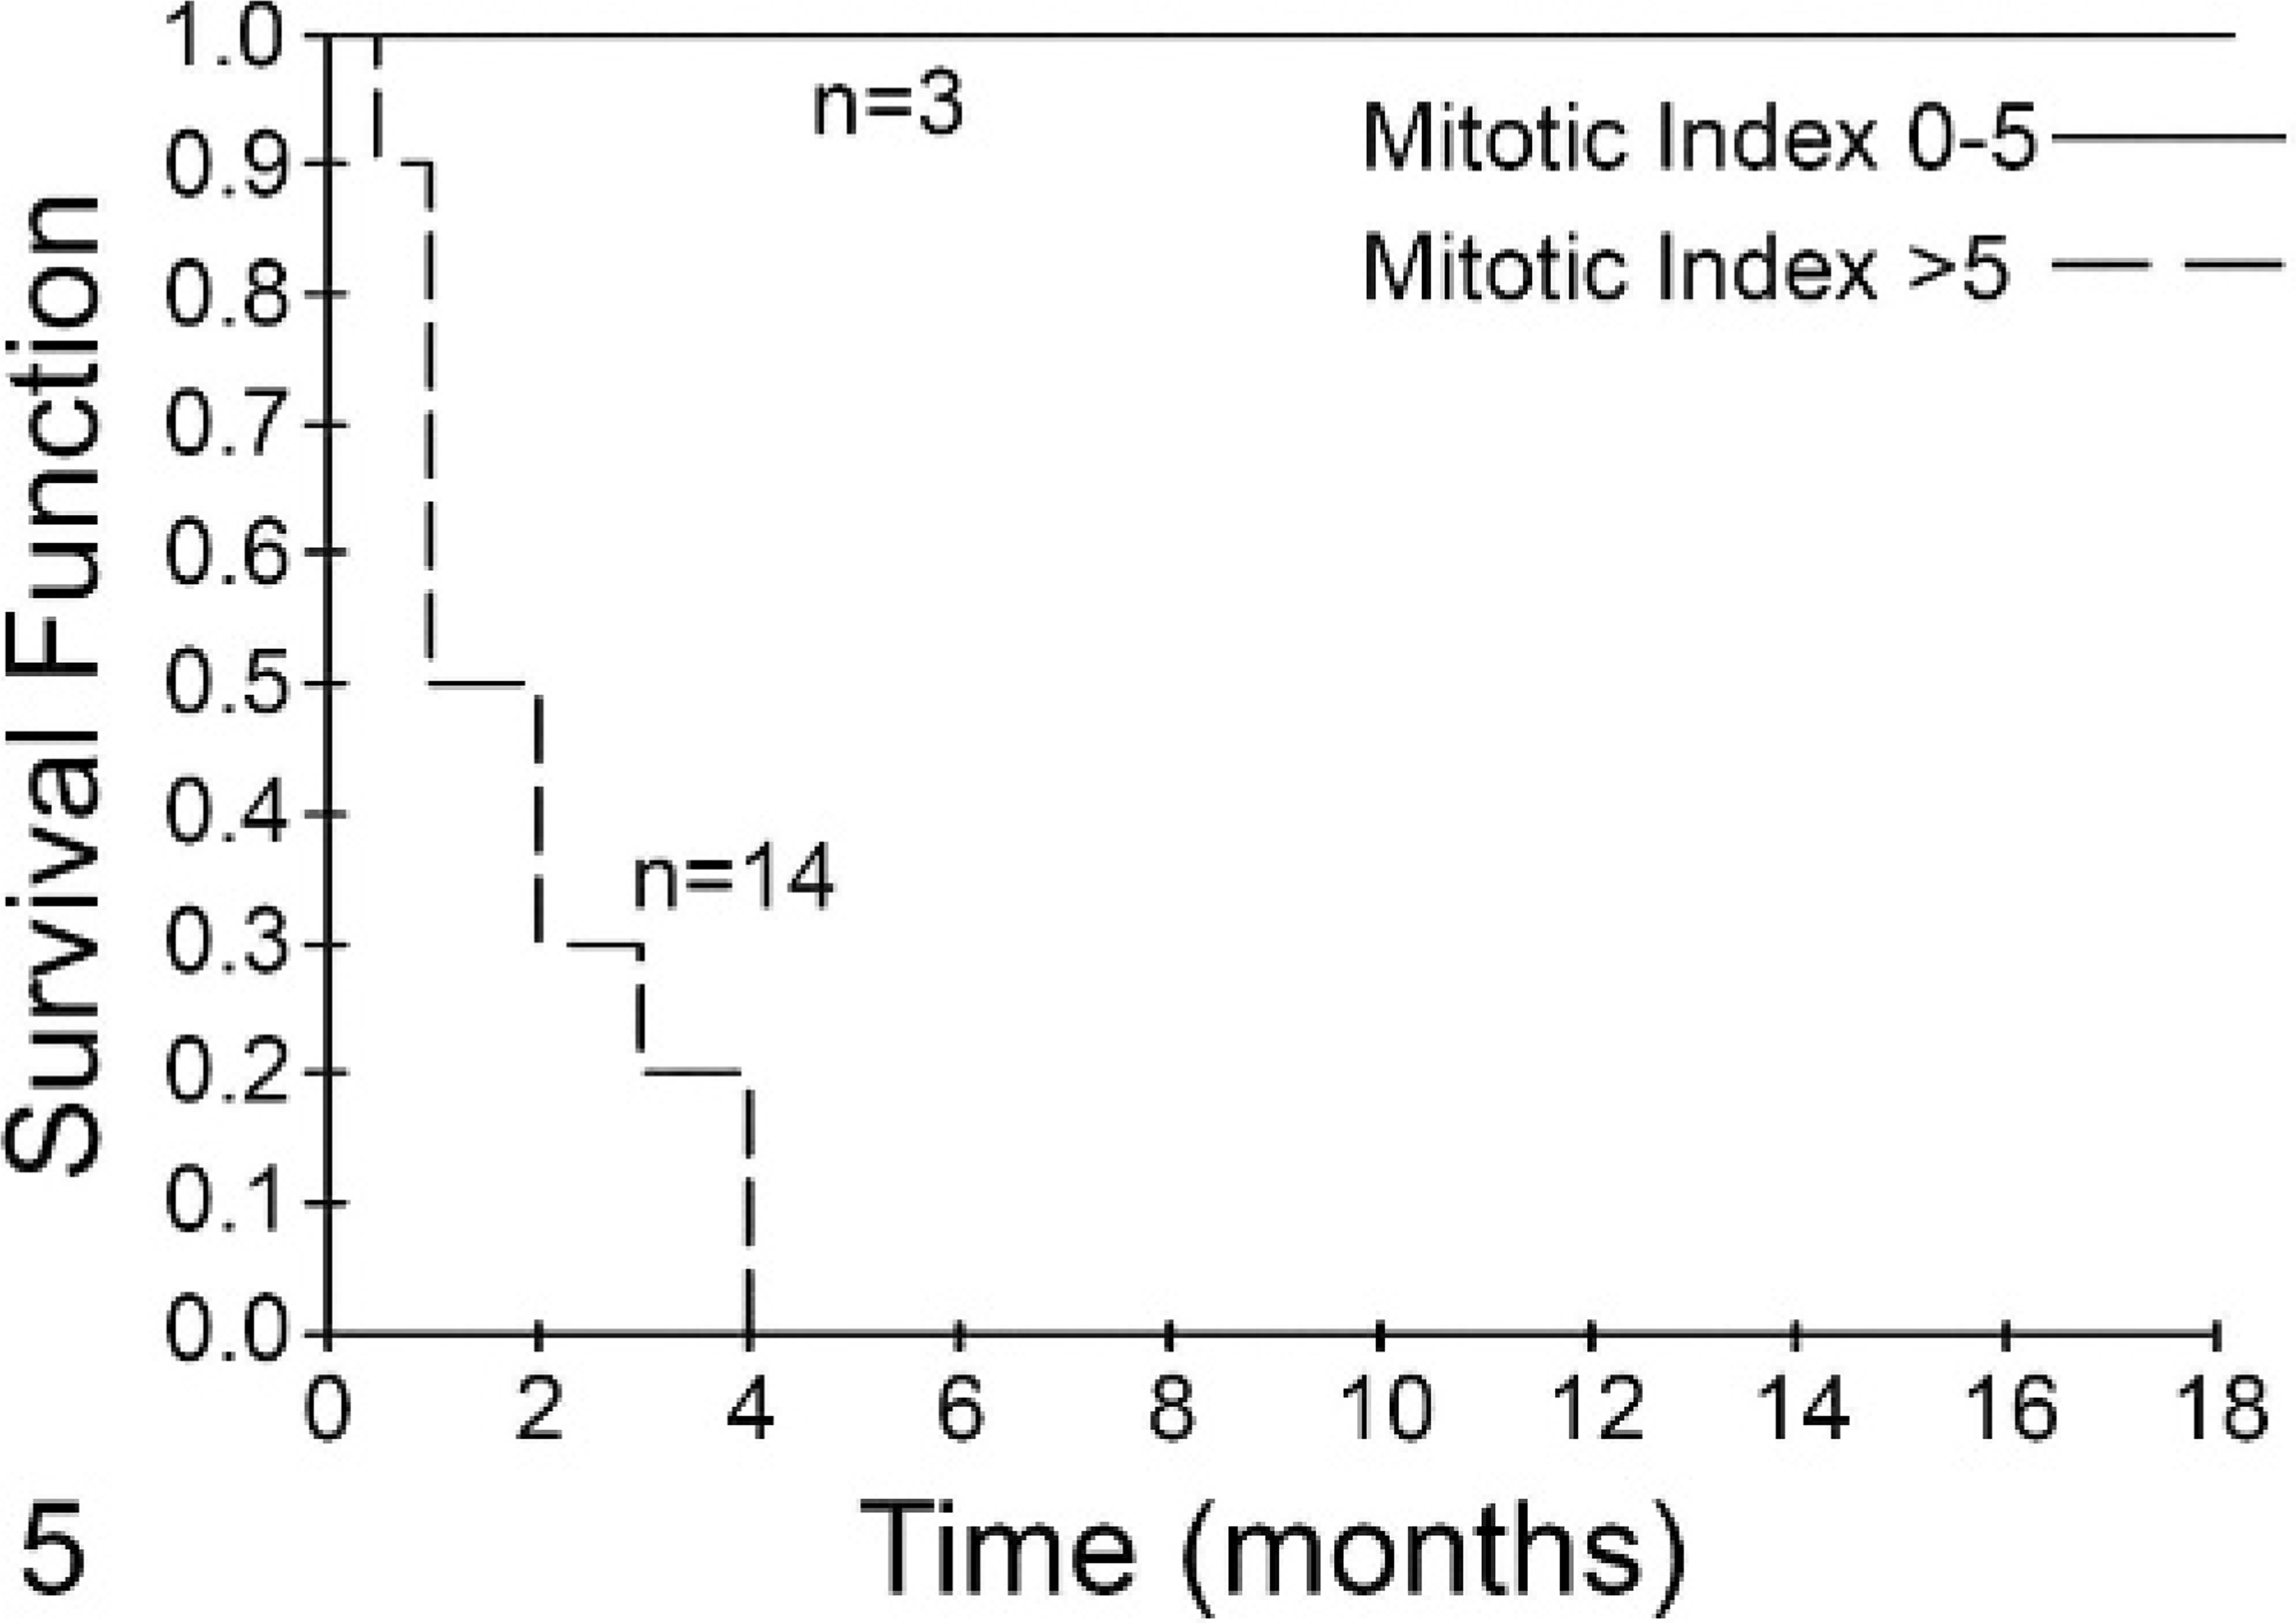
Fig. 5. Mitotic index (MI) is predictive of survival for dogs with grade III mast cell tumors (MCTs). Dogs with grade III tumors with an MI of 0–5 (solid line, n = 3) had a median survival that was not reached, while those with an MI >5 (dashed line, n = 14) had a median survival of <2 months. This difference was statistically significant (P < .001).
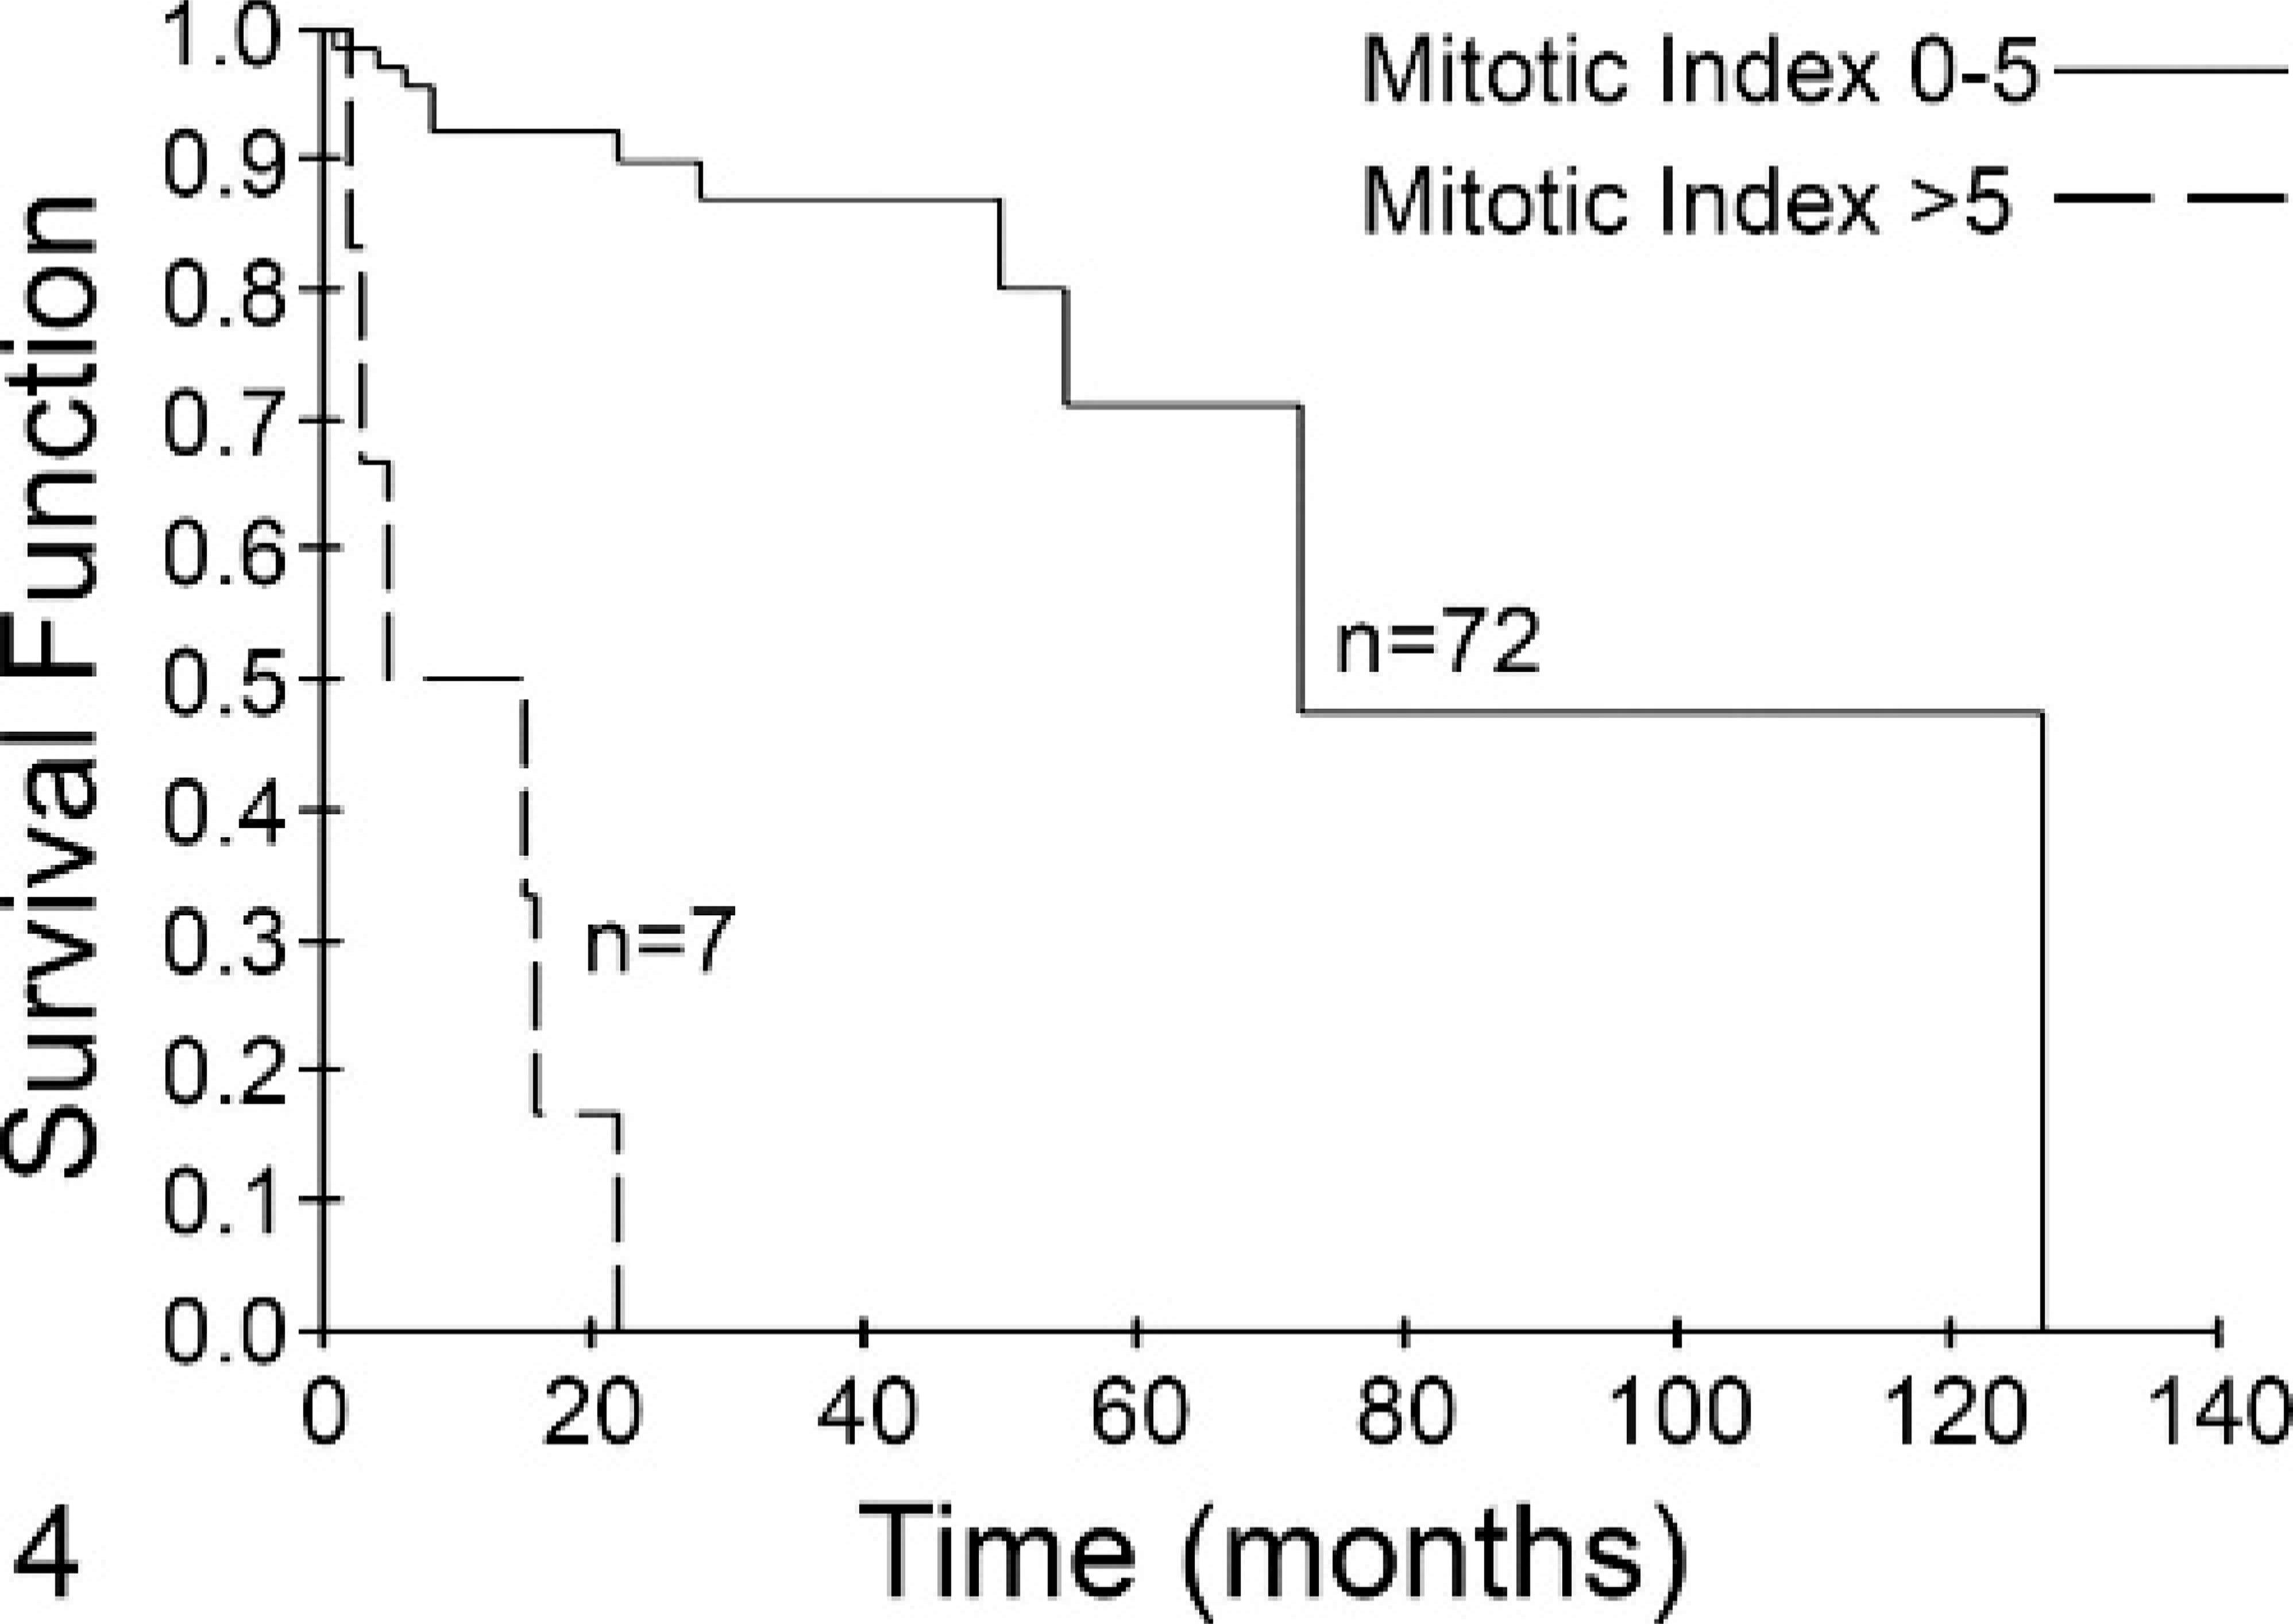
Fig. 4. Mitotic index (MI) is predictive of survival for dogs with grade II mast cell tumors (MCTs). Dogs with grade II tumors with an MI of 0–5 (solid line, n = 72) had a median survival of 70 months, while those with an MI >5 (dashed line, n = 7) had a median survival of 5 months. This difference was statistically significant (P < .001).
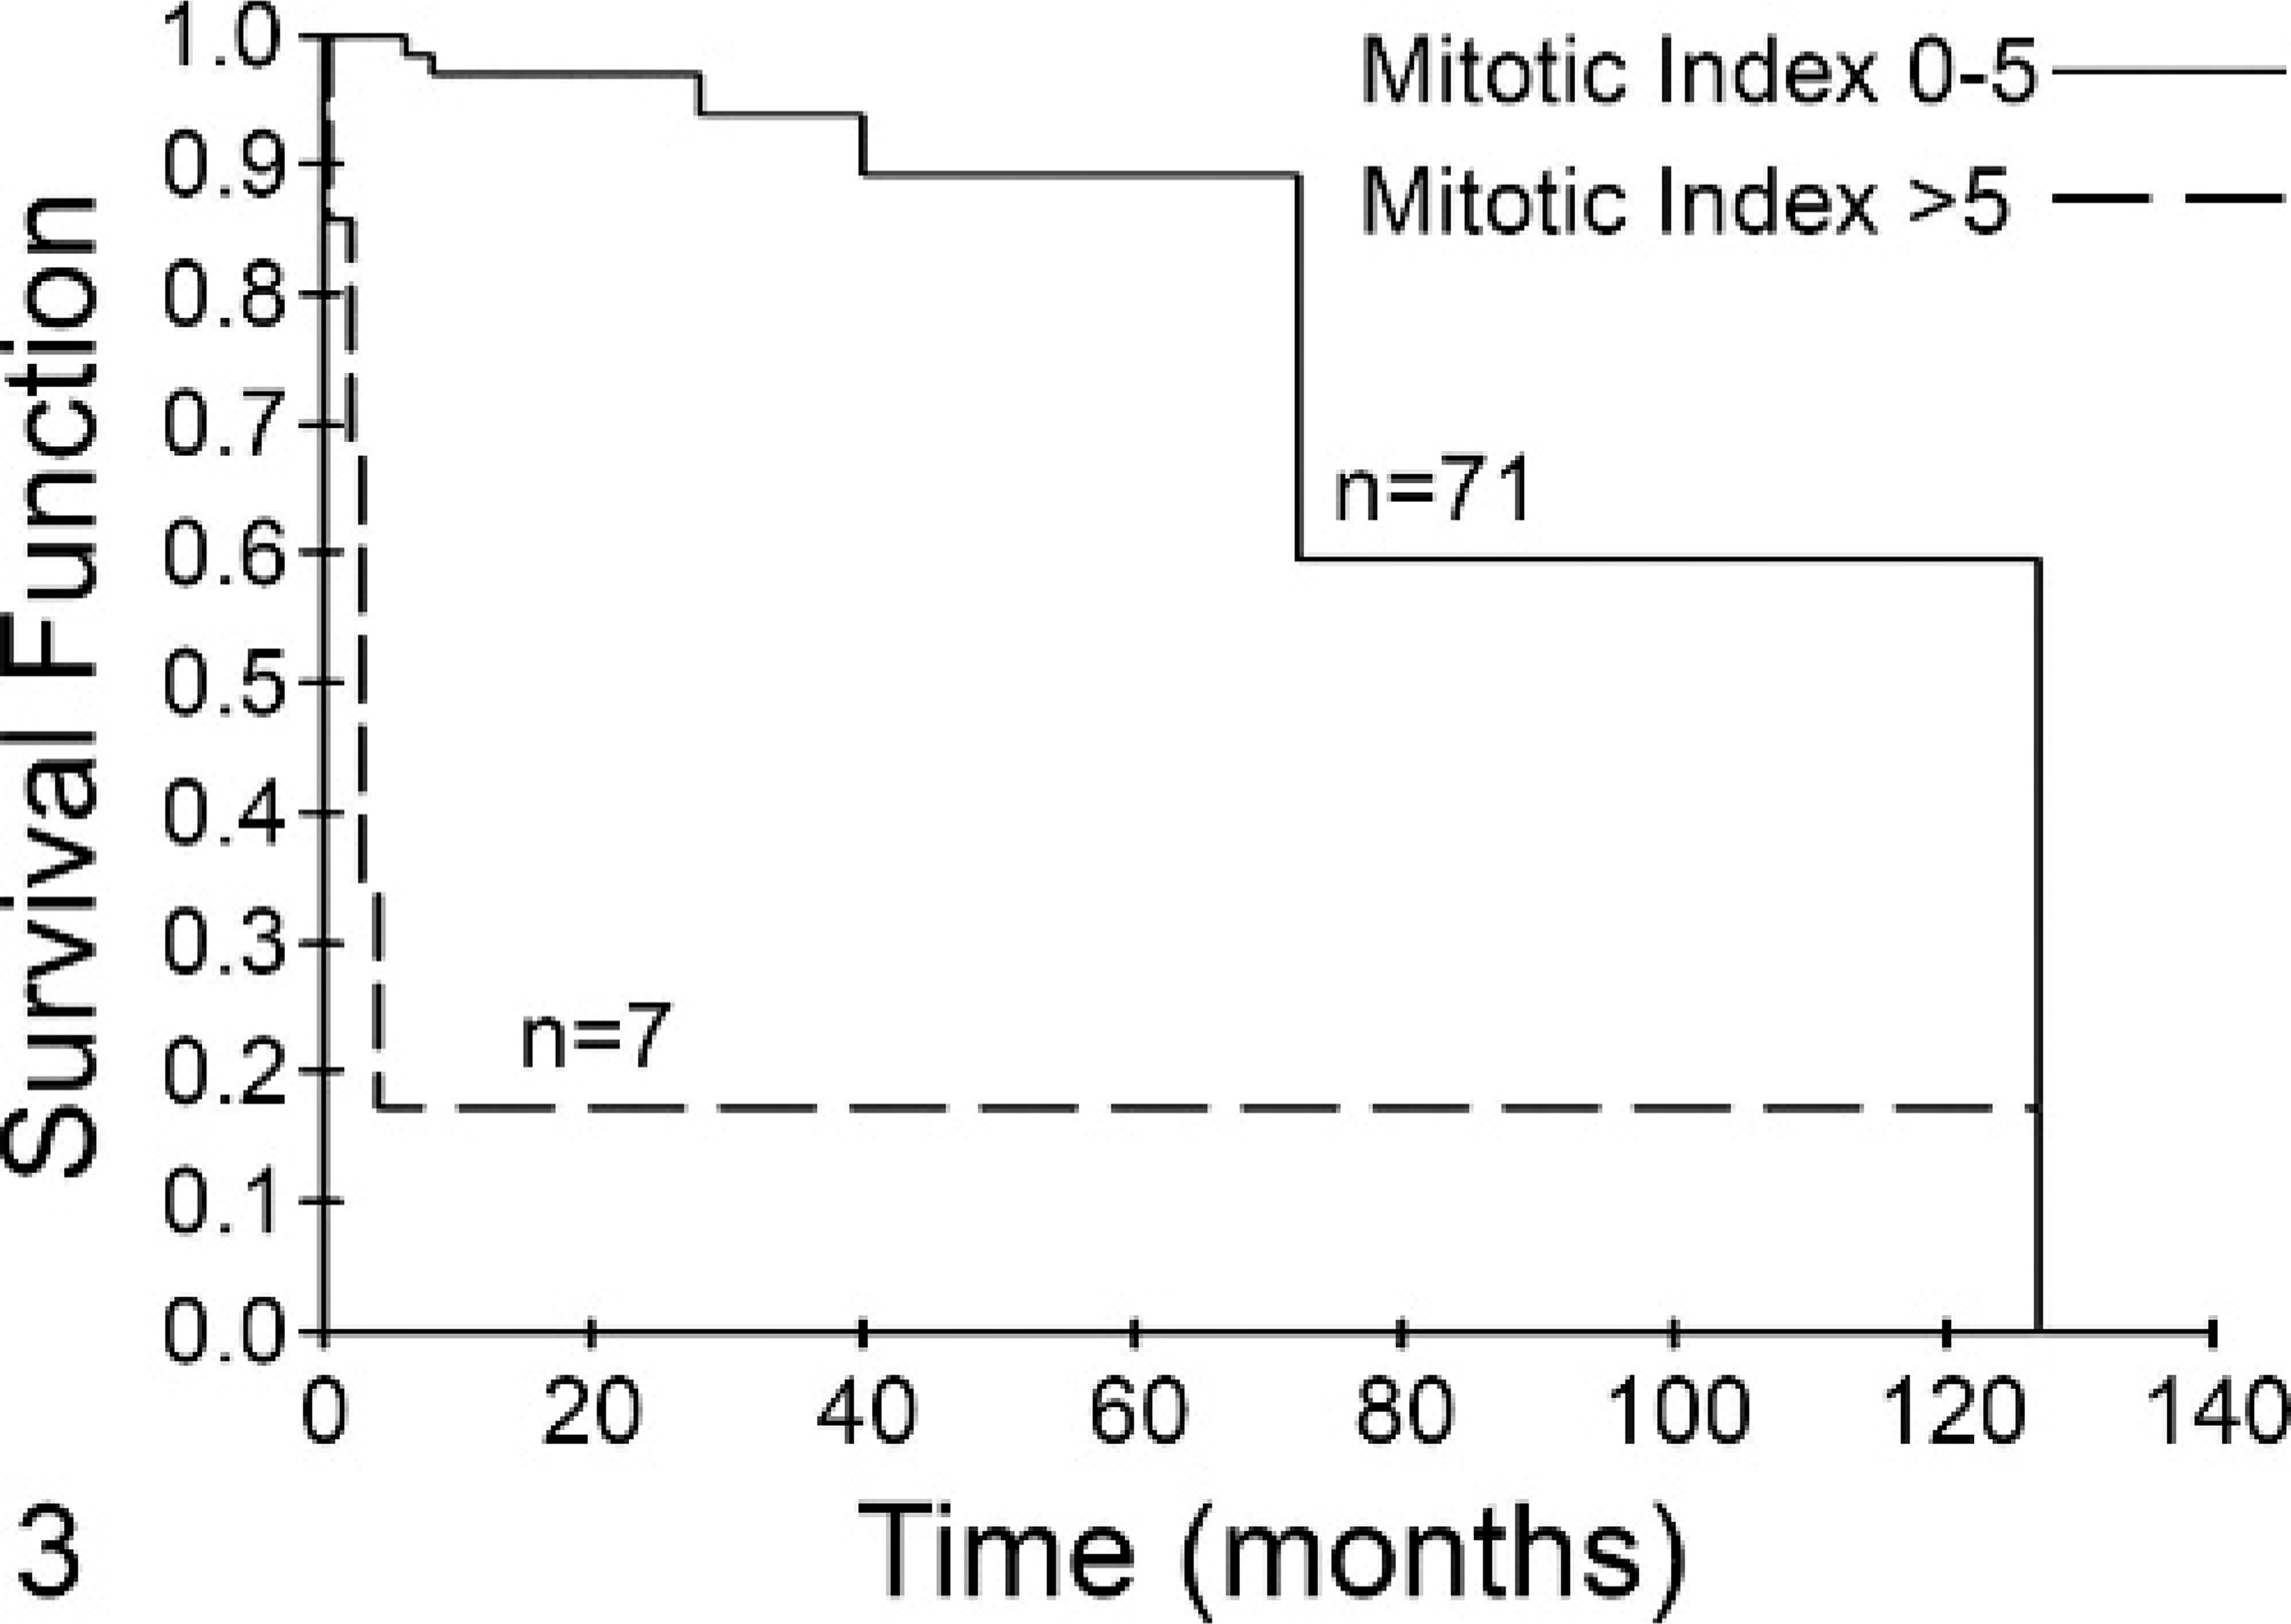
Fig. 3. Mitotic index (MI) is predictive of survival for dogs with mast cell tumors (MCTs) and no metastasis. Dogs with MCTs with an MI of 0–5 (solid line, n = 71) had a median survival of 80 months. Dogs with an MI >5 (dashed line, n = 7) had a median survival of 3 months. This difference was statistically significant (P < .001).
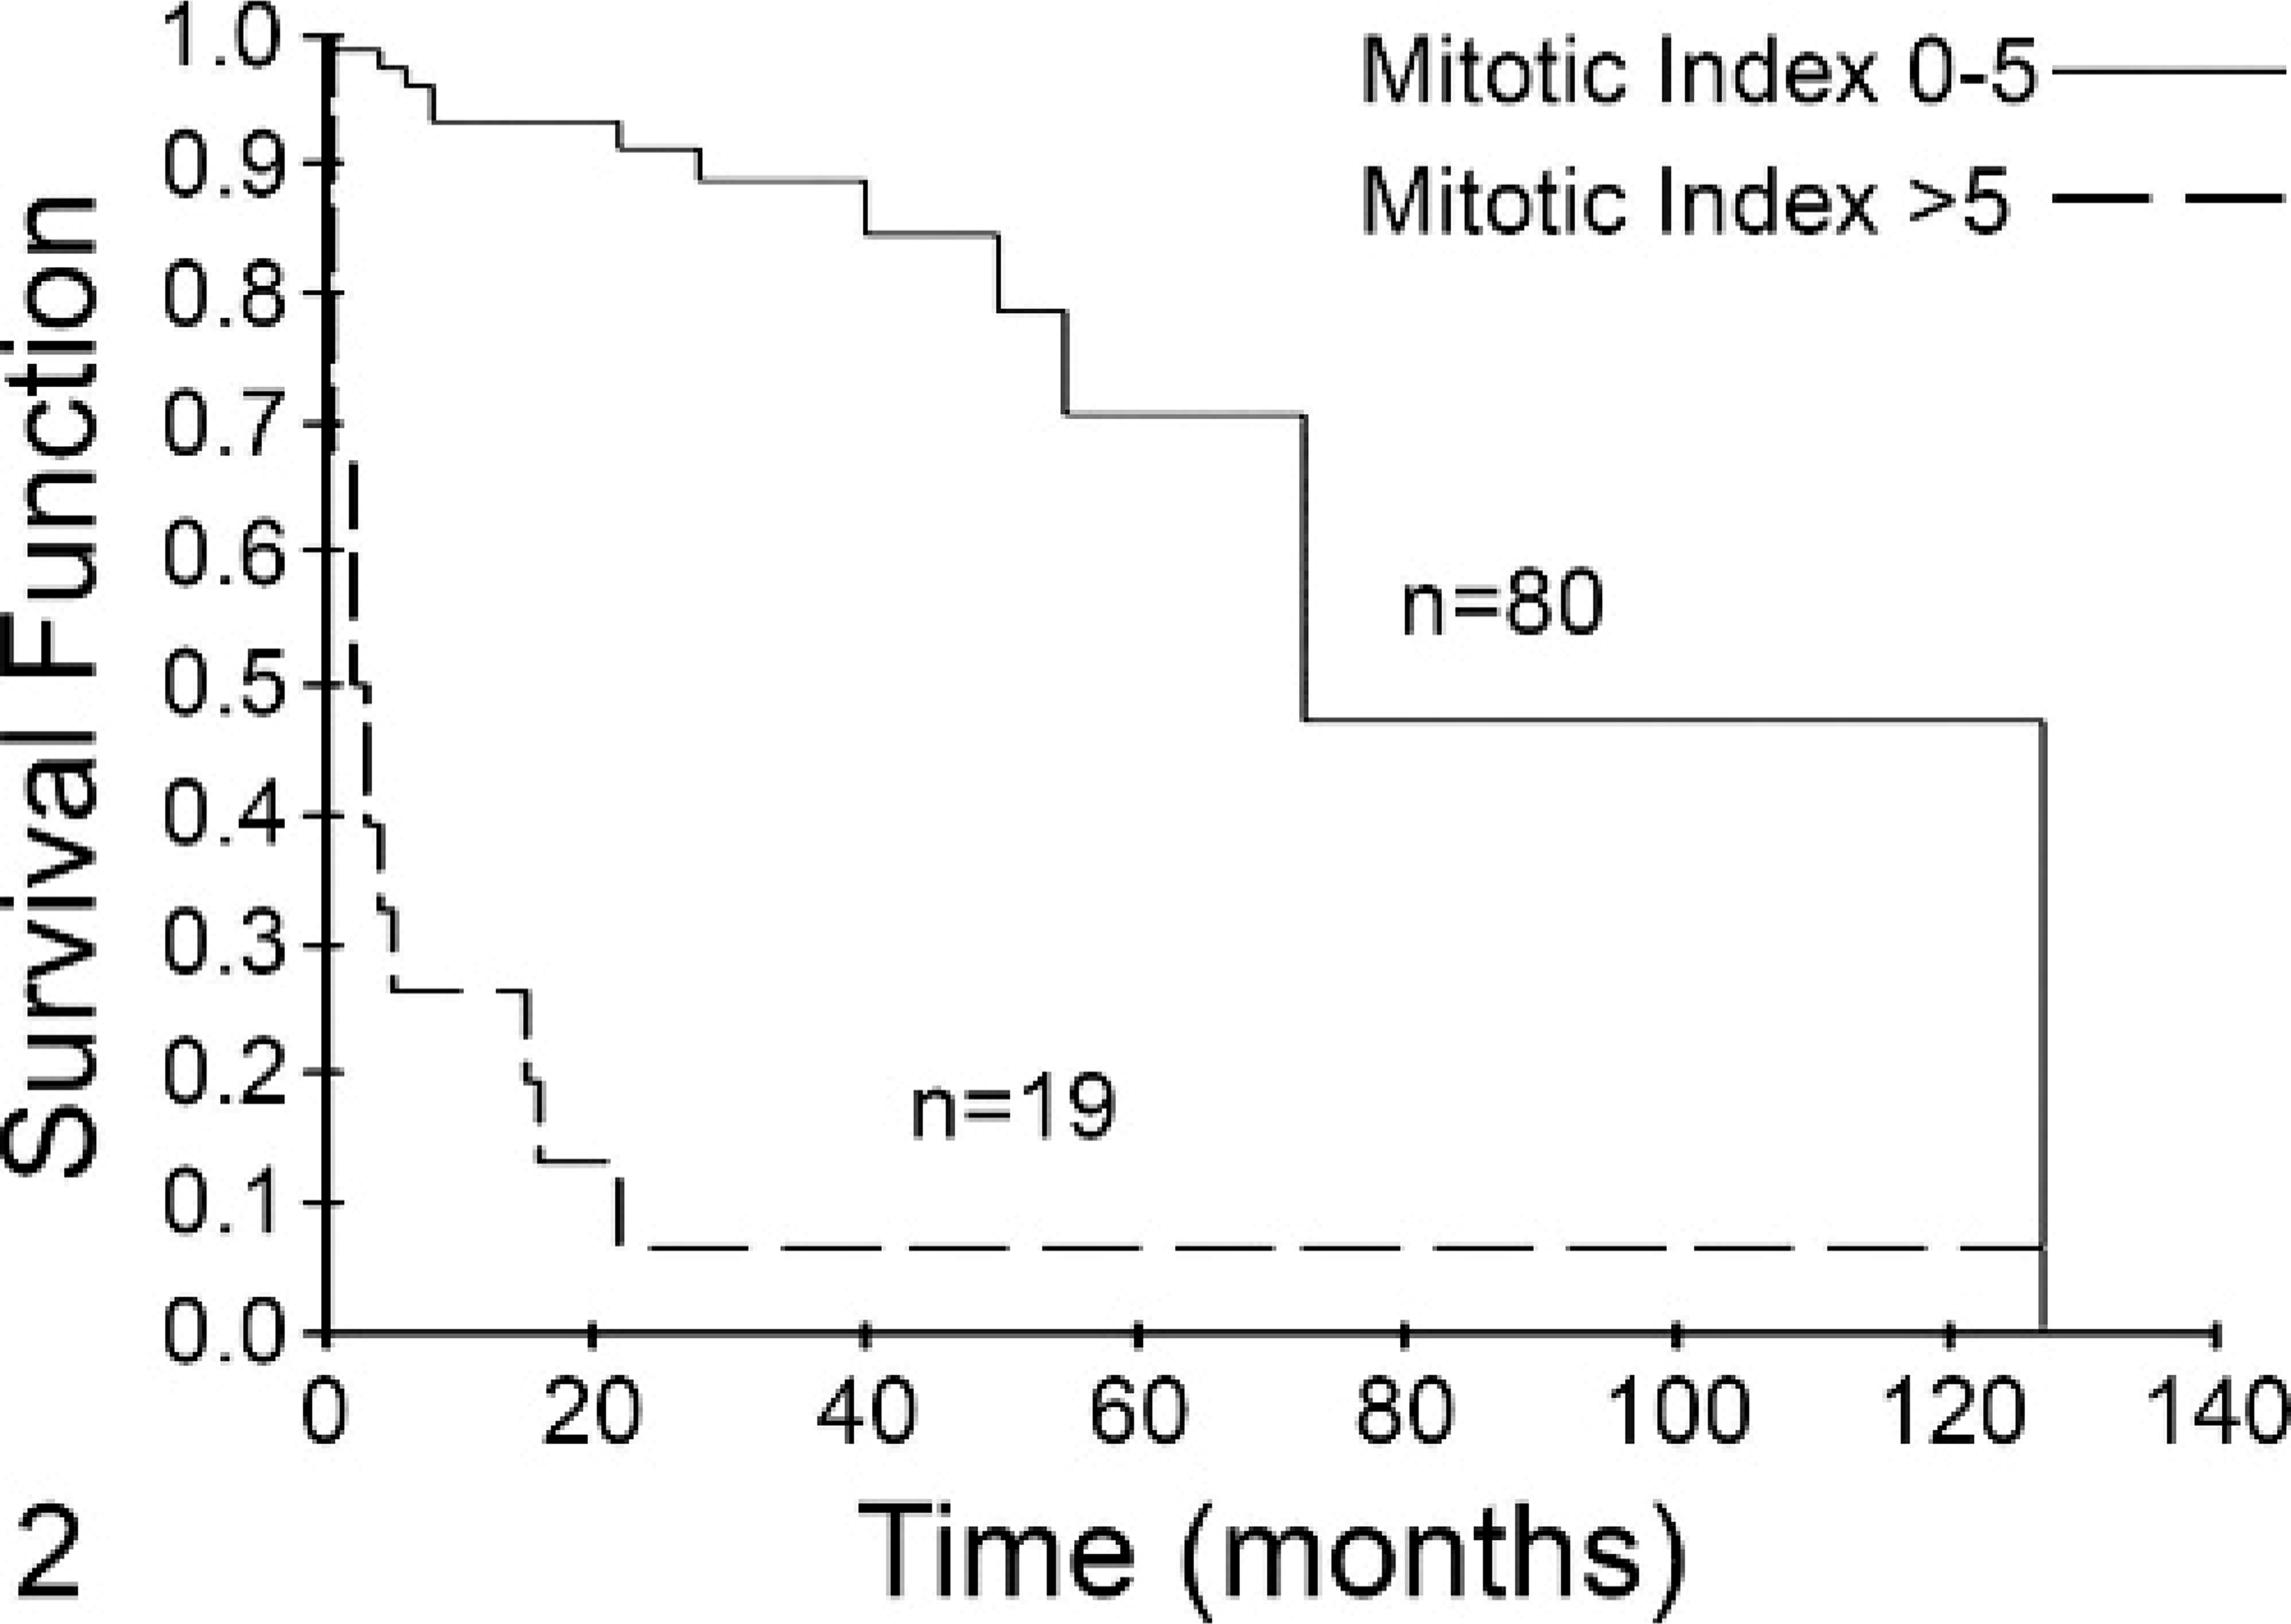
Fig. 2. Mitotic index (MI) is predictive of overall survival for dogs with mast cell tumors (MCTs) independent of tumor grade. Dogs with MCTs with an MI of 0–5 (solid line, n = 80) had a median survival of 70 months. Dogs with an MI >5 (dashed line, n = 19) had a median survival of 2 months. This difference was statistically significant (P < .001).
Discussion
Cutaneous MCTs are one of the most commonly diagnosed and treated neoplasms in canine veterinary medicine.18 Grade is often predictive of biologic behavior, with grade I tumors behaving in a benign fashion and grade III tumors tending to follow a highly malignant course.5,18,19,22,28,30 Many grade II tumors are treated successfully with surgical resection followed by local radiation therapy as needed, but there exists a subset of grade II tumors that spread to local lymph nodes as well as distant sites such as the spleen, liver, and internal lymph nodes, eventually leading to death of the affected patient.18 Predicting the behavior of grade II MCTs has proven to be difficult, and this problem is confounded by the fact that despite specific guidelines for determination of grade (i.e., the Patnaik system), there is significant variation in grade assignment among pathologists.21
Over the past several years, attempts have been made to improve the characterization of cutaneous MCTs in order to better predict biologic behavior and therefore provide guidelines for therapeutics. For example, as previously discussed, Ki-67, PCNA, and AgNOR staining have been used as surrogate markers of proliferation in cutaneous MCTs, and some studies have demonstrated that they do correlate with biologic behavior.1,6,15,27,28 However, these assays require specialized staining techniques and necessitate careful evaluation/counting of positive cells and/or automated image analysis, making them somewhat time-consuming and tedious to perform. As a consequence, evaluation of Ki-67, AgNORs, and PCNA are not routinely performed on MCT specimens. Other approaches have involved the evaluation of DNA aneuploidy, Kit mutation status, and Kit staining patterns.2,10,33 However, these tests have failed to definitively identify those MCTs, particularly grade II tumors, likely to behave in a biologically aggressive manner.
MI is an indirect measure of cellular proliferation much like AgNOR and Ki-67. However, assessment of MI does not require special stains and can be provided relatively quickly at the time of standard evaluation of HE-stained tumor sections. MI has been found to be one of the most useful prognostic indicators for poorly differentiated human thyroid carcinomas, and MI was shown to be the best predictor of outcome following surgical resection of human gastrointestinal stromal tumors.32,34 Furthermore, several studies indicate that MI is an important prognostic factor for human breast cancer and is, therefore, often included in determining the tumor grade.3,20 In veterinary medicine, MI has been found to be predictive for outcome in canine soft-tissue sarcomas, mammary tumors, as well as cutaneous melanoma.16,26,29 Last, it has been shown that MI strongly correlates with other parameters used to assess cell proliferation in canine and feline solid tumors, including AgNOR, MIB1, and PCNA.25
On the basis of the fact that a variety of proliferation indices have been shown to have some prognostic value for canine MCTs, we predicted that MI would be a relatively simple, straightforward measure of proliferation that would provide similar prognostic information. One possible concern with assessment of MI in MCTs is the potential for granulation to obscure nuclear detail, thereby making it difficult to accurately identify mitotic figures. In the current study, the vast majority of samples were amenable to MI evaluation, with only 5% of all samples possessing sufficient granulation to interfere with an accurate count. A future consideration may be to evaluate MCTs for MI using a toluidine blue stain, which does not obscure nuclear detail, is readily available and inexpensive, and does not require special equipment for preparation. A previous study used toluidine blue stains to evaluate cutaneous MCTs for both intratumoral vessel density and MI and found both to be independent prognostic variables for survival. However, the MI was determined per 1 HPF instead of 10 HPFs and, therefore, may not have been as accurate with respect to true mitotic activity of the whole tumor.23
In the present study, we evaluated the MI in 148 cutaneous MCTs to determine if this simple test could be used to predict the biologic behavior of these tumors. We found a direct correlation between tumor grade and MI, with grade III tumors having the highest mean MI. Furthermore, there was a significant association between MI and rate of metastatic disease and overall survival, indicating that this test is predictive for the biologic behavior of cutaneous MCTs and can, therefore, be used to guide clinical decision-making. These results are particularly important with respect to grade II tumors, as it is often difficult to determine which subset is likely to need adjuvant treatment following local control. Our data demonstrate that dogs with grade II tumors possessing an MI >5 had an extremely short median survival time (3 months) compared with those with an MI <5 (80 months). Moreover, for dogs with grade III MCTs possessing an MI <5, the median survival time was not reached, suggesting that MI can be used to identify a subset of grade III tumors likely to have a good prognosis.
As with any retrospective study, there are limitations to the data and statistical analysis. Our follow-up time started at histopathologic diagnosis of cutaneous MCT at UC Davis, not at the time the tumor was first appreciated or even diagnosed at the referring veterinarian. It is possible that some dogs that died shortly after their visit to UC Davis may have actually been alive with their disease for a much longer time than indicated in our data. Also, some patients had follow-up times of less than 6 months, and although they were alive at the time of last contact, they may have died shortly thereafter, thus affecting our statistical analysis. The majority of tumors evaluated in this study were categorized as grade II, limiting the evaluation of MI impact on grade I and grade III tumors. However, clinical decision-making is most difficult for grade II tumors; thus, our results provide important new information with respect to determining how a particular grade II cutaneous MCT is likely to behave. Also, while it appears as if grade III MCTs with a low MI may not be biologically aggressive, the number of tumors with low MI was limited (n = 3), and as such, further studies to explore this possibility are warranted. The cut-off point (MI = 5) was determined using the set of data analyzed in this study; thus, further validation of MI as a prognostic indicator would be ideally performed by testing an additional set of MCTs. Last, the MI was determined by 1 individual, and there is likely to be interobserver variability in the assessment of MI, especially as the field selection technique was used. However, given the clear significant differences in outcome between the groups in this study, we believe that the results of this work are valid.
In conclusion, MI of canine MCTs is easily obtained using standard HE stains and requires only a small amount of additional time by the pathologist during routine histopathologic evaluation of tumor samples. Our data indicate that MI is strongly predictive of biologic behavior and overall survival and should therefore be included as an additional prognostic indicator when determining therapeutic options for canine patients with cutaneous MCTs.
Footnotes
Acknowledgement
This work was supported by a grant from the Canine Health Foundation of the American Kennel Club.