
Abstract
To develop a molecular-based assay so that the diagnosis of feline B-cell neoplasia can be facilitated, we have characterized 24 feline immunoglobulin heavy chain variable region (IGH V) complementary DNA (cDNA) transcripts. Structural homology with rearranged human IGH V genes was found, and the sequence information was used to design a feline-specific polymerase chain reaction (PCR)-based assay to amplify the complementarity determining region 3 as a marker for B-cell clonality. Conserved primers derived from the second and third framework regions of V gene segments were used in conjunction with 2 sequence-specific primers and 1 degenerate primer derived from the J gene segments. Each PCR reaction was run in duplicate, and both native and denatured PCR products were evaluated using polyacrylamide gel electrophoresis. Formalin-fixed, paraffin-embedded (FFPE) tissue sections from cats with confirmed B-cell neoplasia (diffuse large B-cell lymphoma, plasmacytoma, and myeloma) were examined, and 15/22 (68.2%) cats produced results indicative of the presence of a monoclonal population of B cells. The evaluation of denatured PCR products (heteroduplex analysis) facilitated a more accurate interpretation in 3/15 (20%) cats. Pseudoclonality was a major reason for the failure to detect monoclonality. Poor DNA quality is a significant concern and was responsible for the removal of 2 cats from the study. Using this assay, FFPE normal feline lymphoid tissues and unfixed peripheral blood mononuclear cells were determined to be composed of polyclonal populations of B cells. This assay represents a useful adjunctive diagnostic tool for the diagnosis and investigation of feline B-cell lymphoproliferative disorders.
Keywords
Lymphoid neoplasia is most often identified on the basis of a combination of the clinical characteristics of the patient and the morphologic evaluation of affected tissues. Cytology, histology, and immunohistochemistry are complementary tools that often provide a definitive diagnosis. However, microscopic examination can be confounded by a variety of factors, which include inadequate sample size or accompanying populations of nonneoplastic cells. These factors can complicate the diagnosis and have important implications for the treatment and prognosis of the veterinary patient.
Clonality is a fundamental property of neoplasia. Therefore, evaluation of the clonal nature of a population of lymphocytes within tissue samples can facilitate the diagnosis of B-cell neoplasia. The assessment of clonality in suspected B-cell neoplasia is commonly used as an adjunctive diagnostic procedure in humans. 1, 14, 21 The basis for one procedure is the assessment of diversity within the complementarity determining region 3 (CDR3) of the IGH V gene of B cells using the PCR. The CDR3 normally contains a high degree of variability in nucleotide sequence and length. The resulting amino acid sequence is important for providing both specificity and variability of the antigen-binding site of the antibody molecule. The CDR3 variation is the result of combinatorial joining of immunoglobulin heavy chain variable (VH), diversity (DH), and joining (JH) segments of germ line DNA during the early stages of B-cell development. Junctional diversity is generated from several events, which include imprecise joining of the gene segments, deletion of nucleotides at the ends of rearranging segments by nucleases, and random addition of nontemplate encoded nucleotides by terminal deoxynucleotide transferase. 10 In addition, antigenic stimulation of B cells in the germinal center of a lymphoid follicle leads to somatic hypermutation, a process that introduces point mutations throughout the IGH V gene, and is responsible for increased affinity of the resulting antibody molecule. 10, 19
Through the complex methods of VH-DH-JH gene segment rearrangement and somatic hypermutation, polyclonal populations of B cells have diversity in sequence and length of the CDR3. This is in contrast to a neoplastic B-cell population, which is typically monoclonal and has a homogeneous CDR3 of identical nucleotide sequence and length. This loss of diversity in the CDR3 can be used as a marker for the detection of lymphoid neoplasia. 1, 14, 21 PCR amplification of the CDR3 takes advantage of this marker and has been increasingly used in diagnostic situations to demonstrate monoclonality in a range of human and canine lymphoid malignancies including lymphoma, leukemia, and multiple myeloma. 3–7, 16, 17, 22 Furthermore, PCR-based assays are an attractive tool, as they can be used to detect clonality in formalin-fixed, paraffin-embedded (FFPE) tissues. 17, 20 Evaluation of the PCR products using high-resolution techniques, such as polyacrylamide gel electrophoresis (PAGE), often allows the discrimination between polyclonal and monoclonal populations of lymphocytes. For added quality control and increased specificity, the PCR products can be denatured and reannealed and then similarly evaluated using high-resolution methods, a technique referred to as heteroduplex analysis.
In this study, we have cloned and characterized 24 feline IGH V complementary DNA (cDNA) transcripts and developed a PCR-based assay that amplifies the CDR3 from FFPE feline tissues. The IGH V transcripts are similar to the homologous human genomic sequences, and we describe the major features. The PCR assay was used to examine the clonality of B-cell populations in confirmed B-cell neoplasia, including diffuse large B-cell lymphoma, plasmacytoma, and myeloma. The use of 3 JH segment primers in conjunction with 2 consensus VH segment primers enabled the detection of monoclonality in 15/22 (68.2%) cats. Our results suggest that a panel of 4 primer sets and an evaluation of native and denatured PCR products using PAGE facilitates the most accurate interpretation. Furthermore, duplicate PCR reactions are critical to avoid false-positive results (pseudoclonality), and the results should always be interpreted in the context of the pertinent clinical information, as well as histologic and immunohistochemical evaluation of tissue specimens.
Materials and Methods
Cloning the feline IGH V region
Normal splenic tissue was harvested from specific pathogen-free (SPF) cats. The splenic tissue was diced into 5-mm pieces and snap frozen in liquid nitrogen. Total RNA was isolated and purified from the frozen splenic tissue using the Qiagen RNeasy kit (Qiagen, Valencia, CA). An oligo-dT primed cDNA adaptor ligated library was constructed from 2 μg of total feline RNA using the SMART RACE (rapid amplification of cDNA ends) cDNA Amplification Kit (BD Biosciences Clontech, Palo Alto, CA) per manufacturer's instructions. The generation of feline IGH V transcripts from the adaptor ligated cDNA library was performed using the 5′ RACE protocol. The 5′ RACE reaction used the AP1 adaptor primer (BD Biosciences Clontech) and an antisense gene–specific primer (FeIgM: 5′-GGTCTGGATGTCCTG-GTTG-3′) derived from the DNA sequence of feline IGH μ (GenBank accession No. D89025). PCR amplification was performed using the Advantage 2 polymerase enzyme mix (BD Biosciences Clontech) per manufacturer's instructions. Amplification conditions included an initial denaturation at 94°C for 1 minute, followed by 40 cycles at 94°C for 1 minute, 60°C for 30 seconds, and 72°C for 30 seconds. The PCR products of approximately 730 base pairs (bp) were purified from a 1% agarose Tris acetate EDTA (TAE) gel using the QIAEX-II Gel Extraction system (Qiagen) and were subsequently ligated into the pGEM-TEasy vector system (Promega, Madison, WI) for sequencing. The plasmid DNA was transformed into DH5α cells (Invitrogen Life Technologies, Carlsbad, CA), which were grown overnight on agar plates containing ampicillin, isopropyl-β-
Primer design
The sense and antisense primers were designed on the basis of areas of conserved nucleotide sequences in 24 aligned feline IGH V transcripts. Two sense primers (FR2: 5′-CCAGGCTCCAGGGAAGGG-3′, and FR3: 5′-TCCA-GAGACAACGCCAAGAAC-3′) included conserved sequences in the framework 2 or the framework 3 region of the aligned VH segments. The 2 conserved sense primers were used in conjunction with 1 of 2 sequence-specific antisense primers (J1: 5′-ACACCGTCACCAGGGCTCC-3′, and J2: 5′-TGAGGACACTGTGACTATGGTTCC-3′) and a third antisense primer (JD: 5′-GGACACCGTCACY-AKGVYTCC-3′; Y = C + T; K = G + T; V = A + C + G) that contained degenerate nucleotides designed to encompass the sequence variation present in the JH segments in our 24 transcripts.
DNA extraction from FFPE feline tissues
FFPE feline tissues were obtained from the archives at the Veterinary Medical Teaching Hospital at the University of California, Davis. Diffuse large B-cell lymphomas, myelomas, and plasmacytomas were diagnosed by pathologists on the basis of histologic evaluation and immunohistochemical staining patterns. Fresh unfixed feline peripheral blood mononuclear cells (PBMCs) and spleen and cecal submucosal lymphoid tissue were harvested from four SPF cats to provide control samples containing polyclonal populations of B cells. The spleen and cecum were fixed in 10% buffered formalin, routinely processed, and embedded in paraffin wax. Histologic sections were evaluated to confirm the presence of a normal population of lymphocytes.
Genomic DNA was isolated from 25- to 50-μ sections of the paraffin-embedded tissues. The sections were deparaffinized in xylene and washed twice in 100% ethanol, followed by the extraction of genomic DNA using the DNeasy Extraction Kit (Qiagen) per manufacturer's instructions. Genomic DNA from feline PBMCs was extracted using the QIAamp DNA Blood Mini Kit (Qiagen). The concentration of genomic DNA was determined using an Ultraspec 2100 pro spectrophotometer (Amersham Pharmacia Biotech, Uppsala, Sweden). The quality of genomic DNA was assessed by PCR amplification of a 100-bp fragment of the glycer-aldehyde-3-phosphate dehydrogenase (GAPDH) gene 11 and a 300-bp fragment of the feline chemokine receptor CCR5 gene. For amplification of the CCR5 fragment, the same reaction conditions for amplification of the CDR3 were used (see below).
PCR amplification of CDR3
Genomic DNA isolated from FFPE tissues or from fresh, unfixed PBMCs was used as a template. PCR amplification for all primer sets was performed using HotStarTaq DNA polymerase (Qiagen) and 100 ng of genomic DNA template. Concentration of all primers was 10 pmol/50 μl of reaction mixture, except for the degenerate primer JD, which was 100 pmol/50 μl of reaction mixture. Amplification conditions included an initial enzyme activation step of 95°C for 15 minutes, followed by a 2-step touchdown PCR consisting of 5 cycles of 94°C for 30 seconds and 70°C for 2 minutes, 5 cycles of 94°C for 30 seconds and 68°C for 2 minutes, and 35 cycles of 94°C for 30 seconds and 65°C for 2 minutes. All PCR reactions were run in duplicate, and PCR products were visualized with ethidium bromide in a 2% agarose TAE gel for the presence of a band.
Analysis of clonality
PAGE was used to evaluate both native and denatured PCR products. A total of 15 μl of native PCR product was mixed with loading buffer and loaded directly onto precast 10% nondenaturing polyacrylamide Tris-Borate EDTA (TBE) gels (BioRad, Hercules, CA). A second 15-μl sample of the PCR product was denatured at 95°C for 10 minutes, allowed to reanneal at 4°C for 1 hour, and loaded onto pre-cast 10% nondenaturing polyacrylamide TBE gels (hetero-duplex analysis). Polyacrylamide gels containing both native and denatured PCR products were run on ice in TBE at 150 V for 2 hours. The gels were stained with Gel Star (Bio-Whitaker Molecular Applications, Rockland, ME) for 30 minutes and visualized on an ultraviolet transilluminator (Fisher Scientific, Pittsburgh, PA). Digital images of poly-acrylamide gels were obtained using a Gel Doc 1000/2000 digital camera and Quantity One imaging software (BioRad).
Cloning and sequencing PCR products
Four cats (No. 1, No. 6, No. 8, and No. 16) that had results consistent with monoclonality with primer sets including the FR2 primer, but not with primer sets including the FR3 primer, were cloned and sequenced. In 3 cats (No. 1, No. 6, and No. 16), the primer set FR2/JD was used, whereas for 1 cat (No. 8), the primer set FR2/J2 was used. The conditions for PCR amplification and subsequent separation and staining of denatured PCR products on 10% TBE polyacrylamide gels are described above. In each cat, a single DNA band was identified in the appropriate size range for primer sets including the FR2 primer (250–300 bp). The PCR products were excised from the gel, placed in 200 μl of water, and incubated overnight at room temperature to extract DNA. Following extraction, the PCR products were cloned and sequenced as previously described. To ensure the accuracy of the sequence information, 3 complete sequences for each cat were aligned and analyzed using Vector NTI Suite 5.5 (InforMax).
Results
Characterization of the feline IGH V region transcripts
Transcripts that encompassed the VH, DH, and JH segments and the 5′ end of the immunoglobulin M (IgM) constant region were generated from normal feline splenocytes using 5′ RACE amplification. A total of 24 transcripts were analyzed (Fig. 1). The aligned sequences demonstrated several features that were homologous with human IGH V genes. All sequences contained a conserved methionine start site and two conserved cysteine residues at positions 41 and 115. The cysteine residues are believed to be critical for disulfide bonding and tertiary structure of the antibody molecule. As in humans, the feline IGH V gene is composed of a leader sequence, followed by four conserved framework regions that alternate with three hypervariable complementarity determining regions (CDR-1, CDR-2, and CDR-3). Single amino acid differences were scattered throughout the framework regions. These most likely reflected either V family segment sequence variation or the result of somatic hypermutation. Alignment of feline transcripts also illustrated the high degree of homology within the conserved framework regions of the feline VH segments. This facilitated the design and use of two consensus sense primers (FR2 and FR3) within the second and third framework regions. The feline IGH CDR3 exhibited a high degree of diversity with respect to length and nucleotide composition. Although this hypervariable region is encoded by a combination of VH, DH, and JH gene segments, the exact boundaries between each of these gene segments could not be determined at the cDNA level.
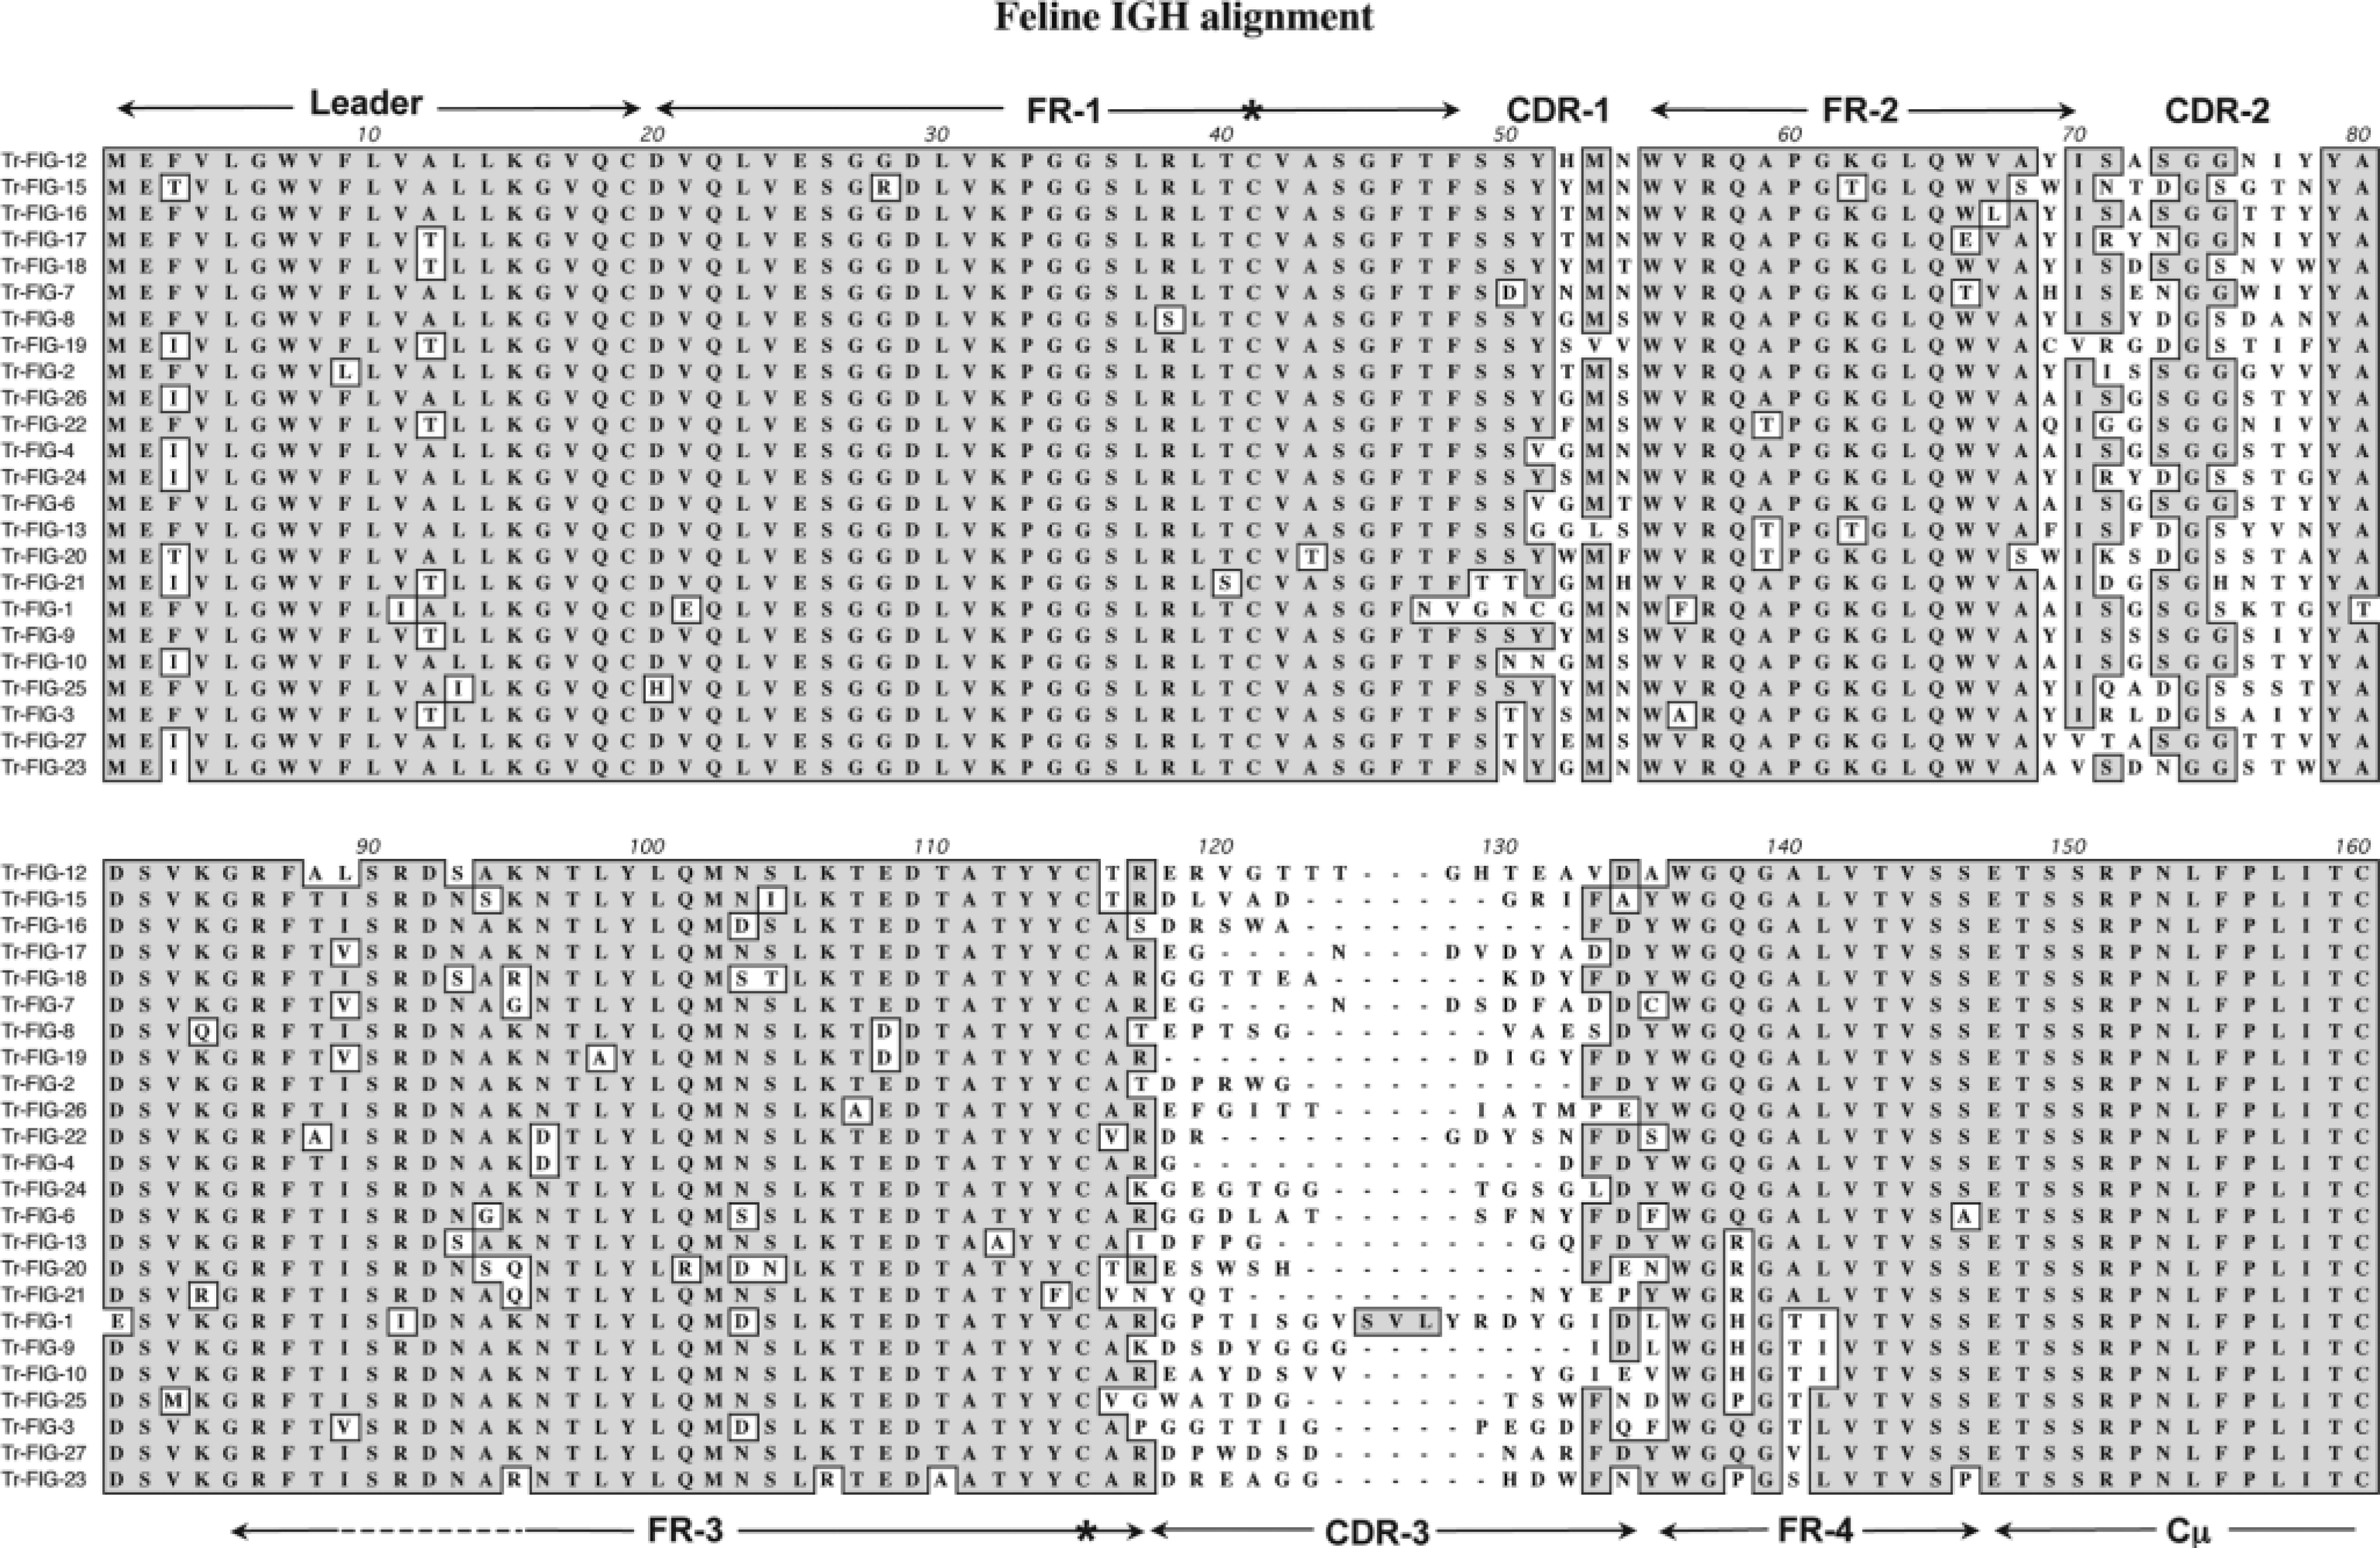
Amino acid sequence alignment of 24 feline IGH V cDNA transcripts that encompass the heavy chain VH, DH, and JH segments and part of the IGH μ constant region. The feline IGH V region genes contain a leader sequence that is followed by four conserved framework regions that alternate with three hypervariable regions, denoted complementarity determining regions 1, 2, and 3 (labeled CDR-1, CDR-2, and CDR-3). Eight JH segments (framework 4) represented by unique amino acid sequences are identified; however, two JH segments are predominantly used. Each transcript contains a methionine start site and two conserved cysteine residues (∗) at amino acid positions 41 and 115. Determinations of VH, JH, and μ constant region boundaries were estimated on the basis of alignment with the human IGH V locus. The amino acid sequences are organized to illustrate the eight unique JH segments. Shaded areas indicate regions of homology. Dashes are introduced to facilitate alignments.
Alignment of feline IGH V transcripts also facilitated the examination of the JH segment (framework 4 region). A total of eight different JH segments were identified on the basis of amino acid sequence variation. Some of the sequences differed by a single amino acid. Predominant usage of particular JH segments in the 24 clones was observed. This prompted the design of two specific antisense primers (J1 and J2) and a degenerate antisense primer (JD). The J1 and J2 primers were designed on the basis of the nucleotide sequences present in 18/24 and 3/24 clones, respectively. The JD primer was designed to encompass the nucleotide sequence variation within the JH segment and to facilitate the amplification of CDR3 from samples of DNA in which less frequently used JH segments were present.
Signalment, tumor classification, and DNA quality of 24 cats with B-cell neoplasia
The case signalment, tumor distribution, and morphologic classification are shown in Table 1. The cats ranged from 2 to 17 years, and most were castrated males (17/24; 70.8%). All of the cats were feline leukemia virus and feline immunodeficiency virus (FIV) negative, expect for cat No. 7, which was experimentally infected with FIV. Diffuse large B-cell lymphomas were classified as either centroblastic (16/19; 84.2%) or immunoblastic (3/19; 15.8%) (Figs. 2, 3) on the basis of the “World Health Organization Classification of Tumors of Hematopoietic and Lymphoid Tissues,” 9, 18 and both plasmacytomas were classified as mature-type tumors. 12 Myelomas were not further classified. In all cats, neoplastic lymphocytes expressed CD79a and lacked expression of CD3 using immunohistochemistry, confirming their B-cell lineage.
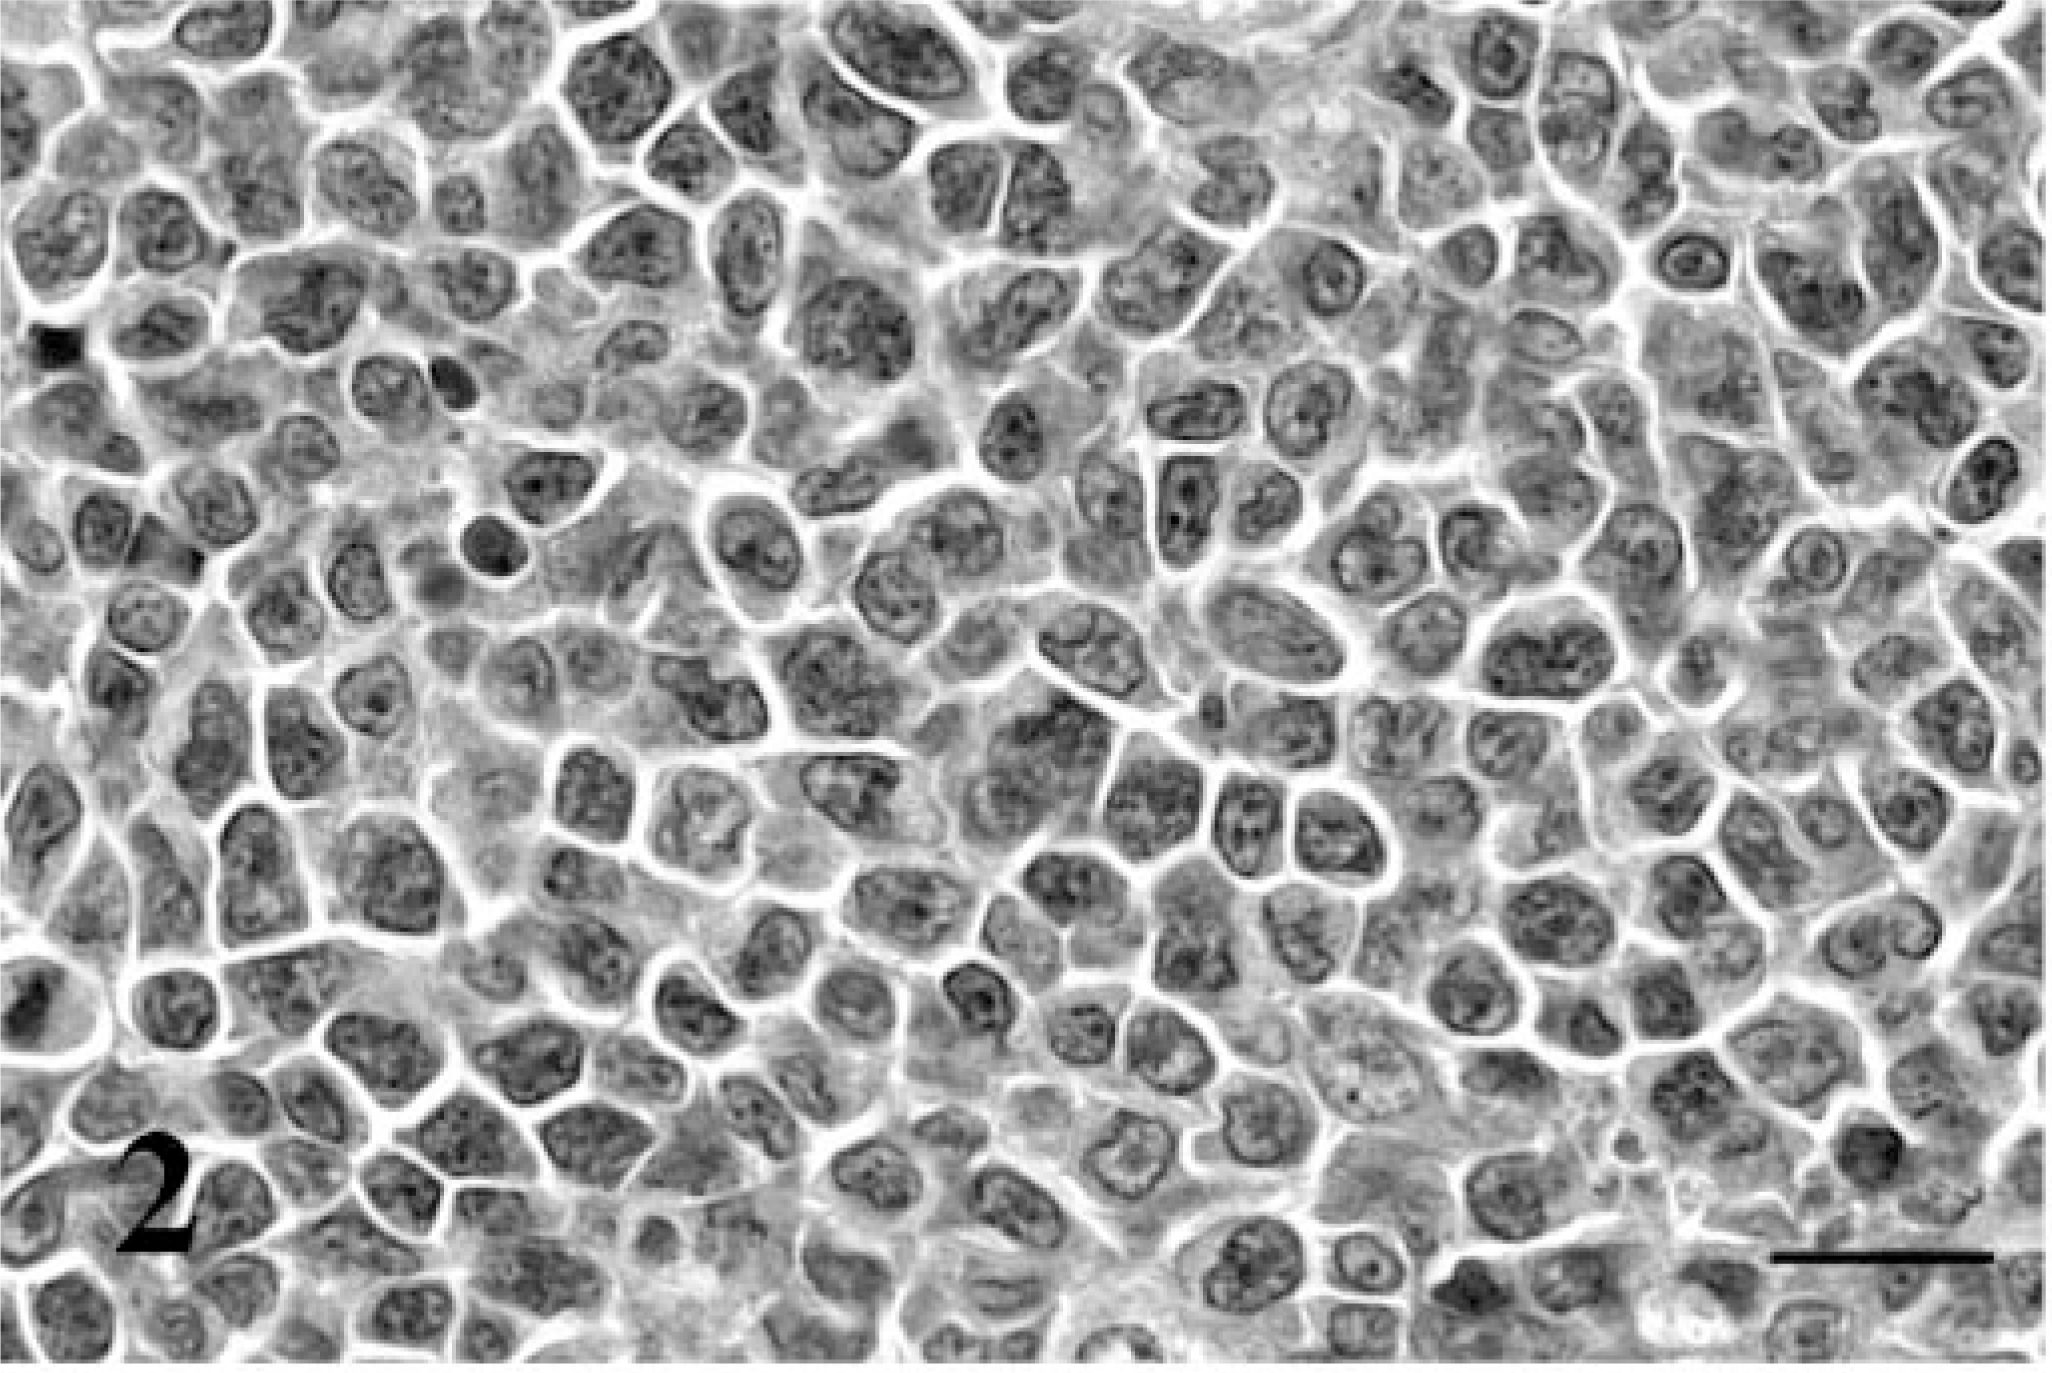
Centroblastic diffuse large B-cell lymphoma; cat No. 2. The neoplastic B cells have large nuclei with clumped and branched chromatin and multiple nucleoli. HE. Bar = 20μm.
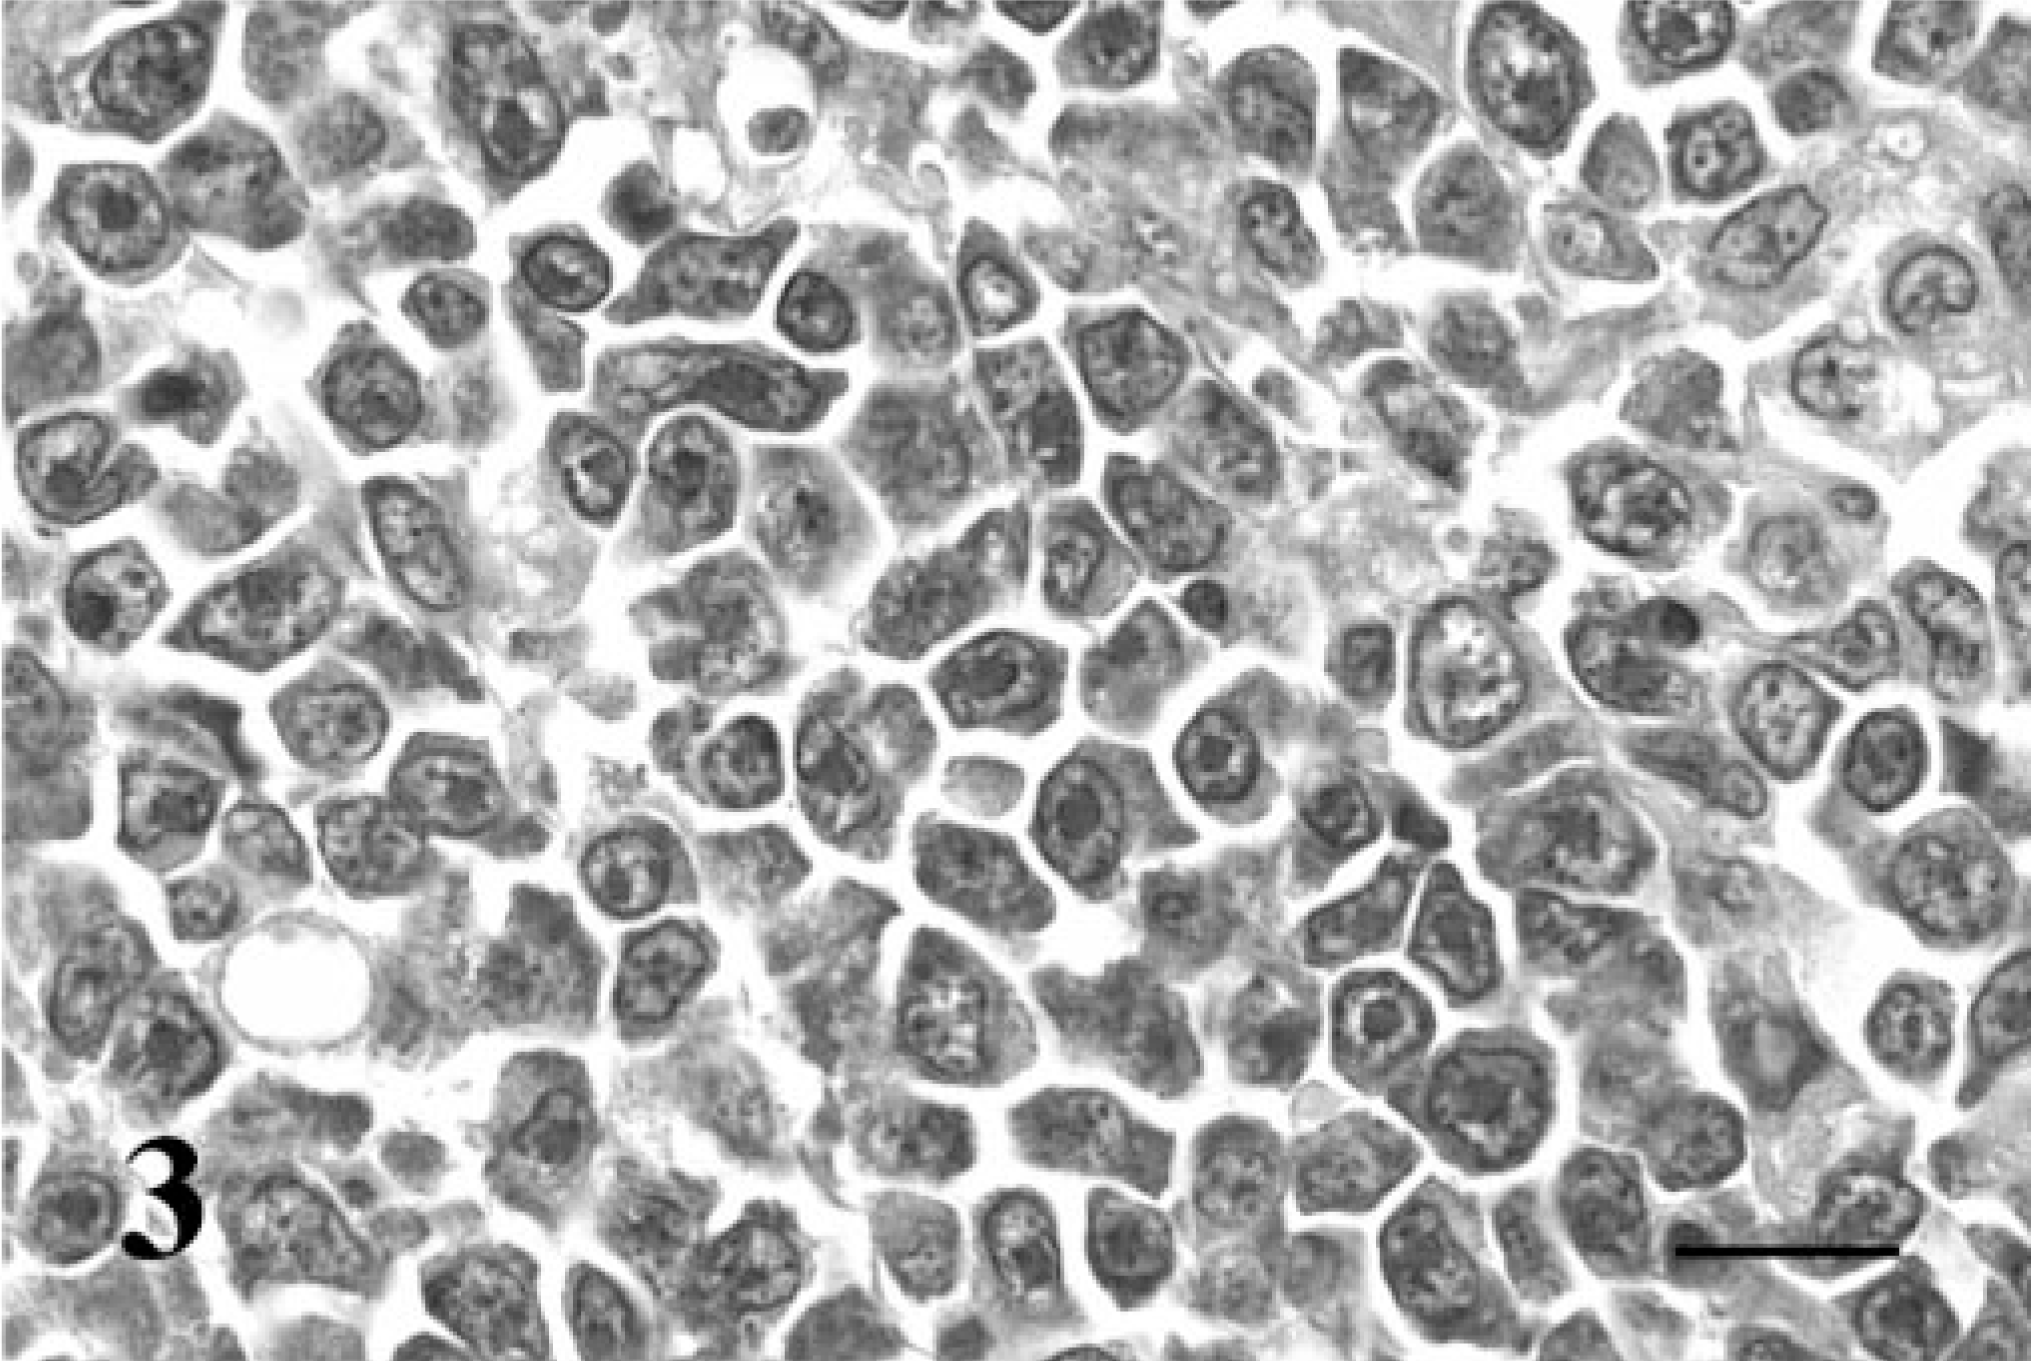
Immunoblastic diffuse large B-cell lymphoma; cat No. 16. The neoplastic B cells are large and atypical with round-to-ovoid and occasionally clefted and indented nuclei. Many nuclei have characteristic prominent, single, large, central nucleoli. HE. Bar = 20 μm.
Age, sex, tumor distribution, and morphologic classification of 24 cases of feline B-cell neoplasia.∗
∗ DLBCL = diffuse large B-cell lymphoma; MC = male castrate; FS = female spay; LN = lymph node.
† Biopsies from same patient at 2 different times.
The quality of DNA in FFPE tissues was evaluated using PCR amplification of an approximately 100-bp fragment of the feline GAPDH gene and a 300-bp fragment of the feline chemokine receptor CCR5 gene. The two sizes of the amplicons were chosen as controls for PCR reactions involving FR3 and FR2 primers, respectively. All 24 cats with B-cell neoplasia produced a GAPDH amplicon, whereas amplification of CCR5 was not detected in 6 cats (data not shown). Of these 6 cats, monoclonality was not demonstrable in 2 (cat Nos. 7 and 10). The results of CDR3 amplification for these 2 cats were considered uninterpretable as a result of poor DNA quality.
Analysis of clonality
PCR amplification of the CDR3 of normal B-cell populations and neoplastic B cells was performed in duplicate using each of the three JH primers in conjunction with both VH primers, so that products from 12 separate PCR reactions for each sample were obtained. PCR reactions using the FR2 and FR3 primers produced amplicons that ranged from approximately 250–300 bp and 130–180 bp, respectively. Separation of the amplicons on 2% agarose TAE gels was not sufficient to determine the clonal nature of populations of B cells, but it did confirm the presence of PCR products.
PCR amplification, followed by PAGE, produced results characterized as monoclonal, polyclonal, oli-goclonal, or pseudoclonal (Fig. 4). Detection of a reproducible distinct band is consistent with PCR product homogeneity and restricted diversity of the CDR3. The presence of a single band indicates clonal rearrangement of one IGH allele, whereas the presence of two bands indicates clonal rearrangement of both IGH alleles. Therefore, the presence of one or two reproducible bands is the hallmark of monoclonality, and it is characteristic of a neoplastic population of B cells. In contrast, PCR products derived from a normal polyclonal population of B cells generate a smear, indicative of PCR product heterogeneity and diversity of the CDR3. Oligoclonality is defined as 3–5 distinct and reproducible bands and is consistent with the presence of restricted clonal diversity within the sample. Oli-goclonality is most typically associated with some inflammatory conditions, but it can also be associated with immunosuppressive and premalignant states. 21 Pseudoclonality is defined as one or more distinct but nonreproducible bands that arise following random amplification of limiting target B-cell DNA. Duplicate PCR reactions permitted the distinction between clonal and pseudoclonal results. In the absence of duplicate reactions for each sample, pseudoclonality can result in false-positive monoclonal results. 21, 23
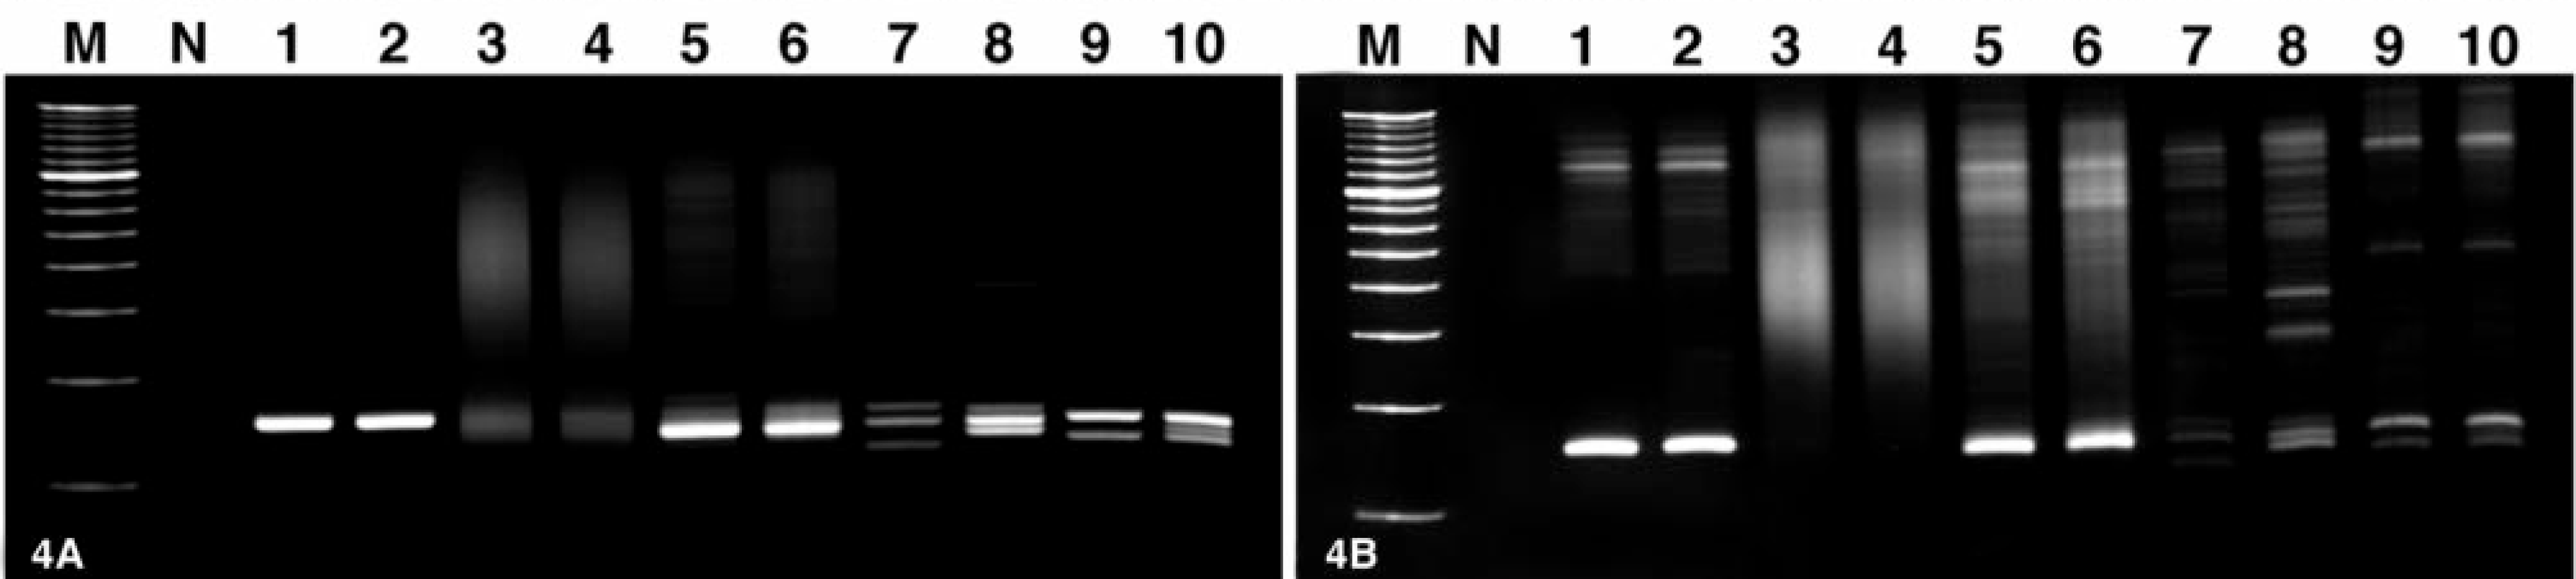
Polyacrylamide gels showing native
The interpretation for each cat was based on the results of native and denatured PCR products separated on 10% nondenaturing polyacrylamide TBE gels (Table 2). A monoclonal result produced by at least one primer pair was sufficient to define monoclonality. PAGE analysis produced monoclonal results with at least one of the six primer sets in 15/22 (68.2%) of the cats with B-cell neoplasia examined. This included 10/17 (58.8%) diffuse large B-cell lymphomas, 2/2 (100%) myelomas, and 3/3 (100%) plasmacytomas. Evaluation of native PCR products was sufficient for the detection of monoclonality in 12/15 (80%) cats, whereas heteroduplex analysis using denatured PCR products was necessary for 3/15 (20%) cats. This emphasizes the added value of heteroduplex analysis in this assay.
Results and final interpretation of duplicate PCR reactions, followed by PAGE analysis of both native and denatured PCR products.∗
∗ M = monoclonal; O = oligoclonal; PS = pseudoclonal; PC = polyclonal; NA = no amplification.
† NI = not interpretable due to failure to amplify CCR5 fragment.
‡ Biopsies from same patient at 2 different times.
Both framework primers were necessary for maximum sensitivity, because monoclonality was detected by the FR2 primer alone in four cats and by the FR3 primer alone in two cats. In the remaining nine cats, the FR2 and FR3 primers produced concordant results. All of the cats that were detected with the J1 primer were also detected with the JD primer. Furthermore, detection of monoclonality with the J1 and JD primers was mutually exclusive from monoclonality detected using the J2 primer. The JD primer alone was able to detect monoclonality in cat No. 16 and myeloma cat No. 1. These two cats may have neoplastic B cells that used a rare JH segment that is not recognized by the J1 or J2 primers. These results suggest that the J2 and JD primers are necessary for the greatest sensitivity in the evaluation of B-cell clonality using this assay, whereas use of the J1 primer is redundant.
Failure to detect monoclonality occurred in 9/24 (37.5%) cats with B-cell neoplasia that had been diagnosed by pathologists on the basis of histologic evaluation and immunohistochemical staining patterns. The failure to detect monoclonality using the six primer combinations was demonstrated by the absence of detectable PCR products or results indicative of oli-goclonality or pseudoclonality. On the basis of the composite results from the six duplicate PCR reactions, it was shown that at least one primer set produced a pseudoclonal result for each cat in which monoclonality was not detected. Therefore, all of the cats for which monoclonality could not be demonstrated were interpreted to be pseudoclonal. Because pseudoclonality is best detected by the evaluation of duplicate PCR reactions, these results highlight the necessity of duplicate PCR reactions for each primer set.
PAGE analysis of normal feline tissue samples, including fresh, unfixed PBMCs, and FFPE spleen and cecal submucosal lymphoid tissue produced results consistent with a polyclonal population of B cells regardless of the primer set used.
Analysis of FR3 primer site in four cats
Results indicative of a monoclonal population of B cells were produced in four cats (No. 1, No. 6, No. 8, and No. 16) using primer sets that included the FR2 primer but not the FR3 primer. For each of these cats, the integrity of purified DNA was confirmed following the amplification of portions of the feline GAPDH and chemokine receptor CCR5 genes. To further investigate these discordant results, amplicons from these four cats were generated using the FR2 primer. In each instance, PCR amplification produced a single PCR product within the expected size range (250–300 bp), which was subsequently purified, cloned, and sequenced. Because the FR2 primer was used, each PCR product included the entire DNA sequence of the framework 3 region. Alignment of the DNA sequences with the FR3 primer annealing site from these four cats, as well as four feline splenic IGH V transcripts, shows several DNA base pair mismatches (Fig. 5). These mismatches are scattered throughout the FR3 annealing site and, in most instances, are concentrated at the 3′ end. This is in contrast to the FR3 annealing site of the four feline splenic IGH V transcripts, which are identical to the FR3 primer. This suggests either V family sequence variation or somatic hypermutation as a cause of the mismatches.
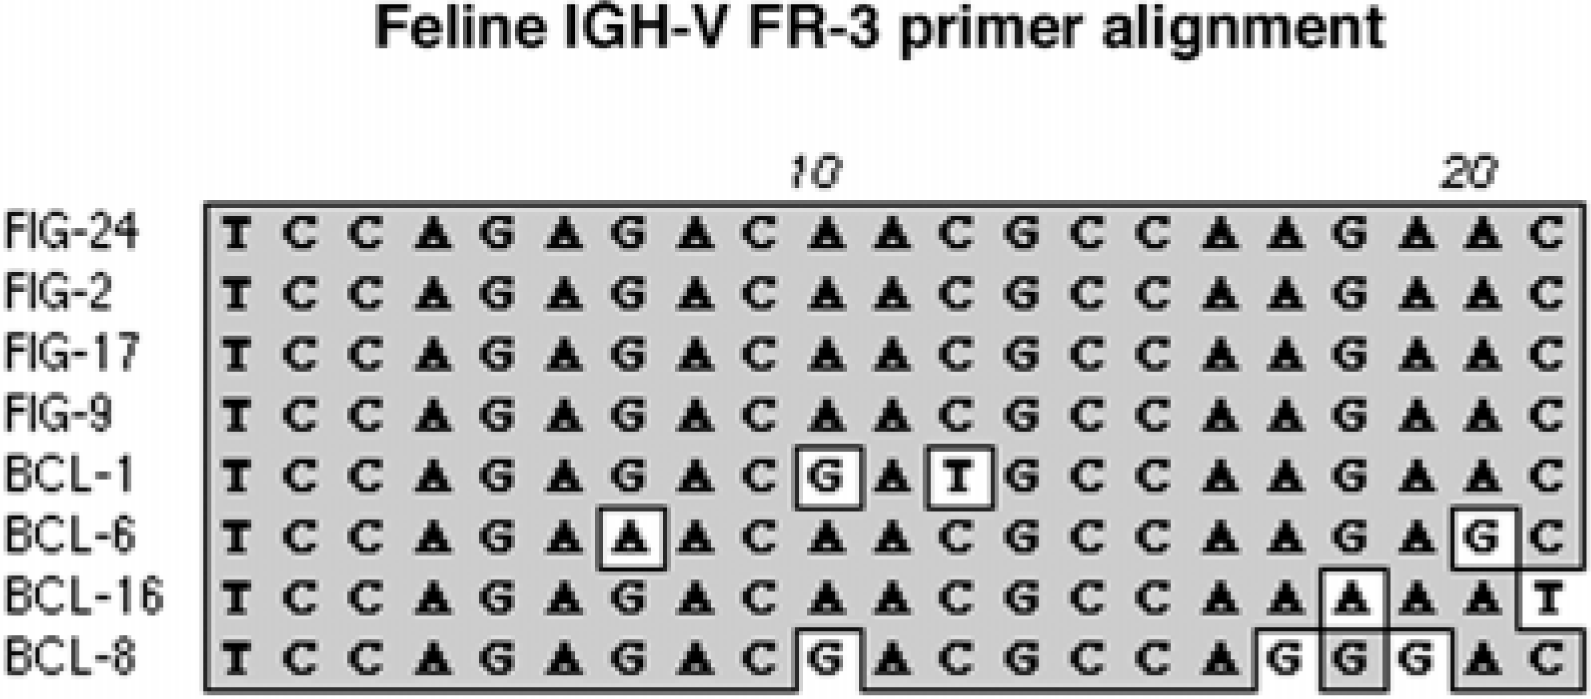
DNA sequence alignment of the FR3 primer annealing site from four normal feline splenic IGH V cDNA transcripts (labeled FIG) and four DLBCL cats (labeled BCL) that produced false-negative results with FR3 primer sets but positive clonal results with FR2 primer sets. In each DLBCL cat, single nucleotide differences are scattered throughout the FR3 primer sequence. The nucleotide sequences of the four feline IGH V transcripts are 100% identical to the FR3 primer. Shaded areas indicate regions of homology.
Discussion
This study characterizes 24 feline IGH V cDNA transcripts. The sequence information obtained showed structural homology with human IGH V genes and was used to develop a PCR-based assay that can be used to evaluate clonality in feline B-cell lymphoproliferative diseases using DNA extracted from FFPE tissues. We have developed two VH segment sense primers, one specific JH segment antisense primer, and one degenerate JH segment antisense primer that, together, provide the greatest sensitivity in the detection of monoclonality. Analysis of native as well as denatured PCR products (heteroduplex analysis) in polyacrylamide gels is a high-resolution technique that was used to differentiate between monoclonal and polyclonal populations of B cells. Importantly, duplicate PCR reactions were essential to avoid the pitfalls of pseudo-clonality and false-positive results. We propose that this assay represents an important adjunctive tool in the diagnosis of B-cell lymphoproliferative diseases in feline patients.
The feline IGH V transcripts demonstrated structural homology with human IGH V genes. Analysis of the VH segments from the 24 transcripts revealed that no two were identical, suggesting that there are likely more than 24 VH segments in the cat. This is considered reasonable, because there are believed to be 46–52 functional VH segments in humans 13, 21 and 200–1,000 VH gene segments in mice. 10 However, the number of VH segments in cats is unknown, and analysis of the feline IGH locus at the genomic level to examine this has not been performed. Also, assignment of our 24 VH segments to families or clans could not be accurately performed at the cDNA level, because it is unknown whether sequence variation is associated with somatic hypermutation or family/clan differences.
Alignment of the CDR3 illustrated marked variability in nucleotide composition and length between the transcripts. This was expected because of the combinatorial joining of VH, DH, and JH germ line DNA segments, which generates junctional diversity during early B-cell development. It is this wide variation in the CDR3 nucleotide sequence and size that provides the basis for a PCR-based assay to detect clonality in B-cell populations. Because of the variability inherent in recombinatorial events that occur in the CDR3, the exact boundaries of the DH segments could not be accurately determined, which precluded evaluation of the feline DH segments.
Eight potentially distinct JH segments were identified on the basis of differences in amino acid sequence. This is comparable to the six functional JH segments described in humans. 21 It is possible that several of the distinct JH segments noted among these transcripts represent variants created by somatic hypermutation. Clear dominance of JH segment usage was observed in the transcripts characterized with two JH segments, denoted J1 and J2, used most frequently. Interestingly, JH segment predominance is also recognized in human B-cell malignancies. 21 The predominance of JH segment usage prompted the design of two specific JH segment primers (J1 and J2). Furthermore, a degenerate JH segment primer (JD) was constructed that would theoretically recognize the predominant JH segments, J1 and J2, as well as JH segments that were less frequent among our transcripts.
PAGE analysis of native and denatured PCR products produced results consistent with monoclonal, oli-goclonal, or polyclonal populations of B cells. Using this assay, 15/22 (68.2%) cats with confirmed B-cell neoplasia (diffuse large B-cell lymphoma, plasmacytoma, and myeloma) produced a monoclonal result consistent with PCR product homogeneity. The sensitivity of this assay compares favorably with human assays, in which the reported sensitivity ranges widely, depending on the number of primer sets used and the type of B-cell malignancy examined. A report of the European BIOMED-2 collaborative study used several multiplex PCR assays to detect clonal rearrangements of several immunoglobulin genes, including IGH V-J, IGH D-J, IGK, IGL, and the kappa deleting element, as well as to detect the presence of t(11,14) and t(14,18) translocations. Using this protocol, close to 100% of lesions in human patients with B-cell neo-plasia were determined to be composed of a monoclonal population of B cells. Of the cats with B-cell neo-plasia studied, 10/17 (58.8%) cats with diffuse large B-cell lymphoma, 2/2 (100%) cats with plasmacytoma, and 3/3 (100%) cats with myeloma were determined to be composed of a monoclonal population of B cells using this assay. Two of the myeloma cases were from the same patient at two different time points. As expected, the primer sets that were able to demonstrate monoclonality in these two samples (FR2/JD, FR3/J1, and FR3/JD) did not change over time.
Amplification of the CDR3 from all of the samples containing normal B-cell populations, including fresh PBMCs, and FFPE samples of feline spleen and cecal lymphoid tissue produced PCR product smears indicative of a polyclonal population of B cells. Furthermore, evaluation of both native and denatured PCR products produced the same result, which occurred regardless of the primer set used.
Occasionally, interpretation of native PCR products is hampered by the presence of a background smear or faint banding pattern that obscures monoclonal bands in the target range. In these situations, PCR products can be denatured, reannealed, and then resolved on polyacrylamide gels, a technique referred to as heteroduplex analysis. When homogeneous PCR products of identical size and sequence are denatured by heat and subsequently allowed to slowly reanneal, they form homoduplexes that migrate in the expected size range for the assay. However, heterogeneous PCR products of similar size and variable sequence will form imperfectly annealed heteroduplexes that migrate at a slower rate, resulting in a broad smear or banding pattern in the higher-molecular-weight regions of the gel. As a consequence of the differential migration rates, heterogeneous PCR products are removed from the target range, leaving only the perfectly annealed homogeneous products. This will reveal any underlying dominant homogeneous PCR product that would be consistent with a monoclonal population of B cells. Of those cats determined to be monoclonal in this study, the final interpretation could be made on the basis of the evaluation of the native PCR products in 12 cats, whereas heteroduplex analysis was required for the final interpretation in three cats. This highlights the added value of examining the PCR products using heteroduplex analysis.
In this study, the use of two VH segment framework primers (FR2 and FR3), one specific JH segment primer (J2), and one degenerate JH segment primer (JD) provided the greatest sensitivity in detecting monoclonality. Six of the positive cats were detected by only a single VH segment framework primer (four by the FR2 primer alone and two by the FR3 primer alone), and the ability to detect monoclonality by the J2 and JD primers was mutually exclusive. This emphasizes the need to routinely use these four primers. Of those cats for which the J1 primer detected monoclonality, the degenerate primer, JD, was also able to detect monoclonality. The converse was not true, indicating that the J1 primer was not necessary for this assay. The JD primer alone detected monoclonality in two cats, and it is likely that the neoplastic B cells within these two cats used a rare JH segment that is not recognized by the J1 or J2 primers.
In the context of confirmed B-cell neoplasia, a false-negative result may be a reflection of one of several possible scenarios. First, it is reasonable to assume that the 24 transcripts described do not represent all of the possible VH and JH segments in the feline IGH V locus. Therefore, the primers designed may not cover the full range of segments within the feline IGH V locus, and it is possible that some of the cases involved neoplastic B cells containing a CDR3 that cannot be amplified by the primers described. Second, this assay will not work in cases in which major chromosomal abnormalities, such as translocations, inversions, or deletions, have markedly altered the sequence of the IGH V locus rearrangement. Third, somatic hypermutation following antigenic stimulation and proliferation of B cells will induce single random nucleotide changes throughout the IGH V gene. The single base pair changes have a predilection for the CDR-1 and CDR-2, as well as the framework 3 region, 19 which may affect primer annealing efficiency and subsequently reduce the sensitivity of the assay. This is a recognized cause of false-negative results in human follicular cell lymphomas and diffuse large B-cell lymphoma, many of which are regarded as postfollicular tumors. 21 All of the feline lymphomas examined in this study were classified as diffuse large B-cell lymphoma, and the neoplastic B cells may have undergone somatic hypermutation. To further investigate somatic hypermutation as a cause of false-negative results, DNA sequences were obtained from four cats in which the FR2 primer, but not the FR3 primer, was able to demonstrate monoclonality. Alignment of these sequences with feline IGH V transcripts illustrated several base pair mismatches at the annealing site for the FR3 primer. This would explain the inability to amplify the CDR3 with the FR3 primer and suggests either V family segment sequence variations or somatic hypermutation as a cause. Finally this type of assay can detect from 1 to 10% tumor cells at best, indicating that a small neoplastic population of B cells among a large normal population of B cells will not be detected by this assay. This is not expected to be a problem in this study, as only cats with a large percentage of neoplastic B lymphocytes were included.
When using the PCR to detect clonality in suspected neoplastic lymphoproliferative disease, duplicate PCR reactions for each primer set are essential to avoid false-positive pseudoclonal results. Of the cats examined in which monoclonality could not be detected, at least one primer set gave a result consistent with pseu-doclonality. In many of these cats, the PCR reactions produced one or two dominant bands that alone would be interpreted as evidence of monoclonality. However, when the amplicons from duplicate PCR reactions were run side by side in a polyacrylamide gel, differences in amplicon size and number were obvious. The amount of target B-cell DNA is crucial to avoiding pseudoclonal results, and it is determined by the number of B cells in the sample, as well as the amount and quality of DNA isolated from the FFPE tissues. This DNA is referred to as target DNA, because it is this sequence that will be amplified. To avoid pseu-doclonality, the amount of target DNA in PCR reactions is recommended to be greater than 20 ng. 8 In cats with a small amount or poor quality of tumor target DNA, or nonamplifiable tumor target DNA, background populations of normal B cells can compete in the PCR reaction for primers, leading to the amplification of multiple bands of varying size. In fact, oli-goclonal and monoclonal results are regularly encountered in small tissue fragments from normal or reactive lymphoid tissue. 23 Since the amplification of these background populations is considered a random event, duplicate PCR reactions will most likely not have amplicons of the same size when visualized using PAGE.
The effect of formalin fixation and the age of the paraffin-embedded tissues in reducing the quality of genomic DNA were also a cause of failure to detect monoclonality. Although a 100-bp fragment of the feline GAPDH gene was amplified from each cat, a 300-bp amplicon of the feline chemokine receptor CCR5 gene was not detected in six cats, which suggests that the quality of the DNA in these six cats was sufficient for amplification using the FR3 primer (size range, 130–180 bp) but not the FR2 primer (size range, 250–300). Monoclonality was not demonstrable in two of these six cats (Nos. 7 and 10), which is considered a result of poor DNA quality. The results of CDR3 amplification for these two cats were thus considered uninterpretable.
Molecular clonality determination should be preceded by routine morphologic and immunophenotypic analysis. Histologic sections will provide evidence that lymphoma is a differential diagnosis, and immunohistochemistry can provide information on the lineage of a neoplastic population of lymphocytes and the relative numbers of B cells and T cells in the specimen. Tumors with cross-lineage rearrangements of antigen receptors can confound lineage assignment. This has been reported in human cases of lymphoma and lymphoid leukemia, 21 and in our experience, similar PCR-based assays for canine lymphocytes can demonstrate evidence of monoclonality of B-cell lineage in obvious T-cell lymphomas, and vice versa. Furthermore, antigen receptor gene rearrangements have been reported in human myeloid leukemia. 2, 15 Therefore, the evaluation of tissues by PCR clonality assessment alone cannot be reliably used for the purposes of lineage assignment, even though, in many instances, cell phenotype and gene rearrangement results are concordant.
In this study, 24 feline IGH V region transcripts were cloned and characterized. Using this sequence information, we have developed a PCR-based assay that can detect B-cell clonality in FFPE feline tissues. This assay requires the use of a panel of primers in conjunction with PAGE analysis of native and denatured PCR products. The necessity of duplicate PCR reactions and of routine morphologic and immunophenotypic evaluations to avoid false-positive results has been stressed.
Future directions for the application of this assay include the development of a multiplex assay that would reduce the number of PCR reactions required and, in turn, reduce the time and cost of the assay. Further investigation of the feline IGH V locus will likely uncover less commonly used VH and JH segments, leading to refinement in primer design. In conjunction with the primers described, any additional primers, including those that amplify rearranged portions of the immunoglobulin light chain genes (IGK and IGL) or the kappa deleting element, will increase the overall sensitivity of this assay. 21 Additionally, primers designed to amplify the specific CDR3 from an individual neoplastic B-cell lymphoproliferative disease (clonotypic primers) could provide a very sensitive and specific assay to detect minimal residual disease and early relapse. Most importantly, this assay has the potential to improve the ability to diagnose feline lymphoproliferative disease, facilitating more appropriate treatment modalities and improved patient care.
Footnotes
Acknowledgements
This project was supported by a grant from the George and Phyllis Miller Feline Health Fund, Center for Companion Animal Health, School of Veterinary Medicine, University of California, Davis.