
Abstract
In veterinary medicine, point-of-care testing (POCT) techniques have become popular, since they provide immediate results and only small amounts of blood are needed. However, their accuracy is controversial. Pigs are often used for research purposes and accurate measurement of haemoglobin (Hb) is important during invasive procedures. The aim of this study was to evaluate two different Hb POCT devices in neonatal pigs. A prospective study with 57 pigs of 3–6 weeks of age, weighing 4.1–6.2 kg (median 5.1 kg) was performed. Fifty-seven blood samples were analysed for Hb using a conductivity-based and a photometrical POCT device and compared with a photometrical reference method. Statistical analysis was performed with Bland–Altman analysis, Spearman correlation and Passing–Bablok regression analysis. Hb values ranged from 32 to 108 g/L (median 80 g/L) using the reference method. The bias of the photometrical method (HemoCue®) to the reference method was −1 g/L, with limits of agreement (LOA) of −7 to 6 g/L. The conductivity-based method (i-STAT®) had a bias of −15 g/L with LOA from −24 to −6 g/L. There was a significant association between protein values and the bias of i-STAT versus CellDyn (r 2 = 0.27, P < 0.05) but not with the bias of HemoCue versus CellDyn (r 2 = 0.001, P = 0.79). The lower the protein values were, the lower the Hb values were measured by the i-STAT. The conductivity-based measurement of Hb constantly underestimated Hb values, whereas the photometrical method demonstrated a better accuracy and is therefore more reliable for on-site measurement of Hb in pigs.
Point-of-care testing (POCT) systems have been introduced into clinical practice to provide analytical results more rapidly and independently from hospital laboratory services, to allow for shorter therapeutic response intervals and to ease therapy control in the operating theatre, intensive care units or emergency departments. 1,2 An important feature of modern laboratory bedside analysers is the small amount of blood requested for determination of several laboratory parameters. Modern POCT systems have the potential to markedly reduce iatrogenic diagnostic blood loss and to reduce the need for blood transfusions. 2 Nevertheless, adequate evaluation of the device in the expected population regarding species, age and concurrent medical disease should be performed before its clinical use. 3
The HemoCue (HemoCue B-Hemoglobin, HemoCue AB, Wetzikon, Switzerland) and the i-STAT (i-STAT-1, Abbott AG, Baar, Switzerland) devices represent two modern techniques for bedside measurement of blood haemoglobin (Hb) content. Both systems have been evaluated in humans 4–10 and in various animal species 11–21 and were judged to be clinically useful. Most authors judged the analytical performance to be sufficient in both systems even if the i-STAT measurements are often measuring too low, especially if hypoproteinaemia is present.
Pigs are often used for research purposes and evaluation of Hb concentration is important especially for the calculation of haemodynamic parameters as well as during invasive procedures where blood loss and need for transfusion have to be quantified. 22 Additionally, iron deficiency and concurrent anaemia are common in neonatal pigs. 23,24 Therefore, monitoring of Hb is important for evaluation of efficiency of nutritional or parenteral iron supplementation. 25,26 Although the HemoCue 27 and the i-STAT analyser 28 have been used as decision-guiding tools for Hb in pig research, they have not yet been validated in this species. The aim of the current study was to evaluate the accuracy of the HemoCue and the i-STAT analyser for measurement of Hb in young pigs in comparison with a reference method for Hb measurement.
Materials and methods
Animals
After obtaining approval from the Cantonal Veterinary Office (No. 150/2009), 57 healthy female and male pigs from 3 to 6 weeks of age weighing 4.1–6.2 kg (median 5.1 kg) and undergoing different kinds of studies in our laboratory requiring anaesthesia were included in this investigation. Health status was assessed by history and visual examination. All pigs were housed in a conventional farm in farrowing crates of 7.5 m2 on straw with 75% of solid floor and soil for rotting. They had free access to food and water until one hour before induction of anaesthesia.
The animals were maintained in surgical anaesthesia throughout the whole study and died because of an overdose of local anaesthetics during a concurrent study investigating toxic effects thereof. If animals recovered from the overdose they were euthanized using an overdose of pentobarbital (Eskonarkon®, Streuli Pharma AG, Uznach, Switzerland) intravenously.
HemoCue
The HemoCue haemoglobinometer measures the Hb concentration from a 10 µL blood sample that is drawn by capillary action into a disposable microcuvette. 10 The erythrocytes are lysed and the free Hb is conjugated to azidemethaemoglobin 29 that is photometrically measured at 570 nm. The additional measurement at 880 nm corrects for turbidity caused by marked lipaemia or leukocytosis in the sample.
i-STAT
The i-STAT POCT consists of a portable analyser and different self-contained disposable cartridges that are available for the measurement of electrolytes, blood chemistry and blood gases. 4 The CG8+ cartridge includes measurement of Hb, as well as blood gases and electrolyte analysis. The required amount of blood is 65 µL. The cartridges have to be stored at 2–8°C and have to be passively warmed to room temperature before use. The i-STAT system measures the haematocrit (Hct) with conductimetry, calculates the Hb with the fixed equation of Hct/3 = Hb and displays this value. The conductivity of blood is dependent on electrolyte and protein concentrations. 6 The i-STAT device corrects for changes in sodium concentrations but not for abnormal protein values, as it is not able to measure protein concentration within the current system.
Reference instrument
The CellDyn 3500 (Abbott AG, Baar, Switzerland) was used as the reference instrument. It is a well-established haematology instrument, which is used worldwide in veterinary laboratories. Haemoglobin concentration is measured using a cyanide-free spectrophotometry method. Haematocrit values are computed from direct measurements of red blood cell counts and mean cell volume. The CellDyn was calibrated in the Clinical Laboratory so the haematocrit results agreed with manual PCV results for pigs. Three levels of commercially available control blood were run daily prior to analysis of patient samples. The CellDyn showed very low inter-assay imprecision. Coefficient of variation was 1.4% in level 1 (mean Hb 76 g/L), 1% in level 2 (mean Hb 123 g/L) and 3.3% in level 3 (mean Hb 158 g/L).
Experimental set-up
Anaesthesia was induced via the inhalational route using sevoflurane by face mask. During the induction period, each animal was held tightly in the arms of one examiner without prior sedation, while another held an appropriate-sized face mask to the pig's muzzle. Once the pig was unconscious, a venous access was established and the trachea intubated. The lungs were artificially ventilated using pressure-controlled ventilation. Anaesthesia was maintained with sevoflurane in oxygen and air 1:1. No neuromuscular blocking agents were used. Monitoring consisted of pulseoximetry, three-lead electrocardiograph (ECG), invasive arterial blood pressure measurement after cannulation of the carotid artery by a cut-down procedure, end-tidal gas analysis (sevoflurane, O2, CO2) and rectal temperature control.
In each pig, 3 mL of blood were withdrawn from the arterial catheter after discarding the first 5 mL. The HemoCue microcuvette and the i-STAT cartridge were filled directly with fresh whole blood and measured immediately. Care was taken that no air bubbles were present in the systems. The measurement takes less than 60 s with the HemoCue and 120 s with the i-STAT. The remaining blood was submitted to the clinical pathology laboratory in K3-ethylenediaminetetraacetic acid (EDTA) and in lithium heparinized tubes (Sarstedt AG, Sevelen, Switzerland) for photometric determination of Hb concentration and Hct measurement with the Coulter method, both performed in an automatic counter (CellDyn 3500). The total plasma protein concentration was determined by the biuret method using an automated analyser (Cobas Integra 800, Roche Diagnostics, Rotkreuz, Switzerland). The protein calibrator was prepared from human serum (c.f.a.s. calibrator, Roche). For internal quality control, two levels of a commercially available control serum were run daily prior to analysis (Precinorm U, Roche). Quarterly, external quality control was performed by analysing serum from the Quality Control Centre Switzerland. All devices underwent standard services biannually.
Part of the studies included significant blood loss including repeated blood sampling resulting in haemodilution due to volume therapy to keep the animals normovolaemic. This led to a broad range of Hb and protein values as it occurs under clinical condition in sick animals.
To perform intra-assay precision analysis two samples of porcine blood were each analysed 10 times with both POCT devices under the same condition as described above.
Statistical analysis
Hb values measured by the HemoCue and displayed by the i-STAT were compared with standard laboratory Hb measurement with Bland–Altman analysis, Spearman correlation and Passing–Bablok regression analysis. Hct values measured with the i-STAT were additionally compared with the Hct measurements of the automatic counter using the same methods.
The bias of the POCT methods to the reference method was compared with the protein content with linear regression. This was performed by comparing the difference of each pair of the relative POCT method and the reference method to the corresponding protein value.
To quantify the clinical importance of the bias, the sensitivity and specificity of the methods for the detection of anaemia (defined as Hb < 80 g/L with CellDyn 3500) were assessed. Continuous parametric variables are presented as mean (±standard deviation, SD) and non-parametric variables as median (range), respectively. Statistical significance was declared at P ≤ 0.05. Data management, statistical analysis and graphs were performed with Prism 4.0b (GraphPad Software, La Jolla, CA, USA) and Excel for Macintosh (Office X, Microsoft, Redmond, WA, USA).
Results
In total, 57 blood samples were analysed. Results of the analysis of Hb, Hct and plasma protein are presented in Table 1.
Measured haemoglobin (Hb), haematocrit (Hct) and protein values from 57 samples of porcine blood
Intra-assay precision of the two POCT was high and is presented in Table 2.
Results of intra-assay precision analysis of haemoglobin (Hb) in two samples of porcine blood
The HemoCue measured similar values to the reference method (Table 3 and Figures 1a and 2a). The i-STAT constantly measured lower Hb values (Table 3 and Figures 1b and 2b) and was not able to quantify Hb values in one sample (32 g/L CellDyn).
Results of the Bland–Altman analysis, Spearman correlation and Passing–Bablok analysis among three different measurement methods of haemoglobin (Hb) and haematocrit (Hct)
LOA: limits of agreement; CI: confidence interval
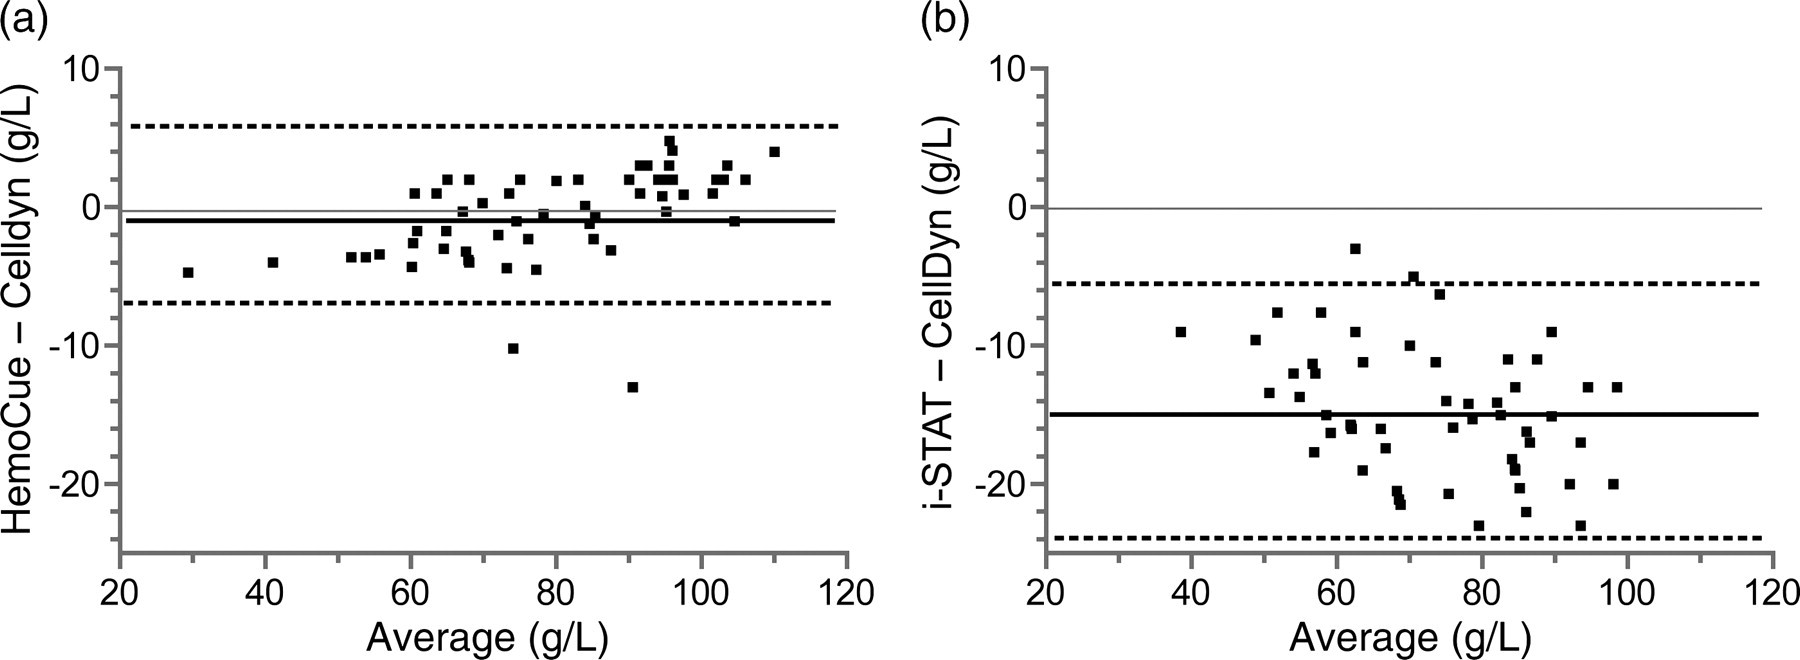
Bland–Altman bias plots for comparison of the two haemoglobin (Hb) analysing techniques with the standard Hb measurement technique (CellDyn). (a) HemoCue. (b) i-STAT. The solid line indicates bias and the dashed lines indicate ±2 standard deviations around the bias (HemoCue: n = 57; i-STAT: n = 56); overlying dots are plotted only once
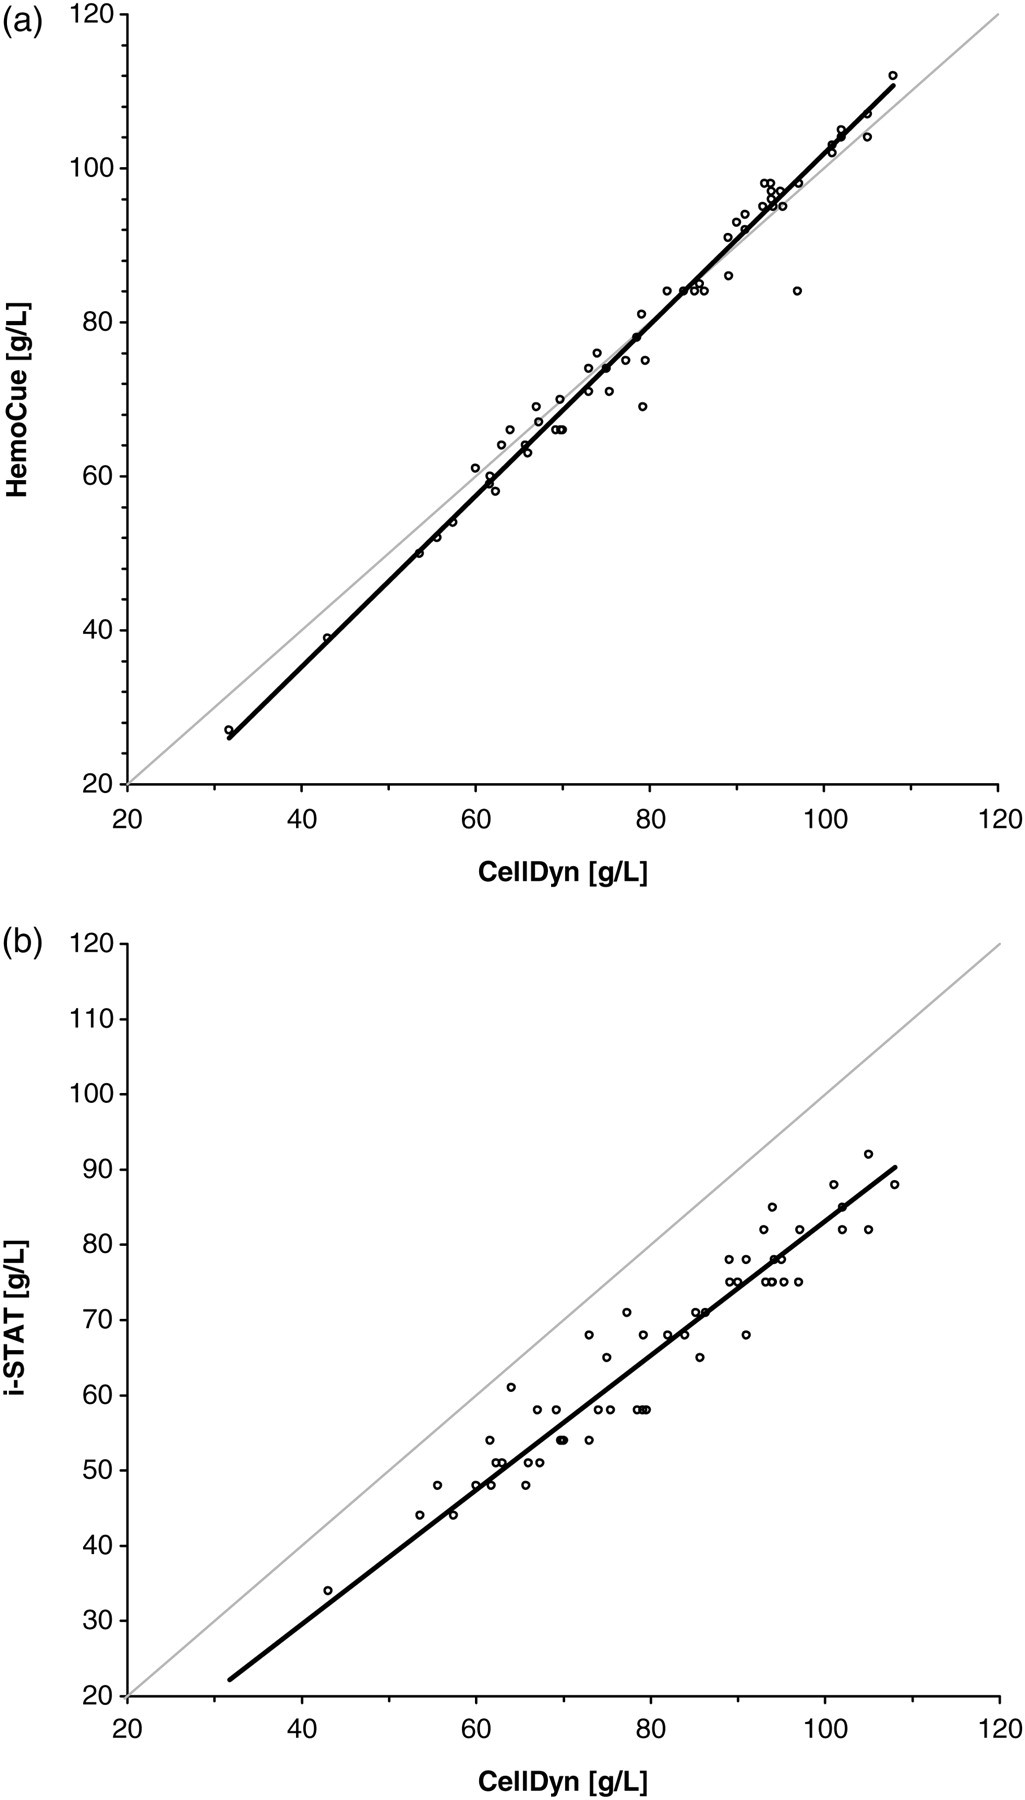
Passing–Bablok regression plot for comparison of the two haemoglobin (Hb) analysing techniques with the standard Hb measurement technique (CellDyn). (a) HemoCue (n = 57). (b) i-STAT (n = 56). The thin black line is the line of identity (y = x) and the thick black line is the line of best fit
There was a significant association between protein values and the bias of i-STAT versus CellDyn (r 2 = 0.27, P < 0.05) (Figure 3). The lower the protein values were, the lower the Hb values were measured by the i-STAT. There was no relationship between protein values and the bias of HemoCue versus CellDyn (r 2 = 0.001, P = 0.79) (Figure 3).
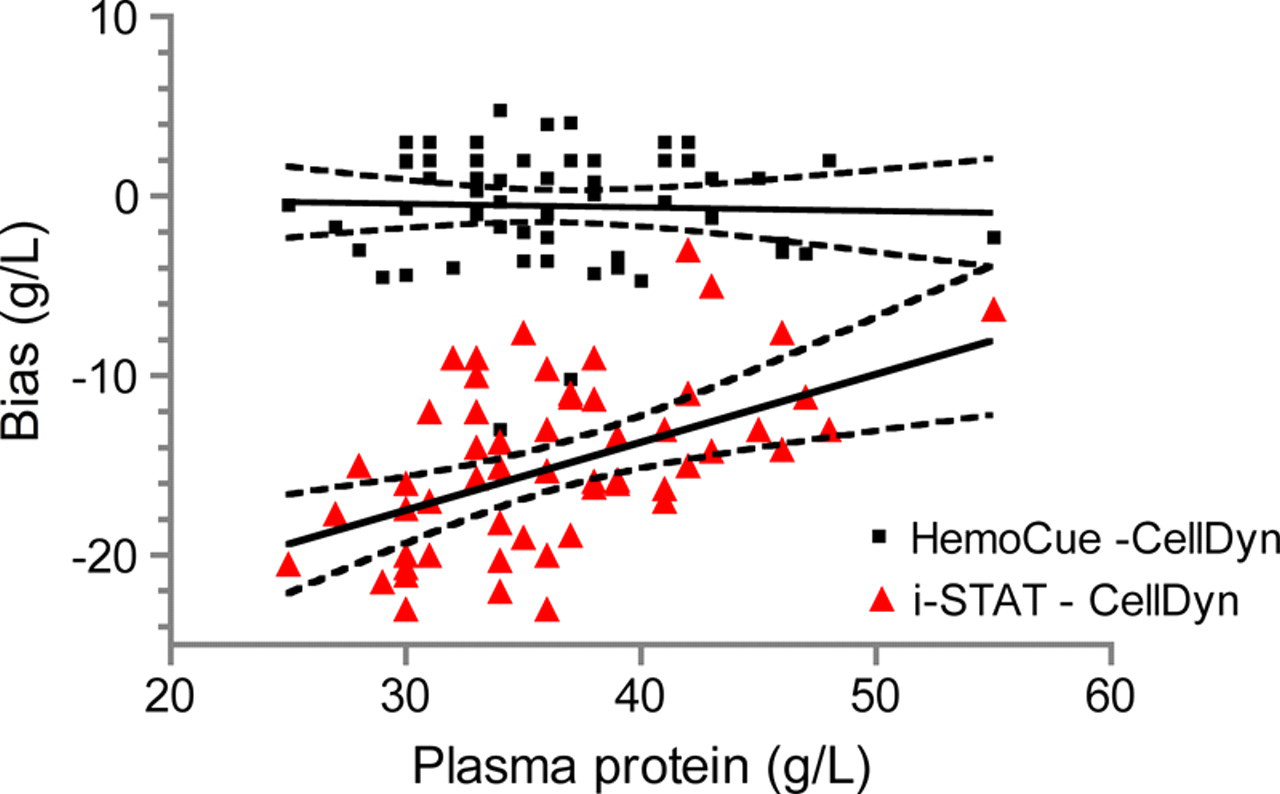
Linear regression scatter plot of the difference of HemoCue–CellDyn Hb (n = 57) and i-STAT–CellDyn Hb (n = 56) versus protein values. The thick black lines are the lines of best fit
The sensitivity of both POCT to detect anaemia (Hb < 80 g/L) was high (Table 4). The specificity of the i-STAT was low compared with the high specificity of the HemoCue.
Diagnosis of anaemia (haemoglobin <80 g/L) with three different methods in 57 samples of porcine blood
Discussion
The present study evaluated the Hb measurement of the i-STAT and the HemoCue POCT devices against a standard laboratory technique in neonatal pigs over a wide range of Hb values. Good agreement between the photometrical method (HemoCue) and the reference instrument was observed. In contrast to this, the conductivity-based method (i-STAT) underestimated Hb values, with a strong negative bias of 15 g/L. In this population, the conductimetry method did not provide adequate measurement of Hb.
Conductimetry for Hct measurement has been evaluated in human medicine in a broad range of patients, and Stott et al. 30 concluded that it provides accurate measurements for physiologically normal subjects, but not for some intensive care and surgical patients. The method becomes inaccurate when serum electrolytes and/or protein concentrations deviate from the norm, as for example in haemodilution 6,31 occurring during surgery.
Newer instruments, such as the i-STAT, are able to measure electrolytes and correct for the deviation, usually with an algorithm based on the sodium concentration. 30 However, adjusted values are still not as accurate as bedside photometry (HemoCue). 31 Hct cannot be corrected automatically for abnormal protein values (<65 g/L, >80 g/L), since plasma proteins cannot be measured with the i-STAT device. For every decrease of 10 g/L in protein concentration, the conductimetric device measures a 1–1.3 L/L lower Hct. 30,31 In cardiopulmonary bypass (CPD) patients, plasma is diluted and Hct measurements with conductimetry are underestimating the real value because of hypoproteinaemia. The i-STAT has a so-called CPD correction mode, 32 which corrects for haemodilution. This mode should not only be activated in CPD, but also in all anaesthetized patients. 22 However, the automatic CPD correction of the values may not be appropriate as hypoproteinaemia varies among individuals.
In contrast to this, the photometric HemoCue method is not affected by alterations in plasma protein and electrolyte content in humans 33 and is also an accurate measurement of neonatal Hb. 34 Also in our group of neonatal pigs this device provided accurate measurement as shown before in different animal species. 11,12,17,18 This is not surprising as the principle of measuring Hb in lysed erythrocytes applies to all species. 11 Erythrocyte size and conformation can be very variable between different species. 35 Thus, a measurement relying on conductimetry of the intact cells like the i-STAT is more susceptible to errors when used in different species. In cats, horses, mice and chickens a significant underestimation of Hct was shown to a similar extent to that found in the current study. 14,16,19–21 Only Looney et al. 16 excluded an influence of protein values as all horses included in their study had normal plasma protein values.
The conductivity of blood is greatly dependent on the volume fraction of erythrocytes. The small size of equine erythrocytes (5.5 µm) and the resulting decreased volume fraction leads to an increased conductivity of equine samples compared with canine or human blood and to decreased Hct readings. 16 Cats have a similar size of erythrocytes (5.6 µm) like horses. 35 This could explain the decreased Hb/Hct readings of the i-STAT found in this species, although this study did not exclude low protein values as another possible reason for the underestimation. 14 In mice, the Hct was also underestimated especially in anaemic mice. 20 Mice have an erythrocyte size of around 7 µm, which is slightly smaller than the size of human erythrocyte. 35 In contrast to these findings, Hct was constantly measured 4 L/L higher with the i-STAT in elephant seals than with the reference method. 15 The volume fraction of RBC is higher in elephant seals than in human beings 36 and results in decreased conductivity and therefore increased Hct values measured with the i-STAT.
Pigs have an erythrocyte size smaller but similar to humans (7 µm). If young pigs are anaemic they show a microcytosis typical for iron deficiency. This would explain in part the underestimation detected in the present study. However, the bias between the methods was correlated with the protein values. Pigs were under anaesthesia and showed a significant hypoproteinaemia, which was probably the most important factor for the measured bias between the methods. This did not affect the HemoCue measurement in this study and the bias showed no dependency on plasma protein values as reported before. 33
If protein values of measured samples were available, a correction for deviations in plasma proteins could be performed. As many pathological conditions have an influence on proteinaemia, changes cannot be excluded under clinical conditions without appropriate determination of protein levels.
In most veterinary studies, the accuracy of both monitors was judged to be clinically sufficient without adequate definition thereof. 14–16,19,21 If samples of healthy non-anaemic animals are tested, the difference of 4–5 L/L bias in Hct seems negligible, but the POCT needs to be accurate enough to diagnose pathological conditions such as anaemia or haemoconcentration. It was proposed that the limits of agreement (LOA) should lie within ±5 g/L to detect if anaemia is present or transfusion therapy is effective. 5,37 The limits of the HemoCue LOA are a bit wider than required but nevertheless are still classified as adequate accuracy. 5 However, the i-STAT bias and LOA are far from being accurate, not only in our study but also in most other veterinary studies. 14–16,19–21
Another way to define if a POCT is distinguishing pathological samples from normal ones is to calculate the sensitivity and the specificity of the method to detect anaemia. 17,38 Both devices had a very high sensitivity, but this was clouded by the specificity of only 39% of the i-STAT, with 17 false-positive samples. This could lead to many wrong conclusions and unnecessary transfusions in clinical and research practices.
None of the previous studies performed with the i-STAT in veterinary medicine tried to quantify the importance of the bias of the respective POCT monitor. 14–16,19–21 The high correlation values between the tested devices and the reference method show that the criticism of Bland and Altman 39 against correlation and regression analysis to test for accuracy of various methods is highly justified. Correlation and regression analysis measures the degree of the linear relationship, not the degree of agreement.
In our study we aimed to mimic the clinical situation and one single sample was measured once. However, loading multiple microcuvettes and averaging the results may have led to better accuracy, since variability would have been reduced. 7,9 However, the intra-assay precision performed with porcine blood showed a very good precision.
Another influence might be the use of fresh whole blood in the POCT monitors and the use of K3-EDTA anticoagulated blood in the reference methods. The use of wet heparinized samples is well known to influence scattering of the result, 5 and might have influenced our reference values that were obtained with tubes containing liquid K3-EDTA. As the laboratory samples were also only measured once from one sample, this could have led to more variability than reported for the reference method and therefore an increased standard deviation and LOA of the mean bias.
The clinical and research implications of our study results are that if i-STAT is used to measure pen-side blood values, all low readings of Hb need to be reconfirmed with a more robust method such as photometry or alternatively Hct could be controlled with the microhaematocrit method. These methods are neither sensitive to protein or electrolyte changes nor to species differences in erythrocyte size and conformation.
The conductivity-based measurement of Hb (i-STAT) constantly measured lower Hb values whereas the photometrical HemoCue demonstrated a good accuracy compared with standard laboratory assessment.