
Abstract
Laboratory rodents are usually fed ad libitum. Moderate dietary restriction decreases mortality and morbidity compared with ad libitum feeding. There are, however, problems in achieving dietary restriction. Traditional methods of restricted feeding may interfere with the diurnal rhythms of the animals and are not compatible with group-housing of rodents. We have invented a novel method, the diet board, for restricting the feed intake of laboratory rats. The use of the diet board moderately decreased weight gain of rats when compared with ad libitum-fed animals. The diet board retarded skeletal growth only minimally, whereas major differences were found in body fat depositions. Serum free fatty acid, triglyceride and cholesterol values were lower in diet-restricted rats, while the opposite was true for serum creatine kinase. There were no differences in total protein, albumin or alanine aminotransferase. Moreover, differences in interindividual variances in parameters were not detected between the groups; hence this study could not combine the diet board with reduction potential. The diet board provides mild to moderate dietary restriction for group-housed rats and is unlikely to interfere with the diurnal eating rhythm. The diet board can also be seen as a cage furniture item, dividing the open cage space and increasing the structural complexity of the environment. In conclusion, the diet board appears to possess refinement potential when compared with traditional methods of dietary restriction.
Laboratory rodents are commonly fed ad libitum (AL). The practice of AL feeding has various widely recognized drawbacks and in rodent experiments AL feeding has been considered as the least controlled factor in biomedical studies. 1 In summary, it is rather surprising that AL feeding of laboratory mice and rats seems to be the norm all over the world.
AL feeding has been associated with both higher morbidity and a shortened lifespan 1–3 compared with dietary restriction (DR). The benefits of DR are attributable to a decrease in caloric intake. 3 Here the term ‘dietary restriction’ is used to describe any method of restricting food intake leading to a decreased caloric intake compared with AL-fed animals. More specifically, DR reduces the incidence of neoplasia, 2,4,5 endocrine disturbances, 1,5 degenerative kidney changes 2,6 and other common causes of morbidity 2,6 in laboratory rodents. In addition to being healthier, the animals on DR cope better with various stressors, e.g. they make a better recovery from surgery and they exhibit reduced reactions to inflammatory agents. 1,7
The method of feeding can also affect a variety of physiological parameters in younger animals prior to changes in morbidity and mortality. DR has been shown to decrease the white blood cell count, as well as neutrophil and lymphocyte numbers, 2,8,9 whereas erythrocyte count, haematocrit and haemoglobin are reported to increase. 9,10 DR has profound effects on the fat metabolism of rodents 11 resulting in a decreased serum total and HDL cholesterol, triglycerides and lipids. 2,8,11 In addition to fat metabolism, DR also has impact on other clinical chemistry parameters. DR has been shown to decrease serum and plasma total protein, albumin and globulin, 2,9,12 although the extent of these effects depend on the method and severity of the DR regime applied.
Based on the effects of DR, there are two distinct mechanisms possibly leading to reduction, i.e. a well-established alternative method in the use of laboratory animals. 13 Since the longevity of laboratory rats has decreased considerably over the past decades, 1 improved survival of laboratory rodents on DR, compared with AL feeding, has become even more crucial than before. 1–3 If rodents are fed AL, this necessitates inclusion of large animal numbers in long-term studies to compensate for the excess mortality. This is especially true for safety evaluation studies that can last as long as 24 months in rats. If DR could be used in safety evaluation, and therefore the studies could involve considerably fewer animals, this could translate easily into fewer animals being used annually. 2
Restricted feeding can also lead to reduction via reduced interindividual variability. Extensive variations of body weight, survival and tumour incidence are well-known problems associated with AL-fed animals, 1 and body weight, as such, has a profound effect on the variability of tumour incidence. 14 DR can help in resolving these problems. 15 Furthermore, DR has been shown to reduce data variance in several parameters. 16–19 Moderate DR (75–80% of AL) has been proposed to be a powerful reduction tool. 20
One might wonder why, if the advantages of DR are so obvious, it has not been implemented in the routine care of laboratory animals. There are several obstacles to the implementation of DR. Rats should be group-housed whenever possible, 21,22 and restricting the amount of food offered to a group of rats can result in uneven access to food, depending on the animal's social status. Hence, the degree of restriction might be vastly different in different individuals living in the same cage, and this could counteract one of the desired aims, i.e. decreased variance. A device capable of controlling the individual food intake of group-housed rats has been developed (Laboratory Feeding Systems, Denmark), but for the time being it appears to be too expensive and complicated for routine use with laboratory rodents.
Another dimension to consider is the diurnal rhythm of animals. When fed AL, rats eat mostly during the dark phase in several bouts. 23 DR is often put into practice by giving individually-housed rats their daily ration of feed once a day during the light phase simply for practical reasons. The animals consume their daily ration quickly, which has a profound effect on the diurnal rhythmicity of many physiological parameters. 24,25
We have invented a method of DR, which enables the rats to be group-housed and, with a high likelihood, to maintain their normal diurnal rhythm. 26 This method is a simple device called the diet board. The diet board consists of two wooden boards into which food pellets are tightly embedded. The animals have access to food all the time, but they must gnaw the wood before reaching the pellets. By altering the dimensions of the diet board, the workload needed to gain access to the food can be adjusted to provide appropriate DR.
We hypothesize that the diet board could provide an ideal level of difficulty of obtaining food. This would result in rats eating only the amount of food they necessarily need and confer both the advantages associated with DR and reduced variation between the animals. This study was designed to characterize the weight gain and growth of group-housed DR animals on this novel system over 10 weeks and to assess whether DR would change the means and variation of a battery of physiological and clinical chemistry parameters.
Materials and methods
The study protocol was reviewed and approved by the Finnish National Ethics Committee. The practical part was conducted in the National Laboratory Animal Center (NLAC), University of Kuopio, Finland between January and April 2007.
Animals and housing
A total of 60 male barrier-bred HsdBrlHan:WIST rats (NLAC, Kuopio, Finland) were used in this study. The barrier was free of the pathogens listed in the FELASA recommendations for the health monitoring of rodent and rabbit colonies in breeding and experimental units (Appendix 3). 27 The animals entered the experiment at seven weeks of age, and were housed in groups of three in solid bottom stainless steel cages (48.5 × 28.5 × 20.0 cm) with an open wire-grid hopper (Franke Finland Ltd, Naarajärvi, Finland). All the cages were kept in one cubicle. Ambient temperature and relative humidity were at 21 ± 1°C and 55 ± 15%, respectively, and the cubicle had 15 air changes per hour. Room illumination followed a 12/12 h cycle, with lights on from 07:00 h. Tap water in polycarbonate bottles was available at all times. The diet used was Lactamin R36 (Lantmännen, Kimstad, Sweden), for availability see design below. Aspen chips (5 × 5 × 1 mm; Tapvei Ltd, Kaavi, Finland) were used as bedding; and aspen wool (Tapvei Ltd) as nesting material; both were renewed during cage change, which was undertaken twice a week.
Study design
The study employed two groups (30 rats each). One group was on AL feeding from the hopper, while the other group had restricted feeding with the diet board (DR).
Ten litters with at least six males were chosen for the study. Six males from each litter were randomly selected. These six littermates were housed together in the barrier after weaning. The rats were brought from the barrier into the conventional area at seven weeks of age. Six animals from each litter were randomly allocated into two cages of three rats; one cage equipped with the diet board (DR group) and a matching cage with a plain board with AL feeding (AL group). The DR and AL groups each consisted of 10 cages, with three siblings housed together in each cage. The cage location in the rack (4 × 5 cages) was randomized to yield equal number of both groups at each vertical level.
The animals in all cages were weighed and ear-tattooed on Friday, and allowed an acclimatization period over the weekend with AL feeding. The study started on the following Monday; the animals were weighed again and the autoclaved diet boards and plain boards (for cycle specification, see below) were introduced into the cages. Both boards were changed into new ones weekly during the Monday cage change, and the study lasted 10 weeks. The animals entered the study in three cohorts, all following the same week-day routine. The cages were changed twice a week, Monday afternoon (12:00–14:00 h) and Friday morning (09:00–11:00 h). Throughout the study, the rats were weighed twice a week on Mondays and Fridays during each cage change.
Blood samples (see below for details) were taken four times during the study, on the Mondays after two, three, four and five weeks of the experiment.
Humane endpoints
Three different age-specific humane endpoints (HEP) were established. From 7–8 weeks of age, the limit was preset to 15% loss of body weight. From 8–13 weeks of age failure to gain weight during a two-week period or a 5% loss of body weight during one week was used as HEP. Thereafter, the limit was set at 10% loss of body weight during a one-week period. Additional HEPs for all age groups were dehydration, any unexpected disease, injury or illness or any problem with dentition.
The diet board
The diet board (Figure 1) consisted of two aspen boards (35.0 × 12.2 × 2.7 cm). Two corners of each board had a rectangular portion (6.0 × 6.0 cm) removed to facilitate movement between different compartments of the cage for the rats. Each board had 20 vertical drilled holes (Ø 12.5 mm); 2–3 mm slot of the hole was visible from the side in order to provide easier access to the food for the animals. The drilled passages were loaded with food pellets and fixed on site with autoclaving (121°C, 20 min, 220 kPa, Finn-Aqua 121821 D, Steris Finn-Aqua, Tuusula, Finland). The control animals had a similar plain board, but with no drilling or food. All the boards were made from aspen presumably with the same emission profile, but with lower concentrations than the non-autoclaved aspen bedding used. 28
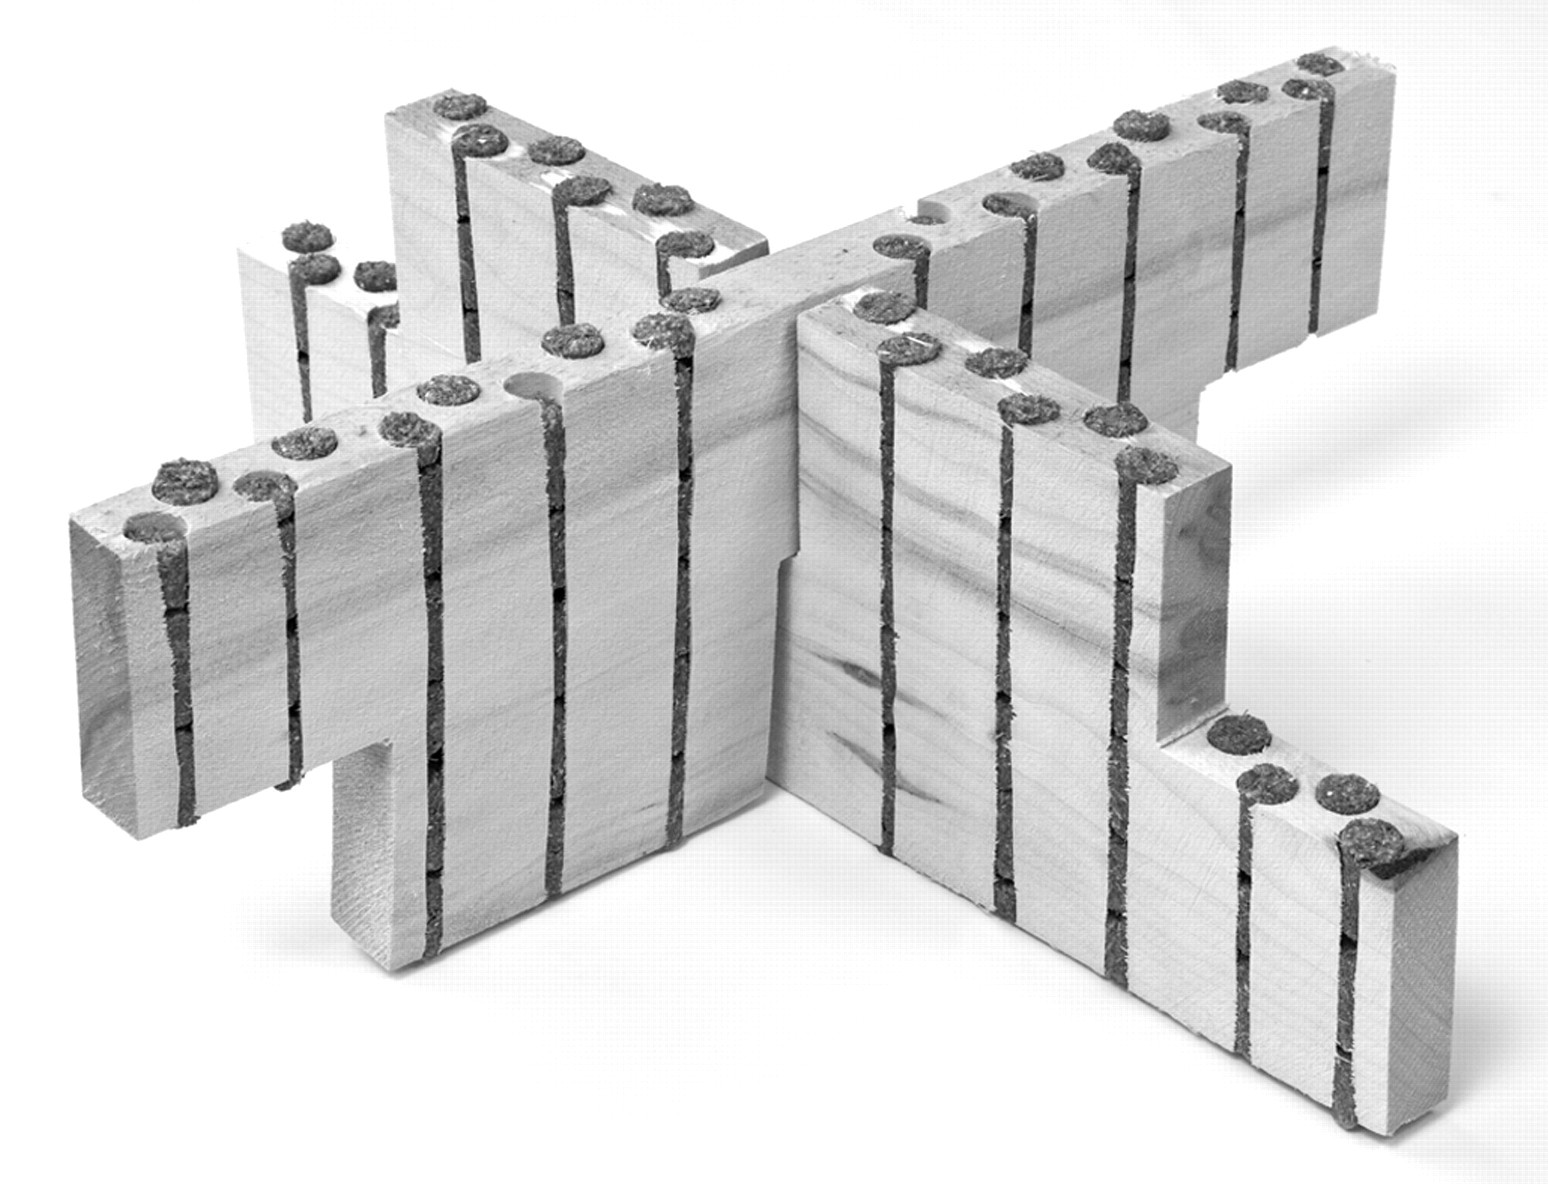
Diet board filled with food pellets
Food consumption
During the sixth study week, food consumption for the group of three rats during one week (7 days) was measured. The AL food consumption was measured by weighing the food the animals consumed from the food hopper. The DR animals' food consumption was assessed by measuring the length of empty food passages in the diet board (centimetres of eaten food pellets) at the end of the week, and converting these values into grams of autoclaved food. Both of these measures can be considered as estimates of food eaten and spillage combined.
Blood sampling
Blood samples were taken four times during the study, on the Mondays after two, three, four and five weeks of the experiment. The samples were taken from vena saphena by piercing a hole into the vein with a 25G needle. 29 The blood dripping from the vein was collected into a test tube. Sample sizes were a maximum of 0.5 mL. The blood was allowed to coagulate in the plastic tube for 10–15 min, and the samples were then centrifuged at 12,000 rpm for 15 min at room temperature (Eppendorf centrifuge 5412; Eppendorf, Germany). The serum was removed, placed into plastic tubes and frozen immediately at −20°C.
At the end of week 10, a terminal blood sample was taken. The animals were anaesthetized with a mixture of O2 and CO2 (1:1). Blood was drawn directly from the heart with an 18G needle into a plastic syringe, and immediately emptied into a plastic tube. The blood was allowed to coagulate at room temperature for 10–15 min, and the samples were then centrifuged at 3600 rpm for 15 min at 4°C (Megafuge 1.0R, Heraeus instruments, Düsseldorf, Germany). The resulting serum was divided into several plastic tubes. The tubes were cooled on dry ice and stored at −80°C.
Euthanasia and postmortem examination
After the collection of the terminal blood sample, the animals were euthanized with 100% CO2. Both adrenals were carefully dissected, weighed and immediately frozen in liquid nitrogen. The gonadal fat surrounding the testicles was dissected and weighed. The right tibia was dissected and the shaft length was measured from the cranial intercondylar area to the medial malleolus with a Vernier calliper (Central Tools Inc, Cranston, RI, USA). The stomach was cut open and observed visually for ulcers. Other abdominal and thoracic organs were assessed visually for macroscopic changes.
Serum biochemistry
Kinetic methods according to the International Federation of Clinical Chemistry and Laboratory Medicine (IFCC) (37°C) were used for serum alanine transferase (ALT) 30 and creatine kinase (CK) 31 analyses. The colorimetric bromocresol purple method was used for albumin (ALB) 32 and the Biuret method for total protein (PROT) 33 analyses. Total cholesterol (CHOL) 34 and triglycerides (TRIGLY) 35 were measured by enzymatic colorimetric methods. Serum free fatty acids (FFA) were analysed using an enzymatic colorimetric method (Wako NEFA C ACS-ACOD Method, code 994-75409E, Wako Chemicals GmbH, Germany). A Konelab 60i Clinical Chemistry Analyzer (Thermo Electron Co, Vantaa, Finland) was used for all analyses with reagents from Thermo Electron Co (Vantaa, Finland).
Data processing and statistical analyses
The appropriate size of the experiment was estimated using Resource equation method; 36 degrees of freedom for error was 17. We did not perform a pretest power analysis, because of the exploratory nature of this study. The purpose of this study was to broadly characterize the novel method and to report any possible effects it had on the rats' growth and clinical chemistry results.
The data were analysed by linear mixed models using all the gathered data. Log-transformations on the variables were employed when deemed necessary. A random litter effect was included in the models in order to accommodate for the possibility of correlated outcomes among siblings. Repeated measurements models with suitable chosen covariance structures were used for outcome variables, which were measured at multiple times. Growth rates were estimated by multilevel growth models involving litter- and rat-specific intercepts, linear and quadratic terms. The period of the introduction of feeding appeared to influence the growth profiles and was therefore omitted from the estimation of the growth curves. The equality of variances was investigated using likelihood ratio tests aimed at determining whether the groups needed separate parameters for their residual variance terms.
The statistical software package used to process and analyse the data was SPSS 14.0 for Windows (SPSS Inc, Chicago, IL, USA) and SAS version 9 for Windows (SAS Institute Inc, Cary, NC, USA).
Results
Weight gain and growth
The DR group maintained a lower body weight compared with the AL group during the 10 weeks of study. The group weights at the beginning were nearly identical: 118 ± 20 g (mean ± SD) for the DR group and 119 ± 21 g for the AL group. During the first week, the DR group did not gain weight and the shape of the growth curves were significantly different; by the end of the first week the weight difference had increased to 34 g (95% CI: [28, 40], P < 0.0001) (Figure 2).
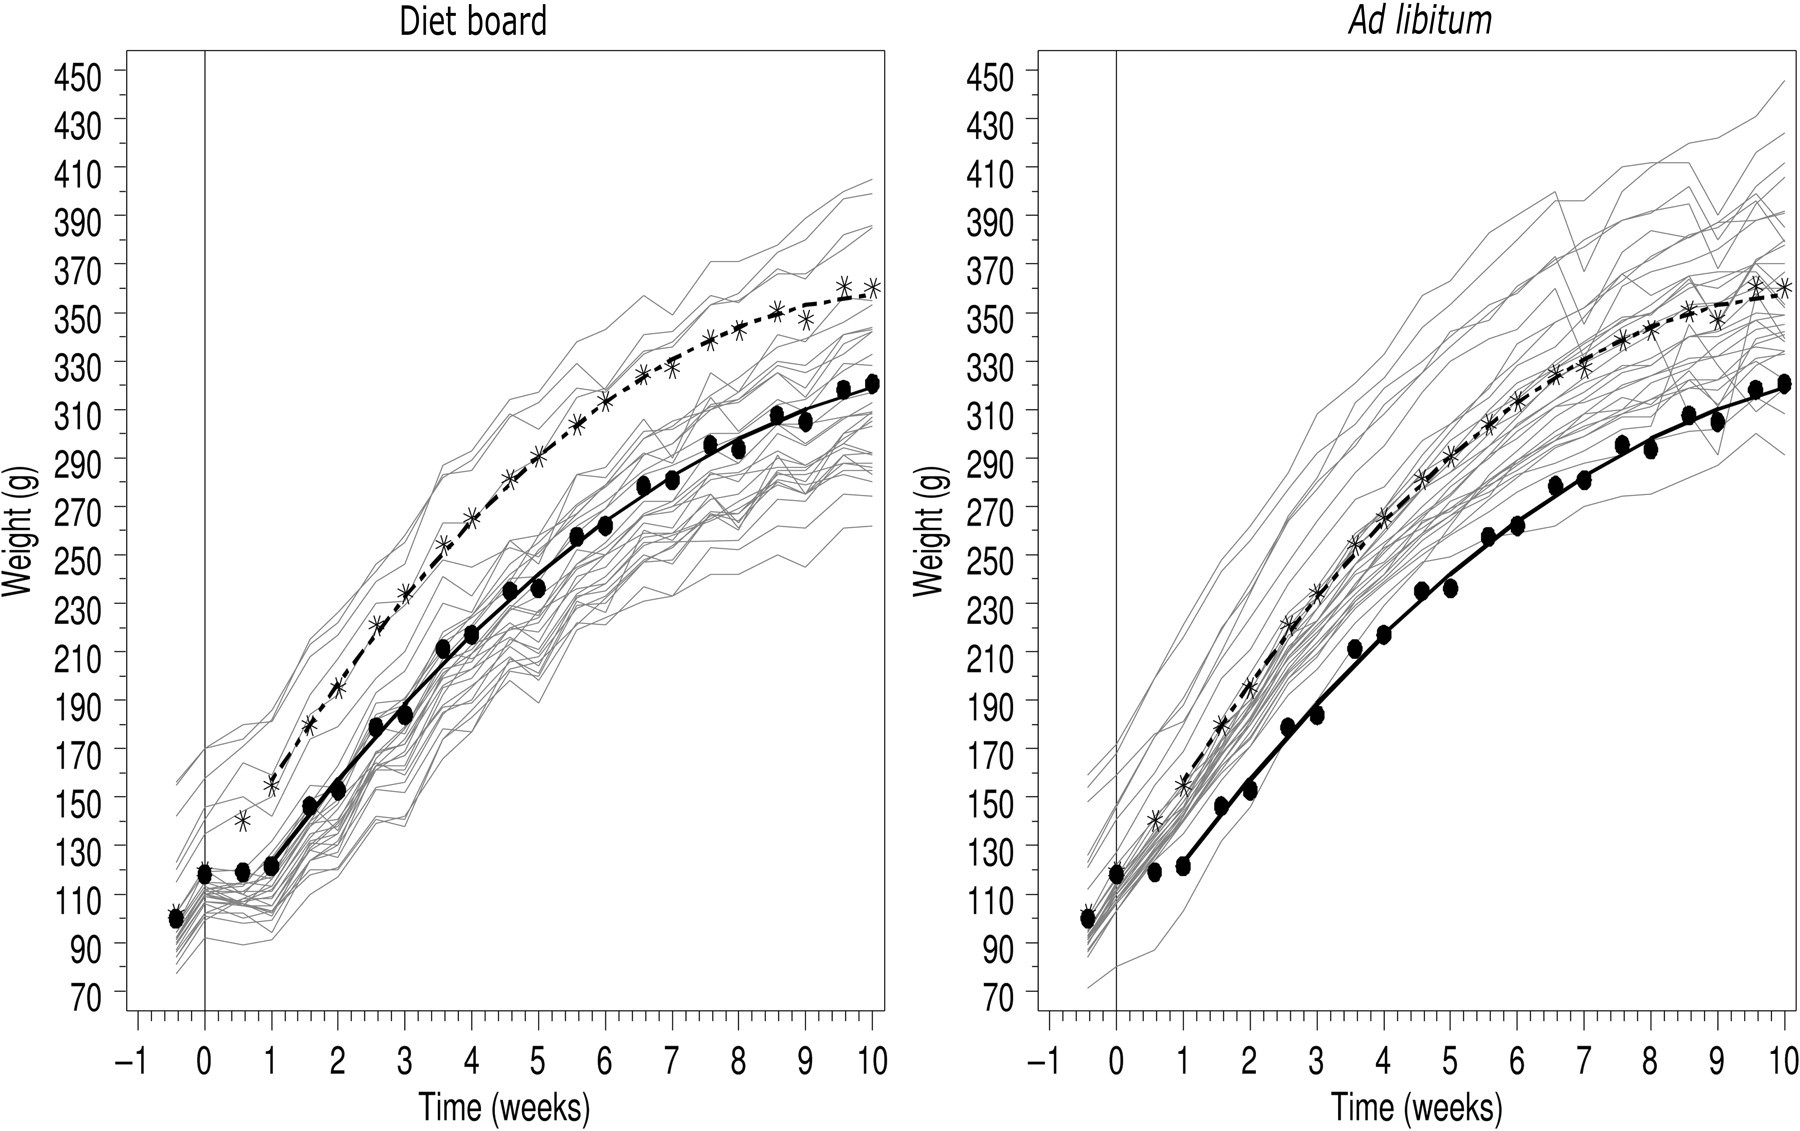
Growth of rats with the diet board (n = 30) and ad libitum (n = 30) feeding. In both figures, the dots (-•-) represent the diet board and the stars (-*-) the ad libitum group mean weights. The multiple grey lines show the growth curves of individual rats. In the left hand figure, the grey lines are the diet board rats and in the right hand figure, the grey lines are the ad libitum rats. The vertical line illustrates the beginning of the experiment
After this initial retarded weight gain, both growth curves exhibited the same slope. The DR group gained weight at the same rate as the AL group but did not catch up with the AL group in absolute weight. The difference in body weight between the two groups was significant (P < 0.0001) from the end of the first week for the remainder of the experiment. At the end of the 10-week experiment, the weights were 321 ± 38 g for the DR group and 360 ± 35 g for the AL group. The model-based estimate for the difference of the means was 38 g (95% CI: [25, 62], P < 0.0001). There is a weekly undulation in the growth curves; the weight gain appears faster from Monday to Friday than from Friday to Monday (Figure 2).
The one-week food consumption of the animals was measured during the sixth week of the experiment. The mean weekly food consumption per cage was 384 ± 40 g in the DR cages and 449 ± 31 g in the AL cages. On average, a DR rat consumed 128 g (18 g per day), while an AL rat consumed 150 g (21 g per day) of food during the sixth week of the experiment. However, during the sixth week, the mean weight gain per week was approximately 26 g in DR rats and 23 g in AL rats.
The weight of gonadal fat, postmortem, was 4.47 ± 0.90 g in DR rats and 5.66 ± 1.06 g in AL rats (model-based difference −1.12 g (95% CI: [−1.62, −0.77], P < 0.0001) (Figure 3a, Table 1).
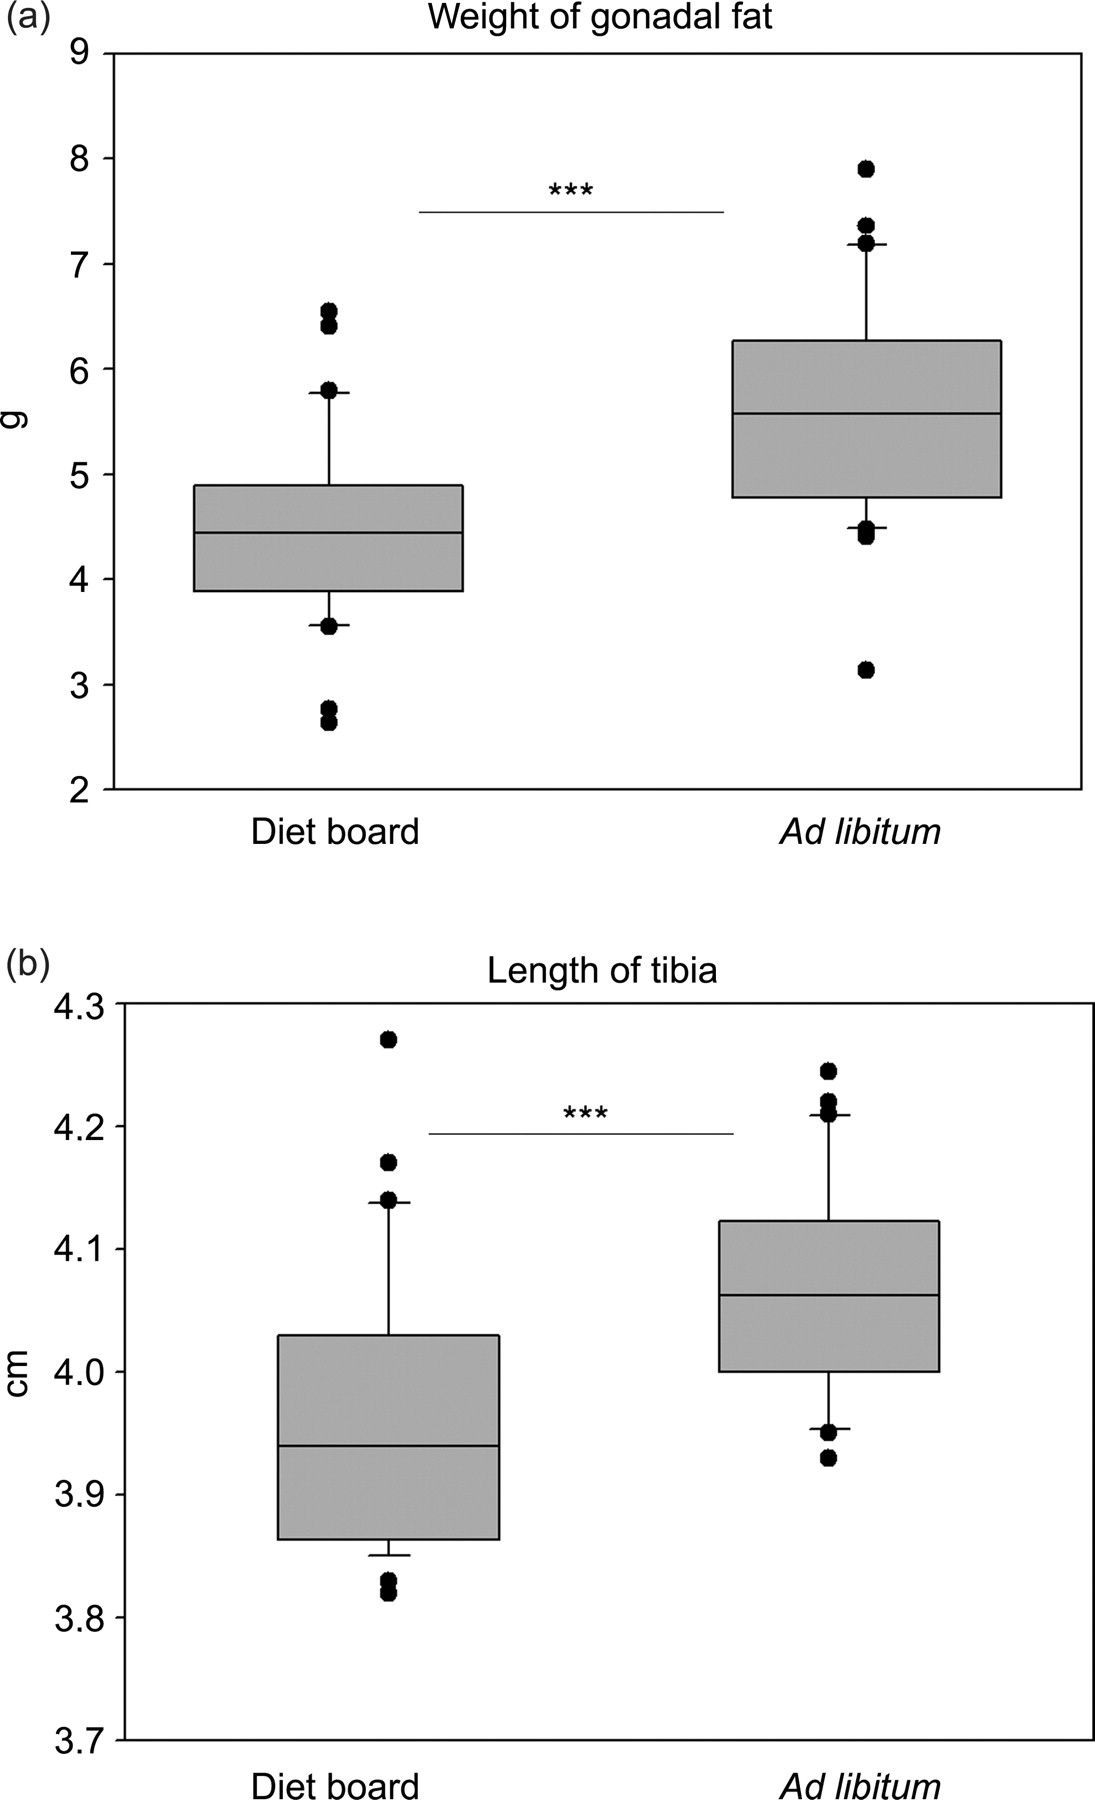
Box plots of the weight of the gonadal fat and the length of the tibia measured at the end of the 10-week diet restriction experiment. The asterisks indicate statistical significance of the difference between the diet board (n = 30) and the ad libitum (n = 30) groups (***P < 0.001)
Physiological values and distributions
FFA: free fatty acids, ALT: alanine transferase, SD: standard deviation
The tibial length was also measured postmortem. The mean length was 3.97 ± 0.11 cm in the DR rats and 4.07 ± 0.09 cm in AL rats (model-based difference −0.11 cm (95% CI: [−0.14, −0.07]), P < 0.0001) (Figure 3b, Table 1).
Serum FFA, TRIGLY and CK during the study and at termination
FFA concentration of blood serum was analysed at experimental weeks 2, 3, 4 and 5 (Figure 6a) and at the end of the experiment on week 10 (Figure 4a). During the experiment (weeks 2–5), no difference was found between the two groups (P > 0.05). On week 10, the mean FFA concentration in DR rats was 0.29 ± 0.15 mmol/L and in AL rats 0.44 ± 0.18 mmol/L (model-based difference −0.15 mmol/L (95% CI: [−0.23, −0.07]), P = 0.0005) (Figure 4a).
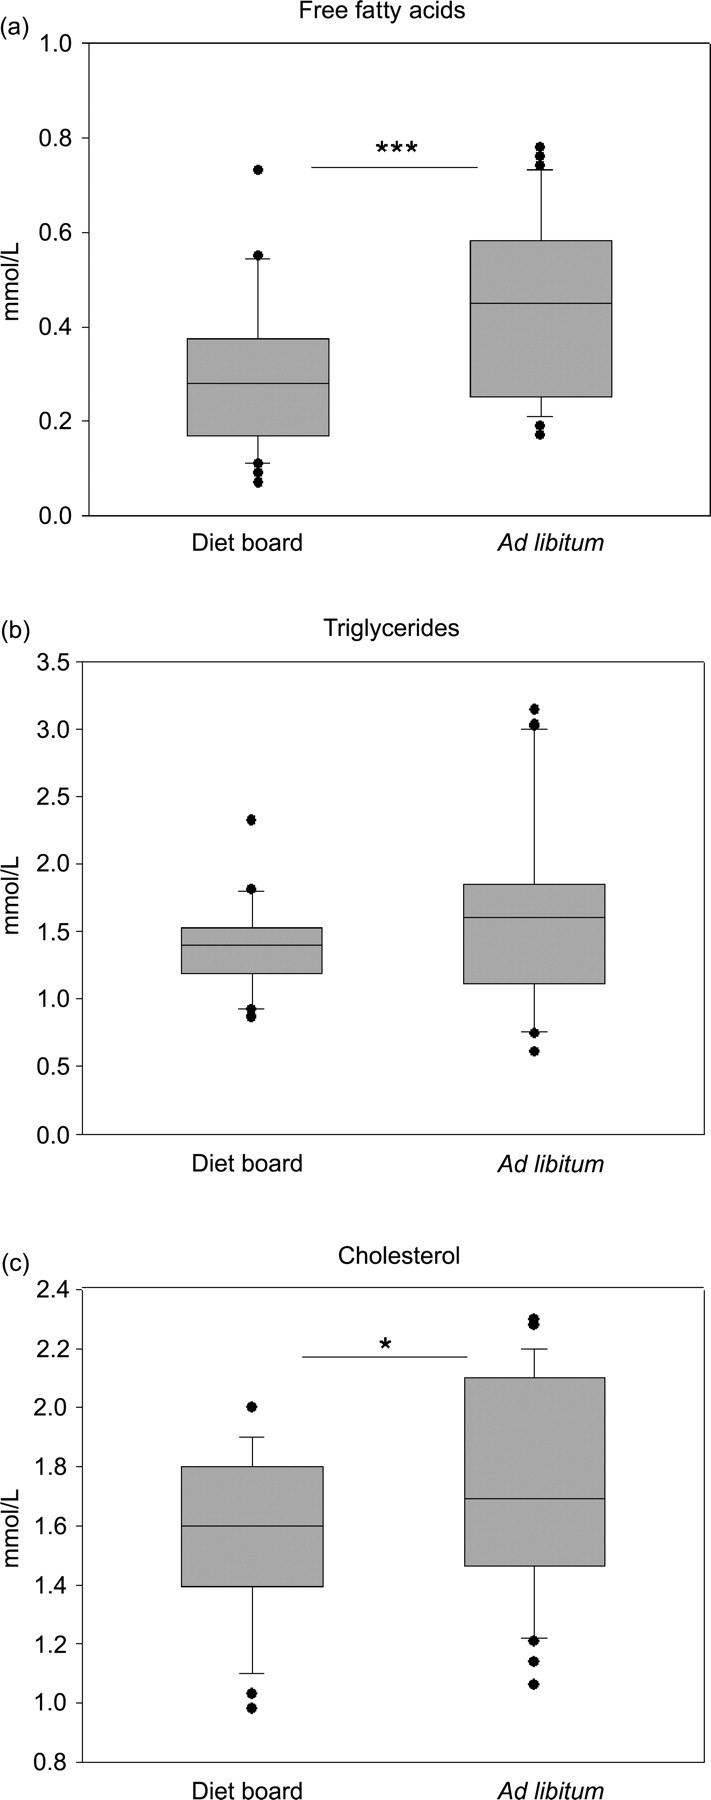
Box plots of the lipid metabolism-associated parameters at the end of the 10-week diet restriction experiment. The asterisks indicate statistical significance of the difference between the diet board (n = 30) and the ad libitum (n = 30) groups (*P < 0.05, ***P < 0.001)
Serum TRIGLY was also analysed at the same time points as the FFA concentration (Figures 4b and 6b). The values were log-transformed before the statistical analyses as the distribution was not normal. The interaction between time and treatment was not significant (P > 0.05) in the repeated measures from 2–5 weeks. On average, the AL and DR groups differed significantly from week 2 to week 5. With the DR rats displaying lower values of TRIGLY, i.e. the average ratio of the geometric means was 0.77 (95% CI: [0.68, 0.87], P < 0.0001). However, at the end of the experiment on week 10, no differences were detected (P > 0.05).
CK level of blood serum was analysed at experimental weeks 2, 3, 4 and 5 (Figure 6c) and at the end of the experiment on week 10 (Figure 5a). The values were log-transformed before the statistical analyses since the distribution was not normal. The interaction between time and treatment was not significant (P > 0.05) in the repeated measures from 2–5 weeks. On average, the AL and DR groups differed significantly from weeks 2 to 5. The DR rats had higher levels of CK. The average ratio of the geometric means was 1.28 (95% CI: [1.03, 1.61], P < 0.03). At the end of the experiment on week 10, no differences were found any longer (P > 0.05).
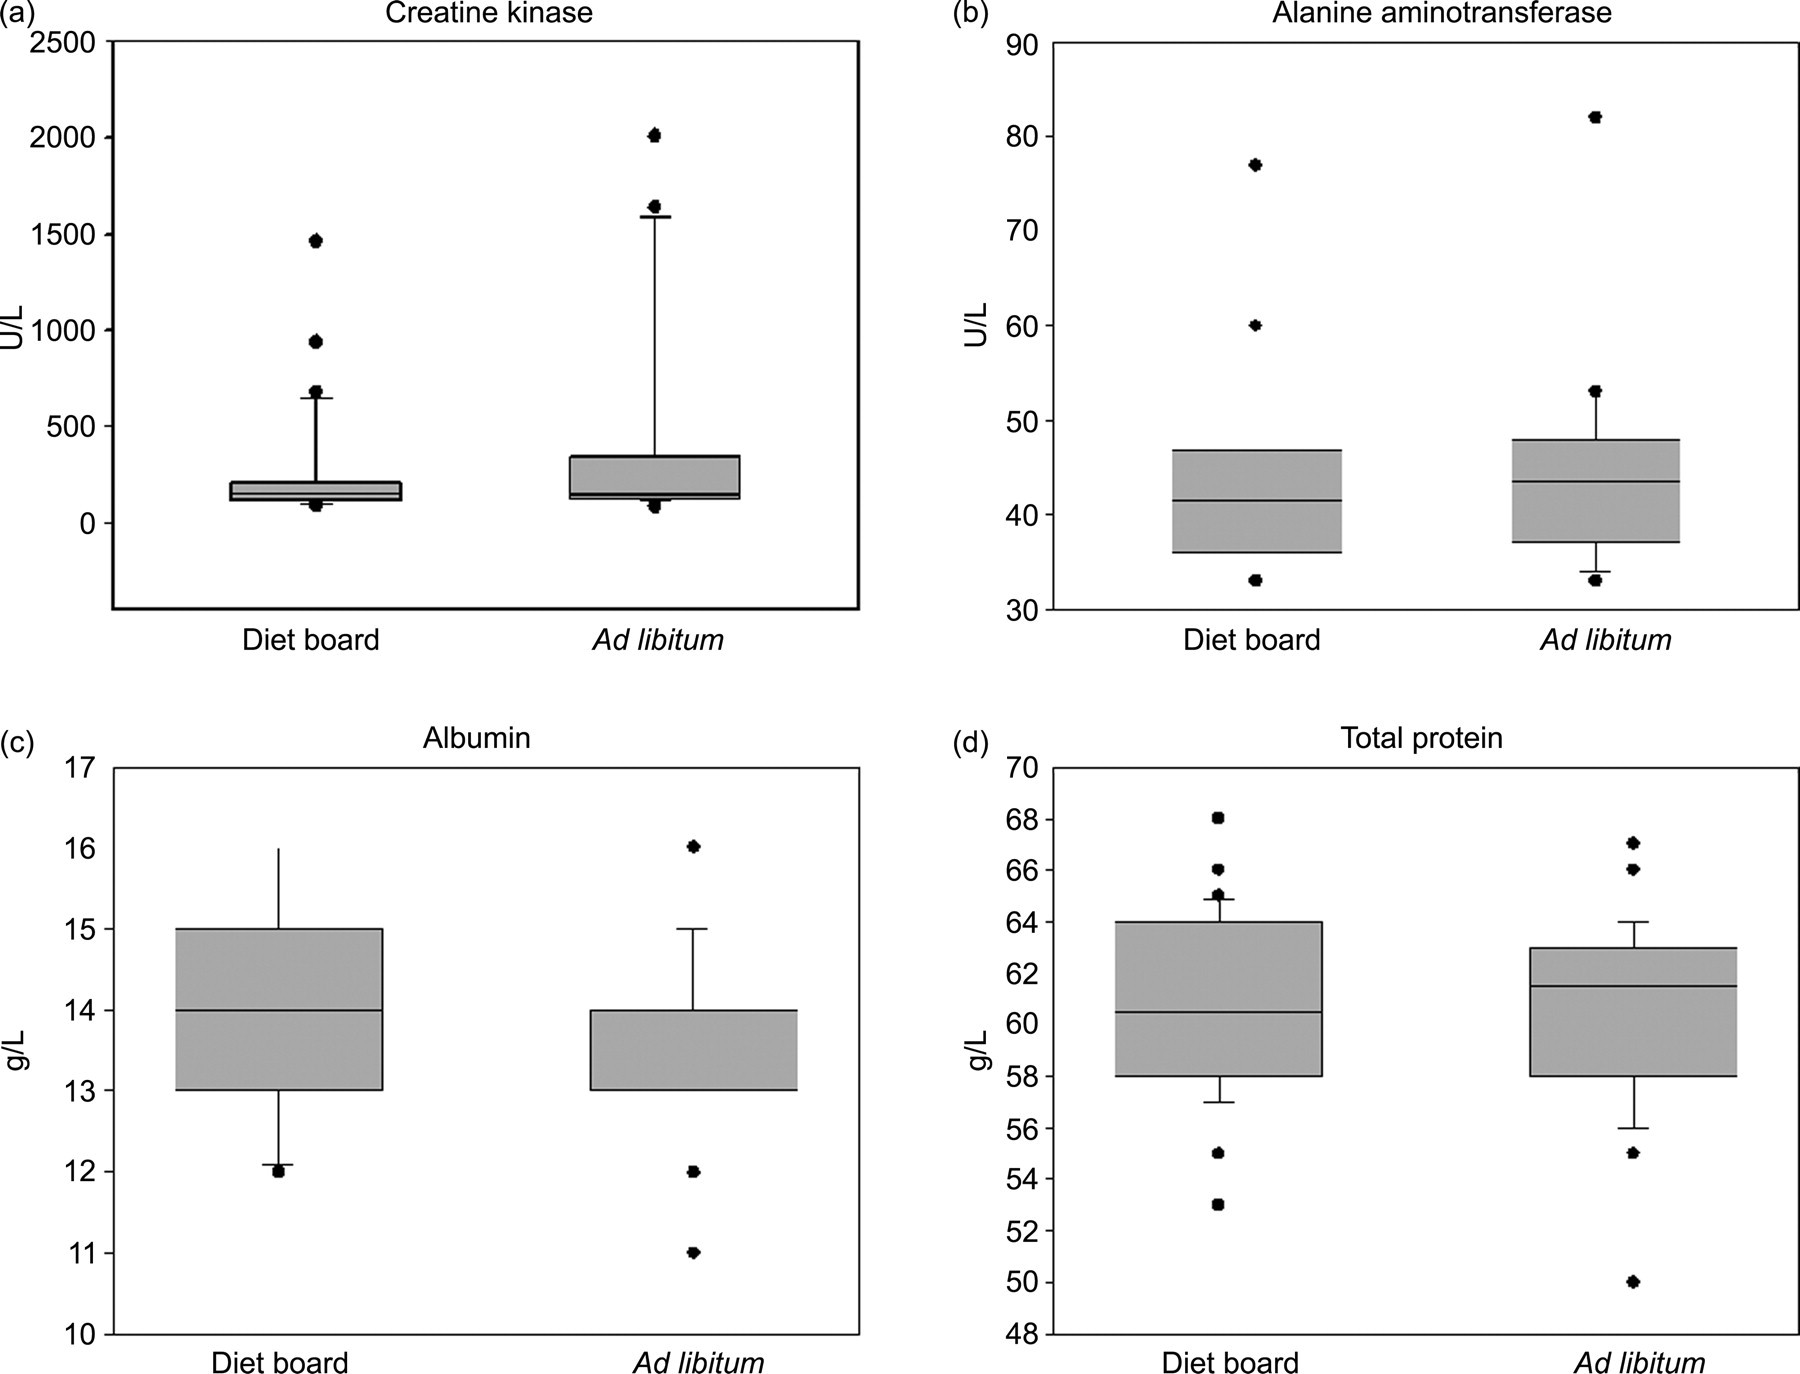
Box plots of the clinical chemistry values at the end of the 10-week diet restriction experiment. No differences between the two groups were found in these parameters
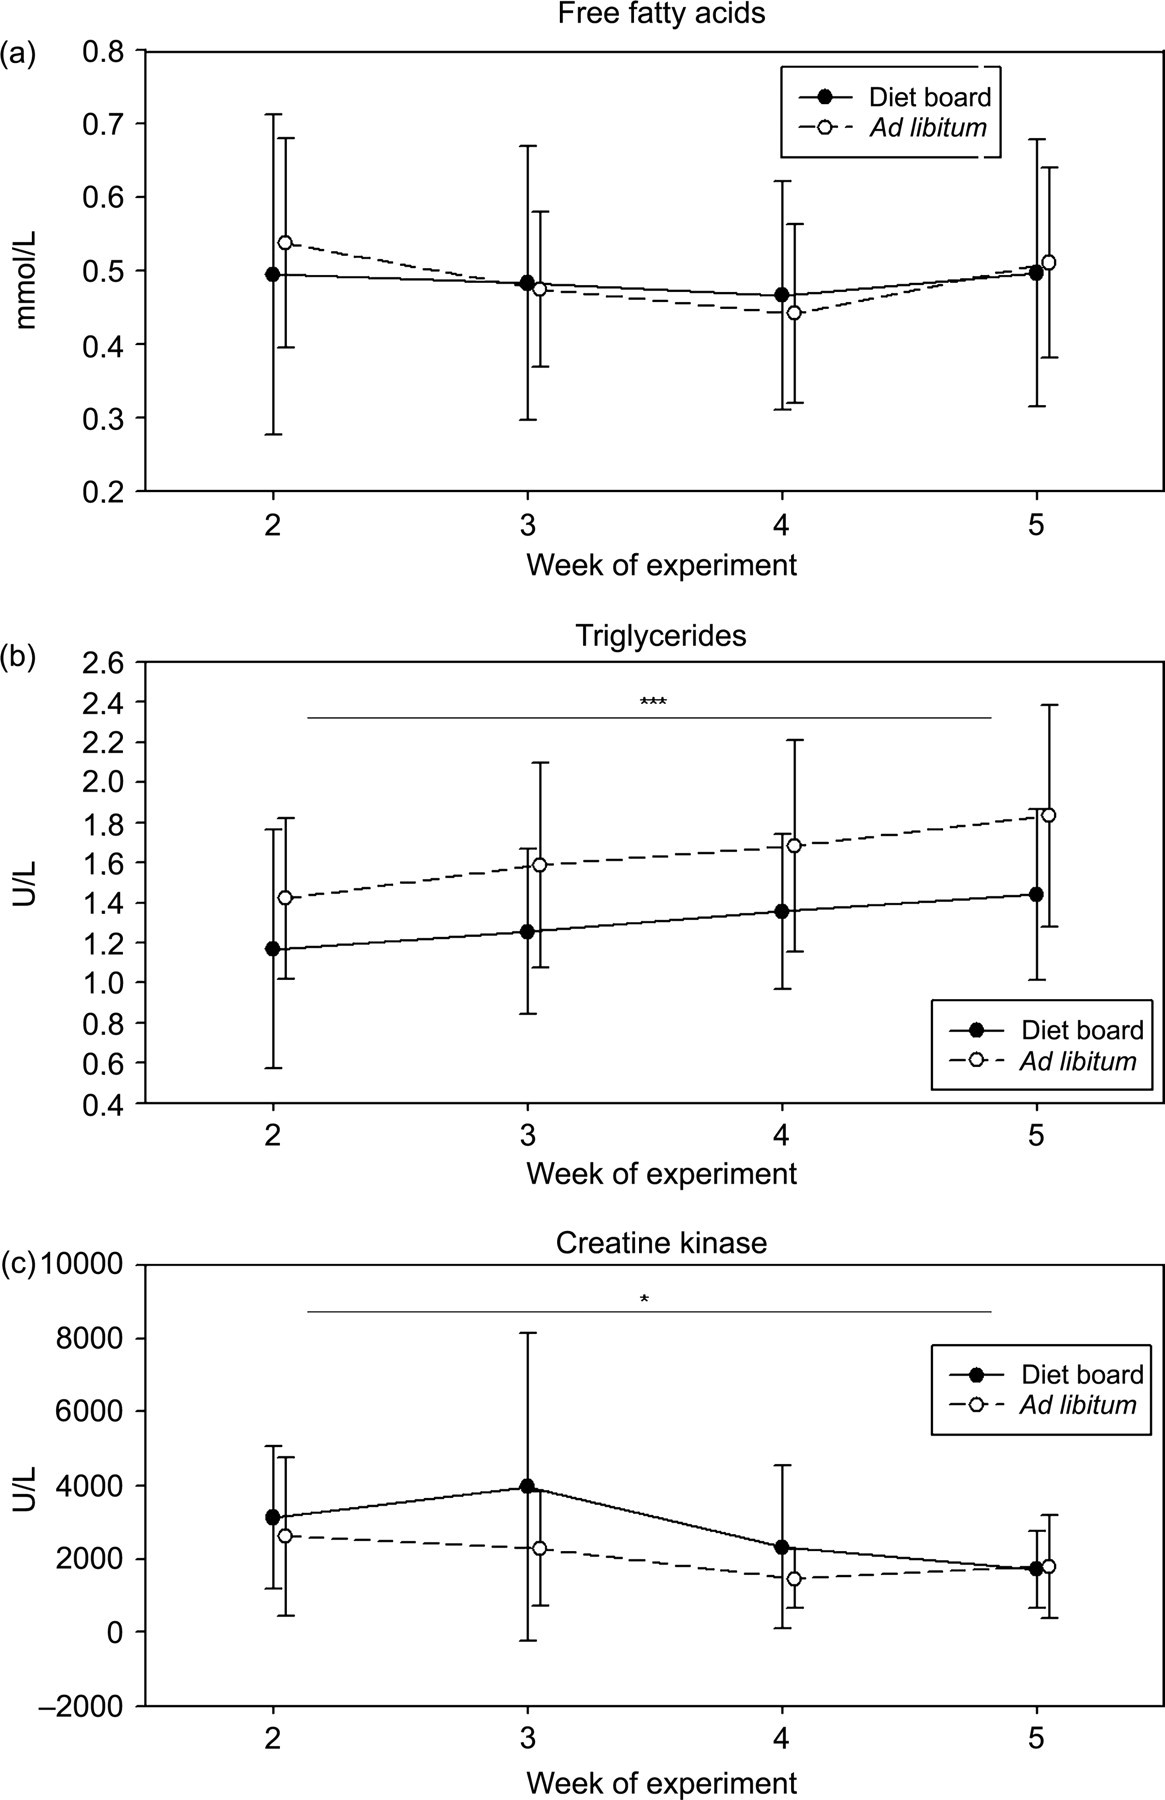
Free fatty acids, triglycerides and creatine kinase were measured four times during the study on weeks 2, 3, 4 and 5. The results are shown as mean ± SD. The asterisks indicate the statistical significance of the average differences between the diet board (n = 30) and the ad libitum (n = 30) groups with the repeated measures (*P < 0.05, ***P < 0.001)
Serum ALT, ALB, PROT, CHOL at termination
The serum values of ALT, ALB, PROT and CHOL were analysed at the end of the experiment on week 10 (Figures 4c and 5, Table 1). The mean concentration of CHOL was 1.55 ± 0.29 mmol/L in DR rats and 1.73 ± 0.35 mmol/L in AL rats (model-based difference −0.17 mmol/L [95% CI: (−0.32, −0.03), P = 0.02]). No differences (P > 0.05) were found in the values of ALT, ALB and PROT between the groups.
Result variation
The equality of variances were investigated from the following parameters: FFA, TRIGLY and CK on week 5; all clinical chemistry measurements (FFA, TRIGLY, CK, ALT, ALB, PROT and CHOL), tibial length and gonadal fat at the end of week 10 and body weights on weeks 2 and 10. No differences (P > 0.05) were found between the DR and AL groups in the variances of any of the parameters.
Discussion
Due to its simplicity, the diet board seems to represent a feasible method of restricting the weight gain of group-housed rats. The difference in absolute weight between DR and AL animals developed during the first week, thereafter the weight curves showed the same slopes with the same gap throughout the 10-week experiment (Figure 2). Even though the first week had a profound effect on the weight gain of the rats, none of the rats triggered the pre-established HEPs. The age-specific HEPs were decided according to observations from pilot studies and growth curves of AL-fed Wistar male rats bred in the NLAC barrier. Initially the animals were allowed to stop gaining weight for a few days while becoming accustomed to the diet board. From 8–13 weeks of age, the animals were expected to grow and after 13 weeks only to maintain their body weight. Although in this study, the DR animals never caught up with the AL animals, longer studies will be necessary to verify whether the animals on diet board maintain a lower body weight than AL rats beyond 10 weeks.
This study utilized males of an outbred Wistar stock, simply because they are the most commonly used laboratory rats in our facility. The use of locally bred animals made it possible to control the feeding, handling and grouping of the rats prior to the study. Excessive weight gain is a typical complaint when using outbred rats in long-term studies. Moreover, Wistar stocks have become the most common rats used in the European pharmaceutical industry during the last 10 years (Haasio K, personal communication), thus making the Wistar stock a relevant model.
The control group was fed with AL. We did not include a control group with traditional DR (one meal per day, singly housed) for several reasons. The diet board is introduced as an alternative to routine AL feeding, not as a method for use in studies requiring high levels of dietary control. The purpose of this study was to evaluate how the diet board affects laboratory rats as experimental animals and research models. The diet board rats were compared with the ‘standard laboratory rat’, i.e. a young male rat fed AL. One of the diet board's distinguishing advantages is the possibility of group-housing the animals. Traditional DR cannot be executed in group-housed rats. We wanted to have a control group with the same environment, cage furniture and group size, the only difference being the feeding method. This allowed us to concentrate on the effects of the diet board feeding itself.
No collateral problems attributable to the diet board or group-housing of the animals with this device were observed. For example, there was no fighting for food; instead the animals were frequently seen eating simultaneously with their cage-mates but at different parts of the diet board. There was no evidence of any fight wounds or other lesions in the animals. Furthermore, the absence of variance difference in the body weights suggests that the DR animals were growing as evenly as the AL animals (Figure 2).
At the end of this experiment, the AL rat's body weight was on average 15% higher than the DR rat's body weight. This difference is likely to be mostly due to differences in the amount of body fat rather than to any differences in skeletal body size. The weight of the gonadal fat has been shown to correlate directly with the total amount of body fat in mice; 37,38 the AL rats of this study had approximately 30% more gonadal fat compared with the DR animals. Although the AL animals had a statistically significantly longer tibia than the DR animals, the actual difference was a mere 3%. In other words, the diet board seems to decrease the skeletal growth only minimally, whereas gross differences are found in body fat deposits.
The decision of when to start diet board feeding was based on several pilot studies. Rats younger than seven weeks of age lost more than 15% of their body weight during the first week. In some of the pilot studies we tried to ease the beginning of diet board feeding by providing simultaneous access to both the diet board and AL feeding from the hopper for one week before starting to feed the animals exclusively from the diet board. This failed because animals did not use the diet board at all when food was available in the hopper. This is in contradiction to the observed phenomenon of contrafreeloading, i.e. preferring to work for food even when food is freely available. 39,40 Consequently, the first week of feeding exclusively from the diet board was just as difficult for the animals with or without a prior habituation period.
A weekly undulation can be seen in the growth curves of DR animals (Figure 2). The animals gain weight during first half of the week with the new diet board, but only maintain their weight during the second half. The diet boards were changed once a week, and thus during the latter part of the week the diet board was ‘wearing out’. The food was always available from the diet board, but it seems that the animals consumed the pellet passages from top to bottom, and the pellets at the bottom seem to be less accessible for consumption. After this study, we carried out a small pilot study in order to solve the undulation in the growth curves. The diet board was flipped upside down after a half week in use during the routine cage change. This simple procedure made the bottom of the diet board more accessible during the latter half of the week, and resolved the problem (data not shown).
During one weekend of the experiment, most of the AL animals rapidly lost about 5% of their body weight though they quickly regained the lost weight during the next week (Figure 2). The animals entered the study in three cohorts, so they were at different stages of the study during any given calendar day. No explanation was found for this occurrence, though a simple weighing error was ruled out. In the DR animals, the growth curves are not remarkable during this particular weekend. This may suggest that the food intake and body weight of DR animals are less dependent on environmental disturbances.
DR has been shown to change the means of a variety of research results. In these published studies, the rodents were commonly fed one meal a day during the daytime. The diet board differs essentially from the reported methods of DR; there are no periods without access to food, which could disrupt the normal diurnal eating rhythm. 26 Some of the effects of DR reported in literature could also reflect endocrinological changes due to the abnormal eating schedule. 7,41,42 In summary, the diet board offers a possibility to observe the effects of DR on research results without the confounding factor of an altered endocrinological status due to abnormal diurnal rhythms.
The clinical chemistry parameters were chosen arbitrarily to represent parameters which could be affected by the diet board. The whole set of clinical chemistry parameters were first analysed from the terminal blood samples. The blood samples taken during the study were smaller, thus not allowing each of the seven parameters to be analysed from them. The results of the terminal blood samples were checked and then the three parameters (FFA, TRIGLY and CK) which were thought to be most interesting of the seven were analysed from the samples taken at weeks 2–5. In this study significant differences were found in the parameters associated with fat metabolism (FFA, TRIGLY, CHOL), with the DR group having lower values in the time points where differences were observed (Figures 4 and 6, Table 1). This is in agreement with the observations from traditional methods of DR. 2,8,11,12
DR has been shown to decrease the blood serum concentration of ALB and PROT. 2,9,12 However, here no differences were noted in the levels of ALB and PROT between the DR and AL groups (Figures 5c and d, Table 1). It may well be that these kinds of changes are manifested only in more severe forms of DR.
CK was slightly elevated in DR rats during the study (Figure 6c, Table 1). CK is involved in cellular energy metabolism, in ATP-providing and ATP-consuming processes. CK levels have been observed to be elevated in various situations; such as muscle damage, physical exertion and kidney failure. 43 The difference in CK levels during the period of rapid growth suggests that the diet board has some effect on the energy metabolism in rats, but the mechanism behind this observation remains unclear. Somewhat contrary to our observation, DR has been shown to reduce skeletal muscle mitochondrial respiration. 44–46 However, in these studies DR has been far more severe than that provided in our study. The diet board also differs from traditional methods of restricting feeding by requiring physical activity–gnawing–to obtain the food, however the level of physical activity in DR rats compared with AL rats was not assessed. A third possible explanation for the higher levels of CK would be a catabolic state in the DR rats due to a negative energy balance. Nevertheless, this does not seem likely, since the DR rats gained weight and grew throughout the experiment.
No differences were found between the DR and AL groups in the levels of ALT (Figure 5b, Table 1).
It has been frequently proposed that controlling dietary intake could result in more uniform research results. 1,8,14,18,19 However, there is a paucity of published studies where the effect of DR on the variance of results would have been assessed; the ones available do indicate that DR can decrease the variability of body weight in laboratory rodents. 17–19 The diet board, however, does not appear to confer this beneficial effect.
The diet board does not offer the option of providing precalculated portions, as do the studies with singly-housed animals reporting decreased variability. This study compared variances of the measured parameters, but excluding some of the repeated measures to avoid false-positive results from abundant statistical analyses. We found no difference in the variances in any of the parameters. Nonetheless, the possibility of a false-negative outcome on variance remains; and since changes in variances have an exponential effect on the number of animals needed; the latter effect may still need to be evaluated in a larger study. Furthermore, an outbred stock was used in this study. The greater interindividual variability seen in outbred stocks compared with inbred strains could mask some subtle differences in the variances between the two groups.
Though the reduction potential seems negligible, the diet board does have promising refinement features. Compared with traditional methods of DR, the diet board offers refinement in two ways. It is feasible for use in group-housed rats and the diurnal eating rhythms of the animals are unlikely to be disturbed. 26 The diet board can also be seen as a cage furniture item, dividing the space and increasing the structural complexity of the environment. 21,22 The diet board may also allow rodents to express some aspect of their natural feeding behaviour. The true enrichment value of the diet board is still to be determined.
There are also limitations to the use of the diet board; the current version is not suited for animals under the age of seven weeks, hence it is not recommended that animals younger than 8–9 weeks should be fed with the board, since these animals may still be in the adaptation phase. Furthermore, food consumption of an individual animal can neither be investigated, nor does the board offer control on the animals' feeding regime. Although food is considered as non-elastic in consumer demand theory, 47 individual differences in behaviour, regulation of hunger and satiety and social status could still change the animals' motivation to use the board. Furthermore, the diet board should not be used for animals in poor condition, or those with mal-occlusion or any other impairment affecting their ability to gnaw.
In conclusion, the diet board provides mild to moderate DR for rats; this is likely to result in refinement over time. The desired combination of DR, group-housing and an unchanged circadian eating rhythm are further advantages of the diet board. Its effects on clinical chemistry parameters are associated with lipid and energy metabolism. Finally, the diet board is also a functional furniture item tailored to counteract obesity and its associated ills at the same time providing mandated complexity to the cage environment.
Footnotes
ACKNOWLEDGEMENTS
This study was financially supported by the Finnish Ministry of Education, the Academy of Finland, the European College of Laboratory Animal Medicine (ECLAM) and European Society of Laboratory Animal Veterinarians (ESLAV) Foundation and the Research and Science Foundation of Farmos.