
Abstract
Ad libitum (AL) feeding of rats leads to obesity and increased result variability, as well as premature morbidity and mortality. It may also alter metabolism and responses to foreign compounds. Moderate dietary restriction (DR) reduces these untoward effects without compromising the sensitivity of rodent bioassays. The diet board (DB) is a novel method for achieving moderate DR in group housing. Food pellets are firmly attached into grooves in an aspen board, and rats have to gnaw the wood in order to eat. Food is available continuously, but due to the effort involved rats eat less. This study simulated a chronic safety test to assess the long-term effects of DB feeding. A total of 146 male and female outbred Sprague-Dawley rats, nine weeks old at onset, were housed in groups of three and fed either AL or with DBs for two years. Food and water consumption were measured at six time points. The rats were weighed every one to two weeks. Body and tibial lengths and epididymal fat weight were measured at necropsy. Modified body mass index was calculated at five time points after one year of age. DB feeding reduced body weight and fat tissue moderately, more so in males. DB males ate less than AL males, but no differences were seen in the total food consumption in the females. There was no consistent difference in the within-group variations of the measured parameters. DB is a workable DR method, albeit some modification could enhance and standardize its DR effects, especially in female rats.
Excessive morbidity and shortened lifespans of rodents involved in long-term safety studies were first recognized decades ago. This phenomenon has largely been attributed to ad libitum (AL) feeding of high-quality food, although other factors, such as the tendency to favour fast growing animals in breeding, have also been recognized. 1 Unrestricted feeding has even been named as the least controlled variable in rodent bioassays, as it can lead to excessive and uneven energy intake, obesity and increased variation of animal size, as well as influencing the metabolism and the effects of foreign substances.2–5 AL feeding and the associated increase in body weight (BW) have pathological consequences, e.g. increased susceptibility to cardiac and circulatory diseases, progressive kidney failure, hormonal disturbances, early developing tumours and decreased longevity.2,3,5 Some of these adverse effects may even be seen in young animals and short-term experiments; but the consequences of AL feeding may create serious problems, particularly in long-term studies. If a considerable number of rats, even in control groups, do not survive to the end of an experiment, any late emerging study effects become difficult to discern.2,3 Unrestricted feeding complicates the interpretation of results, reduces the statistical power, and increases the number of animals needed.2–5 The component of AL feeding responsible for most of these drawbacks is excessive energy intake.2,3,6
Moderate dietary restriction (DR), i.e. limiting the intake of energy or food itself to about 75–85% of the intake level of AL-fed animals, reduces adiposity and overfeeding-related morbidity and pathology, and increases longevity, without compromising the emergence of toxic and carcinogenic effects in safety testing.1–3,5–10 It can also increase the physiological homogeneity of animals, provided that the level of restriction is strictly controlled.4,11,12 In rats, the energy restriction must begin in early adulthood at the latest if it is to be effective.3,6,9,13,14
The beneficial effects of DR were first recognized many years ago, yet laboratory rodents are still mostly fed AL. So far DR has predominantly been conducted by meal feeding of solitary animals, because in groups dominant individuals may eat more and may prevent the others from eating sufficiently, potentially even predisposing the subordinates to undernourishment.2,5 However, single-housing does not comply with current legislation and guidelines, which call for all gregarious animals to be kept in groups.15,16 Software controlled individual rationing with devices that identify rats, e.g. by microchips, is possible but the equipment is complicated and costly and is not suitable for routine large-scale caging. Thus, for want of a practical low-cost DR solution for group housing, AL feeding is still the common practice.
Out of this contradiction the idea has arisen of combining DR and group housing of rats by making the animals work for food in a way that is natural to them. The diet board (DB) contains food pellets which are tightly embedded in grooves cut into the aspen board, and the rats have to gnaw their way through the wood in order to eat. Ample food is available all the time and every rat can eat undisturbed as in AL feeding. The assumption is that due to the increased masticatory workload, rats only eat the amount necessary to meet their needs, thus avoiding excessive energy intake and obesity. DB feeding may also increase physical exercise and energy expenditure, thereby enhancing the DR effect. Moreover, DB can be considered to be an enrichment item, as it increases cage complexity and encourages species typical activities.
In the 10-week study by Kasanen et al.,17,18 the food consumption of young male Wistar rats feeding on DBs was about 80% of the consumption of AL-fed control group rats. The rats weighed 15% less in the DB group than in the AL group. DB feeding decreased the amount of fat tissue substantially, but had only a minute effect on bone growth. With respect to the metabolic parameters, similar changes were found as in other studies of moderate DR. Thus the basic functionality of DB was shown in a short-term test arrangement.
This study was designed to assess the effects of DB feeding compared with AL feeding in a two-year experiment, simulating situation in the long-term toxicity and carcinogenicity studies. The hypotheses tested in the part of the study reported here were that DB feeding would reduce food intake moderately, prevent or reduce overweight and obesity, and decrease variations in measured physiological parameters.
Materials and methods
The study protocol was reviewed and approved by the National Animal Experiment Board of Finland. The animal care and experimental procedures were in line with Finnish and European legislation and recommendations.15,16,19,20
Animals and housing
A total of 146 outbred Hsd:Sprague-Dawley® male and female rats, born in the Laboratory Animal Centre, University of Oulu, Finland, were used. They were nine weeks old at the beginning of the two-year study, males weighing 217–365 g (mean 303 g, standard deviation [SD] 24 g) and females 167–243 g (mean 202 g, SD 11 g). The microbiological health of the rats was monitored according to Federation of European Laboratory Animal Science Associations (FELASA) recommendations. 21 Serum antibodies of rat minute virus (RMV) were found, but no other antibodies or infections were detected.
Rats were housed as single-sex groups of three. In the course of the experiment, some of the rats were removed due to humane endpoint or sudden death, in which cases only two rats were left in a cage. When a second rat had to be taken out from the same cage, a companion was added to the remaining one. Companion rats were not included in the study.
Solid bottom type IV (59.5 × 38 × 20 cm) polycarbonate cages with wire lids (Tecniplast 1354G, Buguggiate, Italy) were used, supplied with a 15 cm tuft of aspen shavings (PM90L) as nesting material and a 2 cm layer of 5 × 5 × 1 mm aspen chips (4HP) as bedding (Tapvei, Kiili, Estonia). Untreated tap water from municipal pipes was offered in polycarbonate bottles, refilled when necessary and changed during cage changes. The cages were changed twice a week from 09:00 to 10:00 h; birth cohorts one and two on Mondays and Thursdays, and birth cohorts three and four on Tuesdays and Fridays.
Room temperature was 21 ± 1℃ and relative humidity 40–60%. Room illumination followed a 12/12 h cycle with one hour gradual change, fluorescent tube lighting on from 07:00 to 19:00 h. The light illumination level was 350 lux at 1 m height from the floor. The ventilation rate was set at 15 air changes per hour, with positive pressure in the room.
Feeding
Autoclaved natural ingredient food (Labfor R36, Lantmännen, Kimstad, Sweden) was available all the time either in DBs (experimental groups) or AL in cage lid hoppers (control groups). The ingredients were wheat, barley, soy, potato, vegetable oil and added vitamins, minerals and trace elements. The food contained 18.5% crude protein, 4.0% crude fat (of which 1.0% linolic acid), 3.5% vegetable fibre, 55.7% nitrogen-free extract (NFE), 6.3% ash and max 12% water. The energy content was 1200 kJ/100 g metabolizable energy (ME).
Filled DBs and control group food were autoclaved simultaneously (45 min, 121℃). Both AL food and DBs were changed on Thursdays or Fridays at cage change. The boards were turned upside down on the fourth day so that it would be easier for the rats to eat from the upper edges. Kasanen et al.17,18 observed that turning the boards kept the workload more constant and prevented excessive fluctuations in food intake.
The diet board
Each DB consisted of two aspen boards, size 2.7 × 14 × 36 cm, joined in the middle to form a cross-shaped wall structure in the cage (Figure 1). There were 10 vertical grooves (diameter 12 mm) parallel to the 14 cm edge on both sides of each board, cut with a round-headed cutter. The grooves opened to the broad faces with 6–7 mm wide gaps. The grooves were filled with tightly fitting food pellets, fixed in by autoclaving. The DB-fed rats received food only from the boards, which were in the cages all the time.
Diet board in a rat cage (a), and boards before and after one week in a cage (b).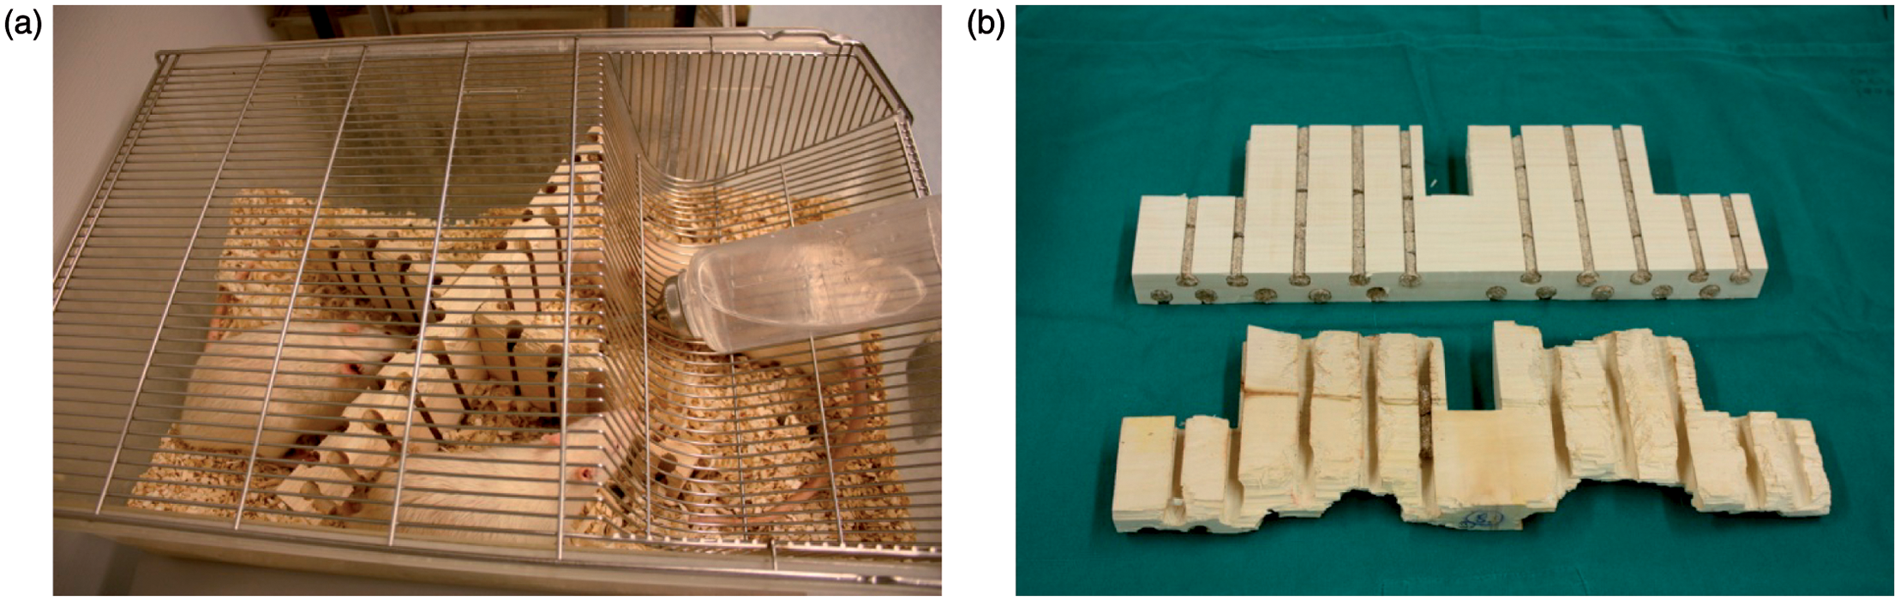
The boards divided each cage into four compartments. At the ends of the boards were 6 × 6 cm rectangular passages for the rats. There was also sufficient space for the rats to climb between the boards and the lids (4–6 cm). Control cages were supplied with aspen boards otherwise similar to the DBs but without the grooves for the food. Control group boards were autoclaved, changed and turned upside down simultaneously with DBs.
Study design and randomization
Factorial block design was used. The original total number of rats was 144, divided into four groups of 36 rats according to sex and feeding method: DB-fed males and females (experimental groups), and AL-fed males and females (control groups). The animals entered the study in four identical 36 rat birth cohorts at one- to two-month intervals. In each cohort, rats were derived from five litters, born within one week: four litters of four males and females, and one litter of two males and females. Pups from each litter were separated evenly at random into DB and AL groups. Then the nine rats of each study group in a cohort were randomized into three cages so that siblings went into different cages. Every cohort was housed in its own cage rack, with groups randomized evenly onto the four shelves and into the three places on each shelf.
In addition to the original design, one extra cage of DB-fed males was added to the fourth cohort, after one DB-fed male in the third cohort had to be euthanized due to a leg injury only two weeks after the beginning, making the total number of rats 146.
Sample size
It was not possible to make accurate estimates of the standard deviations of many variables, which prevented advance determination of group size via sample size calculations. Therefore the resource equation was used to determine the required sample. 22 The experimental unit was either a cage or a rat, depending on the response variable. The error degree of freedom in this study was 41, calculated with cage as the experimental unit.
Food and water consumption
Consumption measurements were carried out in study months 0, 3, 6, 12, 18, and 24. Absolute (g/rat/week) and relative (per BW unit, g/kg/week) food and water consumption were calculated as cage means. Food consumption of the AL-fed rats and water consumption of all rats were measured by subtracting the leftover weights from the initial weights. Food consumption from the DBs was determined by measuring the length of the emptied parts of the grooves. The weight of food per centimetre was assessed by weighing boards before and after filling, and by dividing the food weight by the groove length. This was done three times during the study with a total of 42 boards, and the overall mean was used in calculating the consumption values.
Since food consumption was measured differently in the AL and DB groups, the agreement of measurement methods was tested. The weight of food in 32 boards was first determined by weighing them before and after filling. After a one-week feeding period, consumption was measured as described above. Then the leftover food was scraped out from the boards and weighed. Results obtained by length measurement and direct weighing from the same boards were compared as described by Altman and Bland.23,24 The agreement between methods was found to be adequate when set against the results of the food consumption analysis.
Body weight, size and adiposity
Rats were weighed during cage changes on Thursdays or Fridays, using a 3 s average function of a laboratory scale (Mettler Toledo PB3002-S FACT; Mettler-Toledo AG, Greifensee, Zurich Switzerland). Weighings were done initially once a week for 20 weeks, and thereafter every other week.
Skeletal size was measured at necropsy. The rat was placed supine, body and tail straight, and the length from the nose to the tip of the tail was measured with a try-square. The left tibia was cut free at the knee and the hock, also removing the menisci, and was measured with a digital slide caliper (Prof Digimatic IP 54: Hangzhou United Bridge Tools Co., LTD. Zhejiang, China).
Epididymal fat (EF) pads were cut off in the necropsy along the epididymides and the blood vessels and weighed with a precision laboratory scale (Mettler AM 50, Mettler Instrumente, AG, Greifensee, Switzerland).
Modified body mass index (BMI) was calculated using the formula BMI = BW (g)/(body length [cm] × tibial length [cm]).
Health, welfare and humane endpoints
Rats were observed at least once a day to monitor them for health and welfare problems, with any detected clinical symptoms being documented and a more thorough clinical examination being performed if needed. Appropriate measures were taken to correct possible health and welfare problems, but in cases where the preset humane endpoint was reached, the rat was euthanized.
The study-specific humane endpoints determined in advance included excessive reductions in BW, inadequate increases in BW during the growing phase, and tooth problems caused by the DB. The general endpoints were any problems in health or well-being that could not be quickly and effectively ameliorated.
The age-specific endpoint limits of BW development, based on the results of Kasanen et al.,17,18 were as follows:
9–10 weeks of age (the first week on DB feeding): 15% weight reduction. 10–13 weeks of age: 5% weight reduction in one week, or no weight increase in two weeks. 13–17 weeks of age: 10% weight reduction in one week. 17–20 weeks of age: 15% weight reduction in one week. From 20 weeks of age onwards: 15% weight reduction in two weeks.
Euthanasia was carried out by collecting blood by heart puncture under isoflurane anaesthesia, and death was ensured by placing the rat in a prefilled CO2 chamber.
Statistics
The data were analysed with SPSS 15.0 for Windows (SPSS Inc, Chicago, IL, USA).
The main outcome variables were food and water consumption, BW, body size, and adiposity. All analyses were done separately for males and females in order to evaluate possible interactions between sex and feeding method.
In the body and tibial length comparisons, the analysis of covariance model included feeding method, birth cohort, and BW at study week 0 as covariates.
The differences between feeding groups in EF weight were evaluated using independent samples t-test. The association between EF weight and BMI was examined using the Pearson correlation coefficient.
Outcome variables with repeated measurements were examined using multivariable linear regression analysis with generalized estimating equations (GEE) to account for the correlation among results at different time points. 25 In the analyses in which the rat was the experimental unit, litter was also designated as a within-subject factor, to take into account any possible familial effects. The main explanatory variable was the feeding method. Birth cohort, time point, and numbers of rats in the cage were included in the models for adjustment. When the number of rats was included in the regression models, these models were estimated separately for both sexes and feeding groups. In repeated measurements with the cage as the experimental unit (food and water consumption), cages were excluded from the data at the time point when two rats had been removed and a companion had been added to the cage.
In BW and BMI longitudinal analyses the following summary measures were used: means of three BW readings two weeks apart were calculated to reduce the effects of short-term BW fluctuations. Zero measurement and seven summary measure periods with even intervals over two years were included in the BW analysis. Five summary measure periods at even intervals from one year of age onwards were included in the BMI analysis.
Within-group variations in skeletal size and EF weight were compared between feeding groups using Levene’s test of homogeneity of variances. In repeated measurements, the absolute difference of each original datum from the study group median was calculated, to illustrate the variation, and square root transformation was applied to normalize the distribution. Within-group variations between feeding groups were then compared using multivariable linear regression analysis with GEE. Time point and litter were designated as within-subject factors, with the main explanatory variable being feeding method. Other variables were included only if they were shown to have a significant effect in the model.
In the food and water consumption data, a few strongly deviating outliers were removed from the analyses. In these cases, the deviation was judged to be most probably due either to some temporary disturbance not related to the feeding method, or to an error in measurement.
Results
Absolute food consumption (g/rat/week)
The effect of feeding method: Absolute food consumption was higher in the AL than in the DB group in males, whereas the difference between the female groups was not significant (Figure 2a).
Mean (with SD) of absolute (a) and relative (b) food consumption of diet board and ad libitum rat groups. Consumption was measured as cage means. The data were analysed with multivariable linear regression analysis with generalized estimating equations. Significant differences between feeding groups were found in absolute food consumption of males (model-based effect 9.3 g/rat/week, 95% CI [5.7, 12.9], P < 0.001), and relative food consumption of both sexes (model-based effect: males 17.5 g/kg/week, 95% CI [10.4, 24.6], P < 0.001; females 26.8 g/kg/week, 95% CI [18.3, 35.3], P < 0.001).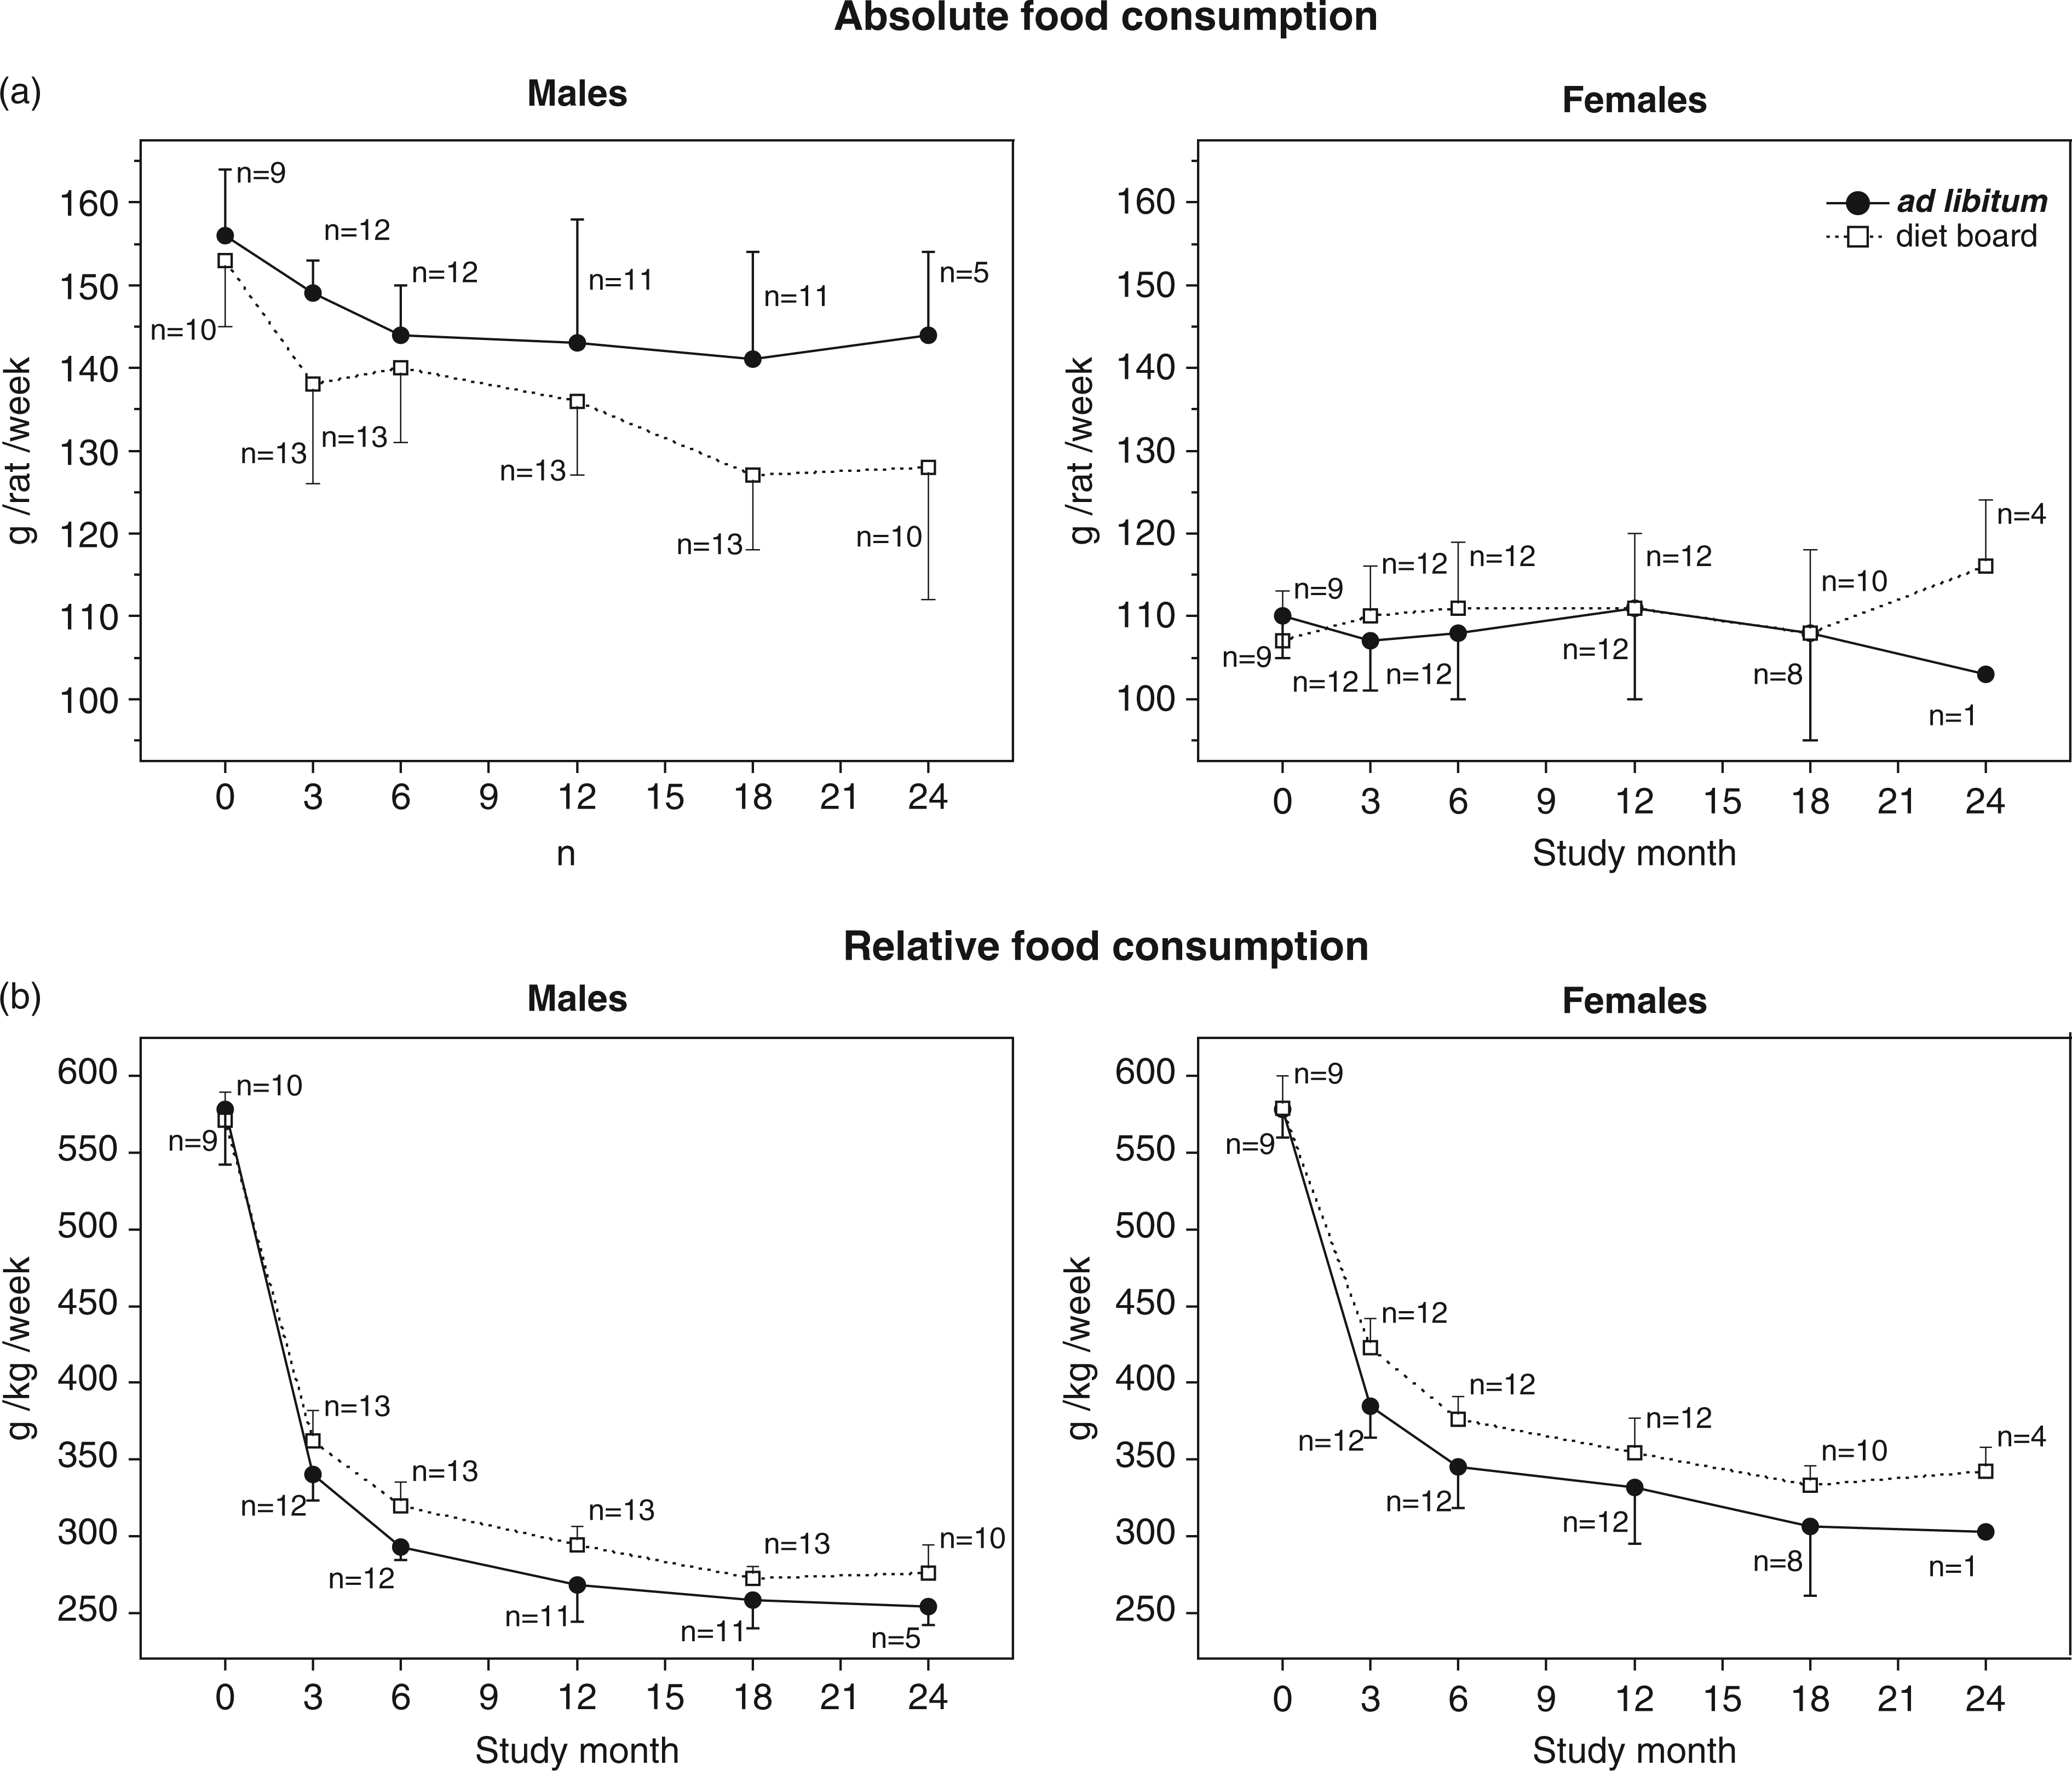
The effect of the number of rats in a cage: With three rats in a cage the absolute food consumption was lower than with two rats, in all groups (model-based effects: AL males 11.5 g/rat/week, 95% CI [3.5, 19.4], P = 0.005; DB males 17.4 g/rat/week, 95% CI [11.0, 23.9], P < 0.001; AL females 7.8 g/rat/week [0.7, 14.8], P = 0.03; DB females 15.6 g/rat/week 95% CI [8.7, 22.6], P < 0.001).
The effect of feeding method on the within-group variation: Variation did not differ significantly between the feeding groups of either sex (males P = 0.3, females P = 0.4).
Food consumption relative to body weight (g/kg/week)
The effect of feeding method: Relative food consumption was higher in the DB than in the AL group in both males and females (Figure 2b).
The effect of the number of rats in a cage: In AL groups, relative food consumption was lower with three rats in a cage than with two rats (model-based effect: AL males 19.5 g/kg/week, 95% CI [5.2, 33.8], P = 0.007; AL females 39.3 g/kg/week, 95% CI [12.7, 65.8], P = 0.004). In DB groups, there were no statistically significant differences.
The effect of feeding method on the within-group variation: Variation did not differ significantly between feeding groups in males (P = 0.3). In females, the variation was higher in the AL group (model-based effect 0.81, 95% CI [0.09, 1.52], P = 0.027).
Absolute water consumption (g/rat/week)
The effect of feeding method: In both sexes, the AL-fed rats drank significantly more than the DB-fed rats (Figure 3a). The number of rats in the cage did not have any statistically significant effects on absolute water consumption in any of the study groups.
Mean (with SD) of absolute (a) and relative (b) water consumption of diet board and ad libitum rat groups. Consumption was measured as cage means. The data were analysed with multivariable linear regression analysis with generalized estimating equations. Significant differences between feeding groups were found in the absolute water consumption in both sexes (model-based effect: males 12.5 g/rat/week, 95% CI [4.1, 20.9], P = 0.004; females 10.6 g/rat/week, 95% CI [1.8, 19.3], P = 0.018), and in the relative water consumption of males (model-based effect 20.2 g/kg/week, 95% CI [7.5, 32.8], P = 0.002).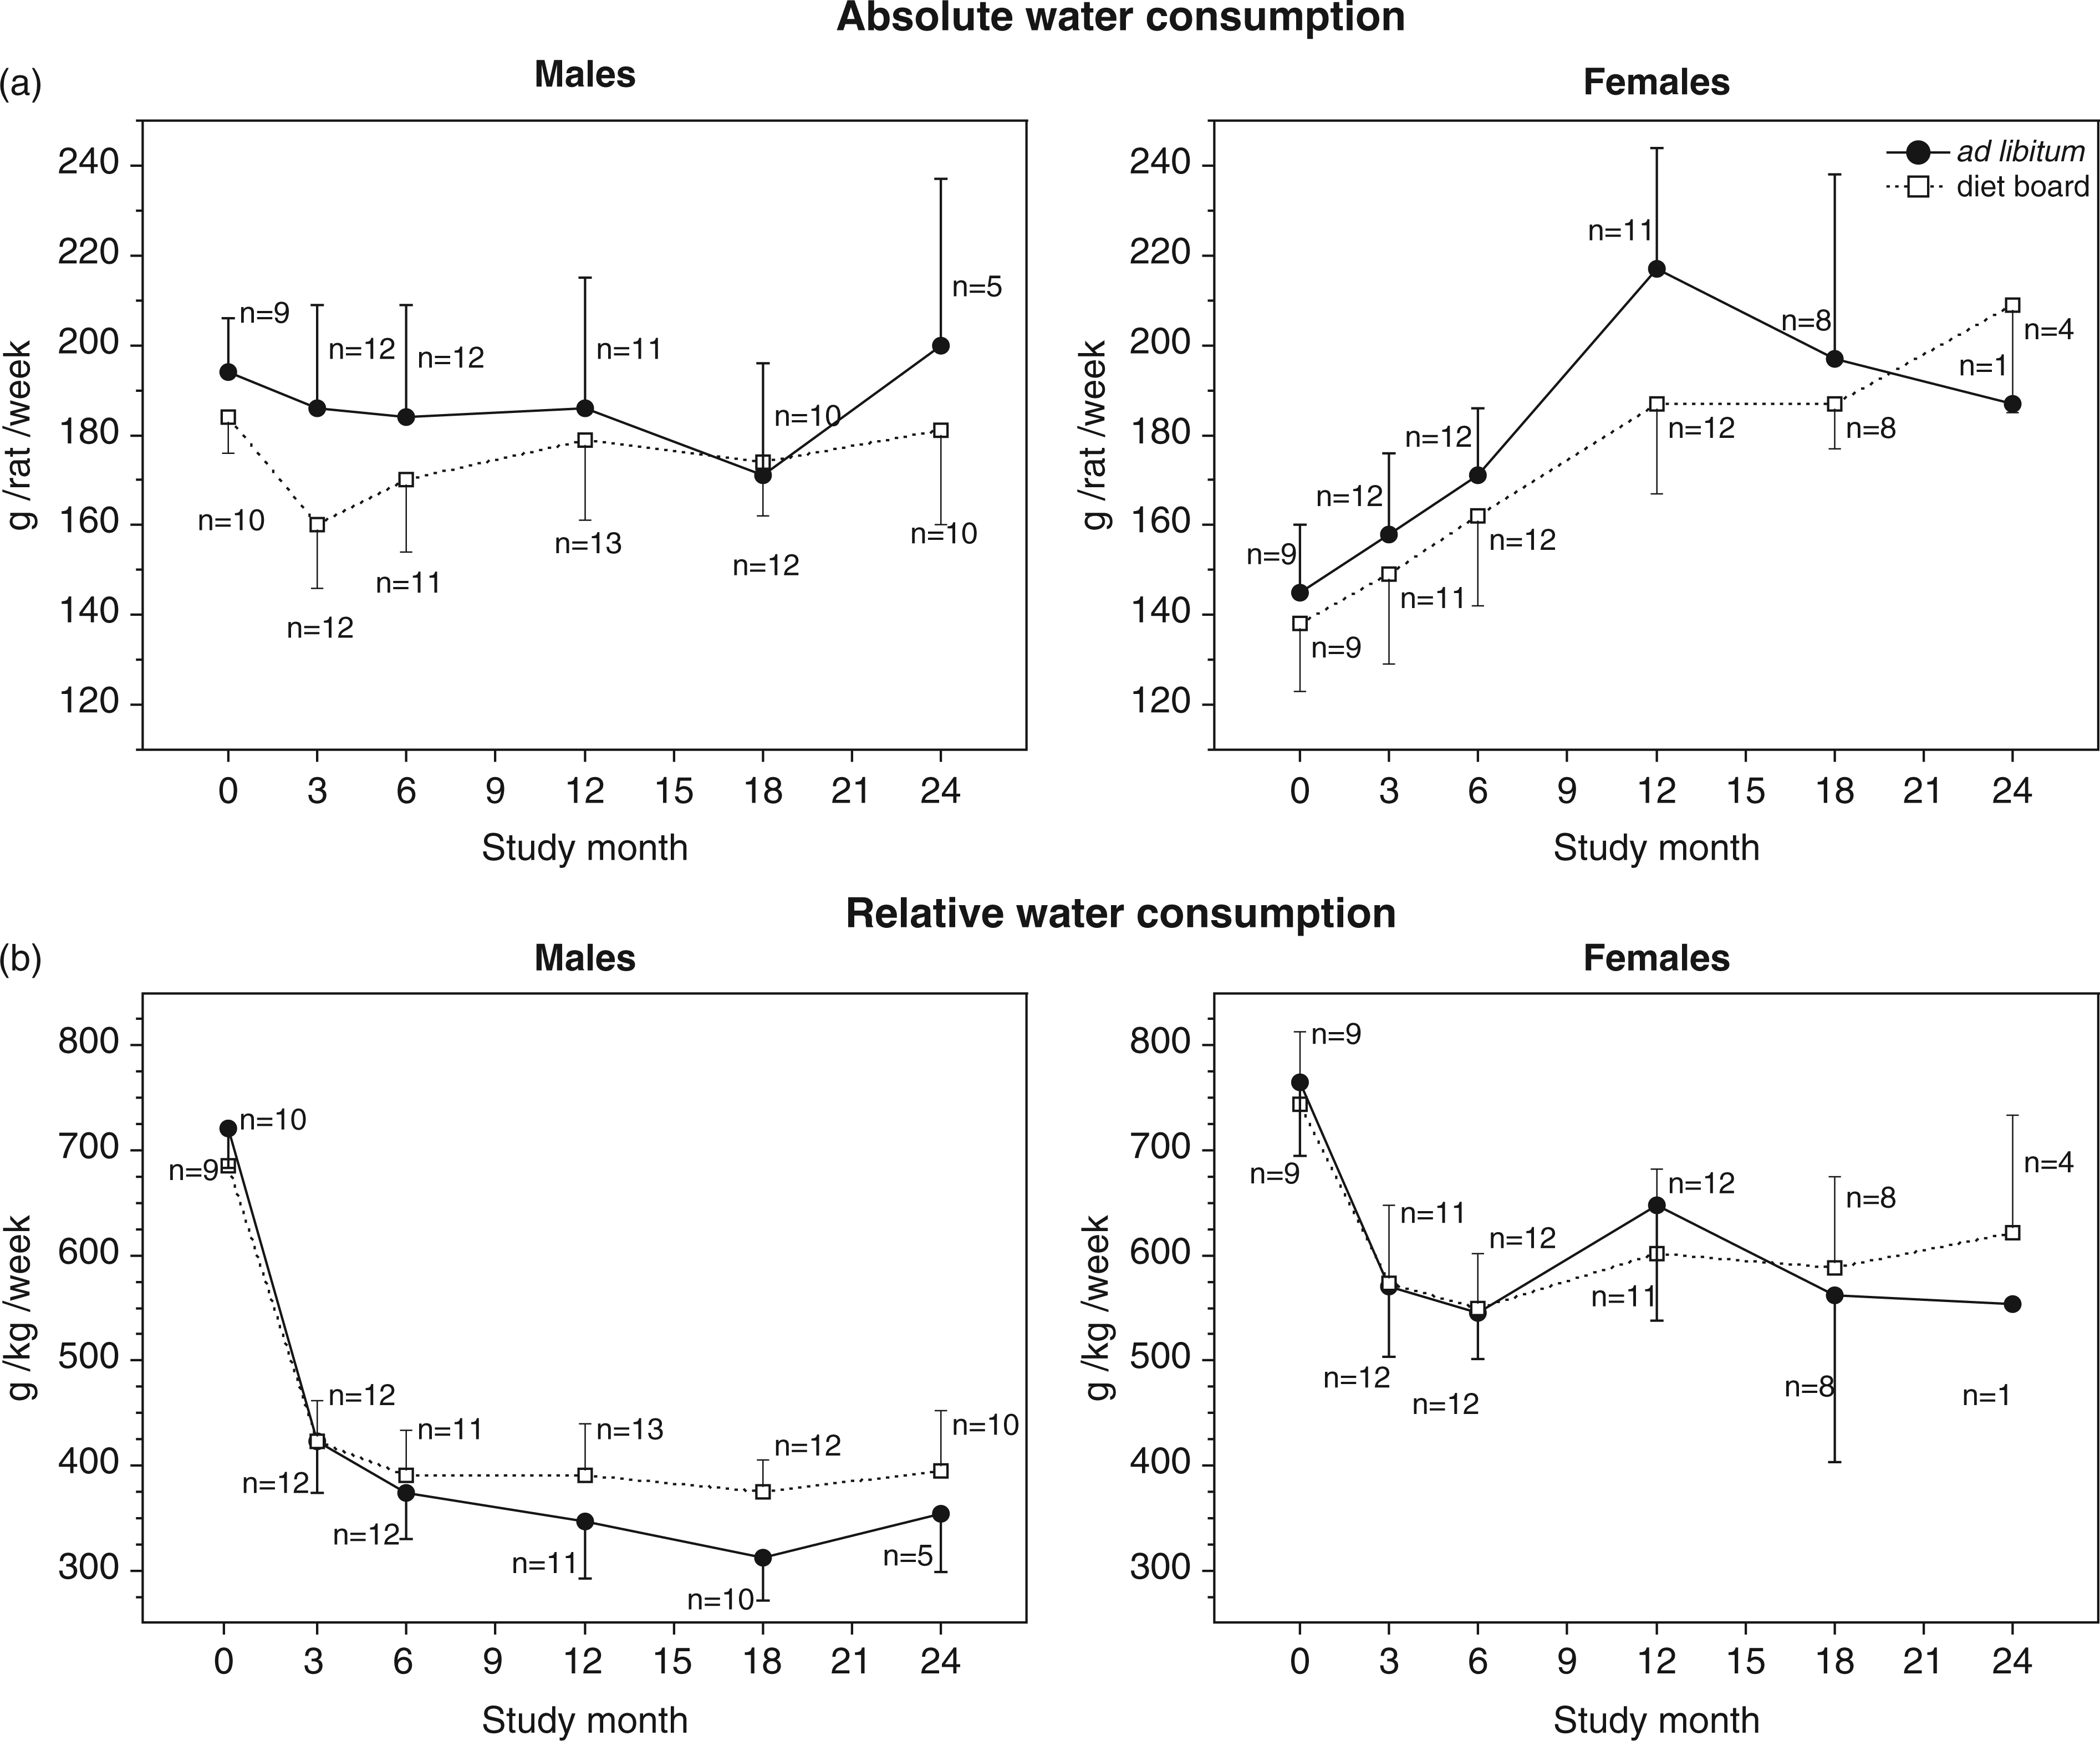
The effect of feeding method on the within-group variation: Variation did not differ significantly between feeding groups in females (P = 0.3). In males, the variation was greater in the AL group (model-based effect 1.06, 95% CI [0.52, 1.61], P = 0.001).
Water consumption relative to body weight (g/kg/week)
The effect of feeding method: The relative water consumption was significantly higher in the DB males than in the corresponding AL group. The differences between female groups were not significant (Figure 3b).
The effect of the number of rats in a cage: In DB groups, the relative water consumption was higher with three rats in a cage than with two rats (model-based effect: DB males 36.6 g/kg/week, 95% CI [3.8, 69.5], P = 0.03; DB females 81.9 g/kg/week, 95% CI [36.6, 127.2], P < 0.001). In AL groups, there were no statistically significant differences.
The effect of feeding method on the within-group variation: Variation did not differ significantly between feeding groups in either sex (males P = 0.3, females P = 0.9).
Body weight
Both male and female rats in the DB groups weighed significantly less than their AL counterparts (Figure 4). BWs of the DB-fed rats declined during the first one to two weeks, after which their weight gain proceeded normally. The difference between feeding groups developed in an overall similar manner in both sexes over the two-year study period. The relative weight difference ([AL mean – DB mean]/AL mean) increased until study week 3 (females 9.8%, males 15.5%), after which it declined until week 36 (females 5.7%, males 10.8%). Thereafter it gradually increased again, peaking at week 82 for females (10.8%) and at week 88 for males (18.5%). During the final weeks, the difference diminished again.
Mean (with SD) summary measure body weights of diet board (DB) and ad libitum (AL) feeding groups. Summary measures are averages of three weighings taken two weeks apart. The data were analysed with multivariable linear regression analysis with generalized estimating equations. Male and female rats both weighed significantly less with DB than with AL feeding (model-based effect: males 63.7 g, 95% CI [50.7, 76.8], P < 0.001; females 21.8 g, 95% CI [13.0, 30.5], P < 0.001).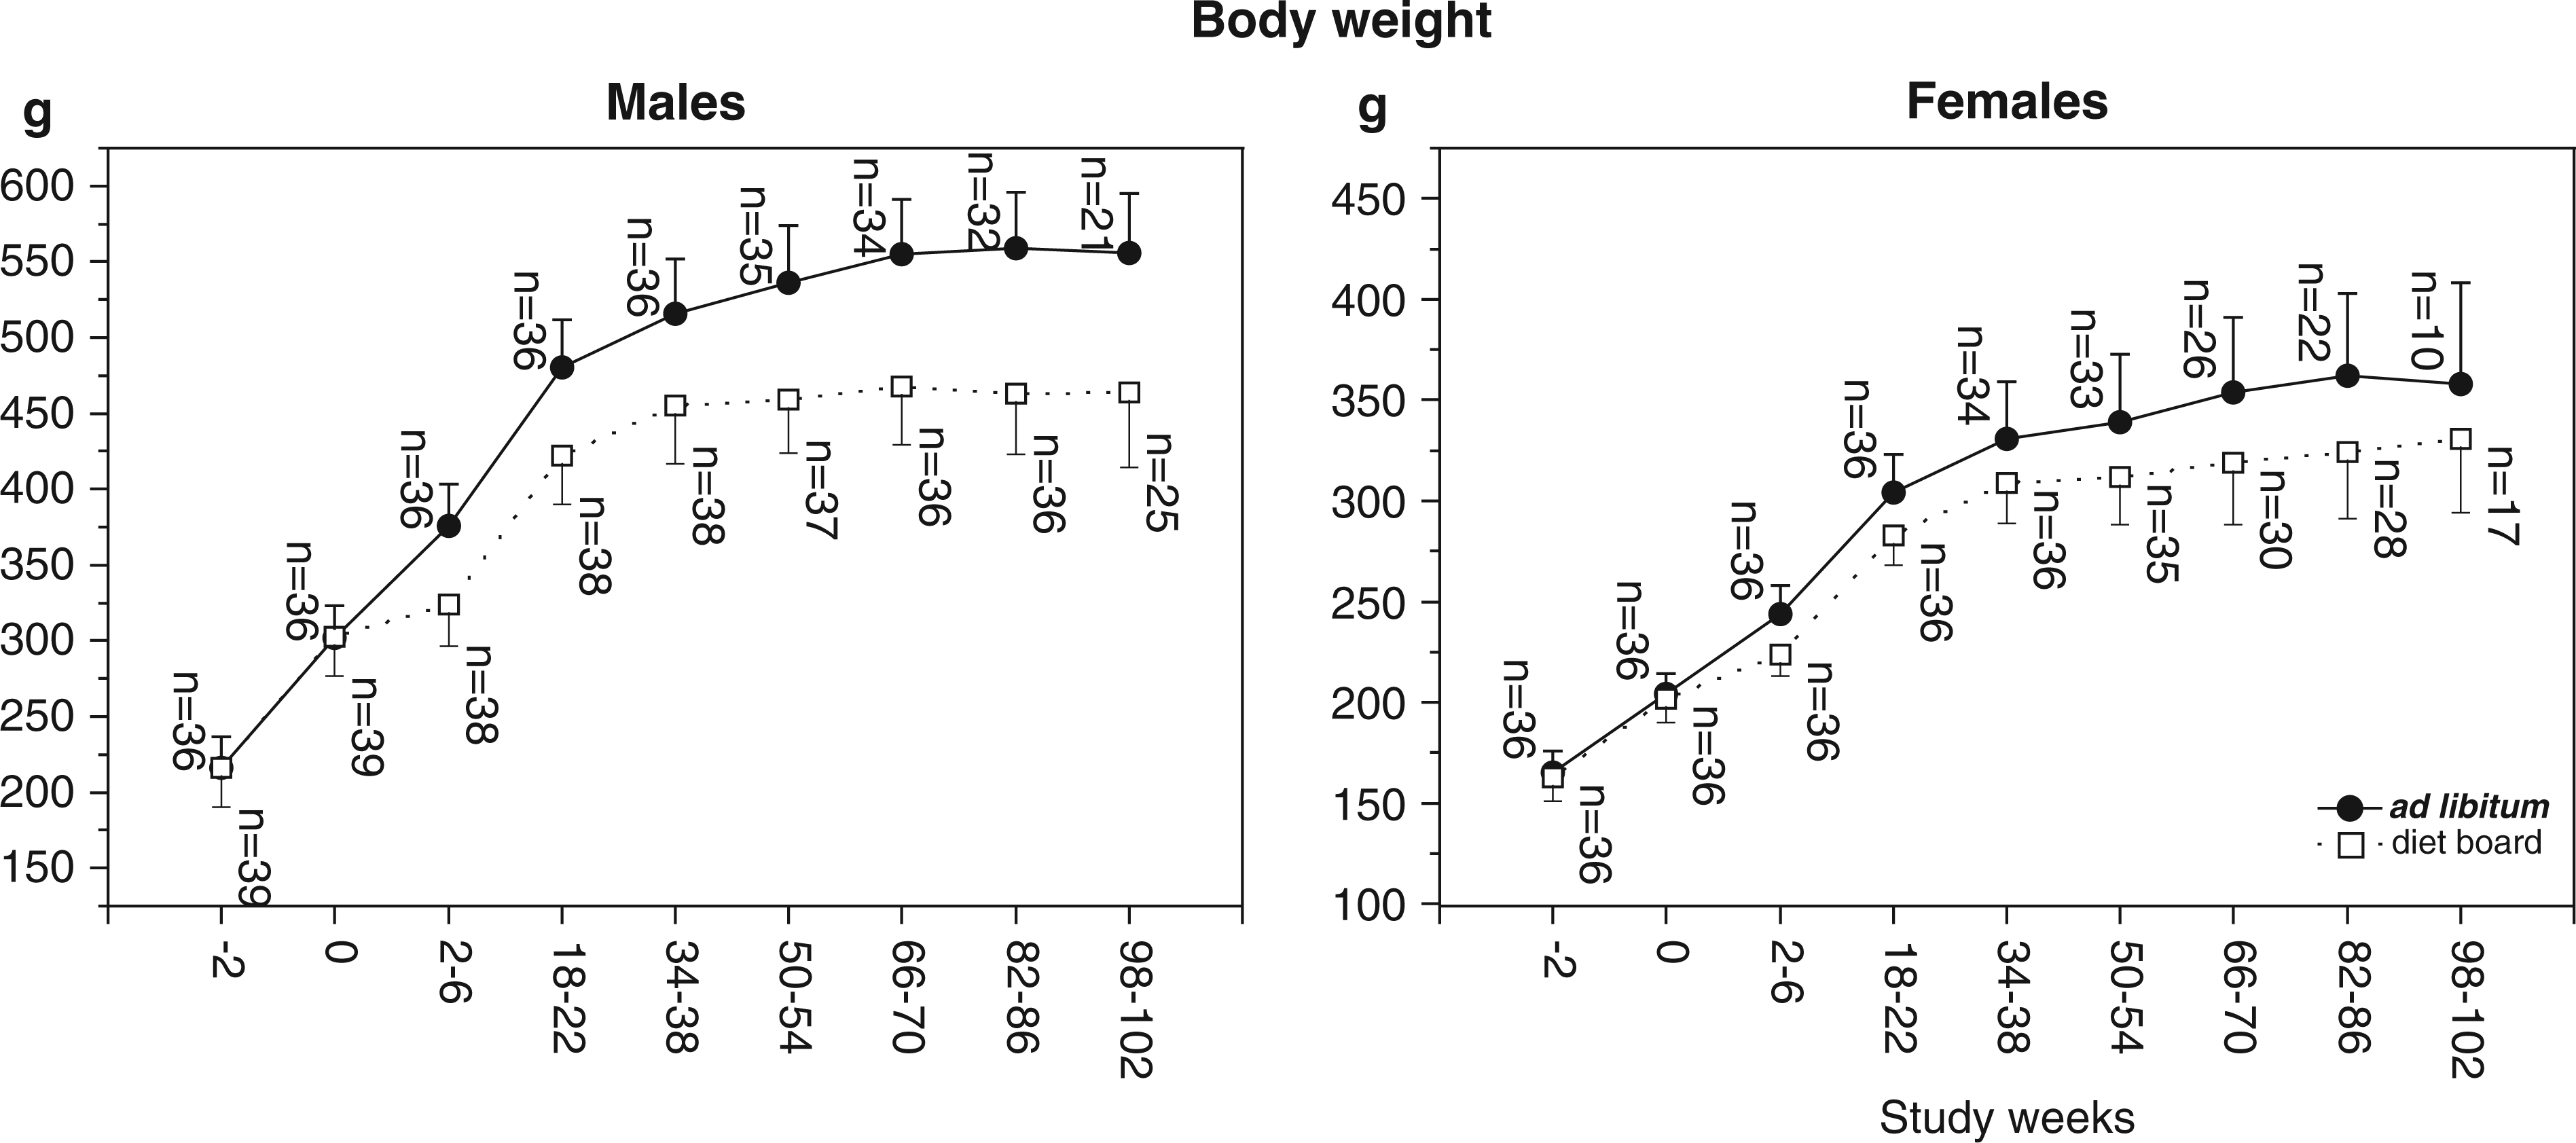
In DB groups, BWs were lower with three rats in a cage than with two rats (model-based effect: DB males 30.6 g, 95% CI [11.7, 49.4], P = 0.002; DB females 32.0 g, 95% CI [19.2, 44.8]). In AL groups, there were no statistically significant differences.
Within-group variation did not differ significantly between feeding groups in either sex (males P = 0.9, females P = 0.2).
Skeletal size
Body lengths (nose – tip of the tail) and left tibial lengths (mean (SD)).
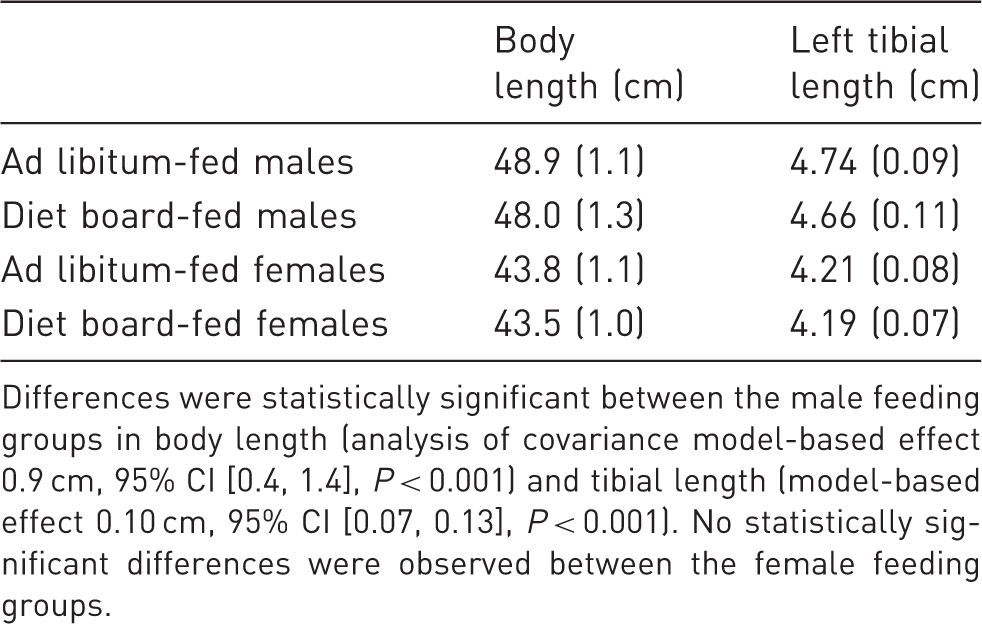
Differences were statistically significant between the male feeding groups in body length (analysis of covariance model-based effect 0.9 cm, 95% CI [0.4, 1.4], P < 0.001) and tibial length (model-based effect 0.10 cm, 95% CI [0.07, 0.13], P < 0.001). No statistically significant differences were observed between the female feeding groups.
Epididymal fat
The mean EF weight of the males that survived to the end of the trial was 5.7 g (SD 1.3 g) in the AL group, and 3.9 g (SD 1.3 g) in the DB group. The difference was statistically significant (mean 1.8 g, 95% CI [0.8, 2.7], P < 0.001). Within-group variances did not differ significantly between feeding groups.
Modified body mass index
The association between EF weight and BMI at necropsy was examined in all males. The Pearson correlation coefficient was 0.815, which was evidence of a clear association between variables.
The DB groups had significantly lower BMI values than AL groups in both males and females (Figure 5).
Mean (with SD) summary measures of modified body mass indexes (BMIs) of diet board (DB) and ad libitum (AL) feeding groups. BMI = body weight (g)/(body length (cm) × tibial length (cm)). The lengths used in the BMI calculations were measurements from full-grown rats at necropsy; therefore BMIs could only be determined for full-grown animals (over one year of age). Summary measures are averages of three measurements taken two weeks apart. The data were analysed with multivariable linear regression analysis with generalized estimating equations. BMIs were significantly smaller in the DB than in the AL group in both sexes (model-based effect: males 0.29 g/cm2, 95% CI [0.24, 0.34], P < 0.001; females 0.13 g/cm2, 95% CI [0.07, 0.20], P < 0.001.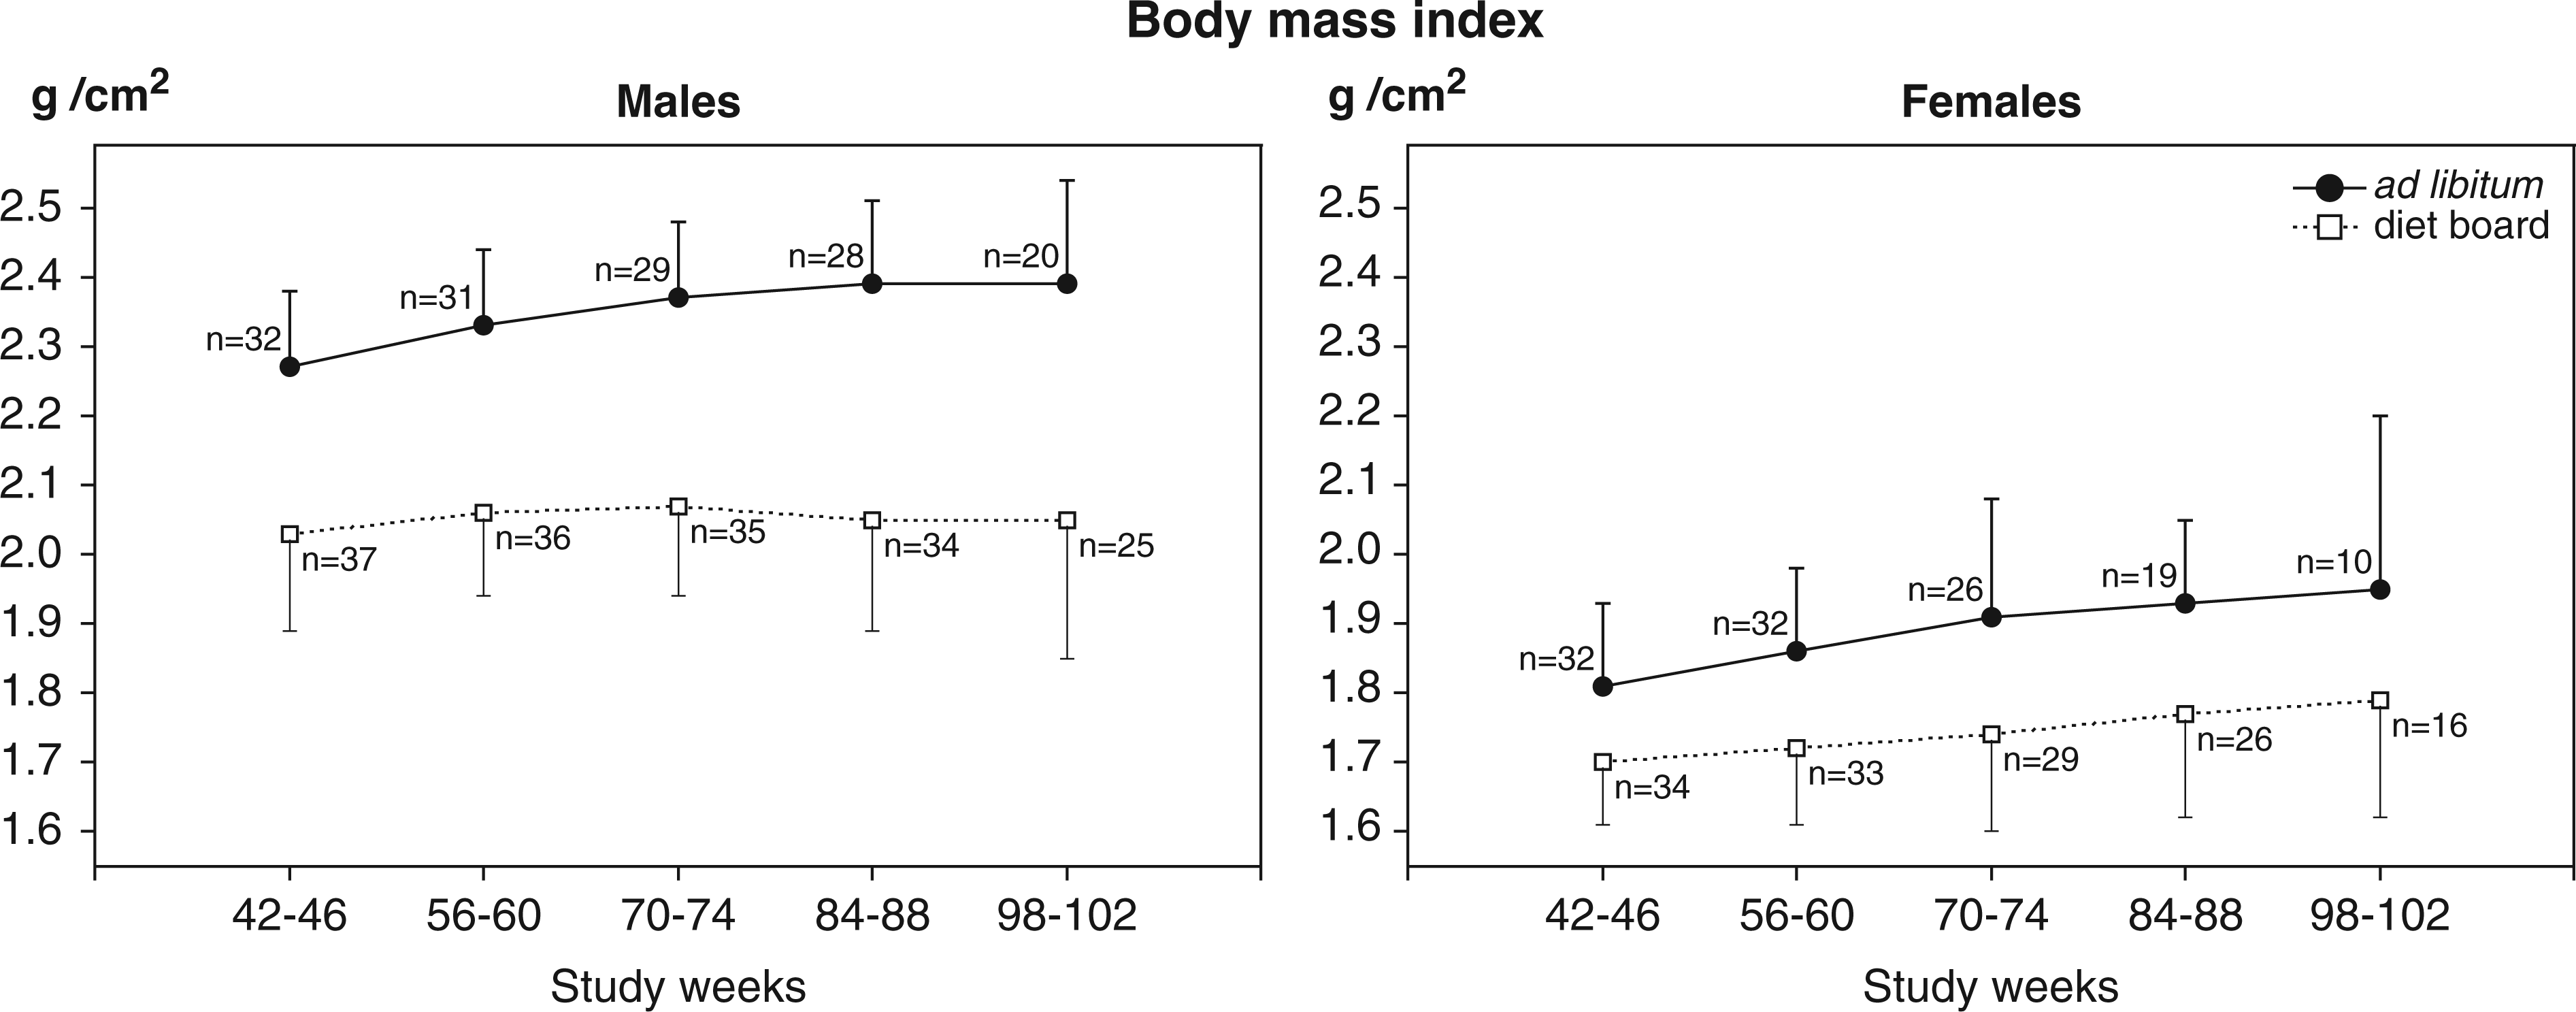
In the DB groups, BMI values were lower when there were three rats in a cage, compared to the situation with two rats (model-based effect: DB males 0.21 g/cm2, 95% CI [0.14, 0.27], P < 0.001; DB females 0.17 g/cm2, 95% CI [0.13, 0.21], P < 0.001). In AL groups, no statistically significant differences were detected.
Within-group variation did not differ significantly between feeding groups in males (P = 0.4). In females, the variation was higher in the AL group (model-based effect 0.06, 95% CI [0.01, 0.10], P = 0.017).
Discussion
The main objective of DB feeding is to reduce premature morbidity and mortality, leading to refinement and reduction of animals in experiments, especially in long-term trials. In DB feeding, food is available all the time, but eating requires more physical effort and time compared with common AL feeding. Rats can choose when, how often and how long they wish to eat. In essence, DB feeding is AL feeding made more laborious for rats. It is intended to be an alternative to routine unrestricted feeding, but it is not suitable for studies where either a high level of dietary control or very accurate food consumption measurement is needed.
We simulated a two-year safety evaluation study in order to assess the suitability and possible benefits of DB feeding in long-term experiments. According to Festing, 22 it is advisable to use several inbred strains to decrease background variation, and thus reduce animal numbers. However, AL-derived obesity is more a problem associated with outbred stocks, which are commonly used in long-term studies under the premise that they mimic the normal population and are not restricted to any specific genotype. Outbred Sprague-Dawley (SD) rats were chosen as this stock has been widely used in chronic safety testing, and increased morbidity and poor survival have been reported as major problems with SD stocks.5,26
In most DR studies, food or energy restriction levels are adjusted to some predetermined percentage of the absolute food consumption of the AL control group. About 15–25% restriction from AL intake can be considered a moderate, and under 15% a mild, restriction. 27 In order to evaluate the restrictive effect of DB and to see how it would compare with other studies on DR, absolute food consumption was measured. In this study, DB feeding reduced absolute food consumption of males on average by 7%, whereas no statistically significant difference was seen between female feeding groups (Figure 2a).
When calculated relative to BW, food consumption was greater in DB than AL groups, the difference being on average 8% in males and 7% in females (Figure 2b). Earlier studies have shown that when energy intake of rats is restricted, BW is reduced to such a level that the same energy intake relative to the fat-free body mass as in AL feeding is regained.7,14,26,28 Thereby, since DR rats have less fat tissue, they eat slightly more relative to total BW than do AL rats. Our results agree with this in both sexes. Considering this, it may seem puzzling that in females DB feeding did not reduce absolute food consumption. This can however be explained by an increase in the physical activity and energy expenditure of the DB-fed rats, accounting for the females’ observed weight loss.
The pattern of water consumption followed that of food consumption in males (Figure 3). The total water consumption was 7% higher in AL-fed rats, whereas the relative consumption was 10% higher in DB-fed rats. In females, the water consumption pattern seemed to follow BW: the absolute water consumption in the DB group was on average 7% lower than in the AL group but no statistical difference was detected between the groups in relative water consumption.
Usually drinking occurs at the same time as, and is commensurate with, eating. 29 In DR meal feeding the reduced water intake can partly be explained by the reduced number of eating bouts and the total time spent eating, depending on the number and timing of meals. However, with DB feeding total feeding time and number of eating episodes are increased (Laaksonen et al., unpublished results). Consequently, the water intake of DB-fed males was associated more with food intake than with the duration of eating.
When interpreting these consumption measurement results, the possibility of some bias should be taken into consideration. Length measurement of food taken from the DBs is inevitably less accurate than weighing. Even though the Altman–Bland test23,24 revealed an adequate agreement between measurement methods with a separate set of test boards, the DB food consumption results should be viewed with some caution. Spillage of food and water might also cause some error. Although it could not be tested whether food spillage differed between feeding groups, we assumed that any difference would be small enough not to influence the outcomes of the consumption analyses. The average water spillage was presumably equal between groups.
DB feeding decreased BW in both sexes. The difference was attributable mostly to the initial two to three weeks of DB feeding, after which the mean BW curves of the feeding groups remained almost parallel. This finding is consistent with the results of Kasanen et al.17,18 in a 10-week DB experiment with young Wistar male rats. In this two-year study, the relative difference between feeding group mean weights varied from 6 to 11% in females and from 11 to 19% in males in the course of the study.
The feeding method had only a minute effect on the adult skeletal sizes. The DB-fed males’ body lengths were on average 3.1% and tibial lengths 1.8% smaller than those of their AL-fed counterparts, and in females there were no statistically significant differences. Since body sizes were on average nearly equal in the feeding groups, group differences in BWs could most probably be attributed to unequal adiposity. DB feeding might also have had some effect on skeletal and muscular weights, which could explain some, albeit probably a small, part of the BW variation.
In order to assess body fat contents more reliably, we weighed the EF of the males. In mice, a direct correlation between gonadal and total body fat content has been reported.30,31 We have not found similar comparisons reported in rats, but it is known that age, sex and diet affect the proportional distribution of body fat into different depots. 32 Thus the percentage of body fat cannot directly be deducted from a single depot weight, but with feeding method being the only differing factor between groups, relative differences in EF weights are likely to be of the same magnitude as the relative differences in the total body fat.
When we assessed those males that survived to the end in the DB group, mean EF weight was 32% smaller than the corresponding value in the AL group. However, there was a large difference in the survival rates between the groups in favour of the DB-fed rats, rendering the groups unbalanced towards the end, and thereby distorting the interpretation of the EF weight results. Therefore comparing adiposity between groups over the course of the study is a more relevant measurement.
Since females do not have as clearly demarcated and easily dissectable fat pads as the EF in males, and as it is not self-evident that the weights of fat depots would be in the same proportion to the total body fat in males and females, 32 we did not measure their fat directly. Instead, to evaluate fatness comparably in both sexes and also at different time points, we calculated the modified BMIs of all the rats. In full-grown rats of the same stock and age, BMI comparison presumably reflects differences in adiposity more reliably than do mere BW comparisons. No limit values have been determined for normal and excessive body fat in rats, but the relative differences of BMI can be used to compare adiposity between groups.
Body and tibial lengths for the BMI calculations were acquired at necropsies in the full-grown animals. Rats may increase their skeletal size of up to as much as one year of age, so BMI values could not reliably be calculated for rats younger than that. 1 The BMIs in study weeks 42–102 differed by 11–14% in the males and by 6–8% in females, supporting the concept that the observed BW differences were mostly due to differences in body fat content rather than in lean body mass.
DR can at its best result in lower variability of BW and other physiological variables, leading to reduction. 27 However, this seems to be the case mainly when the food intake is very accurately controlled, perhaps needing to be continuously adjusted to keep BW development within preset limits, resulting in very uniform animal groups.4,11,12 As the DB structure is adjusted so that the average DR effect will be only mild to moderate, this inevitably leaves room for individuals with a greater appetite to eat more, and on the other hand in some rats the restriction effect is more intense. Therefore it was not a surprise to find that the within-group variations of the measured parameters were very similar between the DB and the AL groups. In females, there was slightly less variation in the DB than in the AL groups in relative food consumption and in BMI. In males, absolute water consumption varied less in the DB than in the AL groups. However, in 12 of the 15 comparisons carried out, no statistically significant differences were detected in the within-group variation.
During the course of the study it became obvious that DB could work better with some modifications. In particular the pellets at the board margins are easier for rats to eat than the others, as these could even be detached completely. This could partly explain why DB feeding did not reduce food consumption, BW and BMI as effectively in the females as in the males. The easy-to-access marginal pellets accounted for a larger part of the total food requirements in the smaller rats. Similarly, with two rats in the cage, more of the easy-to-access pellets were available for each individual rat than if they had to be shared among three rats. There also seemed to be some variation in how tightly the pellets adhered to the board, leading to a slightly varying workload. These issues could be tackled by using food that adheres more tightly to the wood, and possibly leaving the board margins empty. Ultimately the functionality of DBs would be better standardized by filling the boards already during the production process, ideally without separate pellets. This also seems the only practical solution suitable for large-scale use, as filling the boards with pellets by hand in the animal facility is laborious and time-consuming.
In conclusion, long-term DB feeding reduced BW and fat tissue significantly; more effectively in males, and to a lesser extent, in females. The DB-fed males ate less than their AL counterparts, but no difference in the total food consumption was seen between the female groups. DB feeding had no consistent effect on within-group variation in BW, skeletal size or food and water consumption. The results of this study indicate that DB feeding is a feasible method, albeit some modifications may be needed to improve and standardize its long-term DR effect, especially for females.
Footnotes
Acknowledgements
The study was financially supported by the European College of Laboratory Animal Medicine (ECLAM) and the European Society of Laboratory Animal Veterinarians (ESLAV) Foundation, the Finnish Cultural Foundation, and Orion–Farmos Research Foundation.
We thank research technician Tuula Stranius, and animal technicians Annemari Lyytinen, Jukka Ketola and Jorma Keinonen for carrying out the DB feeding and measurement procedures.