
Abstract
Objective:
To analyze the diagnostic accuracy of lung ultrasonography (LUS) and high-resolution computed tomography (HRCT), to detect COVID-19.
Materials and Methods:
This study recruited all patients admitted to the emergency medicine unit, due to a suspected COVID-19 infection, during the first wave of the COVID-19 pandemic. These patients also who underwent a standardized LUS examination and a chest HRCT. The signs detected by both LUS and HRCT were reported, as well as the sensitivity, specificity, positive predictive value, and negative predictive value for LUS and HRCT.
Results:
This cohort included 159 patients, 101 (63%) were diagnosed with COVID-19. COVID-19 patients showed more often confluent subpleural consolidations and parenchymal consolidations in lower lung regions of LUS. They also had “ground glass” opacities and “crazy paving” on HRCT, while pleural effusion and pulmonary consolidations were more common in non-COVID-19 patients. LUS had a sensitivity of 0.97 (95% CI 0.92–0.99) and a specificity of 0.24 (95% CI 0.07–0.5) for COVID-19 lung infections. HRCT abnormalities resulted in a 0.98 sensitivity (95% CI 0.92–0.99) and 0.1 specificity (95% CI 0.04–0.23) for COVID-19 lung infections.
Conclusion:
In this cohort, LUS proved to be a noninvasive, diagnostic tool with high sensitivity for lung abnormalities that were likewise detected by HRCT. Furthermore, LUS, despite its lower specificity, has a high sensitivity for COVID-19, which could prove to be as effective as HRCT in excluding a COVID-19 lung infection.
Since SARS-CoV-2 spread worldwide, many published studies have dealt with the ideal thoracic diagnostic technique for detecting coronavirus disease (COVID-19). Due to its low cost and high availability, chest radiography is usually the first choice as an imaging technique in patients with suspected pulmonary disease, especially in the emergency department (ED)1–5; however, as Ebrahimzadeh et al 6 reported, a chest radiograph has low sensitivity and specificity in detecting interstitial abnormalities, and has a lack of excluding lung involvement, with SARS-CoV-2 infections. Chest high-resolution computed tomography (HRCT) is the diagnostic imaging technique with the highest sensitivity for lung diseases, precisely defining the extent of lung involvement, with or without the intravenous contrast media.7–9 During the COVID-19 pandemic, the use of chest HRCT has rapidly and massively entered clinical practice causing several radiology services to become overburdened, 10 despite its liberal use in COVID-19 was not recommended by the American College of Radiology. 11 Lung ultrasonography (LUS) is a relatively recent diagnostic technique that can distinguish a wide range of diseases by studying the artifacts generated by the subpleural parenchyma.12–14 Technologic evolution and the production of even smaller and more portable ultrasound equipment systems have facilitated the use of point of care ultrasonography (POCUS), that is, the use of ultrasonography as a part of the bedside physical examination. 15 In a pandemic, due to a highly infectious disease, early diagnosis and correct prognostication are of the utmost importance. At the same time, the use of LUS, due to its advantages, is rapidly increasing both in the ED and in the inpatient setting for early triage and follow-up of suspected and confirmed COVID-19 patients.16–21 However, more than 2 years after the first identified case of SARS-CoV-2, 21 the diagnostic accuracy of each imaging technique and the relationship between LUS and chest HRCT is debated. The most recent Cochrane review on thoracic imaging in COVID-19 6 reports high sensitivity and low/moderate specificity for both LUS and HRCT. However, according to the authors, future diagnostic accuracy studies should predefine positive imaging findings and include direct comparisons of the various imaging techniques, within the same participant population, to make definitive conclusions for each diagnostic tool.
The objective of this study was to report the lung abnormalities detected by LUS and chest HRCT in a cohort of patients admitted for suspected COVID-19. In addition, it was important to analyze the accuracy of LUS in the detection of lung abnormalities, found with HRCT, and compare the accuracies of these imaging techniques, in diagnosing an SARS-CoV-2 infection.
Materials and Methods
This was a retrospective, single-center study conducted at the ED of Maggiore Carlo Alberto Pizzardi hospital in Bologna, Emilia Romagna, Italy. This ED has greater than 80 000 patient visits per year and has an associated 700 inpatients bed hospital. It has been identified as a national referral center for intensive care during pandemics and it is a training center for teaching emergency ultrasonography. It is one of the first units to implement an LUS standardized scanning approach for evaluating suspected COVID-19 patients. Patients who were 18 years old or older admitted to the ED, for a suspected SARS-CoV-2 infection, underwent a standardized LUS examination and a chest HRCT. The imaging data was collected between March 1, 2020, and April 30, 2020. The patients in this cohort were evaluated regardless of age, gender, medical status, length of hospitalization, and the need for mechanical ventilation. The exclusion criteria for this study were pregnancy, a HRCT performed greater than 24 hours after or before the LUS, and any missing data. LUS examinations were conducted at admission to the ED, instead, the HRCTs were retrospectively reviewed according to a standardized protocol and the LUS examinations results and clinical data were anonymized. Data about past medical records, signs, presenting symptoms, laboratory test results, final diagnosis, and outcomes were also collected. The COVID-19 diagnosis was made according to the positive results of the reverse transcription-polymerase chain reaction (RT-PCR), for SARS-CoV-2 RNA, from a nasopharyngeal swab. If the result was negative, the nasopharyngeal swab was repeated at least 5 times and, in the case of persistent suspicion of disease, it was also performed with alveolar bronchoscopy fluid. The patients provided verbal informed consent, at the time of the LUS examination. This study was approved by the hospital’s Ethics Committee Broad Area Middle Emilia—Emilia Romagna.
LUS Imaging Protocol
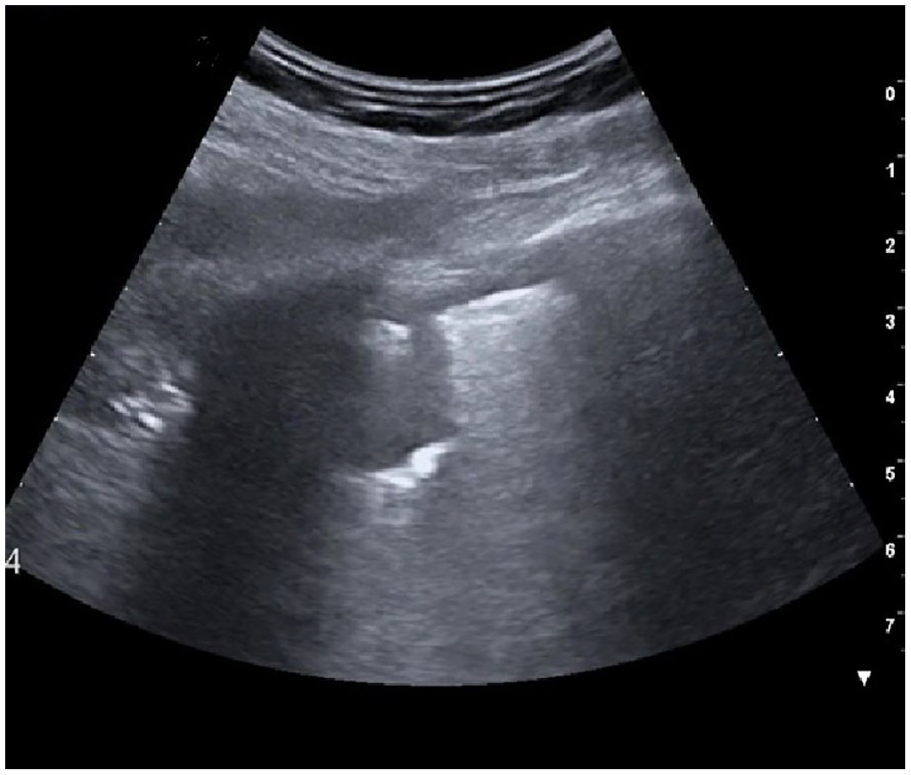
LUS was performed following a standardized protocol, as has been published. 22 Twelve areas were identified, six for each hemithorax bounded by the sternal marginal line, the anterior axillary line, the posterior axillary line, and the dorsal marginal line. The upper and lower sectors were identified by the third intercostal space, for the anterior lateral zones, and the lower scapular edge for the posterior zones. Each thoracic area was scanned entirely with a continuous transducer movement, to identify the following LUS findings: A-pattern: A-lines without other artifacts (see Figure 1A). B-lines: one or no more than three well-isolated B-lines (see Figure 1B); multiple non-confluent B-lines that do not completely erase A-lines (see Figure 2); multiple confluent B-lines that completely erase A-lines (see Figures 3 and 7); isolated subpleural consolidation: in a context of A-pattern, presence of one consolidation <2 cm with a posterior vertical artifact reaching the bottom of the screen without fading, and moving synchronously with lung sliding (see Figure 4); confluent subpleural consolidations (CSpCs): multiple consolidations <2 cm in depth with posterior vertical artifact (see Figures 1 and 5); parenchymal consolidation >2 cm: subpleural consolidation >2 cm in-depth (see Figures 6 and 7); pleural effusion: anechoic fluid within the pleural space; and pleural effusion: anechoic fluid within the pleural space.
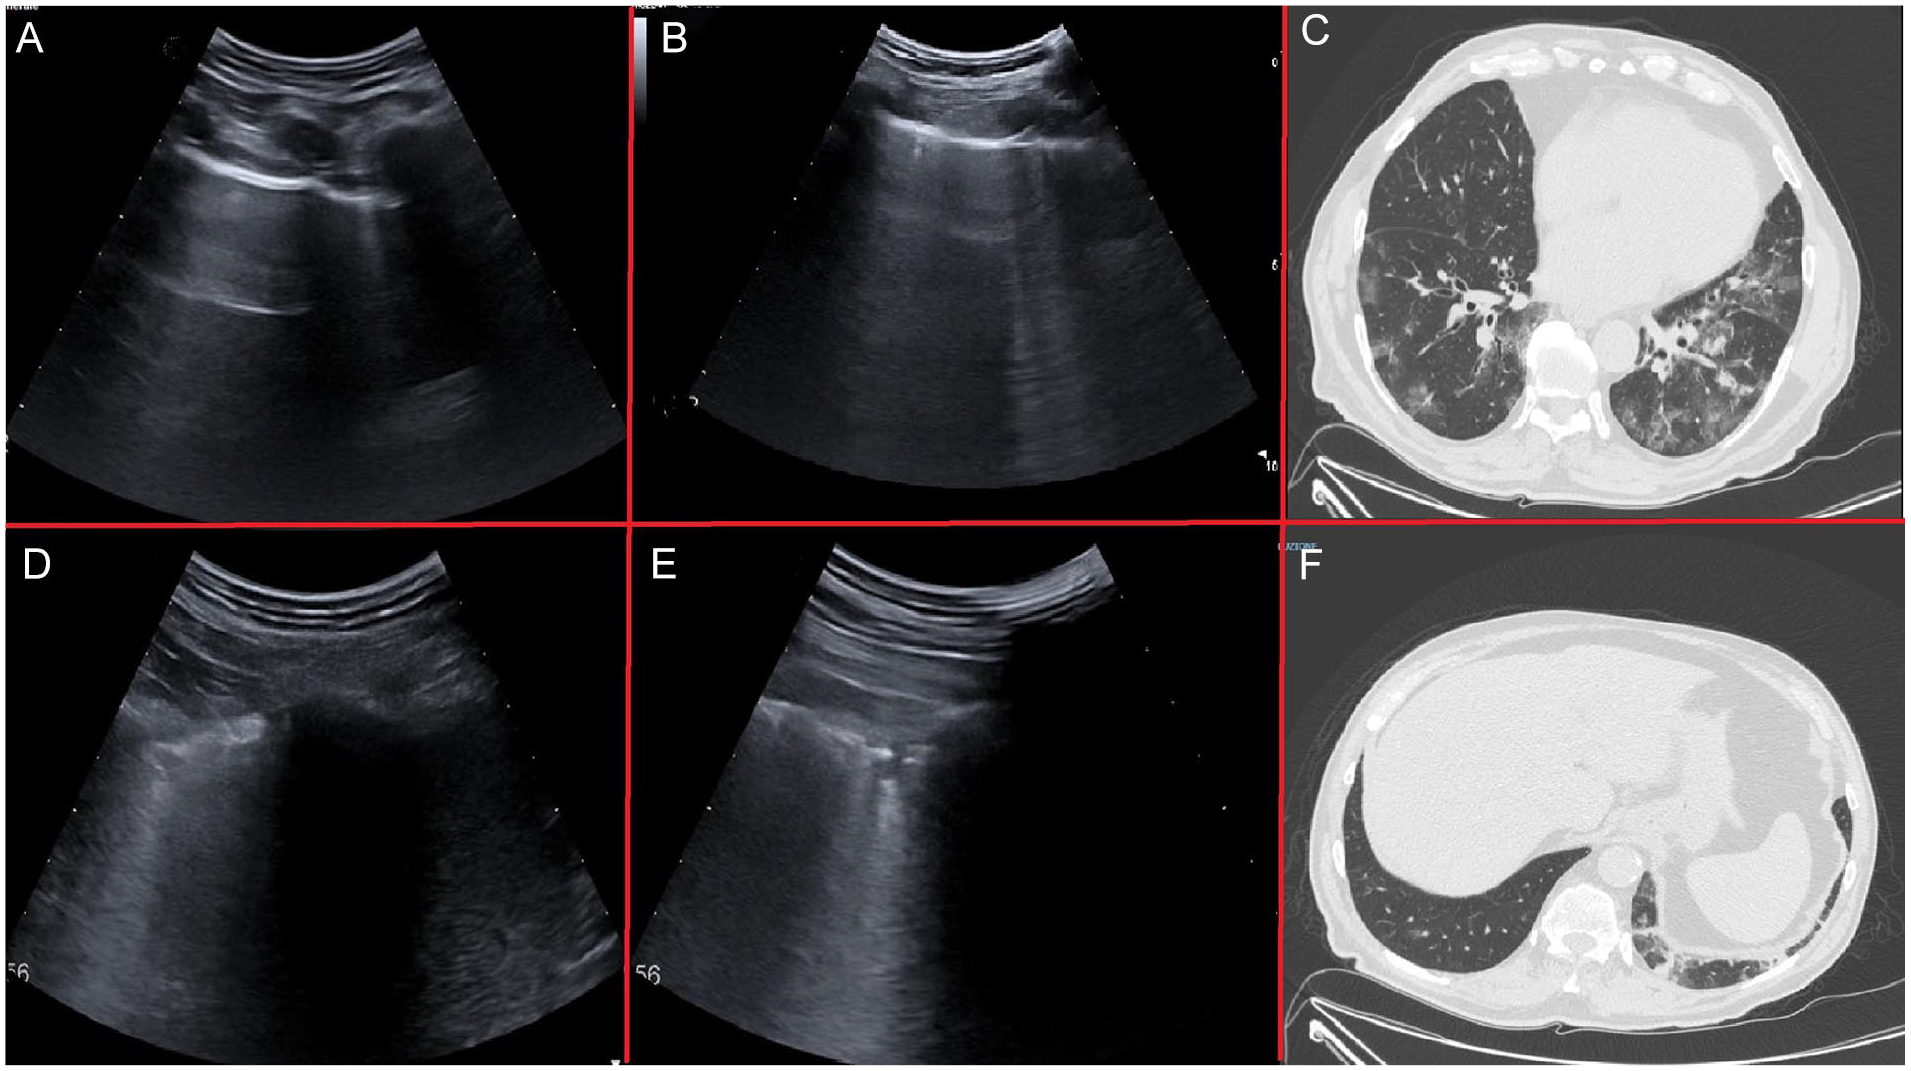
A patient with moderate disease and lung involvement (mainly on the left side) and LUS performed about 5 hours after the HRCT. (A) Demonstrates the lung area designated as L1, showing A-lines with one isolated B-Line. Below the plane of the ribs, a hyper echogenic, regular pleural line is noted to be generating one horizontal reverberation artifact. It is parallel to the pleural line and the so-called A-lines, are visible in depth until the power of the ultrasound beam is exhausted. This is an area with preserved lung ventilation, also referred to “spared area” in a pathological setting. An isolated B-line is visible to the right of the image. (B) Demonstrates the lung areas designated as R3–R4. Non-confluent B-lines are seen extending from the pleural line into the depths obliterating the A-lines on the right of the field of view. (C) A HRCT image is provided, and GGOs are observed in the lateral areas of both lungs. This corresponds to L3–L4 and R3–R4 lung areas on LUS examination. (D and E) Demonstrating the lung area designated L5–L6. The pleural line is seen to be grossly irregular and thickened and appears to overlie several small subpleural thickenings. At the time of examination, these did not appear to converge but were inscribed in areas of high B-line condensation. (F) A HRCT image is provided and, in the posterior, lateral inferior area of the left lung, two small subpleural thickenings are noted which, corresponded to L6 lung are of the LUS examination. GGOs, ground glass opacities; HRCT, high-resolution computed tomogram; LUS, lung ultrasonogram.
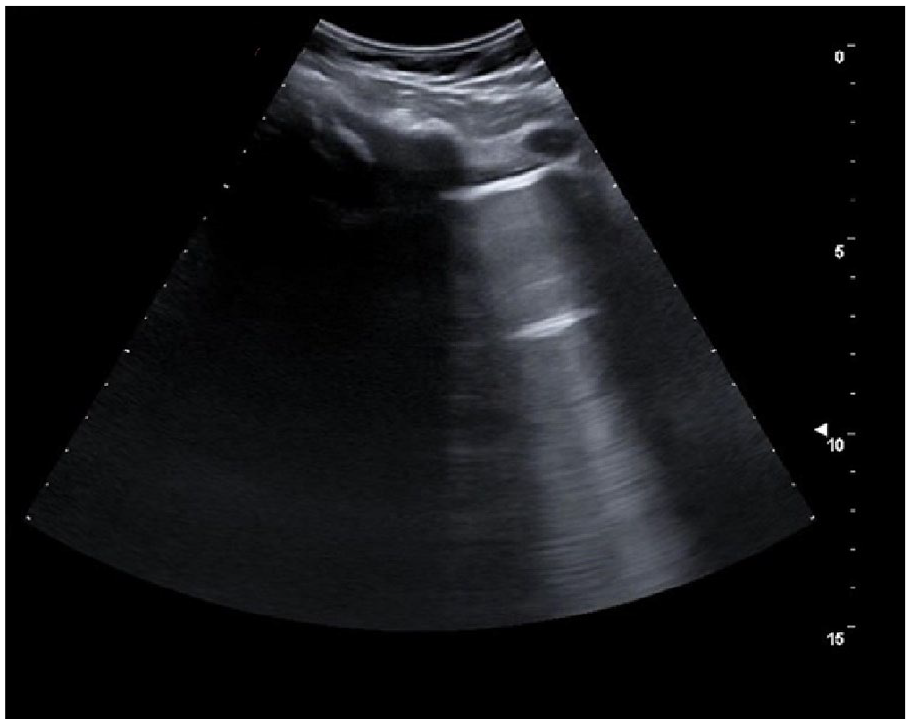
An example lung ultrasonogram that demonstrates non-confluent B-lines. There are faint vertical artifacts persisting up to the full depth of the field of view, but these do not completely erase the normal A-lines.
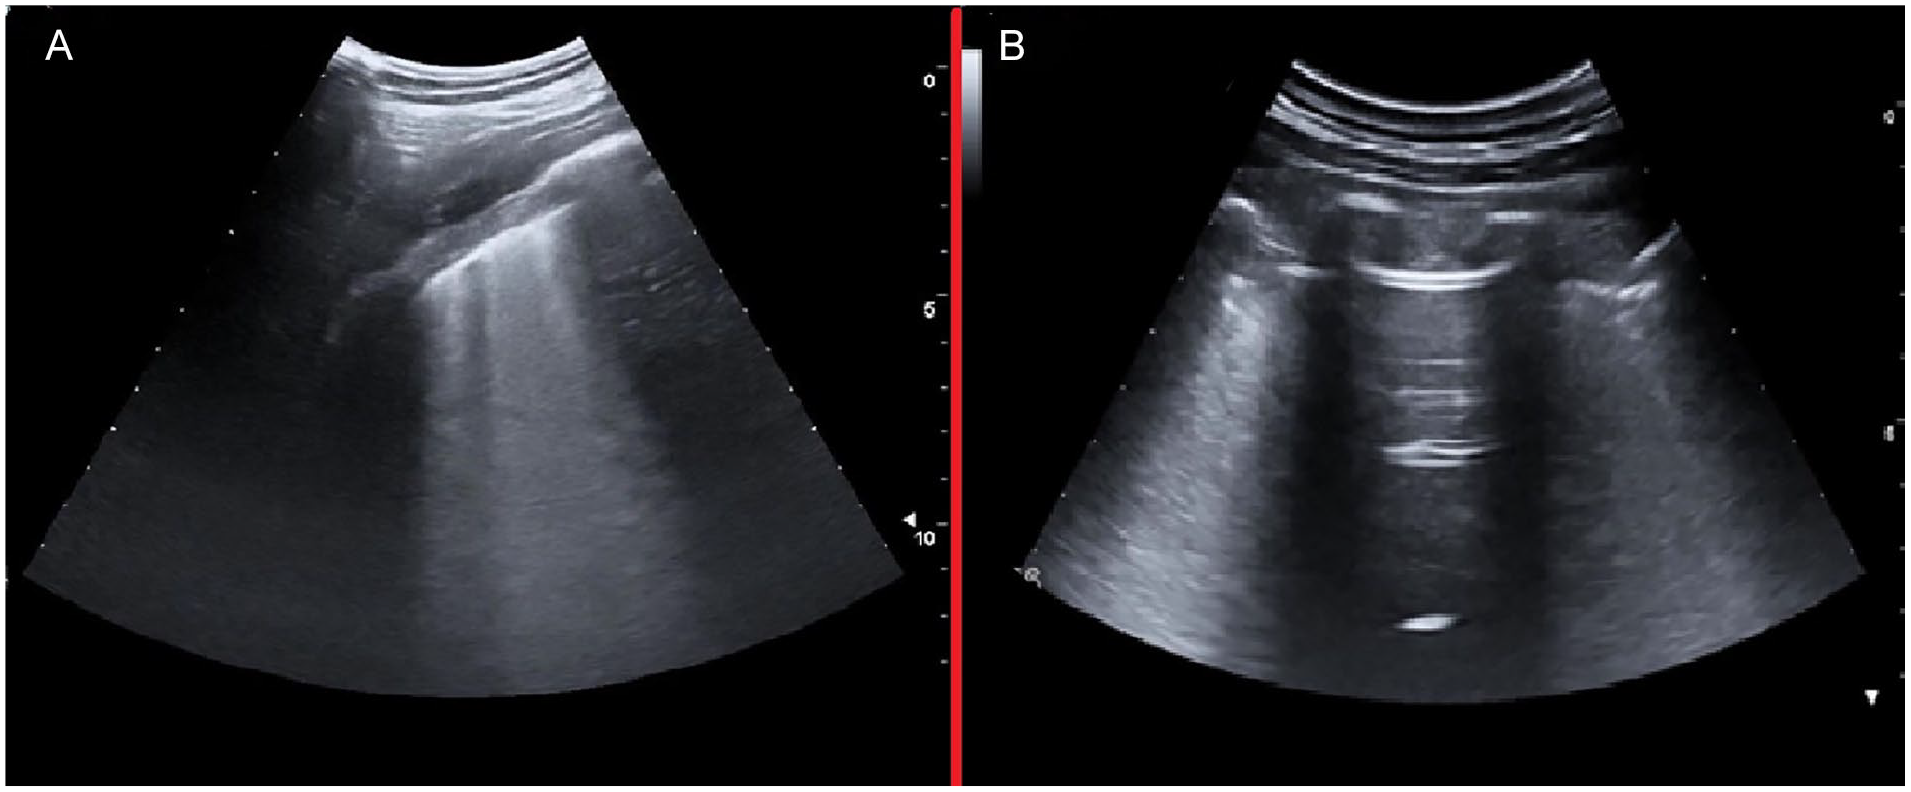
(A) An example lung ultrasonogram that shows one intercostal space that is entirely occupied by multiple confluent B-lines, and this completely erases the normal A-lines. (B) This lung ultrasonogram also demonstrates a normal or “spared area” between two intercostal spaces with confluent B-line artifacts.
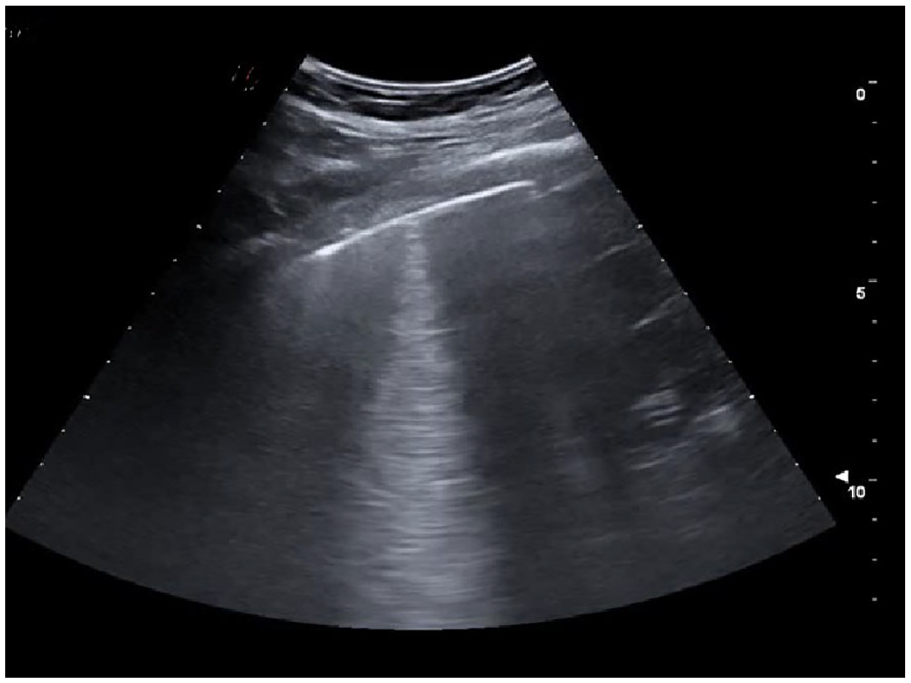
An example lung ultrasonogram that shows an isolated subpleural consolidation. The one consolidation is less than 2 centimeters, with a posterior vertical artifact reaching the bottom of the image without fading. It was noted to dynamically move in synchronicity with lung sliding, in the context of an A-pattern artifact.
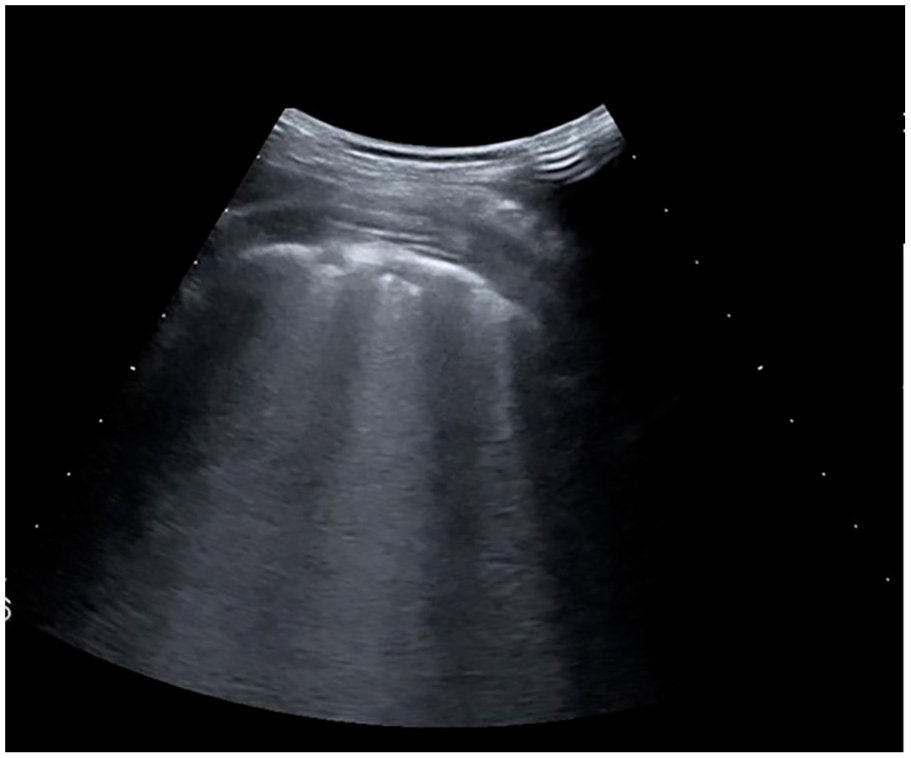
An example lung ultrasonogram that demonstrated a confluent subpleural consolidations (CSpCs). These multiple consolidations, within the lung, were less than 2 centimeters in depth with a posterior vertical artifact, which completely obliterated the underlying lung parenchyma.
An example lung ultrasonogram that demonstrated a subpleural consolidation of less than 2 centimeters.
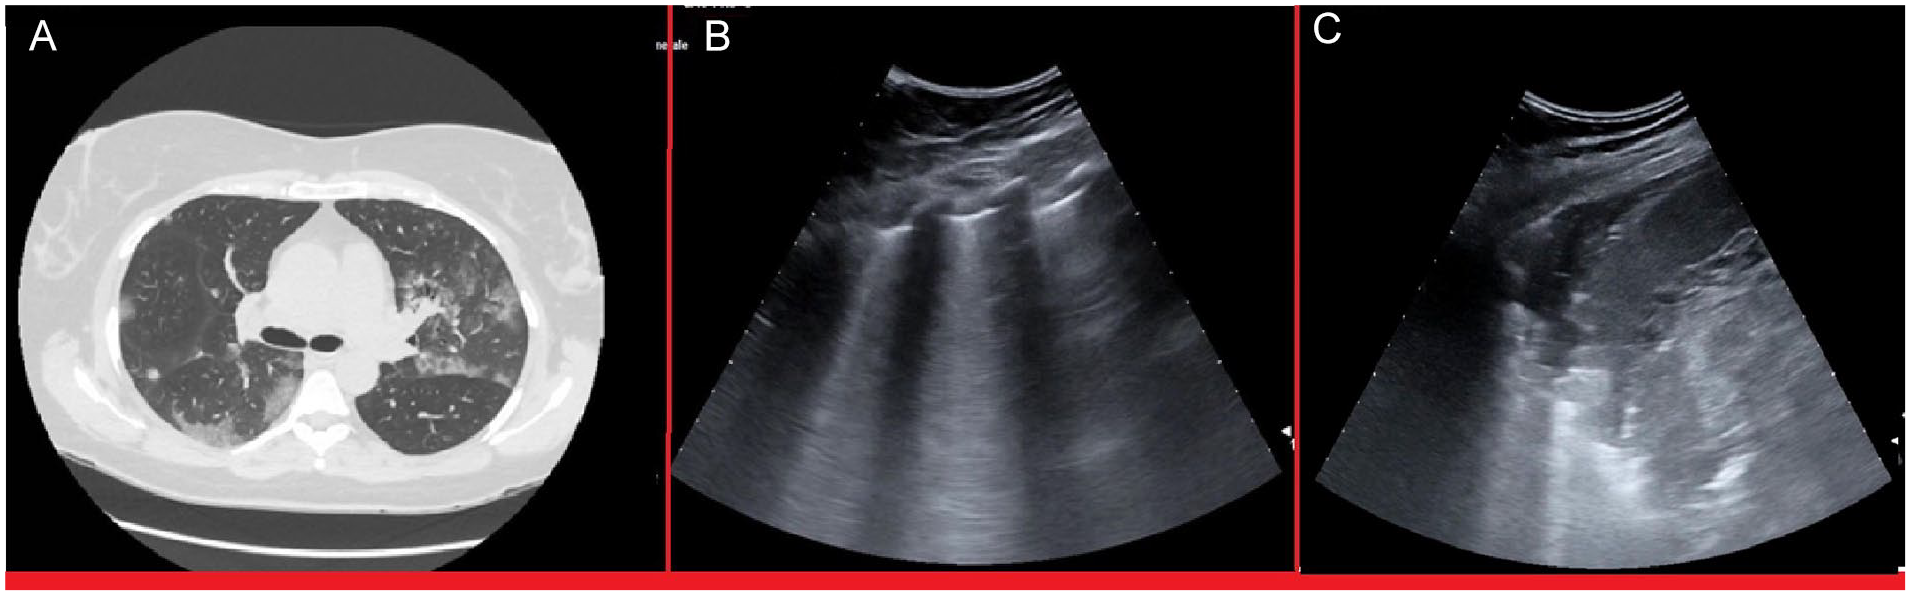
This patient case had to be excluded from the study because of a 48-hour interval time between the HRCT and the LUS. (A) Regardless of excluding this patient, the HRCT is provided. On the HRCT image, at the level of the bifurcation of the trachea, any parenchymal alterations are absent in the left posterior superior area. On this same image, GGOs and normal or “spared areas” are seen in the right posterior and lateral lung areas, as well as in the left lateral lung area. (B) A LUS was performed on this patient 48 hours after the HRCT. On the LUS image, A-lines are seen without other artifacts at L5 (corresponding to the posterior superior area), but multiple B-lines are noted and are otherwise aggregated at the L3 designation. (C) The same LUS image demonstrates a thickening greater than 2 centimeters, at the L4 designation, which corresponds to the lateral lung area on the HRCT. This could represent the evolution of the GGOs artifacts with that lung consolidation. GGOs, ground glass opacities; HRCT, high-resolution computed tomogram; LUS, lung ultrasonogram.
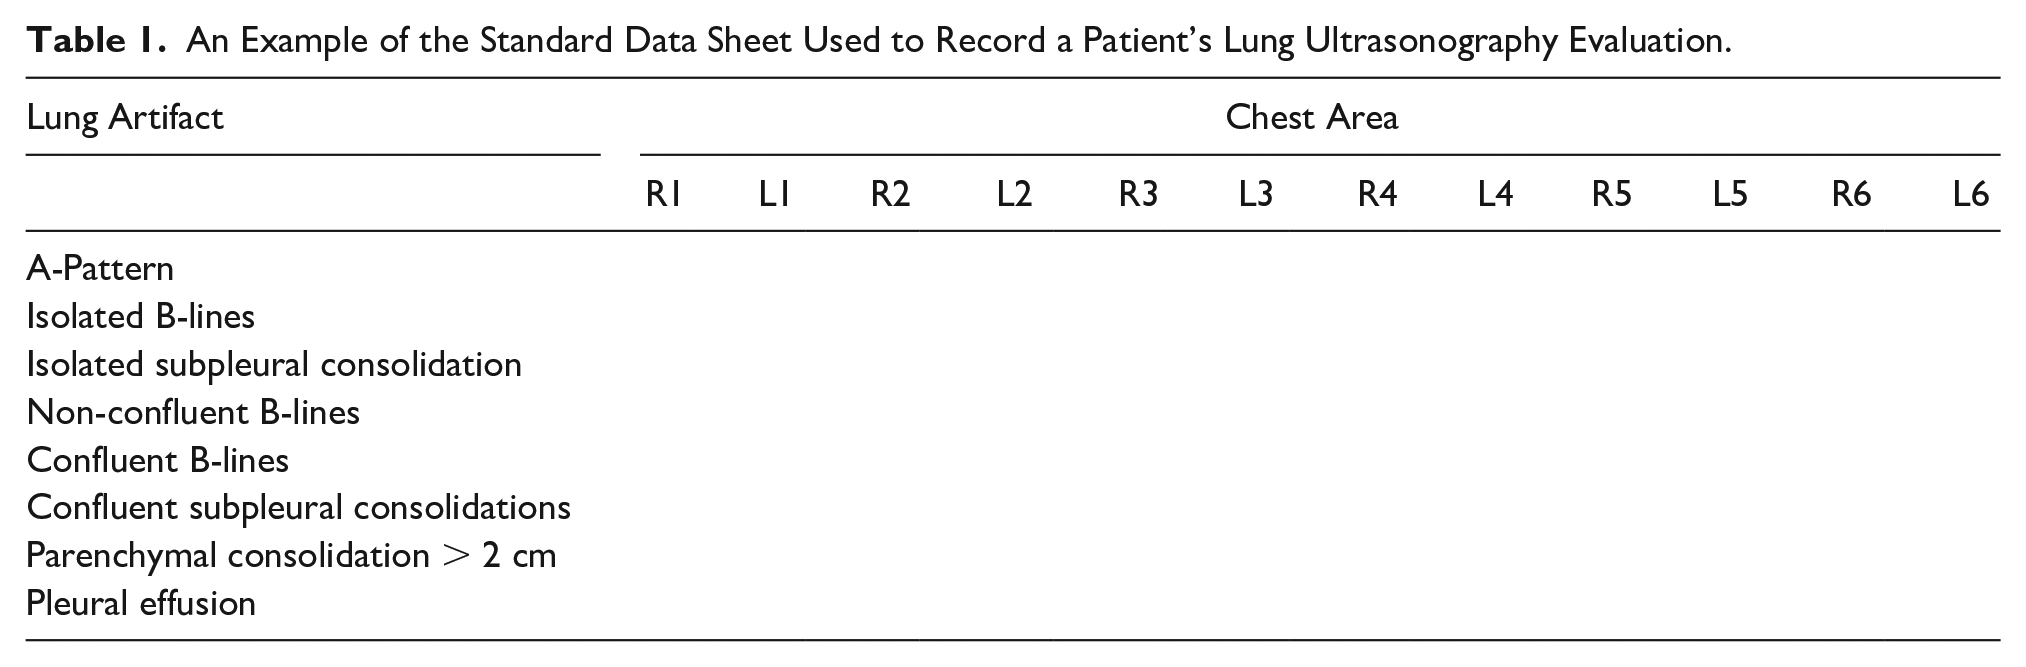
For each LUS examination, a datasheet was used to record the diagnostic findings (see Table 1). All LUS examinations were performed by two emergency physicians with 10 and 2 years of LUS experience. The examinations were completed using an ESAOTE MyLab XPRO30 (Esaote, Via E. Melen, 77 16152 Genova, Italia) ultrasound equipment system and using a convex transducer at 10 ± 3 cm scan depth. The focal zone for imaging was placed at the pleural line.
An Example of the Standard Data Sheet Used to Record a Patient’s Lung Ultrasonography Evaluation.
HRCT Imaging Protocol
To compare the diagnostic findings on HRCT and LUS, standardized exam protocols and a data sheet, per patient, were used (see Table 2). For HRCT, each lung was divided into six zones: anterior, lateral, and posterior zones that were defined according to the longitudinal plane of the trachea. They were further characterized as upper and lower areas in a transverse plane, passing through the tracheal carina. For each lung zone, all observed parenchymal alterations were defined as follows 23 : “Ground-glass opacity” (GGO, an area of hazy increased lung opacity, with preservation of bronchial and vascular margins); “Crazy paving” pattern (thickened interlobular septa and intralobular lines superimposed on a background of GGO); pulmonary consolidation (homogeneous increase in pulmonary parenchymal attenuation that obscures the margins of vessels and airway walls), with or without air bronchogram (pattern of air-filled bronchi on a background of opaque airless lung); “Tree in bud” pattern (centrilobular branching structures that reflects a spectrum of endo- and peribronchiolar disorders); “Honeycombing” (clustered cystic air spaces, typically of comparable diameters on the order of 3–10 mm, subpleural and with well-defined walls, for example, fibrotic lung); smooth interlobular septal thickening (disease affecting one of the components of the septa may be responsible for thickening and so render septa visible, for example, pulmonary oedema); and pleural effusion. For GGO, Crazy Paving and pulmonary consolidation, the involvement of the pleura was specified. All HRCT examinations were performed in the supine position during end-inspiration. A 64-section Ingenuity Core CT equipment system (Philips Medical Systems, Cleveland, OH, USA) was used. The system was operated using a tube voltage of 120 kVp; tube current modulation 120–250 mAs; spiral pitch factor 0.609; matrix 512 (mediastinal window), and 1024 (lung window). CT imaging was acquired with a standard kernel and soft tissue window (400 widths; 20 centers), and a reconstruction for parenchyma (section thickness 1 mm; section interval 0.5 mm) using a sharp kernel and lung window (1600 width; − 600 centers). All images were anonymized as to the results of the SARS-CoV-2 swab and final diagnosis, retrospectively re-evaluated, and recorded on the data sheet by two radiologists with greater than 15 years of chest HRCT experience.
An Example of the Standard Data Sheet Used to Record a Patient’s Chest HRCT Evaluation.
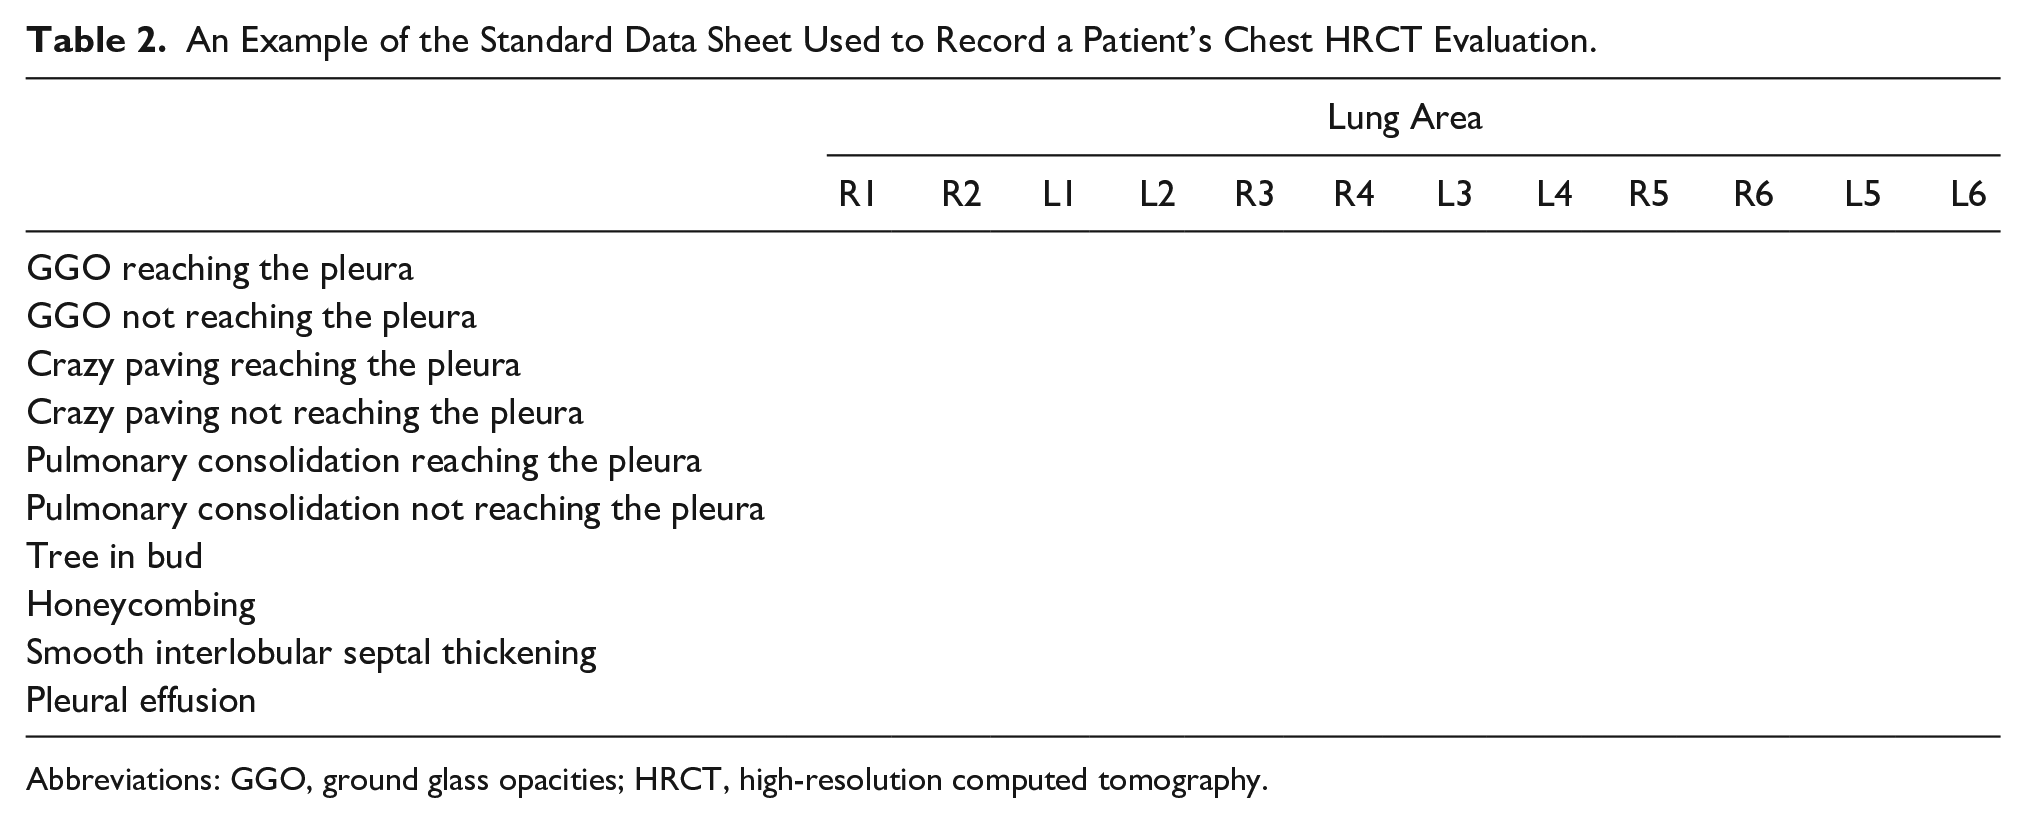
Abbreviations: GGO, ground glass opacities; HRCT, high-resolution computed tomography.
Statistical Analysis
Normally distributed data were described as mean and standard deviation (SD); not normally distributed data were described as the median and interquartile range (IQR); categorical data were reported as absolute numbers and percentages. Normally distributed data were compared via independent sample t test or Welch’s t test in case of unequal variance between groups. Not normally distributed data were compared via Mann–Whitney U test. Pearson’s chi-square test was used to compare categorical dependent variables among at least two independent groups. 2 * 2 contingency tables were created to calculate sensitivity, specificity, positive predictive value (PPV), and negative predictive value (NPV). Statistical analyses were performed using SPSS v 23 (Apache Software Foundation, Chicago, IL, USA) and MedCalc Version 17.6 (MedCalc Software BVBA).
Results
There were 182 patients selected to enter the study, however only 159 were included. No patients were excluded for pregnancy, three patients were excluded for non-available HRCT images, four were excluded due to non-available standard LUS data, and 16 patients had greater than 24 hours between their LUS and HRCT. Descriptively, there 105 (66%) male patients, and 54 (33%) were female, with a mean age of 64.6 years (SD 16.6). There were 101 patients that had a final diagnosis of COVID-19 (63.55%) and 23 (14.4%) died in the hospital. COVID-19 patients presented more often with fever, cough, and dyspnea; had lower white blood count, platelets, and higher C-reactive protein, IL-6, lactate dehydrogenase (LDH), and ferritin levels. Moreover, at arterial blood gas analysis COVID-19 patients showed higher levels of pH and lower levels of pCO2, pO2, SO2, and P/F ratio (see Table 3). The LUS examination demonstrated that COVID-19 patients had more confluent B lines and subpleural confluent consolidations in both right and left lateral thoracic regions, while only subpleural consolidations were more present in the posterior thoracic regions. A pleural effusion was more common in non-COVID-19 patients (see Table 4). With HRCT, COVID-19 patients showed more GGO in both anterior regions; GGO and crazy paving were more frequently in both lateral regions and posterior regions. Conversely, non-COVID-19 patients showed more frequently pulmonary consolidation and pleural effusion (see Table 5). COVID-19 patients had more frequently a positive LUS for any sign (97.8% vs 90%, P value = .04), with more frequent involvement of the left lateral lobe and left and right posterior lobes. HRCT was positive more often in COVID-19 patients (94.6% vs 76%, P value 0.01), with greater involvement in all lung areas (see Table 6). Globally, LUS showed a sensitivity of 0.98 (95%CI 0.92–0.99), a NPV of 0.71 (0.31–0.94), a PPV of 0.67 (95% CI 0.58–0.74) and a specificity of 0.1 (95% CI 0.04–0.23) for COVID-19, while the HRCT showed a sensitivity of 0.94 (95% CI 0.87–0.97), a NPV of 0.71 (0.44–0.88), a PPV of 0.69 (95% CI 0.61–0.77), and a specificity of 0.24 (95% CI 0.14–0.38) (see Table 7). When considering LUS’s ability to detect the lesions found on HRCT, LUS showed a sensitivity of 0.69 and 0.75 for the lesions in the left and right anterior lung areas, respectively; 0.87 and 0.85 for those in the left and right lateral ones, respectively; and 0.97 and 0.97 for those in the posterior regions, respectively. Specificity varies from 0.34 and 0.24 for the posterior regions to 0.58 and 0.6 for the anterior regions. Overall, LUS showed a 0.97 sensitivity (95% CI 0.92–0.99) and a 0.24 specificity (95% CI 0.07–0.5) with 0.9 (95% CI 0.83–0.94) PPV and 0.57 (0.2–0.88) NPV (see Table 8), for pulmonary lesions detected by HRCT.
The Descriptive Statistics Based on the General Characteristics of the Study Patients.
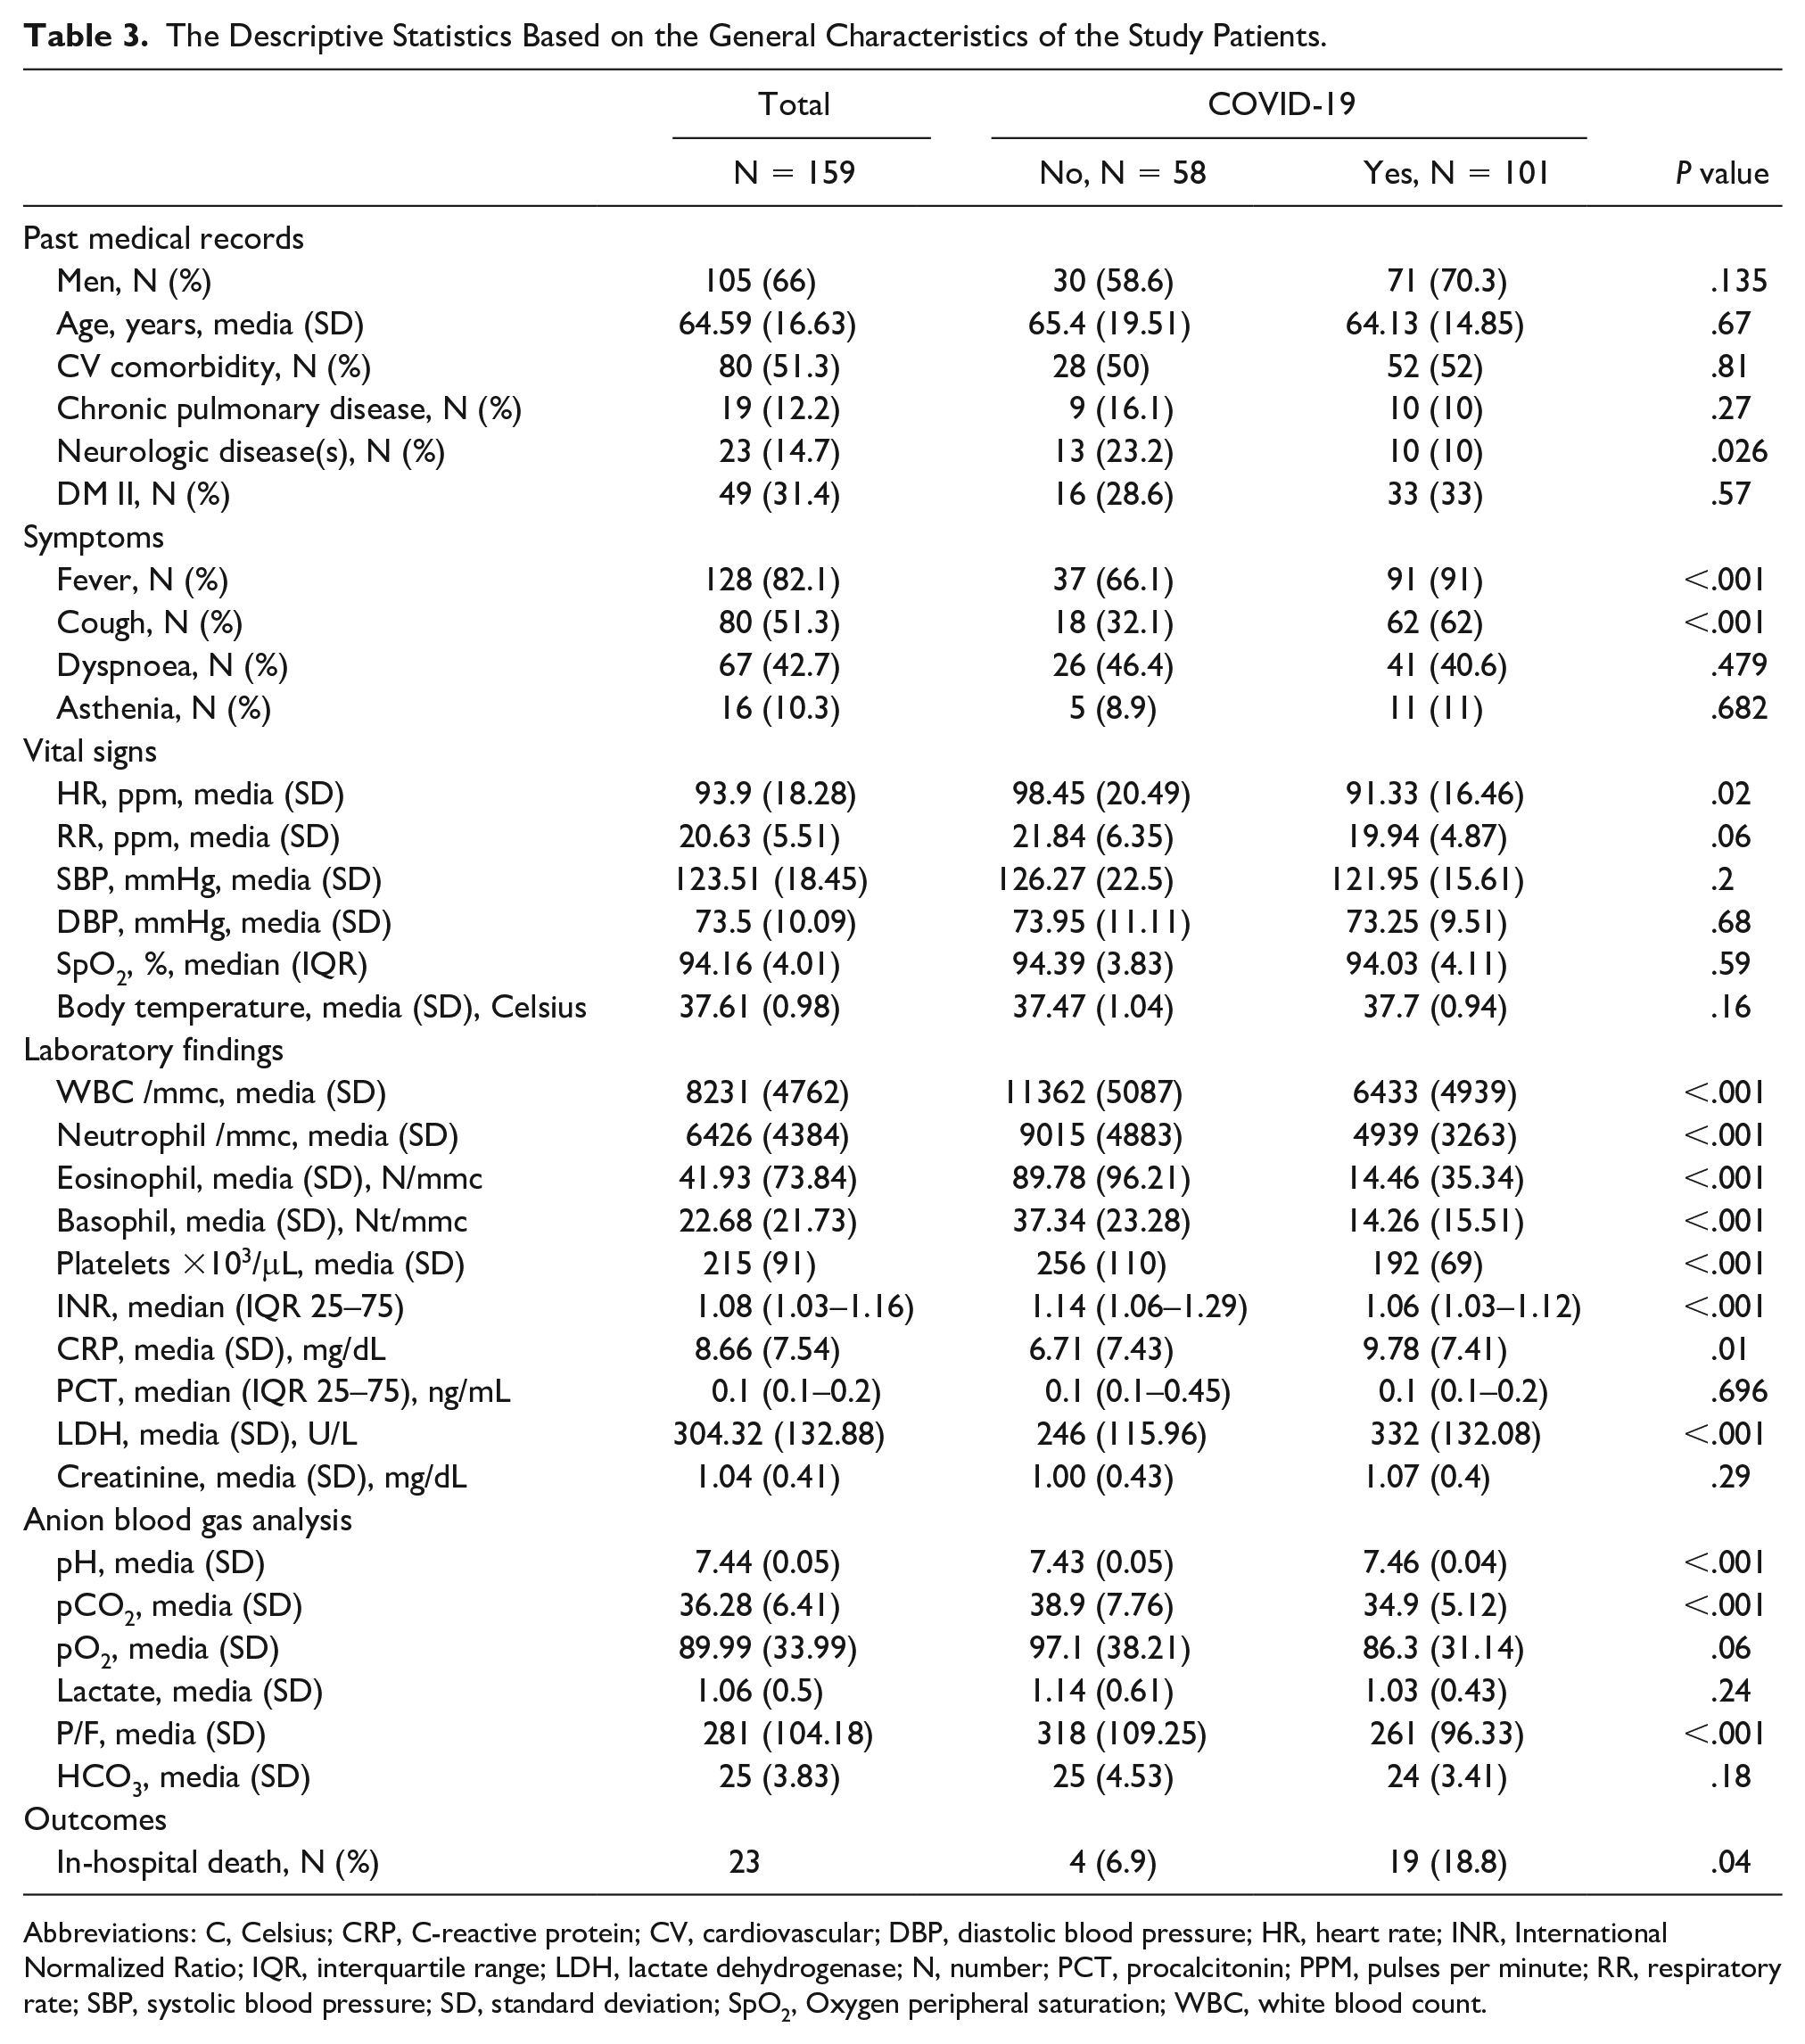
Abbreviations: C, Celsius; CRP, C-reactive protein; CV, cardiovascular; DBP, diastolic blood pressure; HR, heart rate; INR, International Normalized Ratio; IQR, interquartile range; LDH, lactate dehydrogenase; N, number; PCT, procalcitonin; PPM, pulses per minute; RR, respiratory rate; SBP, systolic blood pressure; SD, standard deviation; SpO2, Oxygen peripheral saturation; WBC, white blood count.
The Distribution of the Data Generated During the Lung Ultrasonography Examinations.
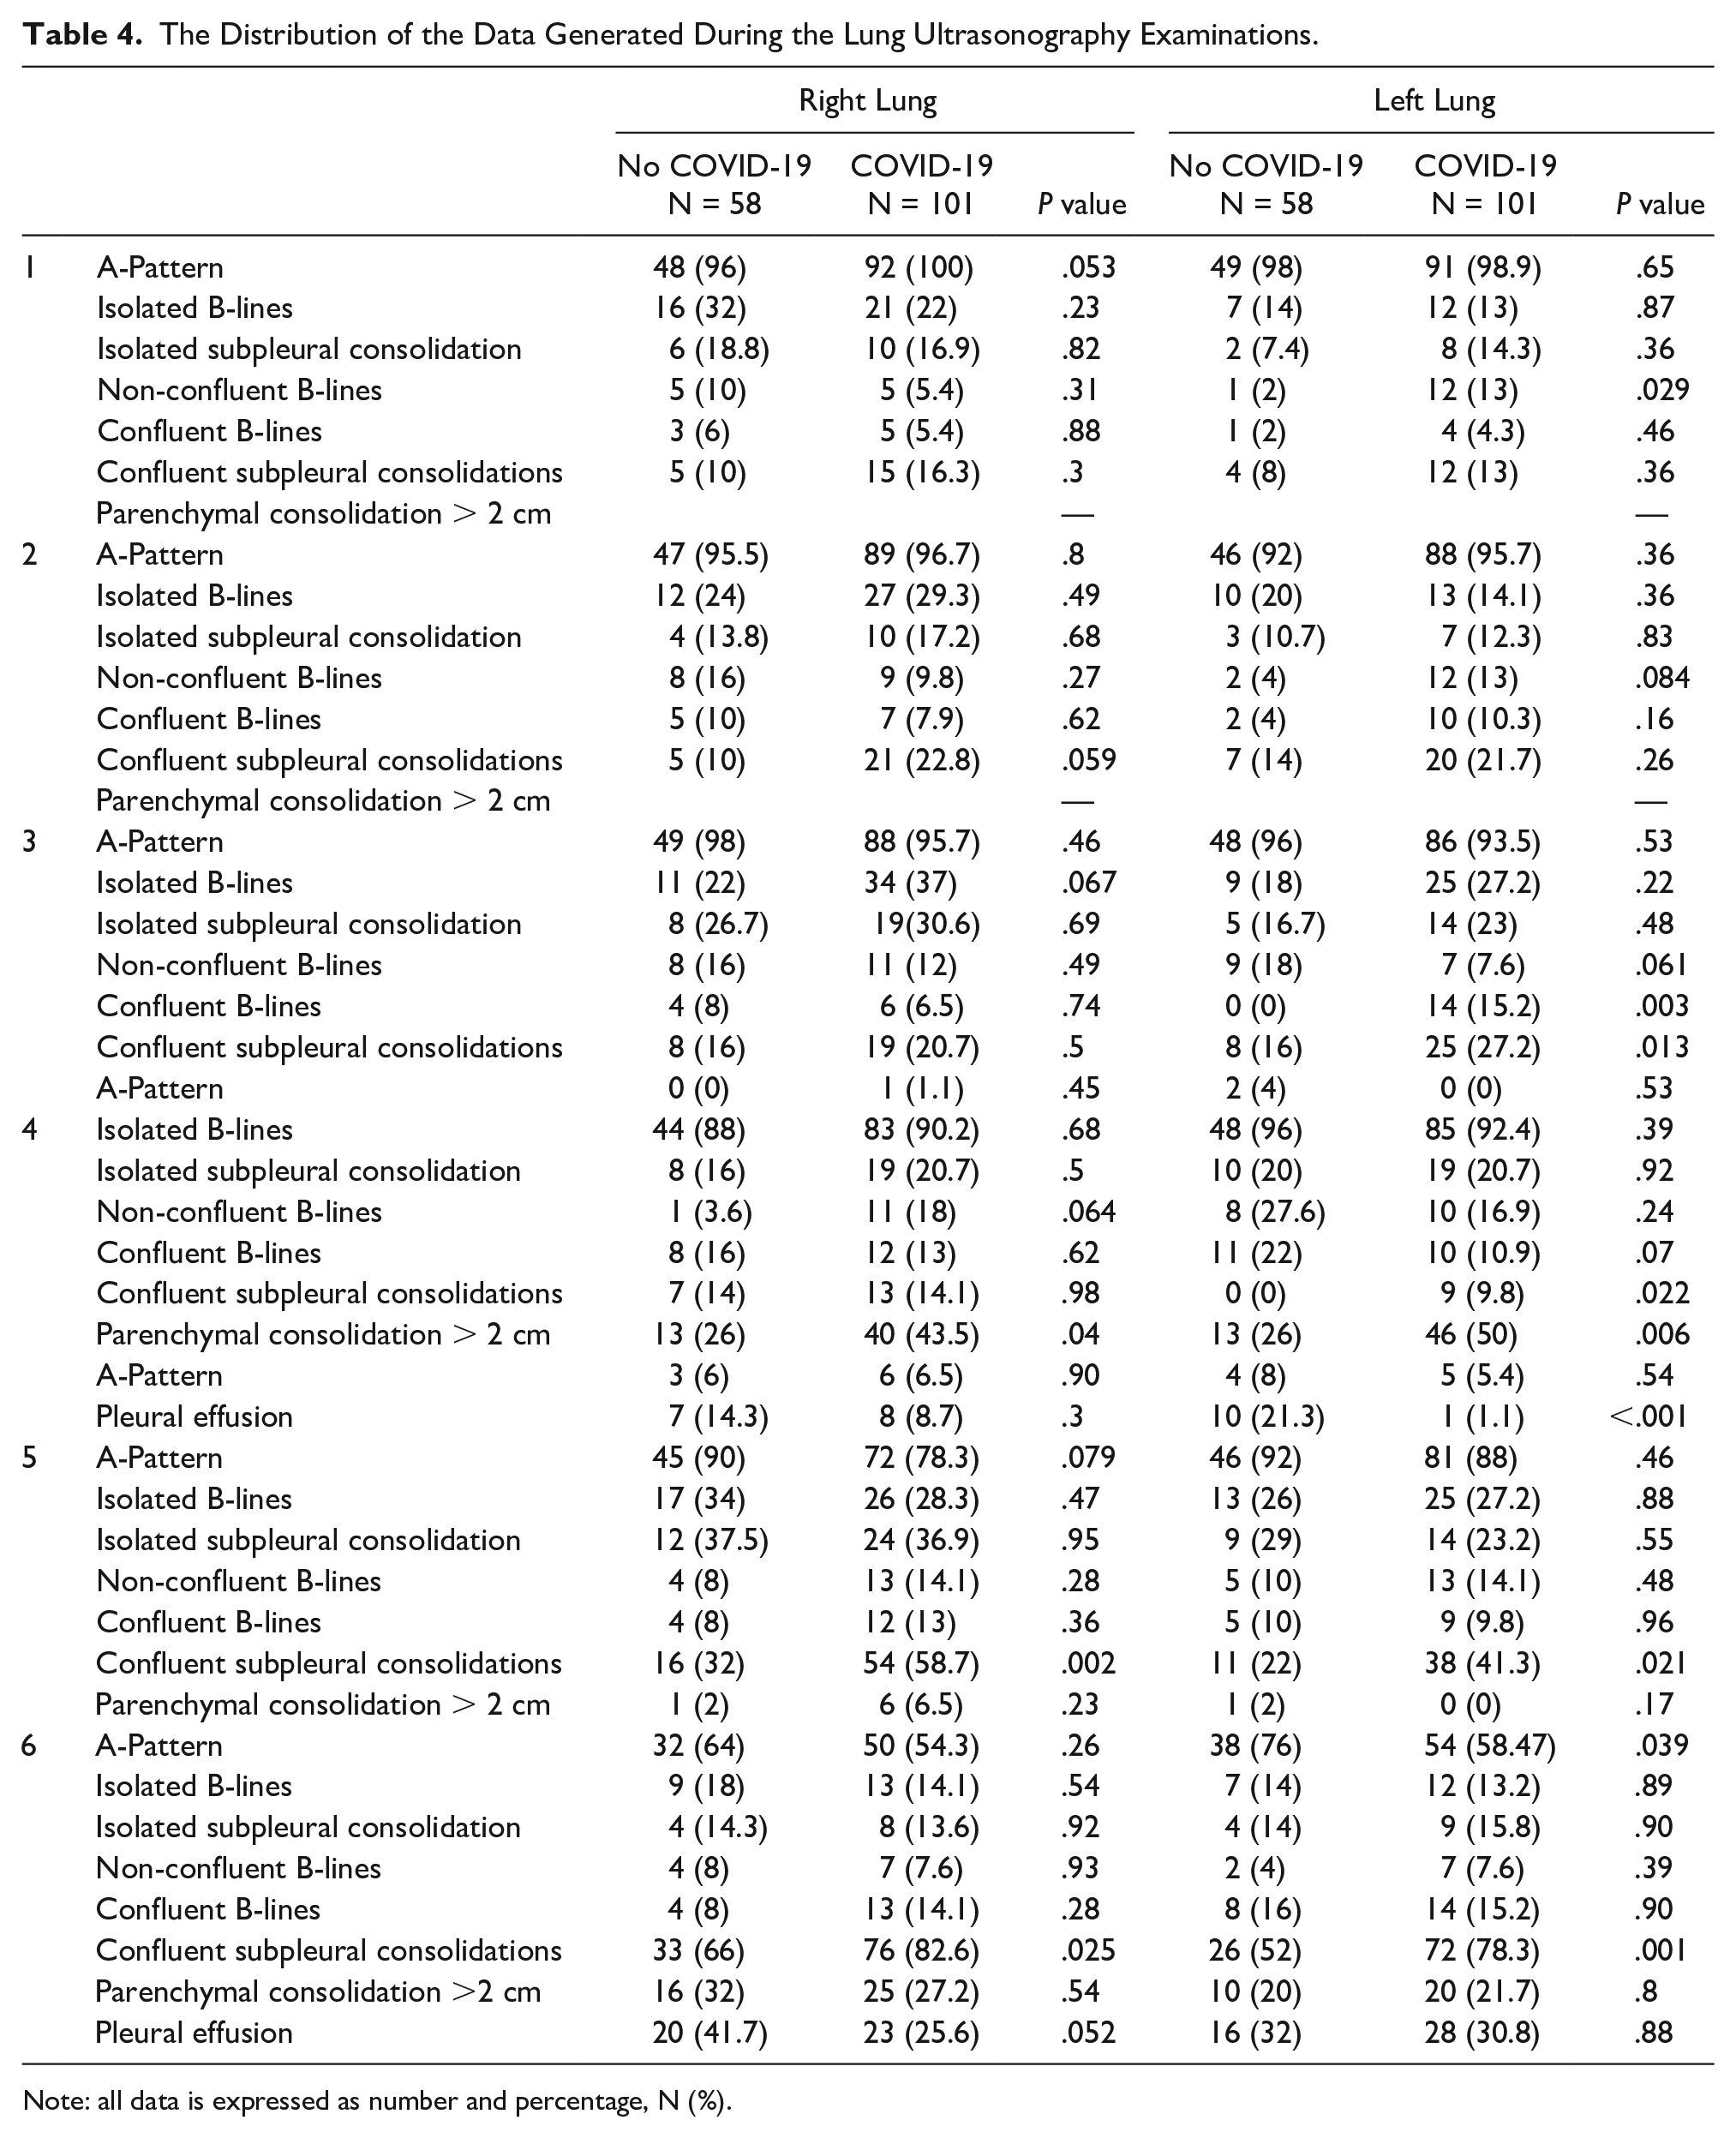
Note: all data is expressed as number and percentage, N (%).
The Distribution of the Data Generated During the Chest HRCT Examinations.
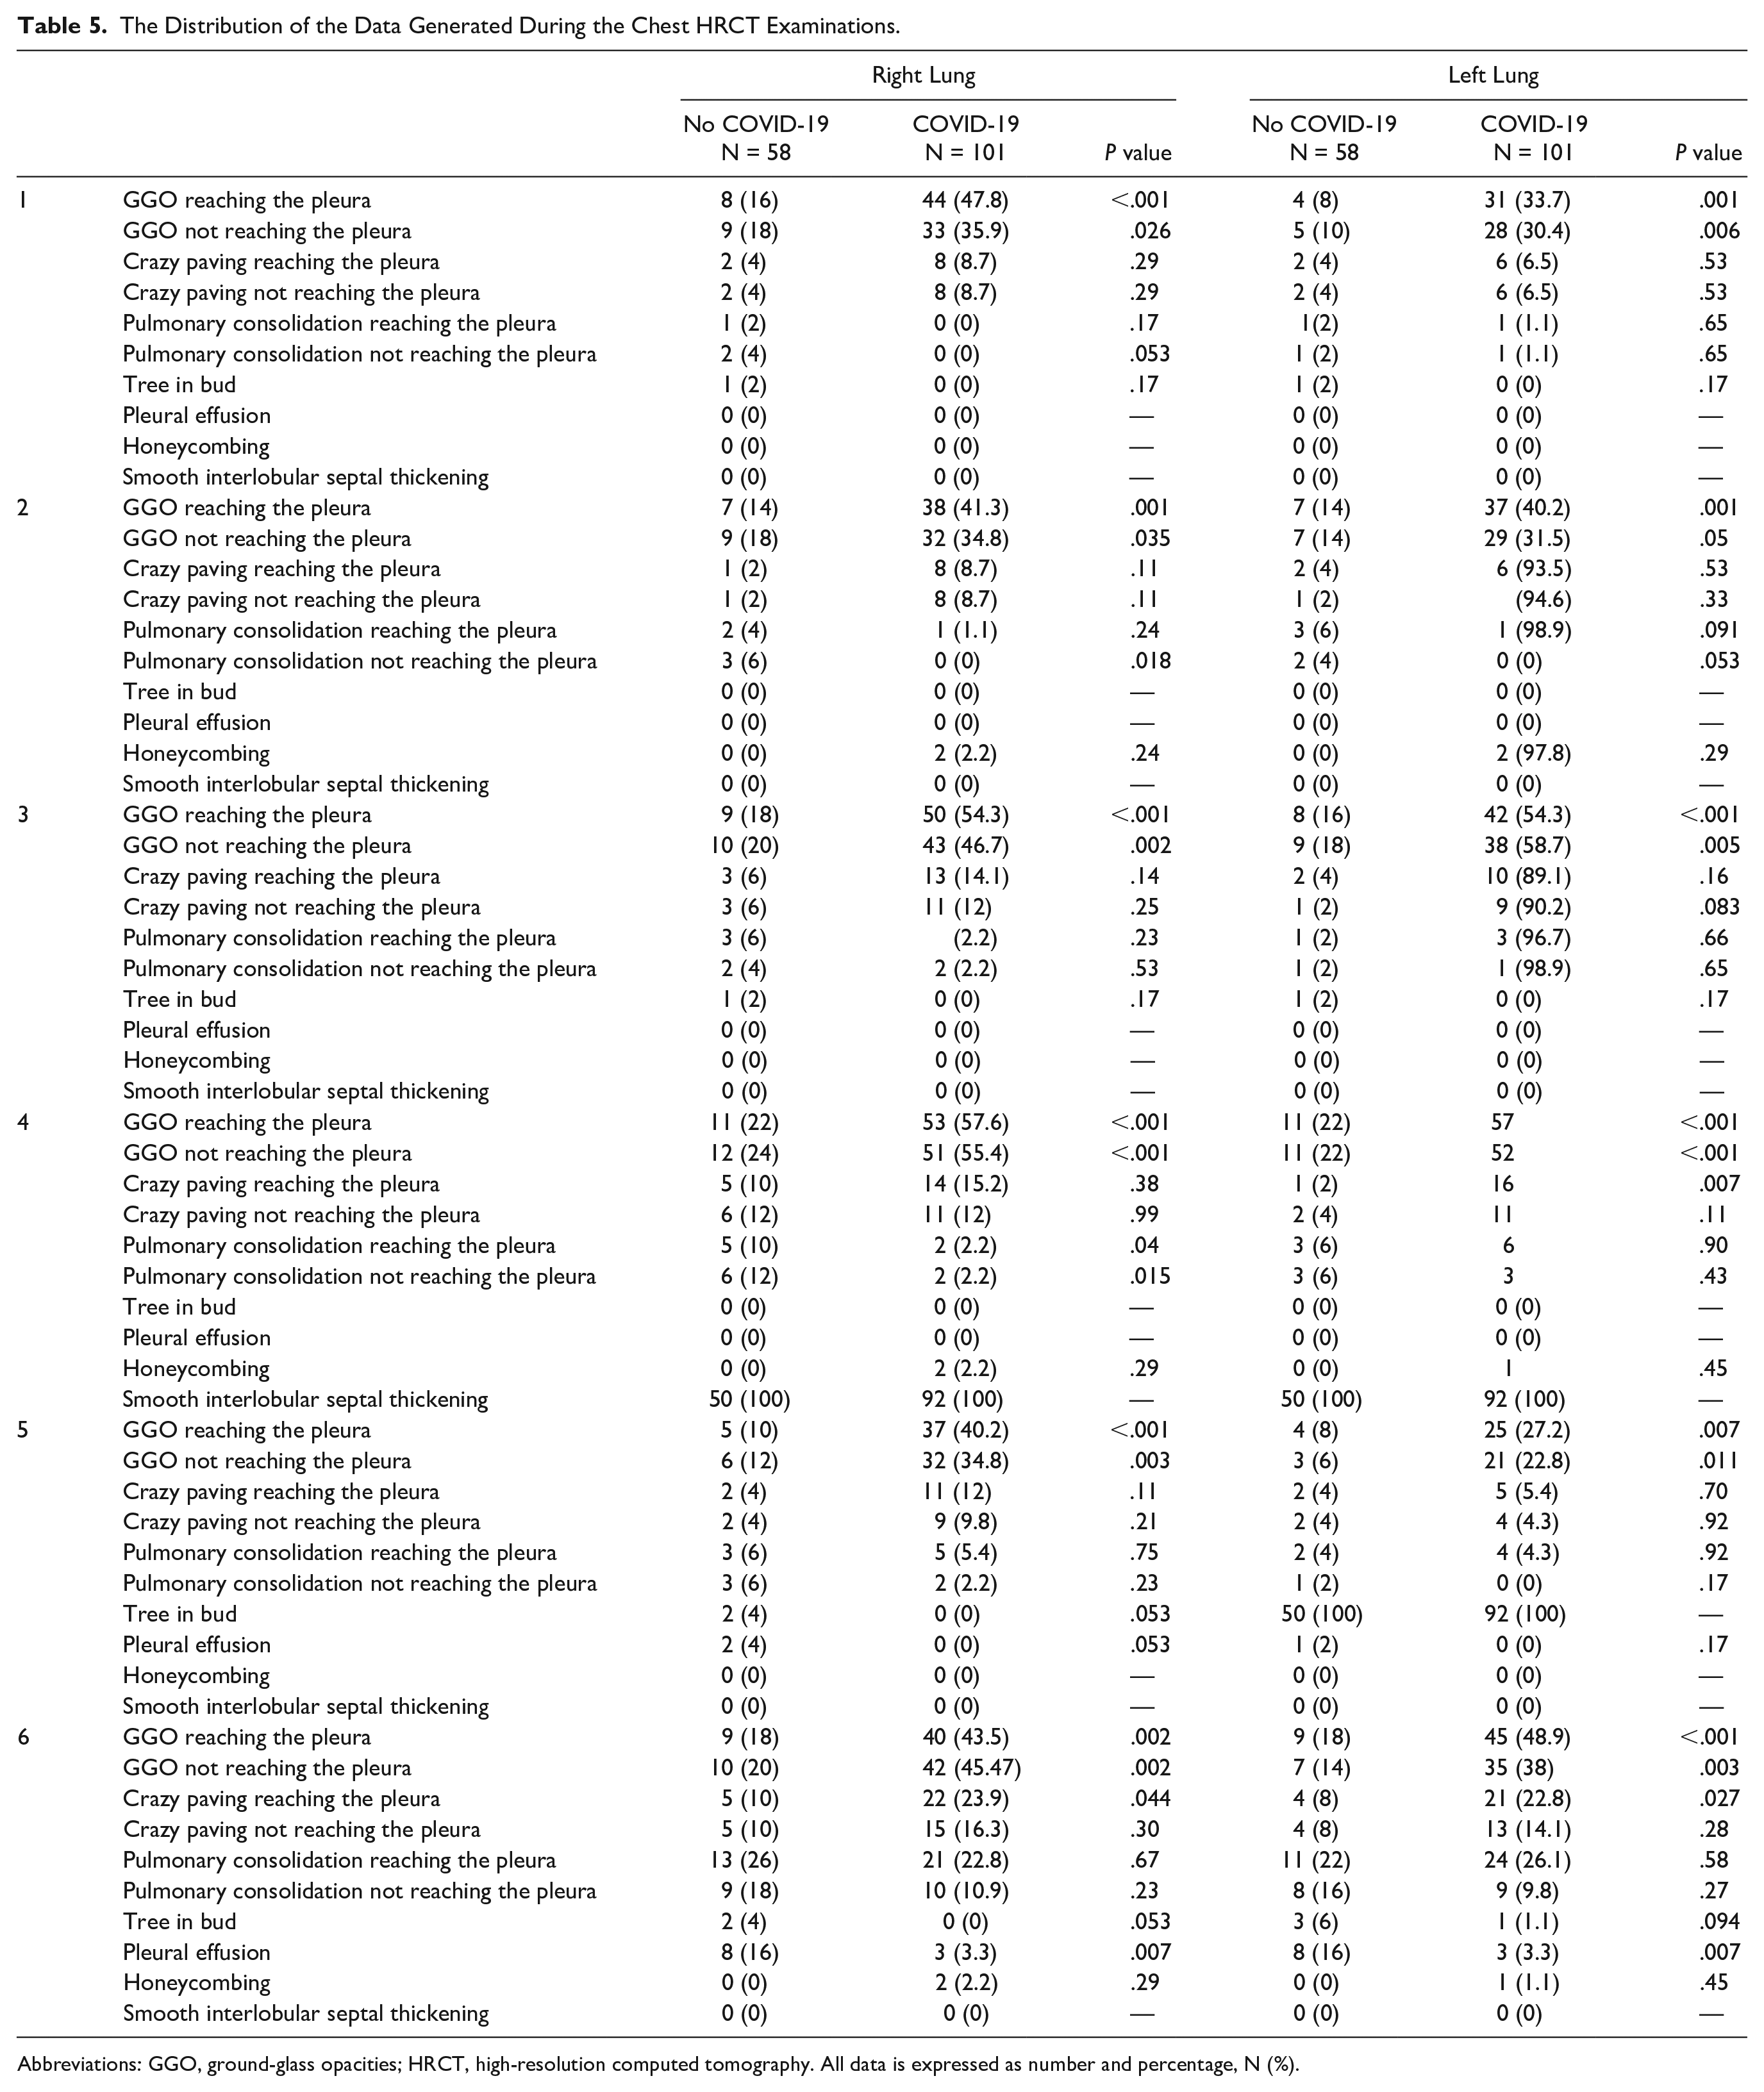
Abbreviations: GGO, ground-glass opacities; HRCT, high-resolution computed tomography. All data is expressed as number and percentage, N (%).
The Presence of the Diagnostic Findings, in Each Area of the Chest, Utilizing Lung Ultrasonography and High-Resolution Computed Tomography.
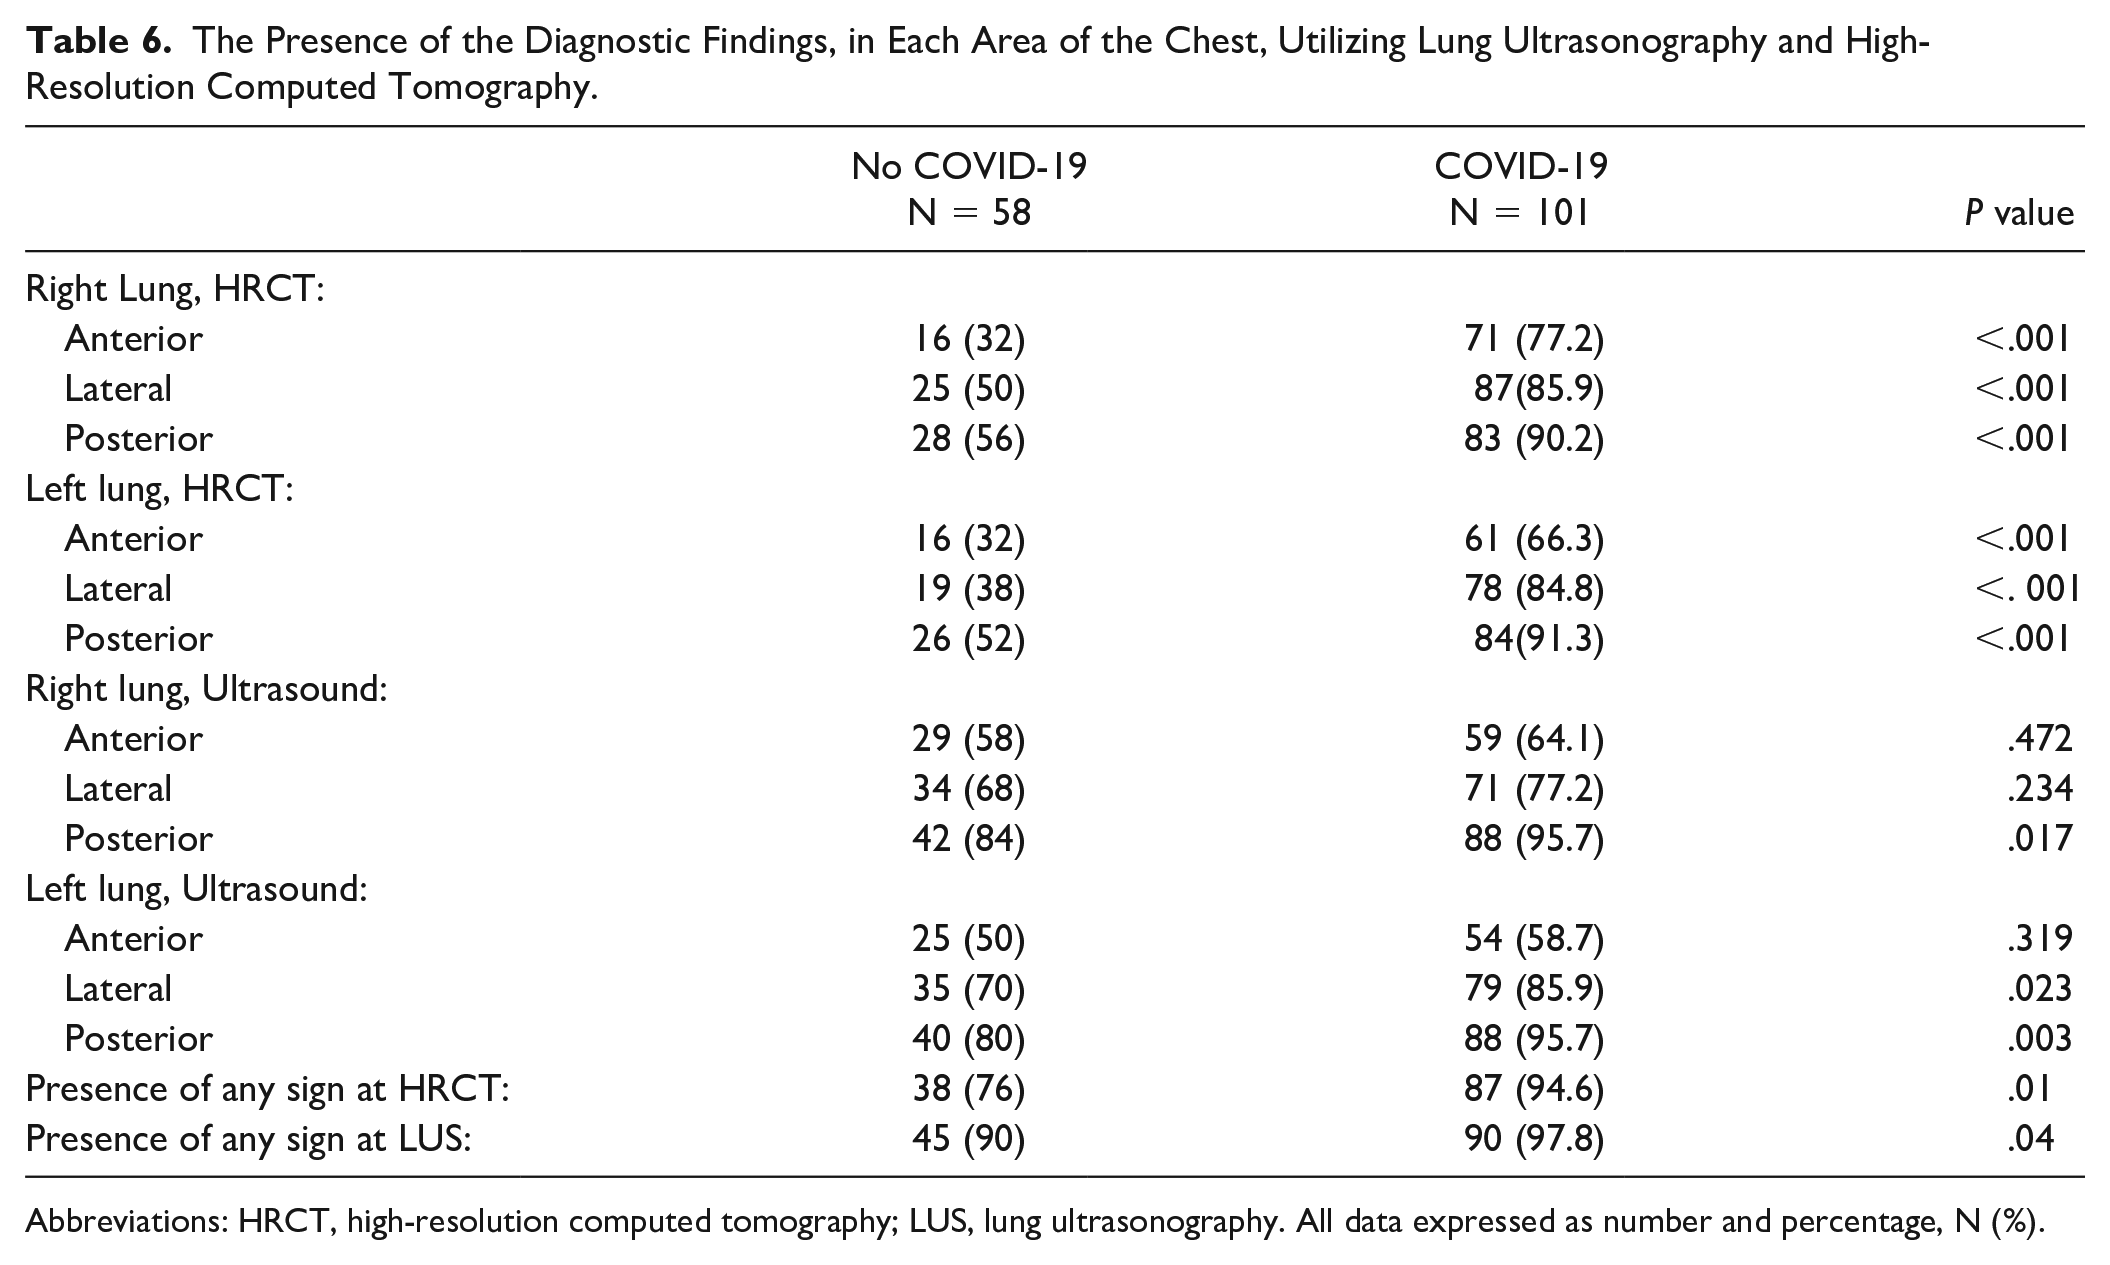
Abbreviations: HRCT, high-resolution computed tomography; LUS, lung ultrasonography. All data expressed as number and percentage, N (%).
The Lung Ultrasonography and High-Resolution Computed Tomography Imaging Accuracy Compared With the Reverse Transcription-Polymerase Chain Reaction (RT-PCR), SARS-CoV2 Assay.
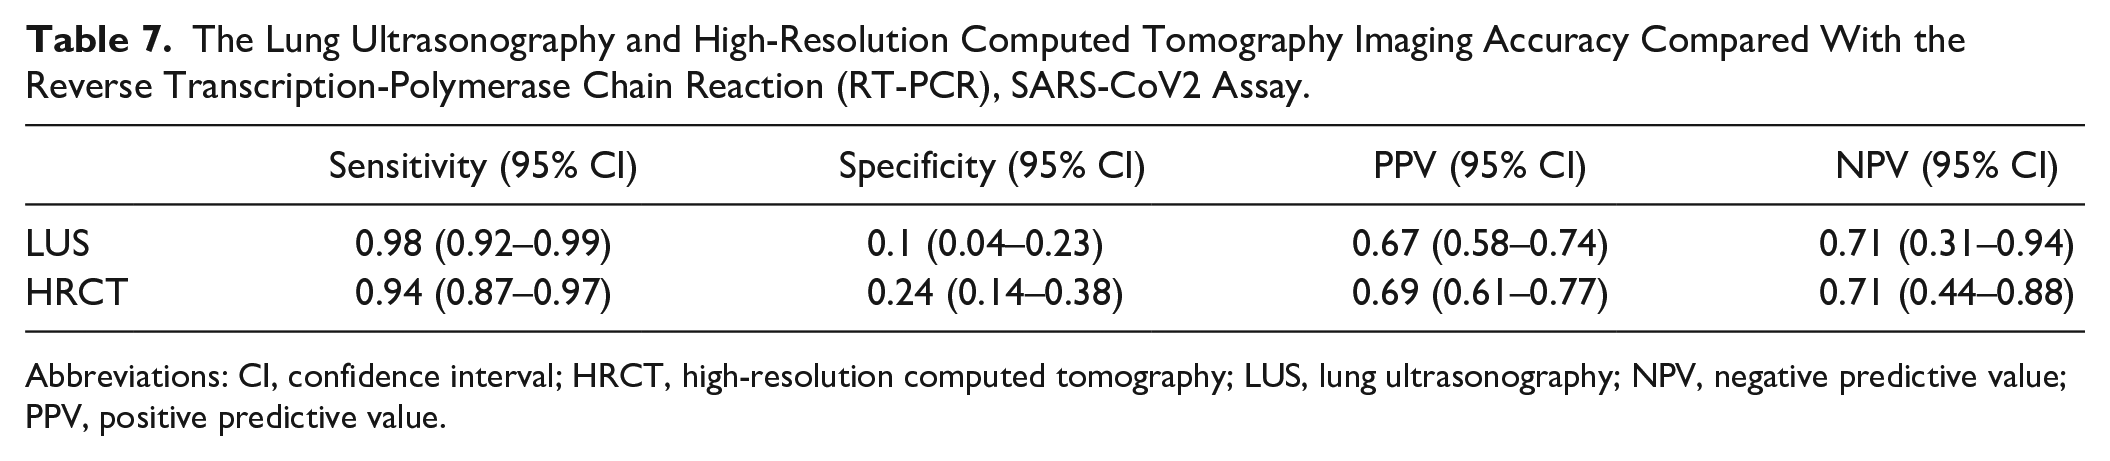
Abbreviations: CI, confidence interval; HRCT, high-resolution computed tomography; LUS, lung ultrasonography; NPV, negative predictive value; PPV, positive predictive value.
The Diagnostic Accuracy of Lung Ultrasonography to Detect Lung Abnormalities Utilizing High-Resolution Computed Tomography as a Reference.
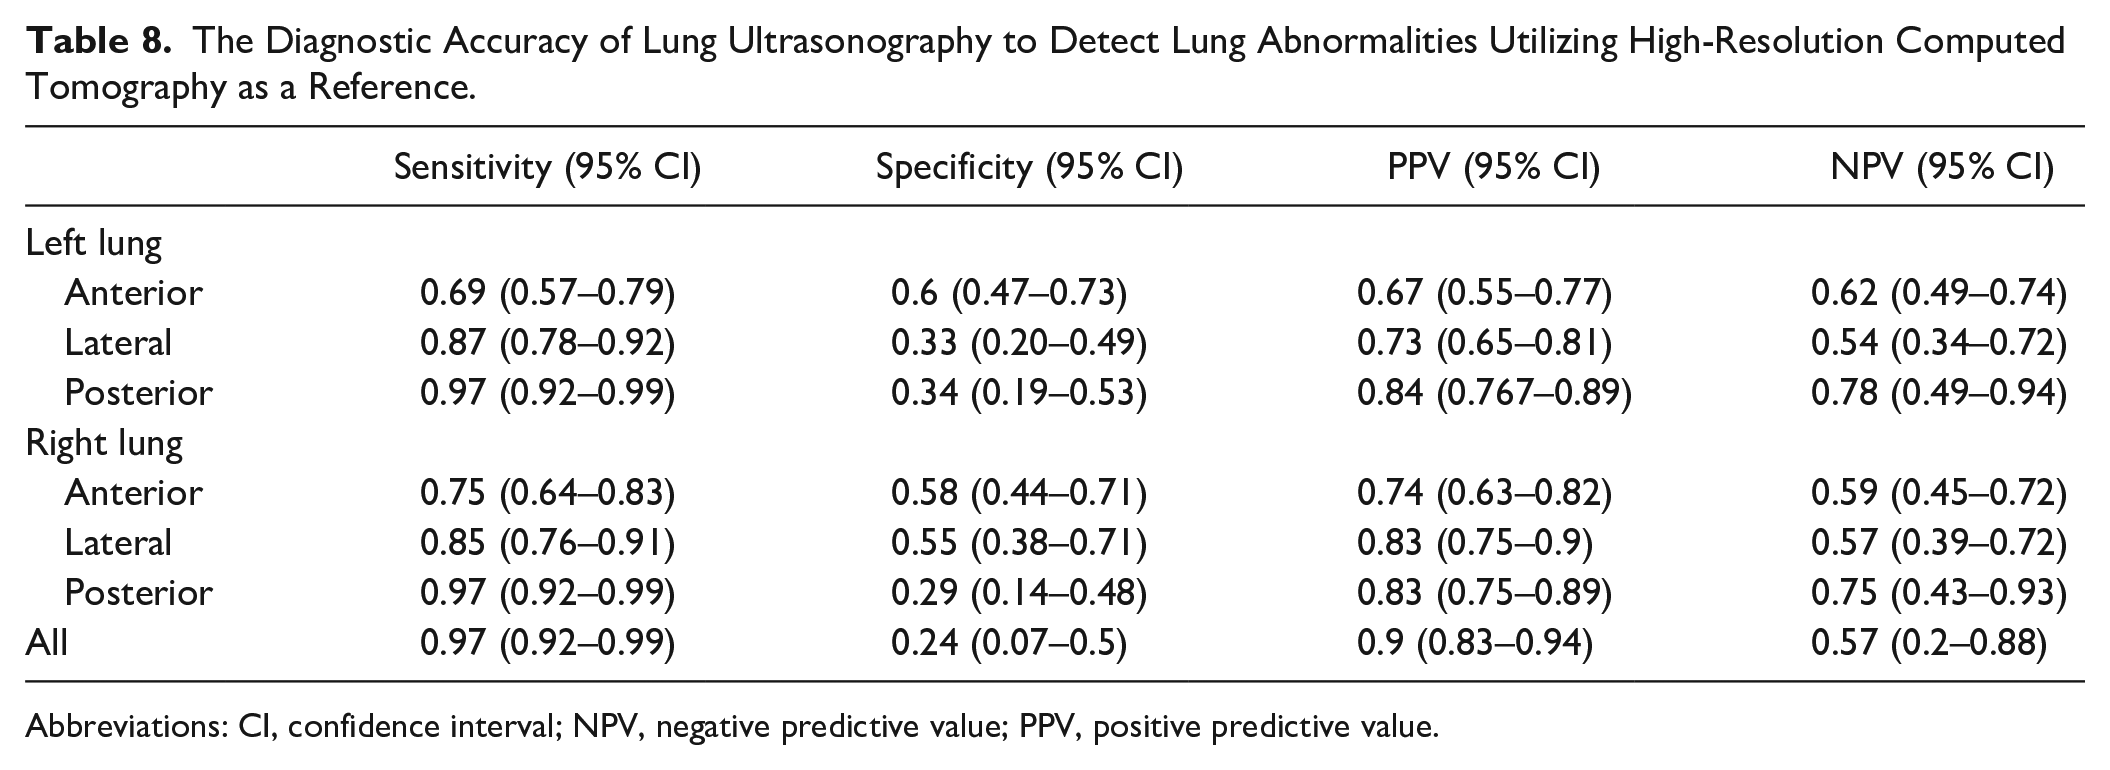
Abbreviations: CI, confidence interval; NPV, negative predictive value; PPV, positive predictive value.
Discussion
Obtaining a rapid and correct COVID-19 diagnosis is a main objective for both physicians and patients. Sensitivity, specificity, positive and negative predictive values of the diagnostic tests as clinical examination, laboratory data, and radiologic findings can assist in the recognition of the disease. This allows for validating the clinical manifestations of these patients, especially as ED physicians aim to initiate appropriate therapy at an early stage of COVID-19 and determine the treatment options for the patient. During the SARS-CoV-2 pandemic, all EDs developed triage systems to differentiate patients with a high pretest risk of COVID-19 from those with a low pretest risk. High sensitivity in the detection of COVID-19 patients is of fundamental importance to limiting the spread of SARS-CoV-2 infection. 24 Although a COVID-19 diagnosis relies on the positivity of the RT-PCR test, based on the nasopharyngeal swab, a negative test result in the appropriate setting is not enough to rule out an infection.24,25 Incorporating LUS into the clinical evaluation has demonstrated a higher sensitivity than nasopharyngeal sampling and clinical evaluation alone. 26 LUS also has a higher sensitivity than a chest radiograph in detecting pulmonary signs of COVID-19. 6 With a COVID-19 pneumonia, LUS demonstrates focal or diffuse alterations and the B-lines appear differently, as they are alternating grouped with normal lung areas (see Figures 1, 2, 3, and 7), and subpleural consolidations with an irregular pleural line (see Figures 4 and 5). 27 However, there is still no agreement on the correct way to evaluate LUS diagnostic findings, in this setting28,29 resulting in a broad heterogeneity of the sensitivity and specificity reported in clinical studies. 6 So, while various efforts have been made to standardize LUS and several scoring systems for LUS and chest HRCT have been proposed, there is no consensus on grading pulmonary involvement, in suspected COVID-19 patients. In this study, all diagnostic signs detected by LUS and HRCT were reported to compare their distribution and test the sensitivity and specificity of these two imaging techniques, without using any scoring system. Considering the presence of any lesions LUS showed a sensitivity of 98% to identify COVID-19 patients, (See Table 7) with a specificity of 0.1%, which is very lower than reported by the Cochrane systemic review. 6 As previously demonstrated,30–32 the sensitivity of LUS is slightly higher than that of CT (94%), with a similar NPV (0,71); this may be due to the ability of LUS to prove smaller or earlier lung lesions than CT. 33 Indeed, CT can represent deep areas that cannot be explored with LUS, but it can detect changes within the sub-millimeter range at the alveolar stage because of imbalances between air and fluids (so-called “acoustic trap theory”).34,35
The accuracy of LUS in identifying pulmonary lesions showed by HRCT is variable. They are two radically different imaging techniques, due to physical and technological characteristics, interaction with biological tissues, and the way images are constructed. Moreover, COVID-19 lesions are rapidly evolving, so when the interval between the two investigations is too long, they can be less or not at all overlapping (see Figure 7). Some trials prove a low agreement between the two diagnostic techniques, 36 with reported Cohen’s K between 0.29 37 and 0.59. 38 In the present study, LUS demonstrated the presence of coalescent B lines and multiple subpleural consolidations at the low bilateral posterior zones (areas L5-6 and R5-6 at LUS examination) more frequently in COVID-19 patients than in no-COVID ones (see Table 4 and Figure 1). HRCT showed a higher presence of GGO in all pulmonary regions, either reaching or distant to the pleural line, and a higher presence of a superficial crazy paving pattern in the posterior zones (see Table 5, Figures 1 and 7), confirming the accuracy of LUS in identifying pulmonary lesions demonstrated by HRCT. LUS is variable with a higher sensitivity proved in the posterior than in the anterior thoracic zones, as already demonstrated 32 (see Table 8). The superficial GGOs are much more represented in all areas than the variously aggregated B-lines, contrary to expectations based on previous observations.28,39 “Crazy paving” and multiple subpleural consolidations showed a significant correspondence, both being the most severe lesions of the interstitial diseases, with the worst parenchymal impairment, and the greatest loss of alveolar aeration.40,41 They are probably diagnostic signs of the same histopathological process observed from the perspective of two completely different imaging techniques.
Limitations
This study has several limitations that deserve to be addressed. The major limitation is attributed to the research design and the convenient sampling. Additionally, the use of one medical center that hosted this study could have affected the diagnostic accuracy of either LUS or the interpretation of HRCT. It is also important to point out that the diagnostic accuracy of LUS could have been influenced by the level of experience of the two physicians. Due to the high spread of SARS-CoV-2 and to reduce operator exposure to the virus, each patient was examined by a single operator, with a lack of inter-observer agreement evaluation. An additional factor may have been that the HRCTs were retrospectively evaluated by two radiologists with greater 15 years of experience in chest CT. It was also important to underscore that the thoracic areas identified with LUS and HRCT could not always match accurately or may have been affected by the ultrasound beam angles. Additionally, the accuracy of both LUS and chest HRCT can be compromised by the inability to exclude preexisting lung lesions resulting from other existing medical conditions. Finally, only patients admitted to the ED, during the first wave of the pandemic, were included.
Conclusion
The COVID-19 pandemic forced providers to reconsider pretest and posttest probabilities and the diagnostic accuracy of each sign, symptom, laboratory, and imaging data. Each of them has sensitivity and specificity depending on the disease phase and each patient’s characteristics. LUS and HRCT are different imaging techniques, each with its strengths and limitations. Despite HRCT remaining the gold standard for the evaluation of the lung, LUS demonstrated excellent sensitivity for both lung abnormalities at chest HRCT and COVID-19. LUS has undeniable advantages as a diagnostic imaging choice for the screening of patients with possible COVID-19.
Footnotes
Declaration of Conflicting Interests
The authors declared no potential conflicts of interest with respect to the research, authorship, and/or publication of this article.
Funding
The authors received no financial support for the research, authorship, and/or publication of this article.
Ethics Approval
This study was approved by the hospital’s Ethics Committee Broad Area Middle Emilia—Emilia Romagna (CE AVEC n. 58/2021/OSS/AUSLBO).
Informed Consent
Informed consent was not sought for the present study because all case data was de-identified and/or aggregated and followed ethics committee or IRB guidelines (also referred to as the Honest Broker System).
Animal Welfare
Guidelines for humane animal treatment did not apply to the present study because no animals were included.
Trial Registration
Not applicable.