
Abstract
Objective:
Rheumatoid arthritis (RA) is associated with increased risk of cardiovascular disease. Adventitial vasa vasorum density (aVVD), the vessel density of the vasa vasorum, is a surrogate measure for atherosclerotic plaque vulnerability. The purpose of this study was to compare the adventitial vasa vasorum density (aVVD) in RA and non-RA control participants using novel carotid artery contrast-enhanced ultrasound (CEUS). In addition, we investigate associations of aVVD with traditional cardiovascular (CV) risk factors, vascular and inflammatory biomarkers, and RA disease activity.
Methods:
The study was a cross-sectional analysis of patients with RA and control participants without RA or other autoimmune disease. CV disease risk, biomarkers, and CEUS images were collected on all patients.
Results:
aVVD was quantified in 86 patients with RA and 95 non-RA control participants. Nitrite, CD40L, E-selectin, matrix metalloproteinase 9, intercellular adhesion molecule 1, vascular cell adhesion molecule 1, myeloperoxidase (MPO), high-sensitivity C-reactive protein (hsCRP), and erythrocyte sedimentation rate were measured. Median aVVD was higher in patients with RA (0.59 [0.47–0.69] vs 0.64 [0.54–0.62]; P = .02). In patients with RA, MPO was lower (253.5 [153.2–480] vs 470.8 [274.2–830.1] ng/mL; P = .0002) and ESR was higher (15.5 [11–25] vs 13 [9–20] mm/h; P = .02). aVVD was correlated with MPO (r = −0.33, P = .001) and hsCRP (r = 0.25, P = .02) in control participants only, associations that remained significant after adjusting for number of CV risk factors and age. No significant correlations were found between aVVD and RA disease activity measures.
Conclusions:
Using a novel application of CEUS, we found that aVVD, an early measure of plaque vulnerability, was significantly higher in RA than control subjects, even after adjusting for CV risk factors. Differences in correlation of aVVD with vascular biomarkers and CV risk factors suggest RA-related differences in atherosclerotic progression.
Patients with rheumatoid arthritis (RA) have an approximately twofold increased risk of developing coronary artery disease 1 and heart failure. 2 However, traditional cardiac risk factors found in the general population, such as dyslipidemia and elevated body mass index (BMI), do not adequately account for the increase in cardiovascular (CV) disease found in patients with RA.3,4 Chronic inflammation has been increasingly implicated in the development of atherosclerotic disease in RA. The elevated risk of cardiovascular disease (CVD) in patients with RA correlates with elevation of RA disease-related markers of inflammation, including high-sensitivity C-reactive protein (hsCRP), anti–cyclic citrullinated peptide (CCP) antibodies, and increased RA disease activity. 5 Notably, in the general population, systemic markers of inflammation such as hsCRP have been associated with atherosclerotic plaque instability. 6 Methods to identify features of plaque vulnerability in patients with RA with subclinical CVD could facilitate improved CV risk stratification of patients with RA.
A key early event in the pathogenesis of vulnerable plaques is neovascularization of the adventitial vasa vasorum, the network of small vessels that nourish the arterial wall. Histological studies of human carotid, iliac, and renal arteries have shown that the adventitial vasa vasorum density (aVVD) is increased in patients with symptomatic atherosclerosis, and this neovascularization develops prior to intimal thickening. 7 Furthermore, histological studies of human aortas have found that increased microvessel density correlates with pathologic features of plaque instability and is significantly increased in ruptured plaques compared to nonruptured plaques. 8
Contrast-enhanced ultrasound (CEUS) is a novel method that has been used to visualize features of vulnerable atherosclerotic plaque, including neovascularization of the vasa vasorum and intraplaque neovascularization. Gas-filled microbubbles that resonate under the ultrasound beam are injected intravenously and act as intravascular contrast. 9 A CEUS study performed on the carotid arteries of 147 human participants demonstrated that the presence, degree of adventitial vasa vasorum, and plaque neovascularization were significantly correlated with CVD and prior adverse CV events. 10 Histological validation of the quantification of vasa vasorum density by CEUS has been performed with an animal model. Among New Zealand white rabbits, the video intensity of the adventitia normalized to the video intensity of the arterial lumen was correlated with total cross-sectional area and number of microvessels in the adventitial vasa vasorum. Notably, serial CEUS studies demonstrated an increase in video intensity over time, suggesting the potential for carotid vasa vasorum CEUS assessment as a method for monitoring plaque progression. 11
In addition to use of imaging markers to detect subclinical atherosclerosis, vascular and inflammatory biomarkers have been found to predict atherosclerosis and CV events. 12 It has been suggested that such biomarkers may have greater influence than traditional risk factors in the pathogenesis of CVD in RA. 13 These biomarkers reflect various mechanisms involved in atherosclerosis, including endothelial dysfunction, inflammation, plaque destabilization, and plaque rupture.14,15 Biomarkers of endothelial dysfunction include intercellular adhesion molecules: intercellular adhesion molecule 1 (ICAM-1), vascular cell adhesion molecule 1 (VCAM-1), E-selectin, and whole blood nitrite (NO2). 16 Included in this group of biomarkers are proinflammatory and autoimmunity cytokines that include interleukin 6 (IL-6) and interleukin 17 (IL-17), respectively. 17 Mediators of plaque instability include CD40 ligand (CD40L), matrix metalloproteinase 9 (MMP-9), and myeloperoxidase (MPO). 18
Prior studies have found associations between vascular biomarkers and common carotid intima-media thickness (cIMT), as a marker of subclinical atherosclerosis, in patients with RA. However, to date, there are no studies reporting the use of the novel imaging technique of CEUS to quantify aVVD, a surrogate measure of plaque vulnerability, in the RA population. The purpose of this study was to compare aVVD in RA and non-RA control participants using CEUS. In addition, the study investigated an association of aVVD with traditional CV risk factors, vascular and inflammatory serum biomarkers, and RA disease activity.
Methods
Study Design
The study was a cross-sectional analysis of patients with RA and control participants without RA or other autoimmune disease. The primary objective was to compare the levels of carotid artery aVVD between those with and without RA. The secondary objective was to compare the levels of vascular and inflammatory serum biomarker levels between RA and non-RA participants. In addition, the association between aVVD and these serum biomarkers was assessed in both RA and non-RA participants after adjusting for traditional CV risk factors.
Study Population
Patients with RA (n = 90) were recruited from the Rheumatoid Arthritis Comparative Effectiveness Research (RACER) study. RACER encompasses a registry of longitudinal data collected from a cohort of over 1000 patients with RA visiting the University of Pittsburgh Rheumatoid Arthritis center. 19 Control participants (n = 101) were volunteers recruited from (1) participants of the Heart Strategies Concentrating on Risk Evaluation (SCORE) study (n = 28) and (2) the general population by flyers/advertisements (n = 73). Heart SCORE is a longitudinal, descriptive community-based research study of 2000 white and black participants in southwestern Pennsylvania. It was designed to evaluate risk stratification and population differences in CVD with prespecified recruitment goals of recruiting participants with low Framingham risk (n = 800), intermediate to high Framingham risk (n = 1000), and those with established CVD (n = 200). 20
Inclusion criteria for patients with RA were age ≥18 years, meeting 2010 American College of Rheumatology classification criteria for RA diagnosis, 21 and participating in the longitudinal RACER study. Inclusion criteria for control participants were age ≥18 years with no diagnosis of RA or other autoimmune disease. Exclusion criteria were the following: age <18 years, pregnancy, pulmonary hypertension, and contraindications to use of the perflutren ultrasound contrast agent, Definity (Lantheus Medical Imaging, North Bellerica, MA). At the time of the study, contraindications to Definity included presence of intracardiac and intrapulmonary shunts, unstable cardiopulmonary conditions, and use of chronic oxygen therapy. Since then, contraindications have been amended to include large cardiac shunts (right to left, bidirection, or transient right to left), hypersensitivity to perflutren, and administration by intra-arterial injection. All participants provided written informed consent. The study was approved by the University of Pittsburgh Institutional Review Board and the Human Research Protection Office.
In the final analysis, 97 control participants and 87 patients with RA were included. Two control participants and two patients with RA were not included due to a lack of intravenous (IV) access, one control participant was excluded due to hypertension during the study visit, and one patient with RA withdrew from the study prior to data collection. The final CEUS image analysis included 95 control participants and 86 patients with RA. Of the three excluded CEUS image sets, one control participant’s images were excluded for an incomplete contrast of the arterial lumens. One control participant and one RA participant’s images had to be excluded due to poor quality.
Assessment of Traditional Cardiovascular Risk Factors
Participants completed a study visit at the University of Pittsburgh Vascular Clinical and Translational Research Center (VCTRC). All participants were assessed for traditional cardiovascular risk factors using questionnaires assessing smoking status, family history, diabetes, use of an antihypertensive, and lipid-lowering medications. Blood pressure and BMI were measured. Fasting bloodwork included blood glucose, insulin level, and a lipid panel for use in estimating insulin sensitivity. In addition, a beta-cell function according to the homeostatic model assessment for insulin resistance (HOMA-IR), which is a clinical and epidemiological tool, was used, where the range of 0.7 to 2 is considered the reference.22,23
Assessment of RA Disease-Specific Risk Factors
Patients with RA underwent additional disease-specific assessments. RA disease activity was measured using the Clinical Disease Activity Index (CDAI), which includes tender joint count, patient global assessment, and assessor global assessment, ranging from 0 to 76. The CDAI score is interpreted as follows: remission (0.0–2.8), low activity (2.9–10.0), moderate activity (10.1–22.0), and high activity (22.1–76.0). 24 Joint counts and assessor global assessment were recorded by trained staff members. In addition, a physician-calculated disease activity measure, the Disease Activity Score (DAS-28), was obtained. DAS-28 is a continuous index ranging from 0 to 9.4, in which low disease activity is defined as ≤3.2, moderate disease activity is defined as >3.2 to ≤5.1, and high disease activity is defined as >5.1. 25 A commonly used cutoff point for remission in DAS-28 is <2.6. 26
In all participants, RA disease-related serum measures were obtained, including erythrocyte sedimentation rate (ESR), high-sensitivity C-reactive protein (hsCRP), rheumatoid factor (RF), and anti-CCP antibody. CCP was determined using a kit from Axis-Shield Diagnostic Limited (Dundee, UK). RF and hsCRP were measured by the University of Pittsburgh Medical Center (UPMC) clinical laboratory.
Use of medications, including disease-modifying antirheumatic drugs (DMARDs), biologic agents, nonsteroidal anti-inflammatory drugs (NSAIDs), cyclooxygenase-2 (COX-2) inhibitors, and glucocorticoids, was recorded.
Microbubble Contrast-Enhanced Carotid Sonography
Participants were examined in a dimly lit, temperature-controlled room on an examination table lying supine with their heads turned slightly to the left. It was ensured that participants’ necks were relaxed, as contractions of the sternocleidomastoid muscle (SCM) cause poor imaging due to lack of ultrasound penetration due to difficult transducer placement. The common carotid artery (CCA), carotid bulb, internal carotid artery (ICA), and external carotid artery (ECA) were imaged for this study. Imaging was completed on both the right and left sides using an “ear-to-ear” approach.
The CCA usually originates from the innominate artery on the right side and the aortic arch on the left side. The CCA course runs anterolateral with the SCM muscle and the internal jugular vein (IJV), as well as medial to the thyroid. The mid-to-distal area of the CCA runs parallel to the skin surface. The IJV is distinguished from the CCA by vein movements controlled mainly by respirations. The sonographic texture of the carotid wall consists of three parallel layers. The internal and external layers are hyperechoic, and the middle layer is hypoechoic. Most often, the CCA divides into the ICA and the ECA at the level of the superior border of the thyroid. The point of this division is a dilated bulbous area referred to as the carotid bulb.
CEUS was performed along the CCAs bilaterally by a trained sonographer with the Registered Vascular Technologist (RVT) credential. All examinations were performed using a GE Vivid 7 (General Electric Company, Milwaukee, WI) equipped with a 9L linear multifrequency transducer and a dedicated vascular scanning package. The B-mode settings were adjusted to optimize the quality of the gray-scale images, and the pulse repetition frequency (PRF) used with color Doppler flow imaging was adjusted according to the flow velocity.
Carotid sonographic images were obtained using a standardized protocol based upon the most current recommendations. 27 In short, first the left CCA, carotid bulb, ICA, and ECA were evaluated using gray-scale sonography, color Doppler, and pulsed-wave Doppler. The right CCA, carotid bulb, ICA, and ECA were evaluated in the same way. After acquisition of the standard carotid artery sonographic images, the contrast preset of the ultrasound system was selected. The preset uses an ultrasound pulse sequence with a low mechanical index (0.25–0.35/7) to avoid destruction of the microbubbles. 28 Three sagittal images of the distal CCA were obtained in five-cycle cine-loops with the focal point placed at the (1) near wall, (2) vessel, and (3) far wall.
An IV cannula was inserted in the participant’s left arm, preferably the antecubital vein, to avoid interaction of the injector with the right-sided examiner. The vial of Definity was allowed to warm to room temperature before starting the activation procedure. Activation was performed by shaking the vial for 45 seconds using a Vialmix (Lantheus Medical Imaging). The designated registered nurse (RN) withdrew the material from the middle of the liquid in the inverted vial, while avoiding injecting any air, into a 10-cc saline syringe in which 1.5 mL of saline had been expressed prior.
The ultrasound contrast media were injected in boluses of 0.5 cc through the peripheral IV line, followed by a normal saline flush, and the bolus administration was repeated when necessary. The examiner ensured imaging consistency with precontrast baseline imaging. After injection, the examiner waited for microbubbles to fully fill the vessel before capturing any images; the fill time was dependent on heart rate. During image capture, quiet breathing and breath suspension in neutral were preferred over breath hold in full inspiration or expiration. First, the left CCA was evaluated, and then the right CCA was evaluated in the same way. Cineclips were digitally stored as an Audio Video Interleave (AVI) file and reviewed offline.
The optimal time window for performing CEUS, after administration of the contrast agent, was approximately one to two minutes. Once the contrast media were administered, arterial lumen enhancement began approximately after 10 to 15 seconds and lasted for up to two to five minutes. The administration of the contrast media was repeated if deemed necessary.9,29 Injected contrast volume, lot number, and time of administration were documented.
Participants underwent electrocardiogram (EKG) monitoring throughout the imaging procedure and were monitored for 30 minutes following completion. Following the CEUS examination, the participant continued to lie in the supine position for 30 minutes to monitor their blood pressure, heart rate, and oxygen saturation. During postprocedure, the IV access was discontinued.
Two suspected adverse reactions to the contrast media were recorded. One control participant experienced onset of diffuse hives, itching, and faintness that was treated with diphenhydramine 50 mg IV, methylprednisolone 125 mg IV, and famotidine 20 mg IV, and this person was transferred to the emergency department. With this treatment, symptoms resolved without complications. Another control participant complained of mild shortness of breath and tongue tingling that were not treated. These symptoms resolved in 16 minutes after injection without complications.
Image Analysis
Analysis of aVVD was performed on stored CEUS images and cine-loops. The analysis was performed on Myocardial Contrast Echocardiography (MCE) 2.9 software (Yabko, LLC, University of Virginia), which quantitatively measures the video intensity of cine-loop images. In CEUS, the adventitial layer is hyperechoic, and evidence of neovascularization is indicated by dynamic movement of echogenic bubbles, whereas fixed echogenic signals are treated as tissue acoustic reflectors. 30 A region of interest (ROI) was selected in the intimal-medial layer on the posterior (far) wall of the CCA, and video intensity was measured over six diastolic frames, within the MCE software. The video intensities were averaged using Microsoft Excel (Microsoft, Redmond, WA) and normalized to the video intensity of an ROI within the artery lumen using Stata statistical software (StataCorp LLP, College Station, TX). aVVD was quantified as the ratio of mean CCA adventitial to lumen video intensity for each CCA (right and left) far wall. For each participant, the maximum aVVD of either the right or left CCA was used in the statistical analyses. Blinded image analyses were performed independently by two investigators (K.P.L. and L.F.W.). A subset of 20 image analyses was performed separately by the two investigators (K.P.L. and L.F.W.), with excellent interrater reliability; intraclass correlations (ICCs) were >0.80 for all sets of ROIs.
Vascular and Inflammatory Biomarkers
CD40L, E-selectin, MMP-9, ICAM-1, VCAM-1, MPO, hsCRP, and ESR were measured in serum. Whole blood nitrite was measured by chemiluminescence following the protocol described by Piknova and Schechter. 31 Blood samples were drawn during study visits on the same day as the CEUS studies were performed. Whole blood in a 10-mL serum separator tube was centrifuged at 800 g for 10 minutes at room temperature. Serum was stored as 200-µL aliquots at −80°C for laboratory testing. Enzyme-linked immunosorbent assay (ELISA) kits from R&D Systems (Minneapolis, MN) were used to measure serum CD40L, E-selectin, MMP-9, ICAM-1, VCAM-1, and MPO, according to the manufacturer’s protocols. Serum IL-6 and IL-17A concentrations were analyzed using kits from eBioscience (San Diego, CA). The hsCRP and ESR were measured according to UPMC clinical laboratory protocols.
Statistical Analysis
Demographic data, CV risk factors, and biomarker levels were compared between RA and control participants using Wilcoxon rank-sum or χ2 tests. Association of aVVD with biomarkers and CV risk factors, stratified by case status, was examined using Pearson and Spearman correlations, respectively. The relationship between RA and aVVD was assessed using multiple linear regression modeling with RA as the categorical exposure of interest and aVVD as the continuous outcome. aVVD was modeled as a function of case status, age, sex, and CV risk factors. The relationship between RA disease-related measures and aVVD was assessed in the same manner except only patients with RA were included. The relationship between medication use and aVVD was assessed using the rank-sum test or Kruskal-Wallis H test. All statistical analyses were performed using Stata (StataCorp LLP).
Results
Demographic and Clinical Characteristics
The recorded demographic and clinical characteristics of RA and control participants included traditional CV risk factors (age, BMI, hypertension, diabetes, high cholesterol, smoking, family or personal history of CVD) and anti-inflammatory medications (Table 1). RA-related measures included RF and CCP positivity, disease activity, and DMARD use (Table 2). Among patients with RA, median (interquartile range [IQR]) disease duration was 9.9 (5.6–17.1) years. Median (IQR) DAS-28 score was 0.927 (0.36–1.47) and CDAI score was 8.5 (3–16) (Table 2). Patients with RA were older, more hypertensive, and more hypercholesterolemic, and they had a higher number of CV risk factors (40.2% vs 20.6% had three or more risk factors; P = .003) compared to control participants. Twelve patients with RA and two control participants reported a personal history of CVD (P = .01). Other vascular comorbidities did not differ significantly between groups, including history of stroke or cerebrovascular disease (RA, n = 3; control, n = 1), atrial fibrillation (RA, n = 1; control, n = 1), and deep vein thrombosis or pulmonary embolism (RA, n = 1; control, n = 1). Other comorbidities, including chronic kidney disease, chronic lung disease, chronic liver disease, peptic ulcer disease, sleep apnea, and hematologic disorders (anemia, abnormal leukocyte, or platelet count), did not differ significantly between groups (data not shown). Of these additional comorbidities, the most common were sleep apnea (RA, n = 8; control, n = 5) and hematologic disorder (RA, n = 16; control, n = 8).
Demographic and Clinical Characteristics of RA and Control Participants. a
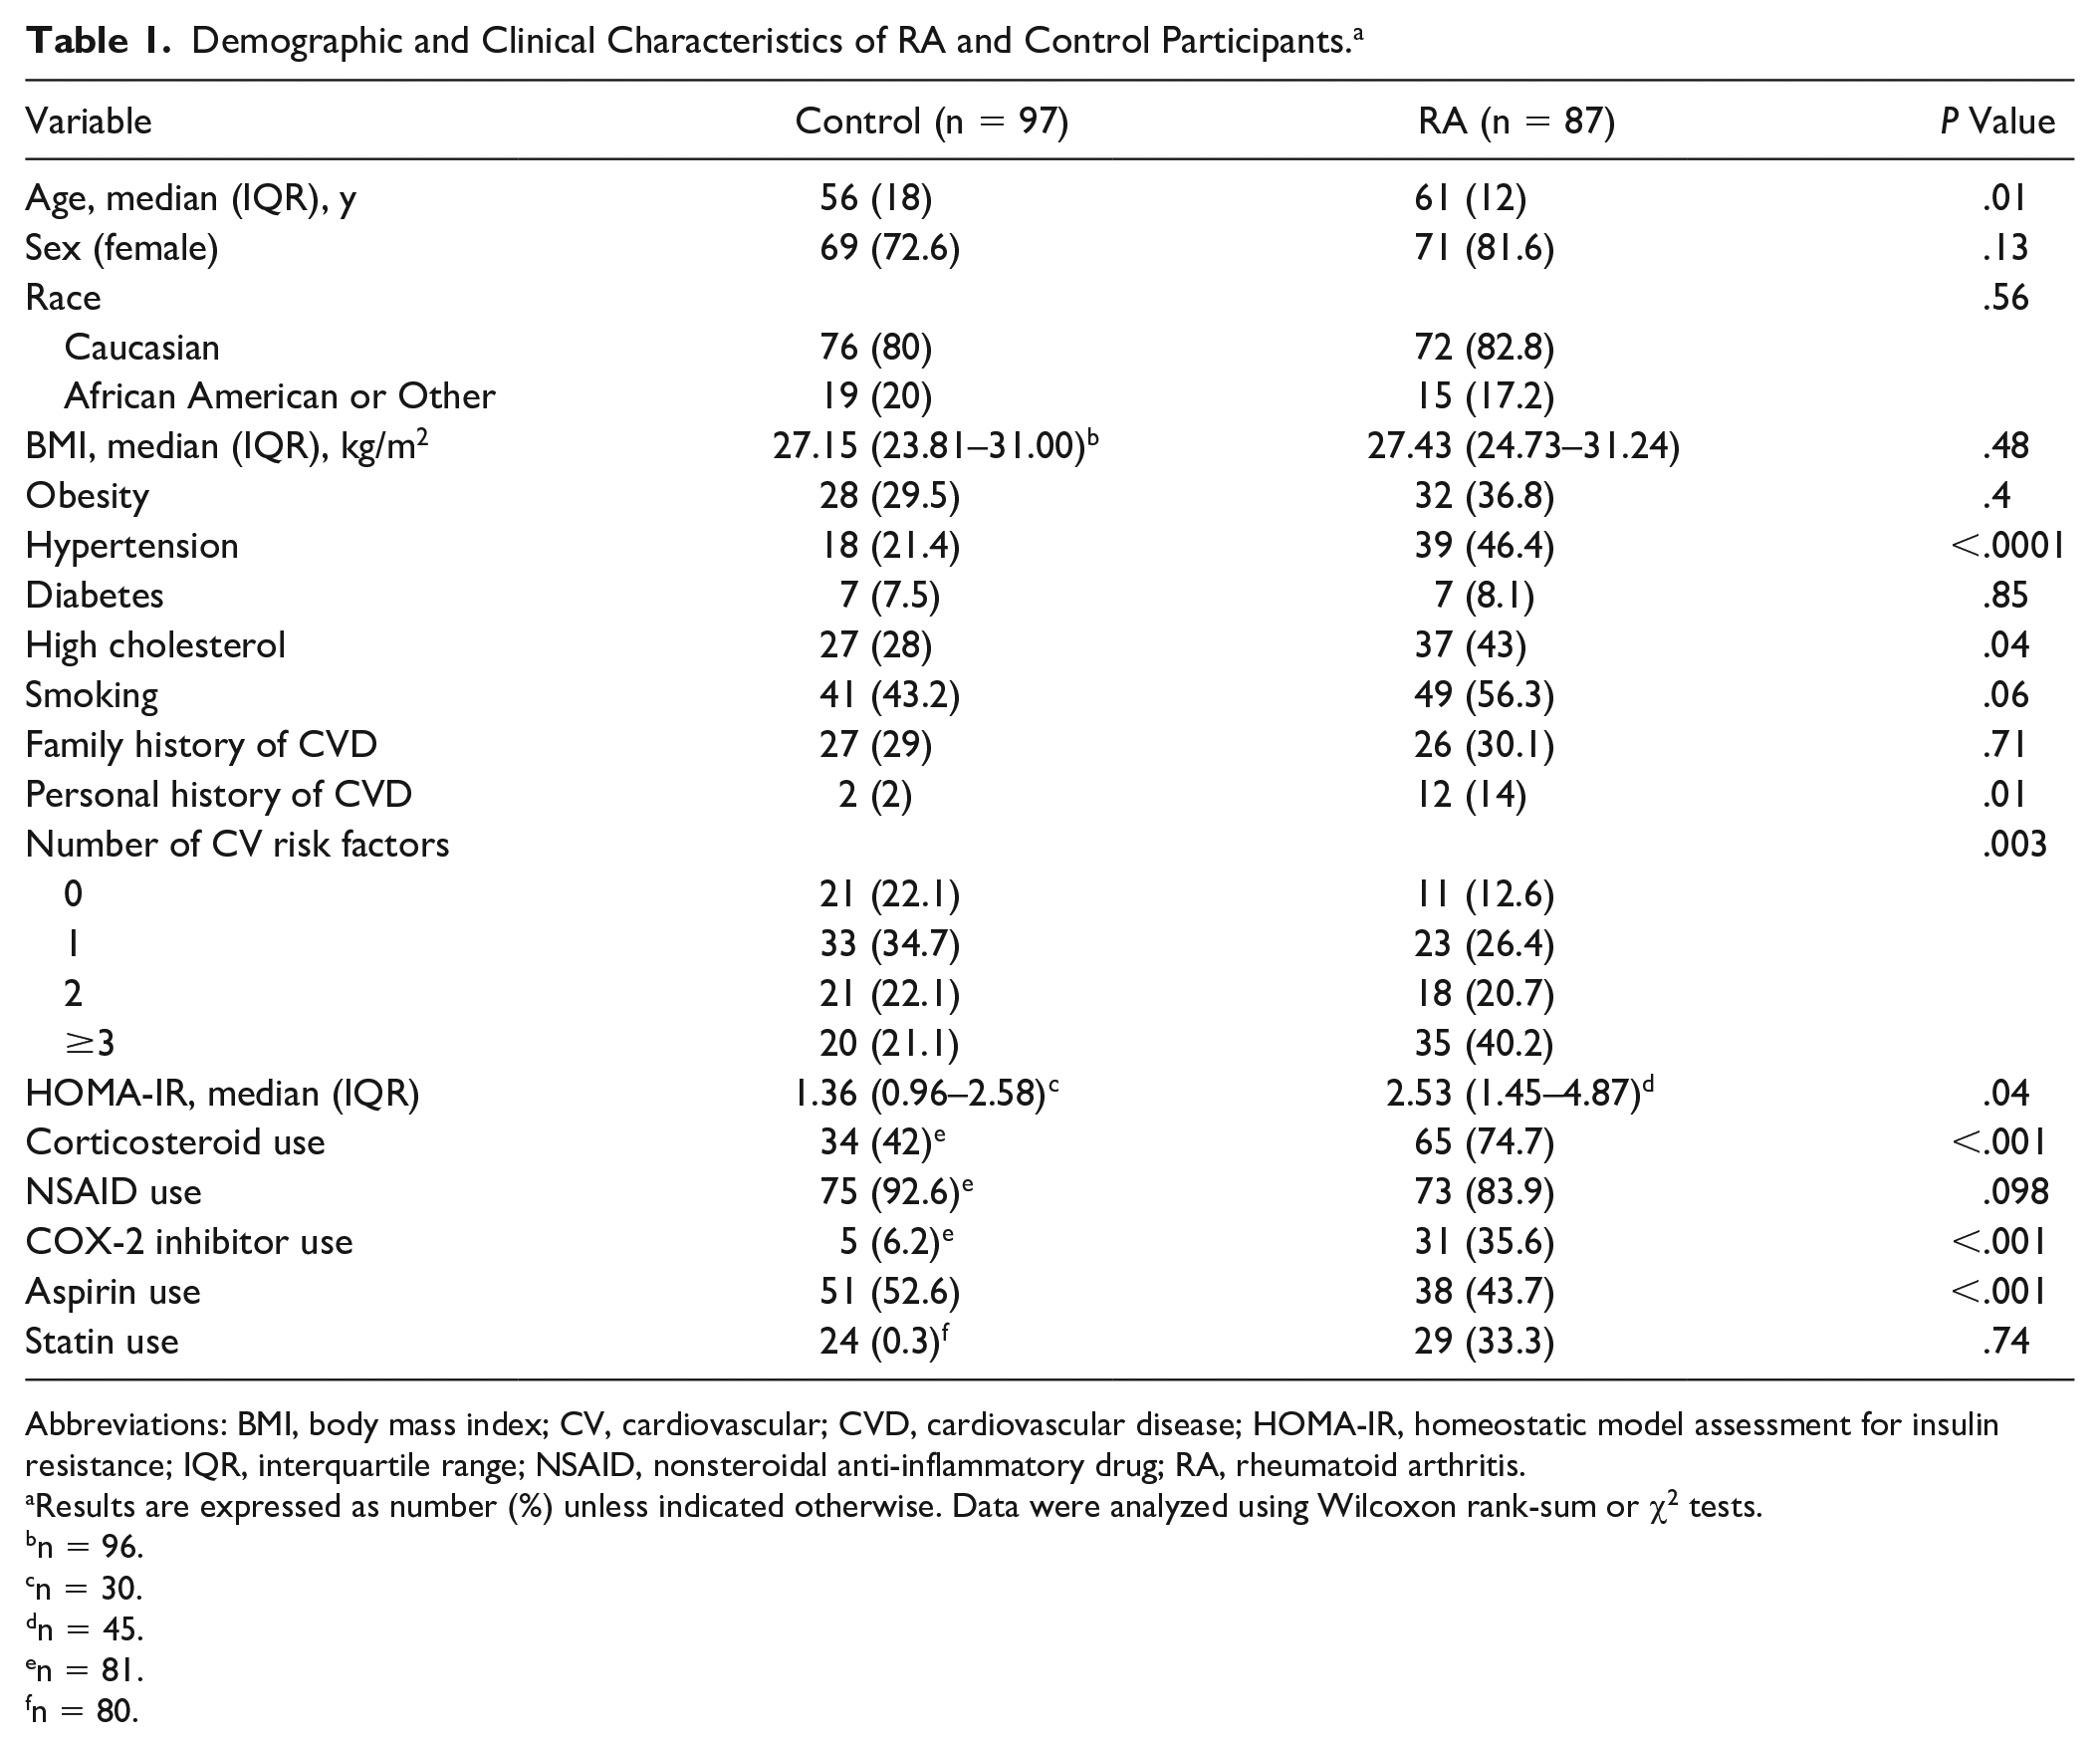
Abbreviations: BMI, body mass index; CV, cardiovascular; CVD, cardiovascular disease; HOMA-IR, homeostatic model assessment for insulin resistance; IQR, interquartile range; NSAID, nonsteroidal anti-inflammatory drug; RA, rheumatoid arthritis.
Results are expressed as number (%) unless indicated otherwise. Data were analyzed using Wilcoxon rank-sum or χ2 tests.
n = 96.
n = 30.
n = 45.
n = 81.
n = 80.
RA-Related Biomarkers, Disease Activity Scores, and DMARD Use. a
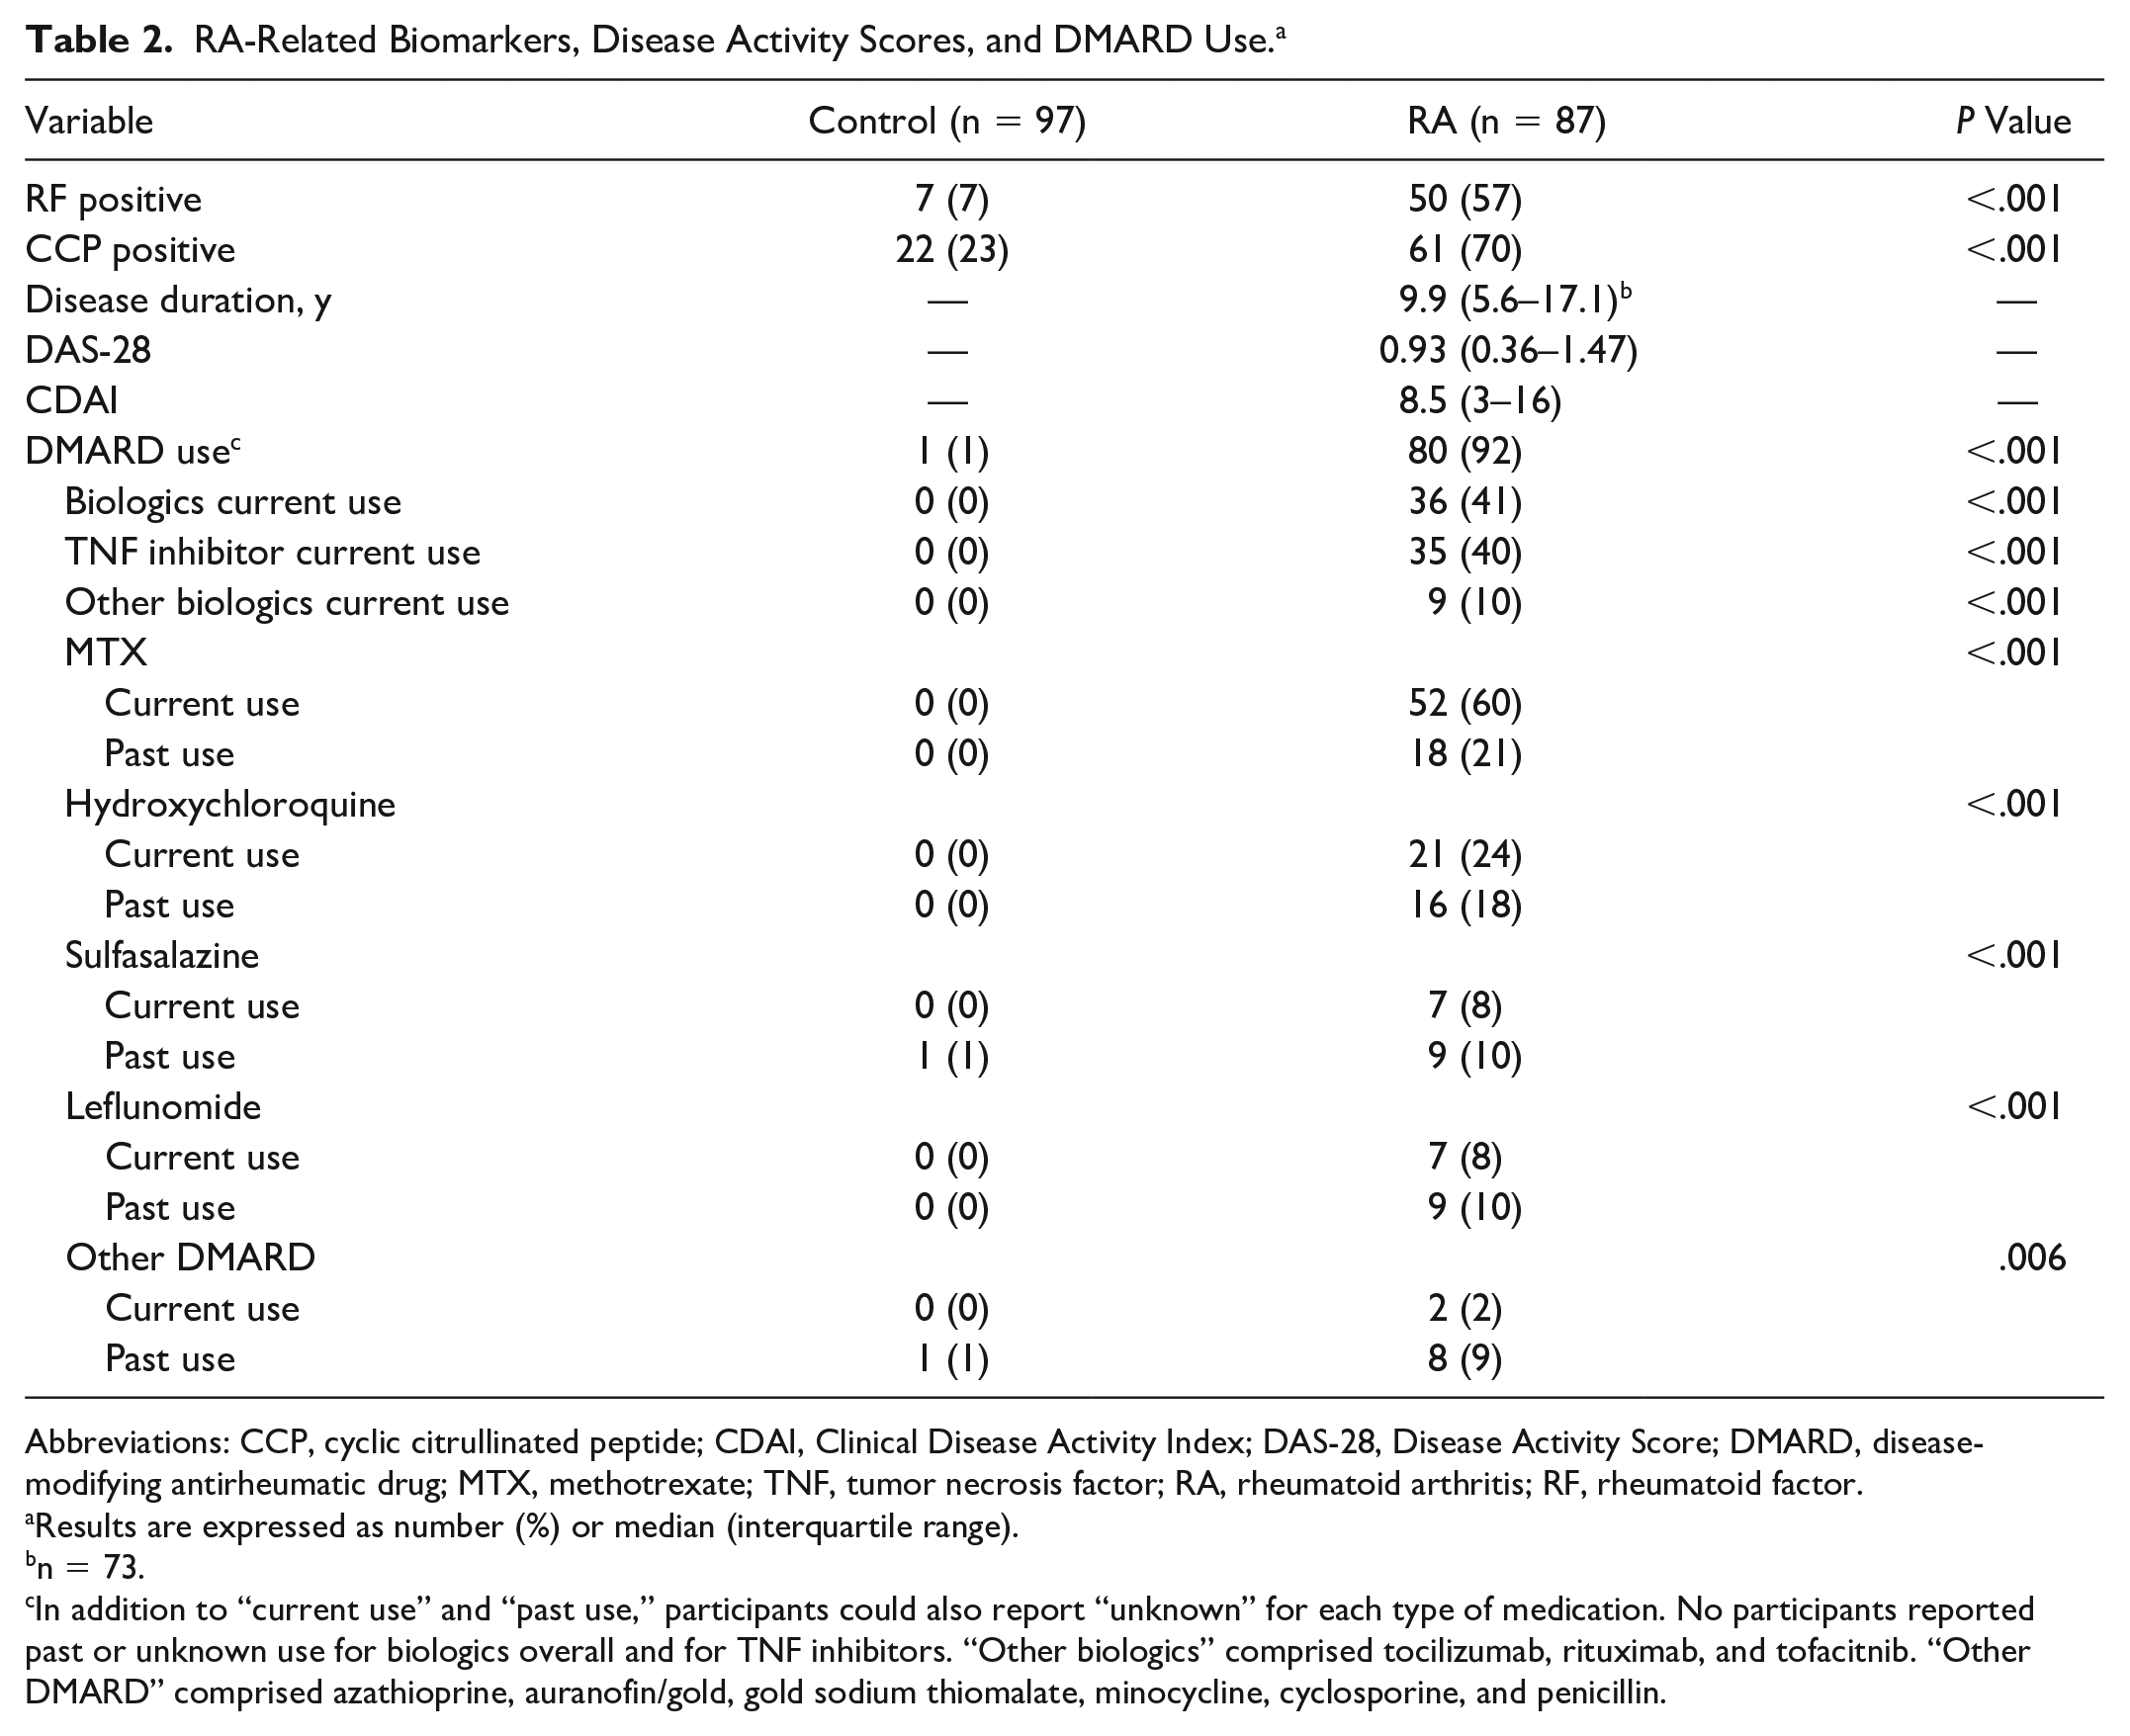
Abbreviations: CCP, cyclic citrullinated peptide; CDAI, Clinical Disease Activity Index; DAS-28, Disease Activity Score; DMARD, disease-modifying antirheumatic drug; MTX, methotrexate; TNF, tumor necrosis factor; RA, rheumatoid arthritis; RF, rheumatoid factor.
Results are expressed as number (%) or median (interquartile range).
n = 73.
In addition to “current use” and “past use,” participants could also report “unknown” for each type of medication. No participants reported past or unknown use for biologics overall and for TNF inhibitors. “Other biologics” comprised tocilizumab, rituximab, and tofacitnib. “Other DMARD” comprised azathioprine, auranofin/gold, gold sodium thiomalate, minocycline, cyclosporine, and penicillin.
Regarding medication use, 36 patients with RA were using biologics at the time of study, of which tumor necrosis factor (TNF) inhibitors were used most frequently (n = 35). Of the nonbiologics, most frequently reported DMARDs used, past or present, were methotrexate (MTX) (n = 70) and hydroxychloroquine (n = 37). One control participant reported past DMARDs consisting of sulfasalazine (n = 1). Corticosteroids, aspirin, and COX-2 inhibitor use was significantly higher among patients with RA, whereas NSAID and statin use was similar between groups.
Comparison of aVVD
An example of CEUS image interpretation, within MCE software, is depicted in Figure 1 with ROIs drawn in the contrasted arterial lumen and in the adventitia (Figure 1).
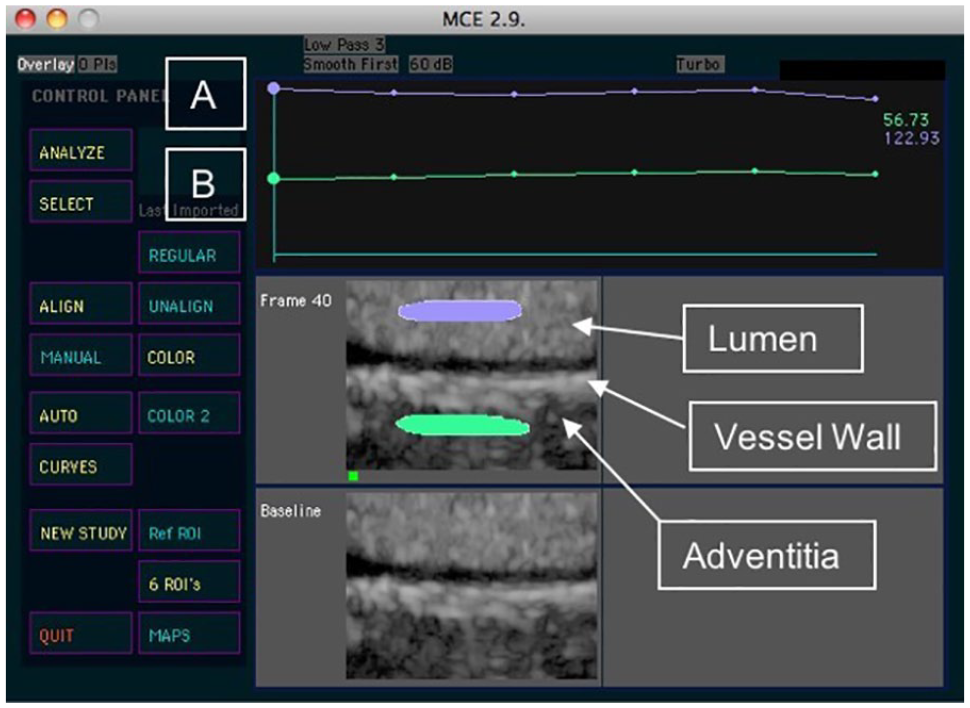
Measurement of adventitial vasa vasorum density. (A) Lumen region of interest (ROI) intensity and (B) adventitial ROI intensity.
aVVD was higher in patients with RA compared to controls (P = .02) (Figure 2) with median (IQR) aVVD of 0.62 (0.54–0.77) vs 0.59 (0.47–0.69), respectively. In linear regression models, RA case status was significantly associated with higher aVVD, even after adjusting for age, hypertension, hypercholesterolemia, number of CV risk factors, and personal history of CVD (P = .017). In multivariable models adjusting for age, BMI, hypertension, diabetes, hypercholesterolemia, smoking, family or personal history of CVD, and number of CV risk factors, RA case status remained significantly associated with higher aVVD (P = .011).
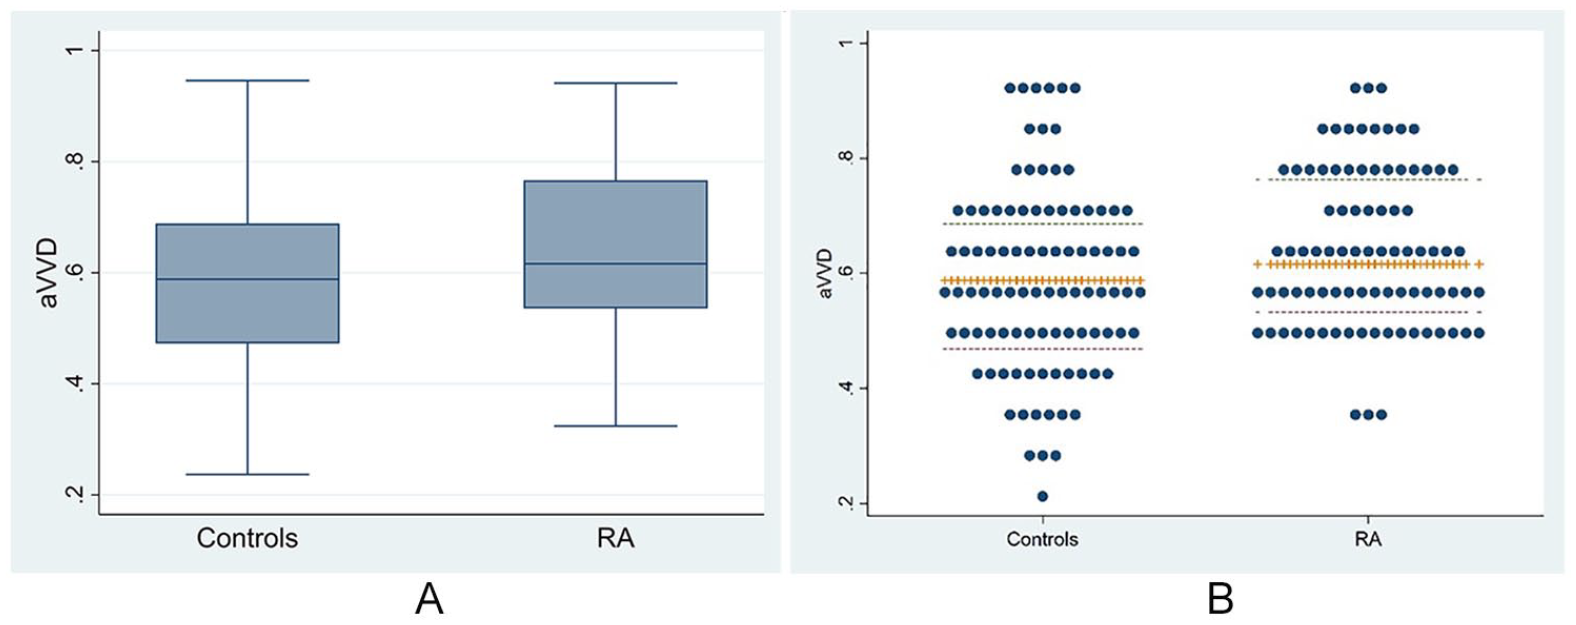
Adventitial vasa vasorum density (aVVD) between rheumatoid arthritis (RA) and control participants. Median aVVD (interquartile range) was 0.62 (0.54–0.77) in patients with RA vs 0.59 (0.47–0.69) in control participants (P = .02). (A) Box plot. (B) Dot plot.
Comparison of Vascular and Inflammatory Biomarkers
Results for vascular and inflammatory biomarkers in RA and control participants are shown in Table 3. Patients with RA had lower MPO (P = .0002) and higher ESR levels (P = .01) than control participants. aVVD was correlated with MPO (r = −0.33, P = .001) and hsCRP (r = 0.25, P = .02) by Pearson correlation in control participants (Table 4). No significant correlations were found between aVVD and biomarkers in patients with RA (Table 4). Number of CV risk factors and personal history of CVD were not significantly correlated with aVVD in both RA and controls (data not shown). Among patients with RA, disease duration, CDAI, DAS-28, and medication use were not significantly correlated with aVVD (data not shown).
Vascular and Inflammatory Biomarkers in RA and Control Participants. a
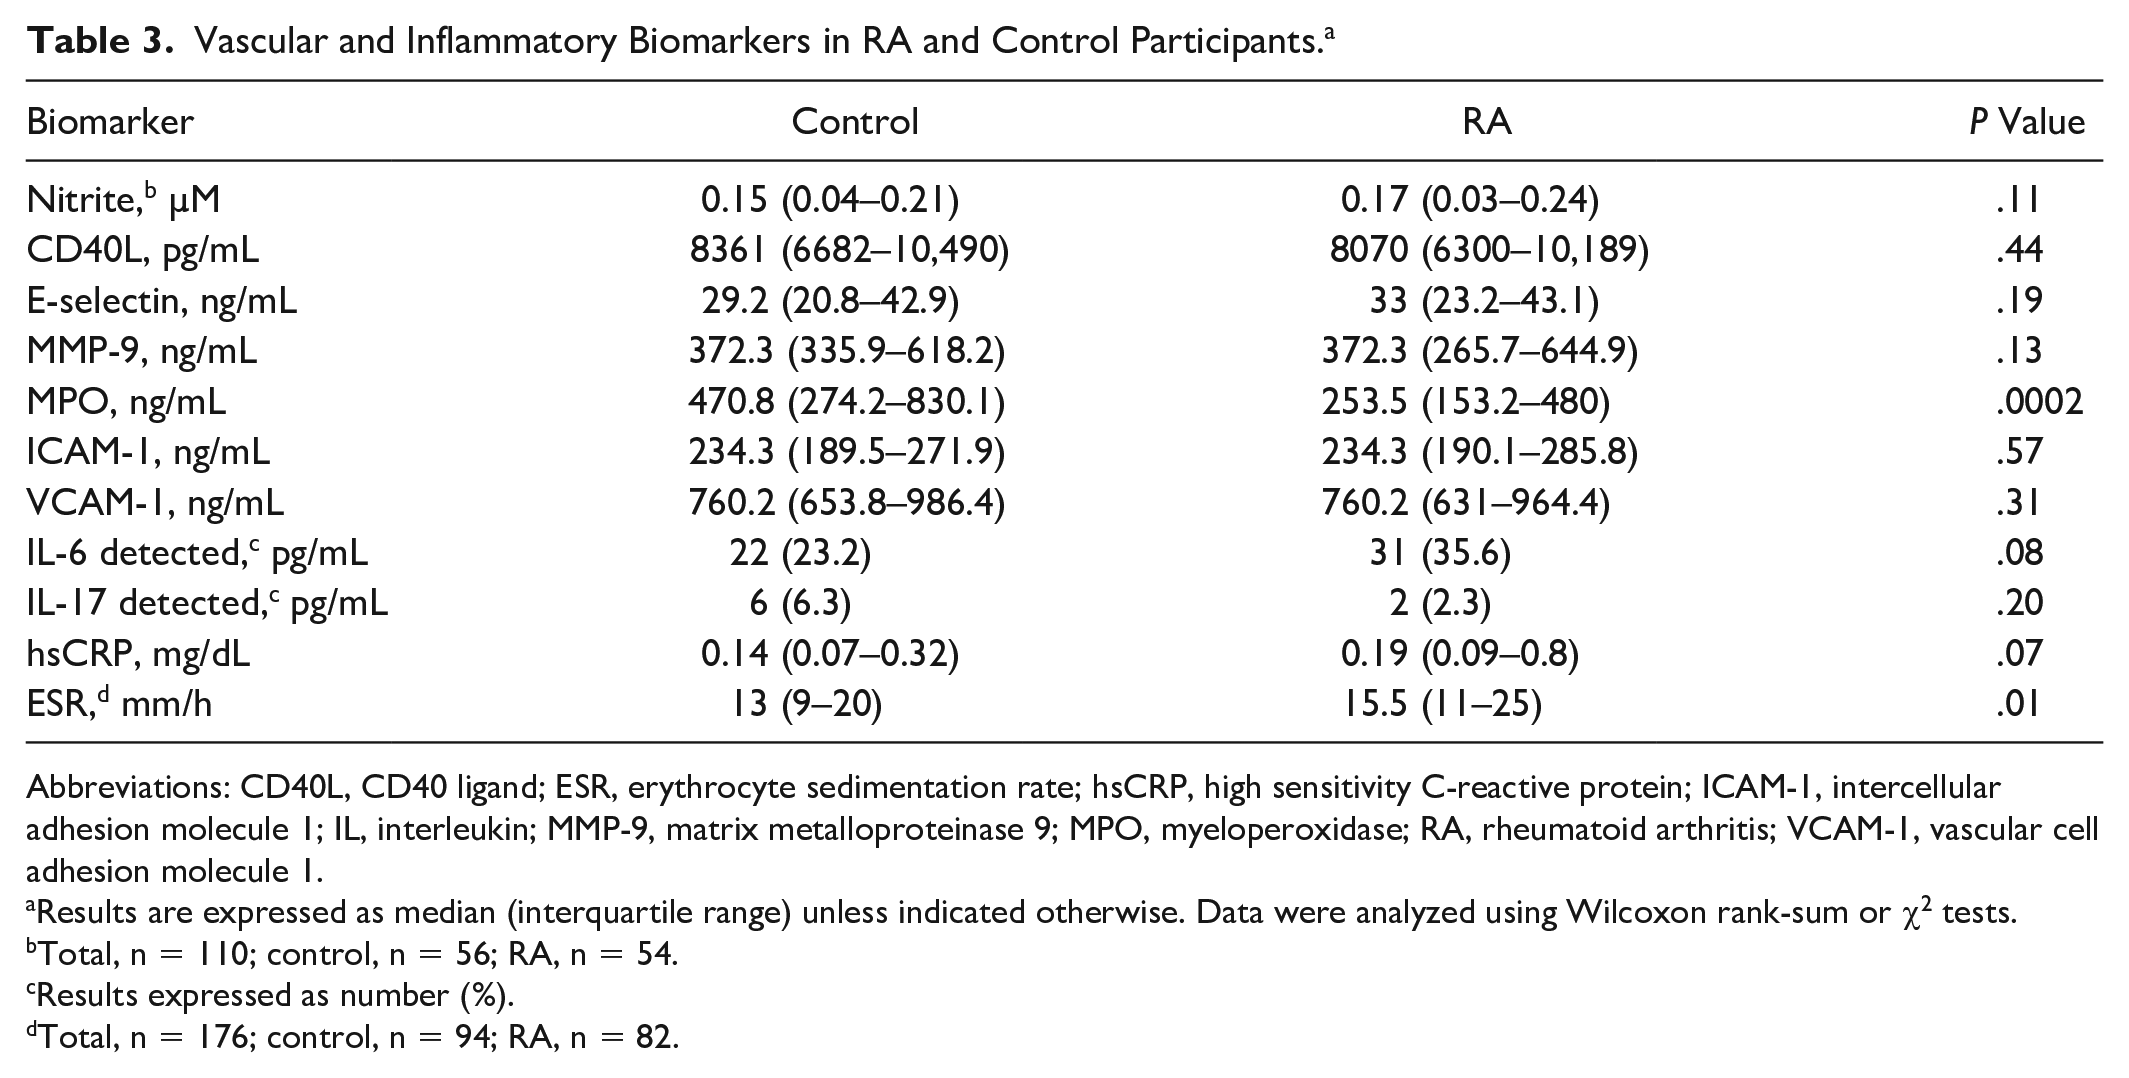
Abbreviations: CD40L, CD40 ligand; ESR, erythrocyte sedimentation rate; hsCRP, high sensitivity C-reactive protein; ICAM-1, intercellular adhesion molecule 1; IL, interleukin; MMP-9, matrix metalloproteinase 9; MPO, myeloperoxidase; RA, rheumatoid arthritis; VCAM-1, vascular cell adhesion molecule 1.
Results are expressed as median (interquartile range) unless indicated otherwise. Data were analyzed using Wilcoxon rank-sum or χ2 tests.
Total, n = 110; control, n = 56; RA, n = 54.
Results expressed as number (%).
Total, n = 176; control, n = 94; RA, n = 82.
Pearson Correlations of Adventitial Vasa Vasorum Density With Vascular and Inflammatory Biomarkers in RA and Control Participants.
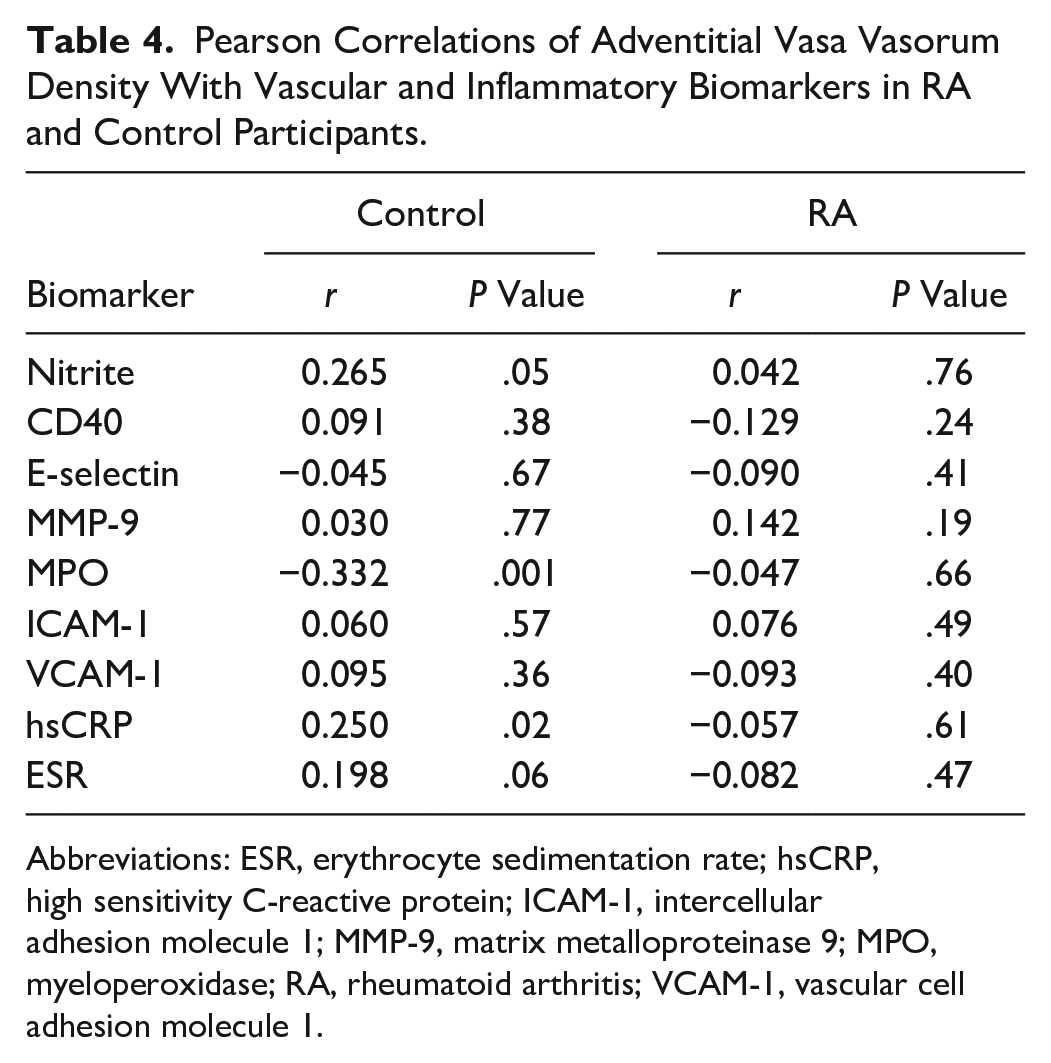
Abbreviations: ESR, erythrocyte sedimentation rate; hsCRP, high sensitivity C-reactive protein; ICAM-1, intercellular adhesion molecule 1; MMP-9, matrix metalloproteinase 9; MPO, myeloperoxidase; RA, rheumatoid arthritis; VCAM-1, vascular cell adhesion molecule 1.
Association of aVVD With Biomarkers
Multiple linear regression modeling of aVVD adjusting for age, sex, and CV risk factors (obesity, smoking, hyper-lipidemia, hypertension, diabetes, and family history of CVD) was performed in control participants and patients with RA separately. These variables did not significantly predict aVVD with F(8, 72) = 0.50, P = .85, R2 = 0.05 in control participants and F(8, 70) = 0.85, P = .56, R2 = 0.09 in patients with RA. When stratified by case status, the correlation of aVVD with MPO in controls remained significant in linear regression models adjusting for age, sex, and CV risk factors, F(8, 72) = 1.84, P = .001, R2 = 0.09. The correlation of aVVD with hsCRP in controls became nonsignificant in this adjusted linear regression analysis, F(9, 71) = 0.53, P = .402, R2 = 0.06. No substantial changes in the other associations between aVVD and biomarkers were found with linear regression (data not shown). In multivariable linear regression models adjusting only for those variables that were significantly different between RA and controls (age, hypertension, hypercholesterolemia, number of CV risk factors, and personal history of CVD), nitrite was significantly associated with higher aVVD (P = .044), and MPO was significantly associated with lower aVVD (P = .002) in controls only. No significant associations were seen between these biomarkers and aVVD in the RA group in these models.
Discussion
It is believed that this cross-sectional study is the first to compare aVVD in patients with RA with controls using the novel CEUS. The median (IQR) aVVD of 0.59 (0.47–0.69) in control participants is similar to the ratio (mean ± SD) of 0.577 ± 0.119 reported by Arcidiacono et al. 32 In that study, the average of right and left common carotid aVVD, using CEUS, was used to measure aVVD in healthy participants without classical CV risk factors. 32 An early measure of plaque vulnerability, common carotid artery aVVD is significantly higher in RA compared to control participants, suggesting increased vasa vasorum neovascularization in patients with RA. This study also sought to explore the idea that inflammatory pathways in RA may promote vasa vasorum neovascularization, resulting in the creation of more unstable plaques.
Prior attempts to identify subclinical CVD in patients with RA have predominately used traditional gray-scale carotid sonography to assess common cIMT. It has also been used to detect the presence of carotid plaques, measures that are predictors of CV events in the general population. In a meta-analysis examining the relationship between RA and imaging markers of CV risk, presence of carotid plaques and cIMT was significantly higher in patients with RA compared to controls, suggesting that RA is significantly associated with subclinical atherosclerosis and CV risk. 33 This study’s results using a novel application of CEUS align with these findings but offer several advantages.
CEUS offers the additional capability of quantifying adventitial neovascularization in a noninvasive manner, whereas gray-scale carotid sonography cannot distinguish vessel density in the vasa vasorum. Of note, increased cIMT reflects intimal thickening thought to result from adventitial vasa vasorum (VV) neoangiogenesis, yet adventitial VV has been shown to increase prior to intimal thickening in humans and animals,7,34,35 thus suggesting that measuring aVVD could identify earlier stages of neovascularization in the development of atherosclerosis preceding the increase in cIMT. In addition, when directly compared with gray-scale carotid sonography, CEUS has been found to be superior for visualization of the intima-media complex in performing cIMT measurements and improves detection of carotid plaques. 36
The lack of correlation between aVVD and traditional CV risk factors, in both RA and control participants, may indicate that certain risk factors contribute more to CV, warranting further study. Staub et al. 10 also report a lack of association between VV enhancement on CEUS and CV risk factors but found that participants with more pronounced VV were more likely to have CVD. This study did not find an association between aVVD and personal history of CVD, but it was not powered to detect such an association. It only had two control participants and 12 patients with RA reporting a positive CV history. 10
To assess the possible contribution of traditional CV risk factors to the elevated aVVD in patients with RA, multiple linear regression analysis was performed with case status as the primary predictor and aVVD as the outcome, adjusting for age, sex, and traditional CV risk factors. In the multiple linear regression models, RA case status was significantly associated with higher aVVD even in the adjusted models, suggesting that the increased presence of traditional CV risk factors in the patients with RA does not completely account for their elevated aVVD compared to controls. The measurement of aVVD in patients with RA in this study highlights a potential application of CEUS to detect subclinical vulnerable atherosclerosis where assessment of traditional CV risk factors may underestimate atherosclerosis.
The lack of significant associations of aVVD with biomarkers in patients with RA could reflect differential effects of these biomarker pathways in subclinical atherosclerosis compared to controls. Of note, carotid intraplaque neovascularization assessed using CEUS and histology has not consistently been associated with inflammation. 37 This may suggest a need for further study of temporal relationships between inflammation and neovascularization. The finding that aVVD inversely correlated with MPO in control participants was unexpected given prior studies showing higher levels of MPO in individuals with CVD.38,39 This finding could be from variability in measured MPO levels within this study. However, increased aVVD is a feature of early vulnerable plaque, and most participants had no personal history of CVD. This was compared to an elevated MPO, found in patients presenting to the emergency department with acute coronary syndromes. This may support the idea that MPO elevation is a later finding in the progression of CVD. 40 The biomarker levels in patients with RA were also likely affected by DMARD use, as a wide variety of cytokines, including IL-6, decrease in response to DMARDs.41,42
This study did not demonstrate an association between aVVD and RA disease duration or disease activity, as measured by CDAI and DAS-28. Similarly, studies of cIMT have not consistently correlated with RA disease activity. 43 Such results are inconsistent with the known association between CVD and increased RA disease-related markers of inflammation. 5 This study’s results may have been influenced by the low disease activity scores of the patients with RA, of whom 96% were in clinical remission or with low disease activity as categorized by the DAS-28. In a study of patients with RA in whom 70% had a DAS-28 score in clinical remission or with low disease activity, cIMT was not associated with presence of RA, DAS-28, RF level, or anti-CCP level. 44
Study Strengths
Strengths of this study include large sample size and use of novel quantitative CEUS technique in a new population. In addition, the concomitant systematic collection of traditional CV risk factors, vascular and inflammatory biomarkers, and RA disease activity measures allowed for examination of potential relationships between aVVD and the pathophysiology of CVD in RA.
Study Limitations
This is a cross-sectional study with an inability to assess aVVD longitudinally. Larger prospective studies are needed to determine the relationship between aVVD and CVD risk in patients with RA. While quantitative, the method used for measuring aVVD involved user selection of ROI, and future studies could likely benefit from more standardized and automated methods of measuring aVVD, such as the software under development for measuring intraplaque neovascularization with CEUS.45,46 Ideally, to better distinguish the effect of traditional CV risk factors on aVVD, the study groups should have similar baseline traditional CV risk factors.
Conclusion
The novel CEUS technique may be used to noninvasively quantify aVVD, an early measure of plaque vulnerability. aVVD is significantly higher in patients with RA compared to control participants, even after adjusting for traditional CV risk factors. Differences in association of aVVD with traditional CV risk factors and inflammatory and vascular biomarkers in patients with RA compared to control participants suggest there may be RA-related differences in atherosclerotic progression that require further study.
Footnotes
Acknowledgements
We thank the study coordinators Louise DeRiso and Maria Jaksec; Dr. Flordeliza Villanueva and Dr. Suresh Mulukutla for guidance on aVVD analysis techniques; Bernadette Sendon for technical assistance; and the University of Pittsburgh Vascular Medicine Institute.
Declaration of Conflicting Interests
The authors declared no potential conflicts of interest with respect to the research, authorship, and/or publication of this article.
Funding
The authors disclosed receipt of the following financial support for the research, authorship, and/or publication of this article: This research study was funded by the National Institute of Arthritis and Musculoskeletal and Skin Diseases of the National Institutes of Health (NIH) award number 5K23AR061407-02 and the National Center for Research Resources (NCRR) grant 2UL1 RR024153-06. The Clinical and Translational Science Institute at the University of Pittsburgh is supported by the NIH Clinical and Translational Science Award program, grant UL1 TR001857.
References
Supplementary Material
Please find the following supplemental material available below.
For Open Access articles published under a Creative Commons License, all supplemental material carries the same license as the article it is associated with.
For non-Open Access articles published, all supplemental material carries a non-exclusive license, and permission requests for re-use of supplemental material or any part of supplemental material shall be sent directly to the copyright owner as specified in the copyright notice associated with the article.