
Abstract
Molecular ultrasound imaging provides the ability to detect physiologic processes noninvasively by targeting a variety of biomarkers in vivo. The current study was performed by exploiting an inflammatory biomarker, P-selectin, known to be present following spinal cord injury. Using a murine model (n = 6), molecular ultrasound imaging was performed using contrast microbubbles modified to target and adhere to P-selectin, prior to spinal cord injury (0D), acute stage postinjury (7D), and chronic stage (42D). Additionally, two imaging sessions were performed on each subject at specific time points, using doses of 30 μL and 100 μL. Upon analysis, targeted contrast analysis parameters were appreciably increased during the 7D scan compared with the 42D scan, without statistical significance. When examining the dose levels, the 30-μL dose demonstrated greater values than the 100-μL dose but lacked statistical significance. These findings provide additional preclinical evidence for the use of molecular ultrasound imaging for the possible detection of inflammation.
Keywords
Introduction
Contrast-enhanced ultrasound (CEUS) has been demonstrated in Europe, Asia, and Canada to be an effective method of detecting blood perfusion at the tissue level.1–4 Ultrasound contrast agents are used extensively in situations that require the assessment of vascular perfusion, as they allow vasculature to be detected with high levels of sensitivity and specificity.5–10 Composed of microbubbles, ultrasound contrast agents increase the signal-to-noise ratio of the reflected ultrasound signal, thereby increasing sonographic spatial resolution. 10
Through a nanoengineering process, targeting ligands can be attached to the surface of ultrasound contrast microbubbles for molecular ultrasound imaging to be performed.11,12 Also known as targeted contrast-enhanced ultrasound (TCEUS), molecular ultrasound imaging provides information about specific molecules in vivo, by noninvasively targeting biochemical markers that are known to be associated with a specific biological process.13,14 As a result, nanoengineered ultrasound contrast facilitates site-specific targeting, in which microbubbles tether to a particular biochemical marker(s) and permit the assessment of its physiologic expression.15,16 This is also known as active targeting and enables CEUS imaging to descend from the structural to the molecular level.17,18
Molecular ultrasound imaging has potential to be used for the detection of pathophysiologic processes, as well as providing early identification of the development of advancing pathology. 19 Ultrasound contrast agents are intravascular; thus, they are ideal for targeting molecules expressed on the endothelial surface.3,20,21 For this reason, a common pathologic mechanism investigated with molecular ultrasound imaging is inflammation.17,22,23 Cell adhesion molecules (CAMs) mediate inflammation by the initial capturing and adhesion of rolling leukocytes on the surface of the endothelium and are present in the earliest stages of the inflammatory process.13,24–28 Therefore, they are widely accepted as known early biomarkers for inflammation detection.22,29–31 Multiple preclinical experiments have been performed demonstrating the capability of molecular ultrasound imaging to indirectly detect CAMs within a variety of tissues in vivo.3,20,23,32 Research in this area is being conducted with the ultimate goal of clinically translating this application of molecular ultrasound imaging to be used as a diagnostic tool.
In addition to being used as a diagnostic tool, molecular ultrasound imaging possesses the capabilities to be used as an indirect measure of treatment effects.17–19,33 This could be accomplished by performing repeated molecular ultrasound imaging studies longitudinally on an individual undergoing a particular treatment. Because sonography is performed in the absence of ionizing radiation, it is easily tolerated by patients and is cost-effective compared with other imaging techniques, making it ideal for performing repeated examinations.3,10,12,18 Comparative studies could provide information regarding therapeutic effectiveness, thereby affording clinicians the ability to tailor patient treatments if needed.17,20,34 If implemented, this strategy will likely enhance patient care and serve as a form of more personalized medicine. 35
Before molecular ultrasound imaging can be used to monitor the effectiveness of a particular treatment clinically, appropriate preclinical evidence should be established to ensure proper bench-to-bedside translation. The ability to monitor patient response to treatment over periods of time requires the knowledge of targeted ultrasound contrast’s ability to detect disease-related biochemical processes across consecutive time points and at varying levels of severity. Therefore, the next step toward clinical translation is to investigate TCEUS use in a preclinical longitudinal study.36–38 Although dwarfed in comparison with the body of literature reporting feasibility and proof of principle, some novel longitudinal studies do exist.38–43 These are in addition to similar cross-sectional studies that employ research designs that incorporate patients with varying levels of disease.37,44–46 Although not longitudinal, these studies were conducted with the same objective of translating molecular ultrasound imaging for the clinical application of treatment monitoring.
Longitudinal studies focus on determining the effectiveness of molecular ultrasound imaging at different stages of a disease process. However, the effectiveness of molecular ultrasound imaging is related to the administered dosing volume of the targeted contrast media.47,48 Since pathophysiologic processes are being indirectly measured using this imaging technique, it would seem important to determine the dose of targeted contrast that yields the best estimate of the disease process and stage of development. Furthermore, ultrasound imaging technical parameters must also be evaluated to determine their efficacy in the detection of disease, as contrast imaging outcome data are highly influenced by imaging settings. 49 An unsuitable dose of targeted contrast media or technical imaging parameters could result in the misinterpretation of TCEUS sonograms.36,48,50,51 Consequently, inappropriate patient management decisions could be made, resulting in negative impacts on patient care. Therefore, investigation of dosing and scanning techniques is warranted in an ultimate attempt to establish dosing and imaging guidelines of optimal sensitivity and specificity.50–52
This research team has previously reported establishing the proof of principle for the in vivo detection of inflammatory CAMs in neural tissue. In an attempt to build on those findings, the objective of this study was to provide preclinical evidence for the utility of molecular ultrasound imaging to assess neural inflammation longitudinally. This was accomplished by targeting P-selectin, a known early marker of inflammation.21,28,53–56 This study also had the goal of examining the effects of varied targeted contrast doses.
Materials and Methods
Murine Model
This research protocol was approved by the university’s Institutional Animal Care and Use Committee. A repeated-measures design was performed using a total of six female adult C57BL/6 mice, which were enrolled to undergo TCEUS imaging of the spinal cord following a contusive spinal cord injury (SCI) and laminectomy. Molecular imaging was performed at 7 (7D) and 42 (42D) days post-SCI to capture varied levels of P-selectin expression. Imaging was also performed prior to injury (0D) to provide baseline measures. Subjects were divided into three groups for imaging: 0D (n = 2), 7D (n = 2), and 42D (n = 2). Therefore, this posed limits to the research design by having a sample size of only 2 within each condition. The average subject weight was 17.6 g (14.4-21.3 g), and the average subject age was 71 (70-72) days at the time of SCI. All surgeries were performed under aseptic conditions. Briefly, under deep anesthesia with ketamine and xylazine (intraperitoneal injection 90 mg/kg and 10 mg/kg, respectively), mice received a dorsal laminectomy of the ninth thoracic vertebra (T9). An Infinite Horizon Impactor device administered a moderate-severe contusion injury using an experimentally controlled force of 75 kilodynes (kdynes) (mean actual force 78.3 ± 1.3 kdynes). After securing the lateral processes of the eighth thoracic vertebra (T8) and tenth thoracic vertebra (T10), the stainless steel impactor tip displaced the cord 652.3 ± 80.1 μm. 57 The contusion severity was derived from previous studies with C57BL/6 mice.58,59 The structure of the spinal cord lesion was characterized as a central lesion with a small peripheral rim of spared white matter within the T9 segment. 59 The exposed microcirculation at the injury epicenter caused the expression of the P-selectin inflammatory biomarker after the induced moderate-severe contusion.3,60–62
The first postinjury TCEUS sonogram was performed 7 days after the spinal cord injury. Seven days was selected as it allowed for an appropriate amount of time for suture healing on the skin surface, yet it was still early enough to capture P-selectin overexpression in the acute stages on inflammation.62–66 Forty-two days was selected as the other time point to capture P-selectin expression in the chronic stages of the inflammatory process.65–68 During the TCEUS sonograms, animals were anesthetized with 2.5% isofluorane mixed with 1 Liter per minute carbogen and were maintained with 0.5% to 1.5% isofluorane. Once anesthetized, a tail vein catheter was placed to provide a route for targeted contrast administration. Animals were positioned prone to allow for a posterior scanning approach. The hair of the animals was removed to optimize sonographic imaging. A small animal monitoring system was integrated into the ultrasound equipment to monitor physiologic parameters such as cardiac rhythm, respiration, and temperature during the entire TCEUS sonogram. Heart rate was maintained at a range of 300 to 450 bpm by adjusting the level of anesthesia. Core temperature was maintained at 37°C using a heated warming pad.
Targeted Contrast Agent
At each time point, both subjects underwent two targeted sonograms using varied doses of the targeted agent, to determine if this had an effect on TCEUS outcome measures. One consisted of a 30-μL bolus administration of Targestar SA (Targeson, San Diego, CA) nanoengineered to target P-selectin, whereas the other consisted of a 100-μL dose of the same agent. This equated to a total of six TCEUS scanning sessions for both the 30-μL (n = 6) and 100-μL (n = 6) administrations while combining each of the three time points when imaging was performed (n = 2 at each point). To aid in the proper comparison of TCEUS outcomes acquired from each dose, identical concentrations of the targeted contrast agent were used during both scanning sessions. The Targestar SA ultrasound contrast agent was nanoengineered to target P-selectin through the noncovalent attachment of biotinylated P-selectin antibodies to the surface of the Targestar SA microbubbles via a biotin-streptavidin-biotin interaction.
The nanoengineering process began by dispersing the microbubble base solution until a uniformly opaque color was achieved. This opaque color is due to the suspended microbubble formation that is ready to be attached to the targeting antibody. Two hundred microliters of the biotinylated targeting antibody solution were then injected into 1.0 mL of the microbubble base. This was then redispersed by shaking the vial. A washing process was used to remove any excess and unattached antibodies. Buffer solution was then added to the vial to achieve a total volume of 5.0 mL. Next, the solution was centrifuged at 400 × g for 4 minutes, causing the microbubbles to form a cake at the top of the solution. Excess solution was drained without disturbing the cake to attain a final volume of 1.0 mL. The final step in the nanoengineering process was to redisperse the solution of the now targeted microbubbles by shaking the vial. The microbubble nanoengineering process was derived from the established protocol set forth by the manufacturers of the base ultrasound contrast agent used (Targestar SA).34,69
Targeted Imaging
A Vevo 2100 ultrasound unit (VisualSonics, Toronto, ON, Canada) was used to perform TCEUS imaging. A linear transducer operating at 40 MHz and 2% power was employed to collect sagittal images at the level of the T9 spinal cord. Quality control data were collected using a tissue mimicking phantom to ensure consistent axial and lateral resolution parameters throughout the course of the research study.
Sagittal images were acquired using a posterior approach on the animal. A posterior approach was selected to minimize the distance between the transducer face and the spinal cord, allowing the highest possible operating frequency to be used. Once an elongated image of the spinal cord was obtained, the transducer was locked into a transducer mounting system, which secured the transducer in a stationary position. This allowed for consistent imaging throughout the entirety of the TCEUS sonogram. Sonographic imaging began 10 seconds prior to contrast administration to acquire nonenhanced images. 13 These images served as the reference for nonenhanced pixel intensity and provided a baseline for contrast-enhanced images to be compared. The contrast bolus was then administered, followed by 10 minutes of imaging. At the 10-minute point, the burst mechanism was activated, rupturing all microbubbles within the beam profile. 34 Imaging continued for 1 more minute to monitor the effect of the bursting pulse on contrast distribution. This was done to confirm contrast microbubble binding to the targeted inflammatory biochemical marker. 70 All images were recorded in the form of video clips (AVI), which allowed for the option of selecting individual frames during the analysis process. All TCEUS sonograms were performed by a credentialed sonographer, with experience in human and animal musculoskeletal imaging.
Data Analysis
Retrospective TCEUS analysis was performed using the Vevo analysis computer software. A region of interest was drawn around the spinal cord at the level of T9 using electronic calipers. The region of interest was then applied to the entire 10-minute AVI of the TCEUS sonogram. This provided a quantified value of average enhanced pixel intensity within the T9 spinal cord for each frame of the TCEUS. Signal or pixel intensity is directly related to the density of accumulated microbubbles. 71 Therefore, enhanced pixel intensity represents microbubble binding and P-selectin expression. Pixel intensities were plotted over time to generate contrast time intensity curves. These were constructed so that a qualitative assessment of targeted contrast agent temporal behavior could be made, in addition to a quantitative assessment of the signal intensity data.72–76
From the generated time intensity curves, outcome measures of area under the curve (AUC), maximum pixel intensity (MPI), and signal due to bound contrast (SDBC) were calculated.7,77 This allowed inferential statistics to be used for the comparison of outcome measures among time points and between doses. Outcome measures are defined as follows: AUC (area under the time intensity curve), MPI (highest pixel value in the time intensity curve), and SDBC (pixel intensity obtained 100 frames before the burst subtracted from the pixel intensity from the 100 frames after the burst mechanism).7,77
Analysis consisted of averaging each of the outcome measures by dose, within each time point of the study (0D, 7D, and 42D). Further analysis consisted of comparing each time point with both dosing values combined, as well as comparing each dose, with all time points combined. These were then graphically displayed to provide a visual representation of P-selectin expression throughout the 42 days of the study, based on TCEUS outcome measures.
Nonparametric comparison testing was used for inferential statistics of the TCEUS outcome measures. This consisted of a Kruskal–Wallis (K-W) analysis of variance H test, followed by individual Wilcoxon signed-rank sum tests. Last, paired one-way Student t tests were used to determine if a significant drop in pixel intensity occurred upon activation of the burst mechanism. This was done using the pixel intensities of the 100 frames prior to and 100 frames following the burst mechanism and was performed for each of the TCEUS scans.34,70 All statistical analyses were conducted in SPSS (version 21), with an a priori alpha ≤ .05. A post hoc Bonferroni correction was applied to all significance values.
Results
Findings from this study serve as preclinical evidence for the applications of molecular ultrasound imaging of spinal cord inflammation and build upon existing formative evidence for the ultimate goal of clinical translation.
Longitudinal Comparison
Mean AUC, SDBC, and MPI values visually demonstrate a peak at 7D while administering both the 30-μL and 100-μL doses; however, this difference was unable to be validated with statistical significance (Figures 1-3).
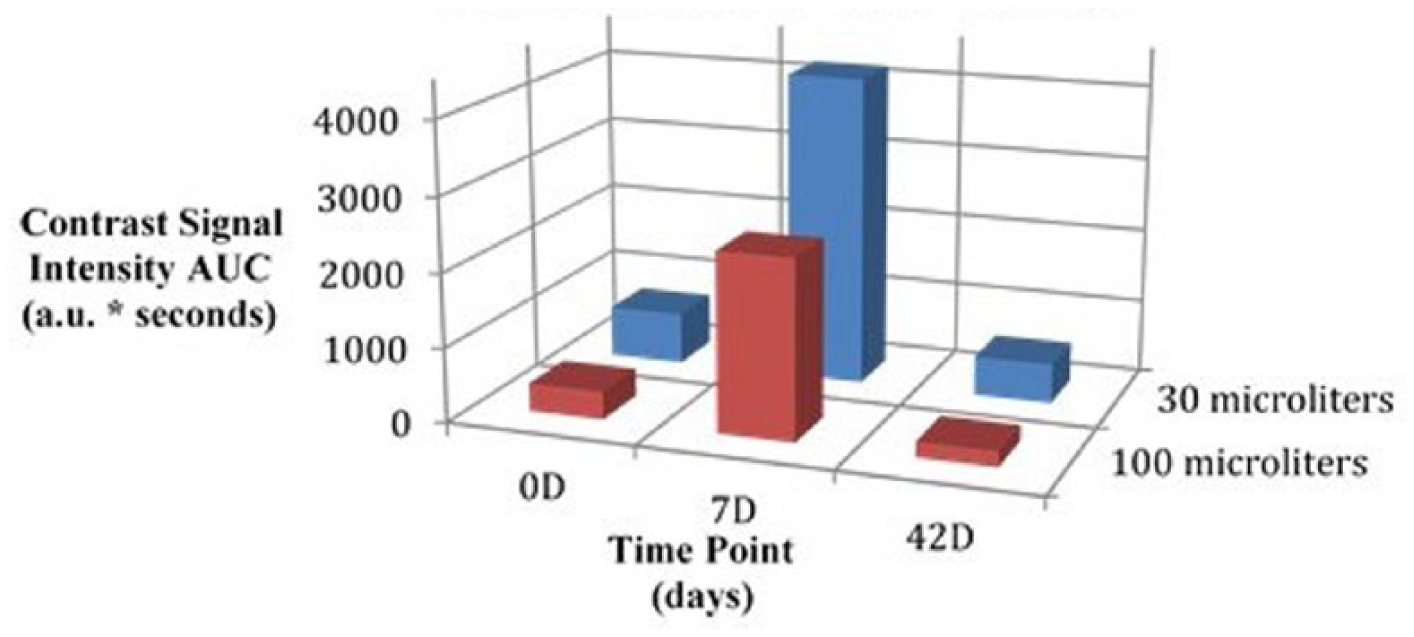
Three-dimensional bar graph comparing area under the curve outcomes at each imaging time point by dose.
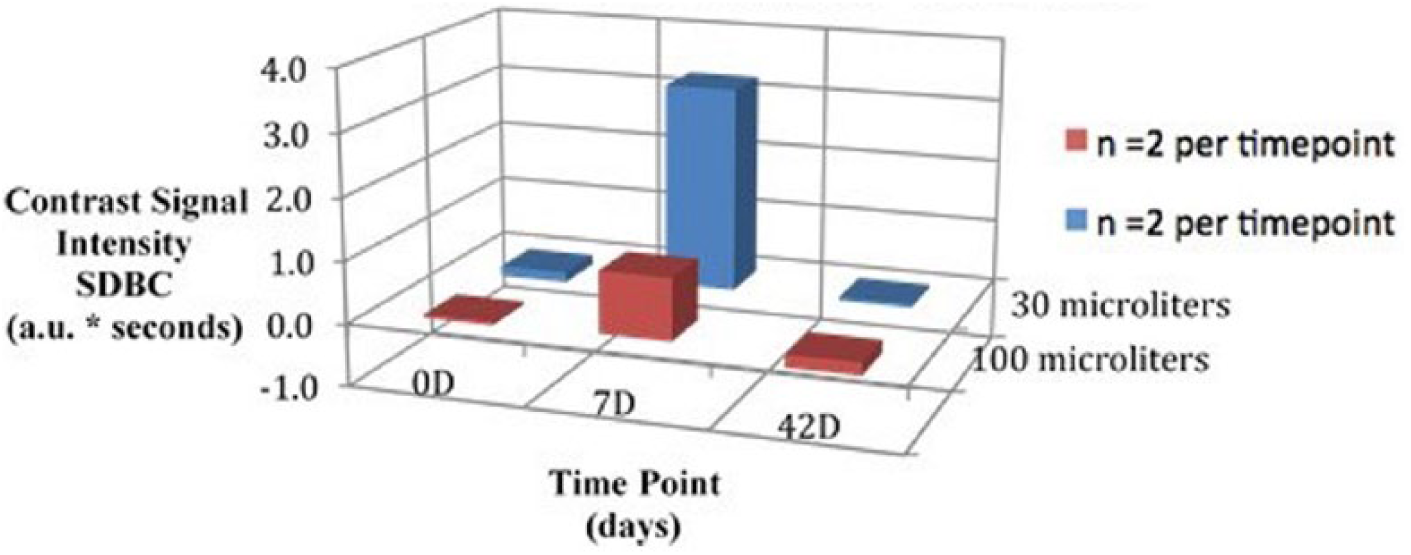
Three-dimensional bar graph comparing signal due to bound contrast outcomes at each imaging time point by dose.
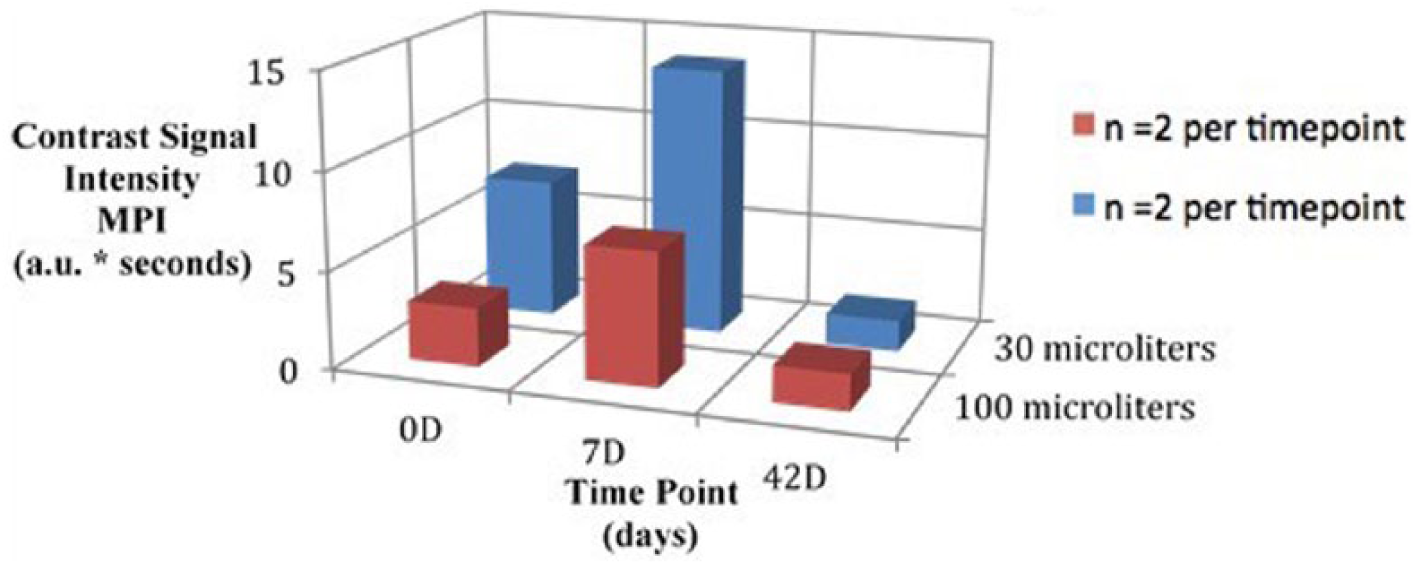
Three-dimensional bar graph comparing maximum pixel intensity outcomes at each imaging time point by dose.
K-W testing revealed no significant differences between time points for the 30-μL dose in AUC, χ2(2) = 2.57, P = .28; SDBC, χ2(2) = 0.60, P = .74; and MPI, χ2(2) = 3.71, P = .16; and no significant differences between time points for the 100-μL dose in AUC, χ2(2) = 4.57, P = .10; SDBC, χ2(2) = 0.86, P = .65; and MPI, χ2(2) = 0.86, P = .65. Further K-W testing also revealed no significant differences between time points when combining outcome measures from both doses in AUC, χ2(2) = 5.12, P = .08; SDBC, χ2(2) = 0.48, P = .79; and MPI, χ2(2) = 4.50, P = .11. A summary of nonparametric comparisons can be found in Table 1.
Kruskal–Wallis Values Used to Compare Outcome Measures Between Each Time Point, Separated by Dose. a
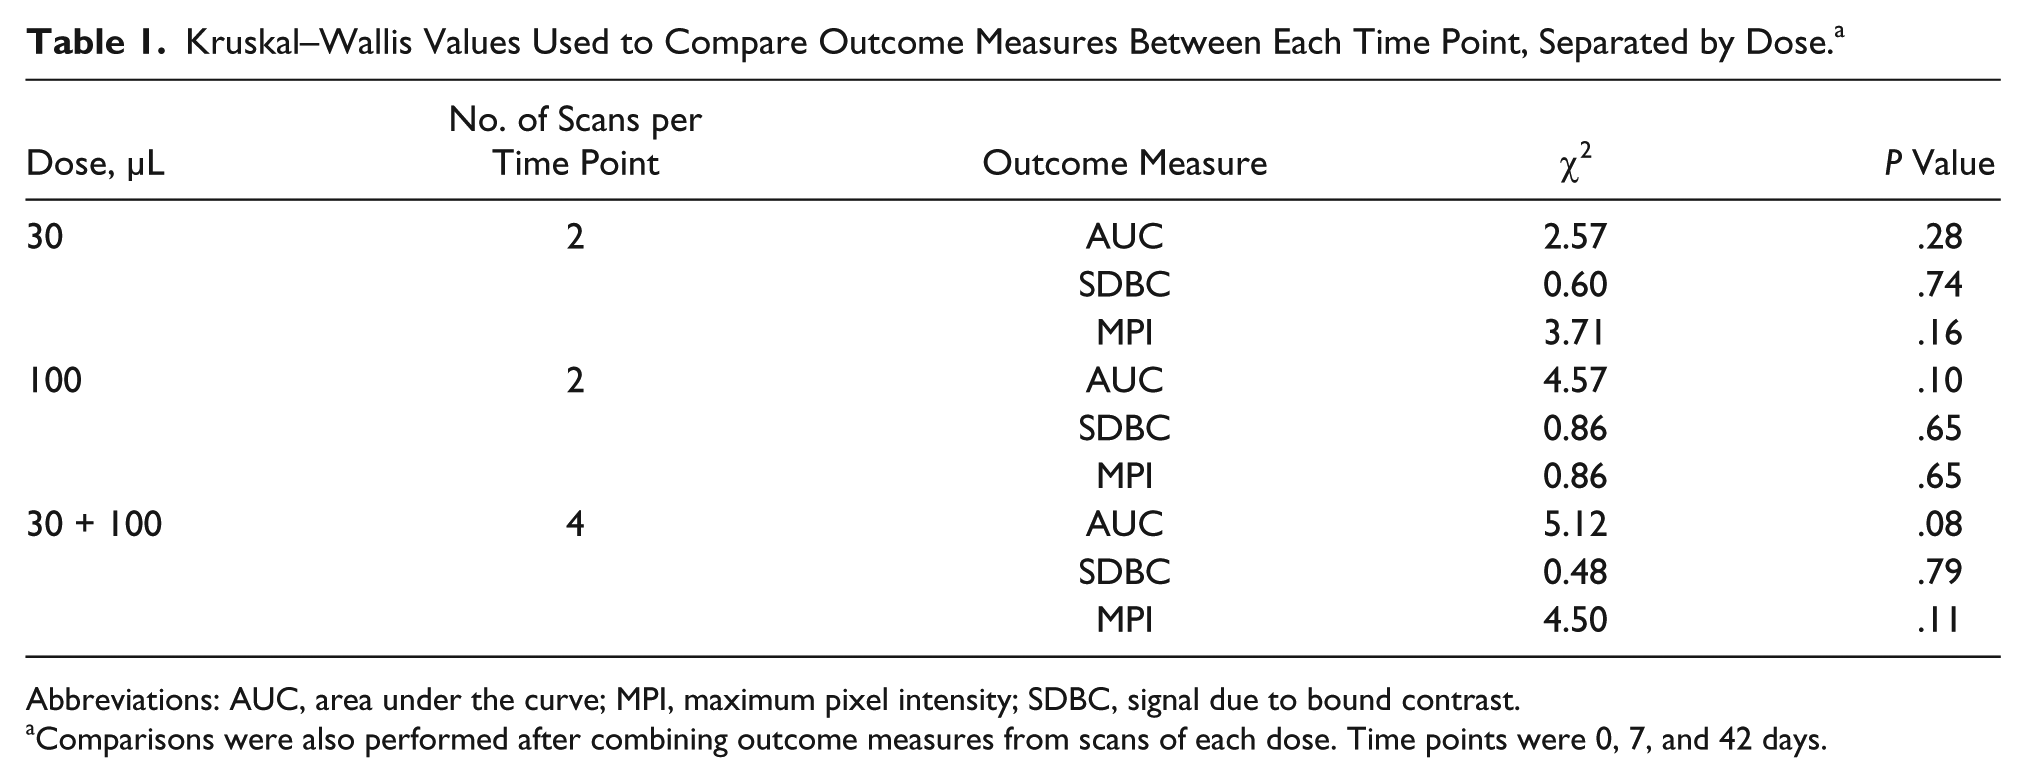
Abbreviations: AUC, area under the curve; MPI, maximum pixel intensity; SDBC, signal due to bound contrast.
Comparisons were also performed after combining outcome measures from scans of each dose. Time points were 0, 7, and 42 days.
Dosing Comparison
Visual assessment outcome measures demonstrated larger AUC, SDBC, and MPI values obtained from the 30-μL TCEUS compared with the 100-μL TCEUS, at each of the three data collection points. However, this difference was unable to be validated with statistical significance. K-W testing revealed no significant differences between 30-μL and 100-μL doses at 0D on the measures of AUC, χ2(2) = 2.40, P = 0.12, SDBC, χ2(2) = 1.50, P = 0.22, and MPI, χ2(2) = 0.60, P = 0.44; no significant differences between 30-μL and 100-μL doses at 7D on the measures of AUC, χ2(2) = 0.00, P = 1.00, SDBC, χ2(2) = 0.00, P = 0.00, and MPI, χ2(2) = 0.60, P = 0.44; and no significant differences between 30-μL and 100-μL doses at 42D on the measures of AUC, χ2(2) = 2.40, P = 0.12, SDBC, χ2(2) = 2.40, P = 0.12, and MPI, χ2(2) = 0.00, P = 1.00. However, Wilcoxon testing did reveal greater 30-μL AUC values of statistical significance compared with 100-μL AUC values, when combining all time points for comparison (z = 2.20, P = .028). This significant difference was not reflected in the SDBC (z = 1.78, P = .075) or MPI (z = 0.94, P = .35) measures. A summary of nonparametric comparisons can be found in Table 2.
Kruskal–Wallis Values Used to Compare Outcome Measures Between Each Dose, Separated by Time Point. a
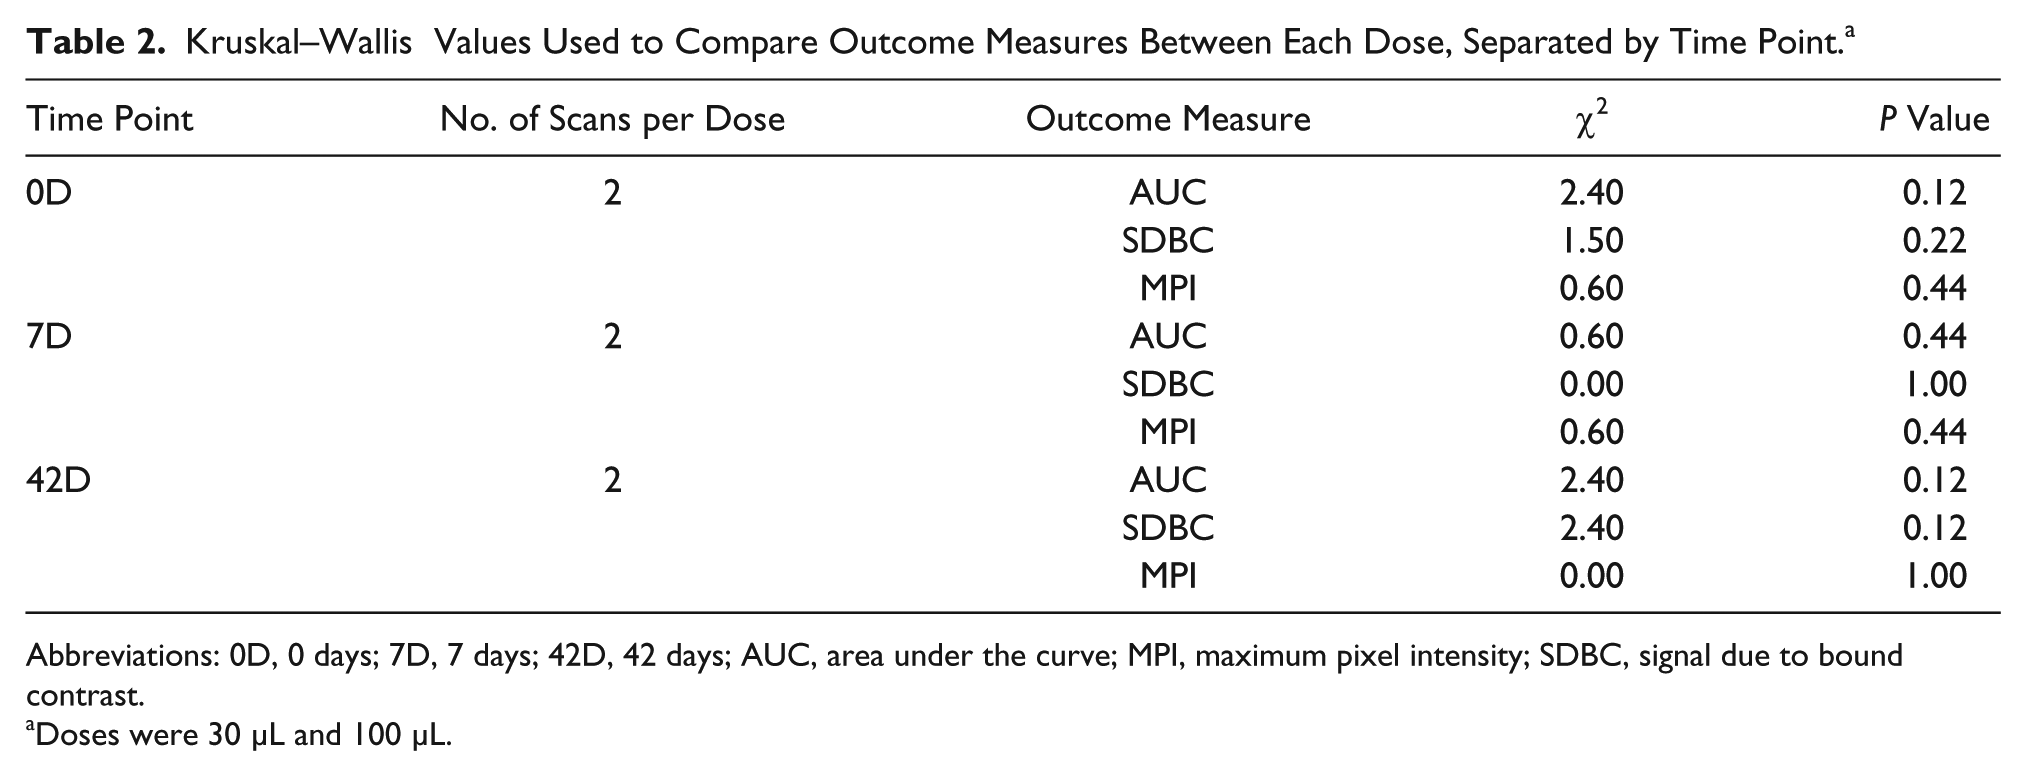
Abbreviations: 0D, 0 days; 7D, 7 days; 42D, 42 days; AUC, area under the curve; MPI, maximum pixel intensity; SDBC, signal due to bound contrast.
Doses were 30 μL and 100 μL.
Discussion
Medical imaging has been a method for recording structural anatomy and associated pathophysiologic conditions. Molecular ultrasound imaging represents a powerful tool that has the capability to go below the level of structural anatomy, to gather information on biochemical processes noninvasively, causing it to become increasingly popular in preclinical research.11,20,43,78 Ultrasound contrast microbubbles modified to target and adhere to specific molecules provide a strong nonlinear acoustic signal, which increases sonogram spatial resolution.10,79 Furthermore, the ability to adjust the central operating frequency of the insonating acoustic wave provides the capacity to increase tissue penetration while imaging deeper structures.
Previously, this research team has reported the utility of a variety of TCEUS outcome measures for their ability to detect neural inflammation. These measures included AUC, MPI, SDBC, time to peak intensity, rise time, and positive gradient.7,49,77,80,81 Those findings suggested that time to peak intensity, rise time, and positive gradient did not adequately detect expression in any of the targeted CAMs being investigated. For this reason, these measures did not justify further investigation and were not used in the present study. The decision to abandon further investigation of these measures was also influenced by the TCEUS literature, which commonly reports the use of the three parameters that we retained from our previous work (AUC, SDBC, and MPI).7,77
In addition to investigating multiple TCEUS outcome measures, this team of investigators has reported on work that demonstrated the ability to detect a variety of CAMs in the presence of acute spinal cord inflammation. Among the CAMs investigated, microbubbles targeted against P-selectin were highly successful in their ability to detect its expression, as its derived outcome measures were among the highest of the inflammatory markers explored. These findings are consistent with the literature, as the success of targeting P-selectin for the detection of inflammation has been reported in a variety of tissues.41,42,48,82–93 Successful targeting of this protein may be due to it being the largest molecule of the selectin family, or its uniqueness of being expressed on the surfaces of both platelets as well as the endothelium.53–55 Nevertheless, further investigation beyond proof of principle, proof of concept, and feasibility studies was warranted.
A limited number of studies in the literature have been dedicated to investigating the longitudinal use of TCEUS. Therefore, the objective of the present study was to build upon the body of literature by extending the evidence to include longitudinal TCEUS imaging of neural tissue during the inflammatory process. For the clinical application of treatment monitoring, longitudinal studies are necessary to ensure that molecular ultrasound imaging possesses appropriate levels of sensitivity and specificity to detect disease processes at varying degrees of severity. This was investigated by Masseau et al., 46 in which the effects of exercise on vascular cell adhesion molecule 1 (VCAM-1) expression in carotid artery atherosclerosis were explored. In a swine model, TCEUS imaging was able to detect differences in VCAM-1 expression, as pixel intensity was significantly decreased in the exercise group compared with the control group. 46 Also investigating atherosclerosis, Kaufmann et al. 45 reported the detection of significant elevations in pixel intensities produced by targeting P-selectin and VCAM-1 in a murine model, with increasing levels of atherosclerotic severity.
A comparable study investigated microbubbles targeted to tumor angiogenic markers in breast, ovarian, and pancreatic tumor xenografts of varying severities. 37 Similarly, successful results, reported as significantly larger pixel intensities, were observed in the various tumor sizes when compared with negative control injections. A finding of a substantial decrease in pixel intensity was reported upon administration of blocking antibodies used to mimic a therapeutic effect. 37
The present study does not incorporate a treatment to reduce the inflammatory response. Instead, a longitudinal design was used that encompasses multiple phases of the inflammatory disease process. The 7D time point represents the acute phase of inflammation, whereas the 42D time point represents the chronic phase.64–68 P-selectin promotes the capturing of rolling leukocytes on the endothelial surface in the early stages of the inflammatory cascade and is acutely expressed at high levels subsequent to an inflammatory stimulus.3,53,94 It has previously been reported that peak immunoreactivity occurs at 7 days following SCI in a murine model.61,95,96 Conversely, minimal levels of P-selectin are expressed during the chronic stages of inflammation due to the formation of dense connective tissue and a decrease in lesion size.65–67,95 This understanding of P-selectin expression is consistent with the findings of this study, made evident by the peak in TCEUS outcome measures at 7D, when P-selectin expression was presumably at its greatest. The 7D time point was compared with the much smaller values of TCEUS outcome measures obtained at 0D and 42D, in which P-selectin expression levels were presumably diminished and/or negligible.62–68
Another longitudinal study reported results consistent with the current findings, in which researchers investigated the inflammatory response associated with vasculogenesis, by targeting microbubbles to VCAM-1. 40 This study was also performed in a murine model and reported that targeted imaging of an ischemic distal common iliac artery at 2, 4, 7, and 21 days correlated temporally with histologic findings. 40 Other studies also reporting the ability to capture longitudinal changes in biomarker expression include TCEUS imaging of malignant gliomas and human colon cancer, in which vascular integrins and vascular endothelial growth factor receptor 2 (VEGFR-2) were targeted, respectively.38,39
In addition to longitudinal imaging, this study also examined the effects that variable dosing volumes of targeted ultrasound contrast had on TCEUS outcome measures. The ability of molecular imaging to accurately detect varying levels of molecular expression may be directly related to the amount of targeted contrast administered. Therefore, investigations toward determining appropriate dosing volumes are a necessity. The current investigators’ work, as well as much of the literature, reports the use of a 30-μL bolus injection for murine molecular ultrasound imaging. It is unclear how this parameter was originally established; therefore, investigation is warranted to determine its level of appropriateness. 36 A dose of 100 μL was chosen for comparison with 30 μL, as this dose was reported in the previously described study conducted by Deshpande et al. 37 in 2011.
Comparing TCEUS sonograms performed using both dosing parameters revealed that the average AUC, MPI, and SDBC at each time point were higher during the administration of the 30-μL dose, although it is not of statistical significance, likely due to the small sample size used. However, while combining all time points, AUC values obtained using the 30-μL dose were found to be greater with statistical significance when compared with the 100-μL dose. Although seemingly counterintuitive, these findings are supported by a study performed by Leguerney et al., 43 in which an even larger dose of targeted ultrasound contrast (300 μL) was used. This study reported the inability to detect changes in tumor angiogenesis markers longitudinally while subjects underwent sorafenib treatment. 43 These results, in conjunction with the findings of our study, suggest that larger doses of targeted ultrasound contrast may not be as effective in detecting endothelial molecules as smaller doses. However, both studies are preclinical and were performed with small sample sizes. Additionally, these studies were performed in different tissue types, targeting different physiologic markers. Consequently, further research on this topic is needed to draw definitive conclusions.
It is worth noting that continued work in the area of gene therapy delivery has reported the ability of ultrasound contrast microbubbles to reversibly disrupt the vascular endothelium, thereby altering its membrane permeability.97–99 This is known as sonophoresis or sonoporation and is used to facilitate the passage of therapeutic agents out of the intravascular space. 100 An inverse correlation has been found between the degree of permeability change and ultrasound insonation frequency.101,102 It has also been reported that a direct relationship may exist between the size or amount of microbubble volume and the extent of endothelial disruption that occurs. 103 Therefore, there is a theoretical possibility that bursting ultrasound contrast microbubbles could result in larger amounts of endothelial damage and, in turn, lessen CAM expression. This provides a potential explanation of our findings, as pixel intensity outcome measures obtained while imaging with 100 μL were markedly reduced when compared with those from the 30-μL dose.
This is supported by studies investigating gene therapy delivery via ultrasound contrast microbubbles to neural tissue.104–108 These studies closely examine the relationship of microbubble sonophoretic effects with blood–brain barrier permeability and the intraneural microvascular endothelium, in hopes that ultrasound contrast agents could someday be a noninvasive method for local gene or drug delivery.109,110 It would seem from this early work that imaging at lower frequencies has demonstrated cellular damage, which could change the amount of binding expected with a higher dose of contrast media. The development of pores and breaks in the blood–brain barrier could point to disruption of cellular function, especially after a burst mechanism. It is unfortunate that these studies were performed with insonating frequencies of no more than 3 MHz and may not be comparable with the current work that employs a much higher frequency (40 MHz) for imaging. However, endothelial membrane permeability alterations have been reported to be theoretical in frequencies up to 40 MHz in some tissue types. 111 This possibility gives merit to further exploration into this area to uncover the potential effects that large amounts of accumulated contrast microbubbles have on the endothelial tissue once they are burst.
This discussion underscores the need for replication studies to determine if the decrease in sensitivity seen with the 100-μL dose may be attributed to what could be an inappropriately high dose of contrast agent. Further investigations could also provide insight as to whether this is a technical problem applicable to all applications of molecular ultrasound imaging or if it varies among the type of tissue and the physiologic molecular target.
Limitations
Several important threats exist that limit the ability to generalize the results of this study. This research employs a pre-experimental research design with a small subject number and thereby poses significant threats to internal and external validity. Additionally, an inherent limitation for molecular ultrasound imaging is that the obtained pixel intensity parameters are indirect measures of P-selectin expression. Therefore, results are limited to only those molecules being expressed within the ultrasonic beam profile.41,42,112 Although measures were taken to ensure that the ultrasound transducer was placed directly over the epicenter of the spinal cord lesion, 3D imaging is required to provide a holistic representation of P-selectin expression throughout the entire T9 spinal cord.17,32 Another limitation of the ultrasound imaging technology arises during image processing. The Vevo 2100 ultrasound unit uses digital subtraction technology to display areas of enhanced imaging (i.e., contrast microbubbles) and, therefore, may not possess the sensitivity to detect very low levels of contrast binding. 17 Although not a primary concern for the 7D sonograms, this limitation could influence signal intensity measures obtained at 0D and 42D.
To capture P-selectin expression during the different stages of inflammation, TCEUS imaging was performed on 0D, 7D, and 42D post-SCI. Yet, large time gaps are present between data collection time points, which may have caused these findings to not be fully inclusive of P-selectin expression activity during the inflammatory process. Also, a histologic gold standard such as immunohistochemistry would be needed as a confirmatory step of the indirect imaging signal intensity measures. Instead, the burst mechanism was used as a confirmatory measure for microbubble binding, as it is the commonly accepted radiologic standard for this purpose. 70
Furthermore, it is important to indicate that the nanoengineering technique used in this study is not conducive for clinical use, as a biotin-streptavidin biotinylation technique was used for ligand attachment. The streptavidin protein is immunogenic in humans, making its clinical use contraindicated.38,113–115 Recently, a more clinically appropriate replacement for streptavidin has been developed and is beginning to be investigated. NeutrAvidin employs the same binding capacity of streptavidin; however, it is of an acceptable isoelectric point (pI) level for human use. 116 It would be advantageous for future studies to adopt this biotinylation technique, as it is more appropriate for clinical translation.
Last, this study was conducted in vivo, and therefore, these findings are unable to account for variations in stress inflicted on the bound microbubble-ligand structure. It is unlikely that shear force generated from arterial pressure was great enough to cause detachment of bound microbubbles, as the binding technique used has been demonstrated to be successful in supra-arterial stress conditions. 117 However, variations in arterial forces between subjects and across time points create a confounding variable and could influence comparisons of microbubble binding. 40 Likewise, intravascular shear stress could also be created as a result of microbubble cavitation. 106 Through a sonophoretic process, the rupturing of bound and unbound microbubbles could generate enough shear stress to damage the neighboring endothelium. Due to P-selectin being expressed on its surface, a damaged endothelium has the potential to drastically alter detected signal intensity measures. Although sonophoresis is most often reported at lower frequencies (< 3 MHz), the theoretical possibility of its occurrence remains.104–108,111,118
Conclusion
The objective of this study was to extend previously reported proof of principle outcomes regarding the use of P-selectin to detect inflammation in neural tissue. This was accomplished by investigating its ability to detect targeted ultrasound contrast at varying stages throughout the inflammatory process. Additionally, two dosing volumes were incorporated into the research design in order to contribute to the body of literature regarding molecular imaging and its associated dosing parameters. These results demonstrate the ability to indirectly detect changes in P-selectin expression throughout phases of the inflammatory process. This is represented by an increase in signal intensities measured during acute inflammation where P-selectin is believed to be greatly expressed, compared with diminished signal intensities measured prior to injury and during the chronic phase of inflammation, in which levels of P-selectin expression are expected to be minimal. Although inferential statistical analysis of the longitudinal data lacked significance, likely due to the small sample size used, appreciable differences in signal intensities were observed longitudinally between time points and warrant further investigation in this area. Likewise, inferential statistical analysis of the dosing parameters lacked statistical significance at each time point, although by combining all time points, the lower dose of 30 μL yielded greater AUC values of statistical significance when compared with the 100-μL contrast agent dose.
Footnotes
Declaration of Conflicting Interests
The authors declared no potential conflicts of interest with respect to the research, authorship, and/or publication of this article.
Funding
The authors received financial support from the ASRT Foundation and Targeson LLC for their research.