
Abstract
Objective: To evaluate the diagnostic performance of shear wave elastography in the estimation of fibrosis in patients with chronic liver disease by using biopsy and/or serum markers as reference standard. Materials and methods: 100 patients underwent point quantification-shear wave elastography, for whom noninvasive serum fibrosis indices like APRI, FIB-4, and King’s score were calculated. The receiver-operator characteristic (ROC) curve analysis was performed. Results: The shear wave elastography measurements showed moderate agreement with APRI, FIB-4, and fair agreement with King’s score. The AUROC for differentiating F0-F1, F2-F3, F2-F3, and F4 are 0.873 and 0.504 respectively using APRI as reference standard. The cutoff values derived for differentiating F0-F1 and F2-F3 was 7.07 and for differentiating F2-F3 and F4 was 11.94. Conclusion: The diagnostic performance of shear wave elastography is comparable with that of serum fibrosis indices APRI and FIB-4.
The stage of fibrosis is important for the prognosis and management of chronic liver disease. 1 The gold standard test for the diagnosis of fibrosis in chronic liver disease is liver biopsy. 2 The drawbacks of liver biopsy are that it is invasive, is associated with morbidity and sampling errors, 3 and has many contraindications such as abnormal clotting parameters and decreased platelet count, which are common in chronic liver disease. Noninvasive methods based on imaging techniques such as shear wave elastography and serologic tests such as the aspartate aminotransferaseto-platelet ratio index and fibrosis-4 score, which are used to assess the stage of fibrosis in chronic liver disease, are gaining increasing acceptance in view of these disadvantages of liver biopsy. The purpose of this study was to evaluate the correlation between point quantification shear wave elastography (SWE; ElastPQ) and serum markers in the assessment of fibrosis and also to evaluate the diagnostic performance of ElastPQ using serum markers and/or biopsy as the reference standard.
Elastography is an imaging technique that images or quantifies the elasticity (mechanical properties) of the biological tissues.4,5 In these techniques, a force is applied and the tissue response is observed. The SWE techniques are divided into three different groups: ElastPQ, transient elastography (TE), and two-dimensional (2D) SWE depending on the type of force applied and the method used for measuring or displaying the tissue response.6,7
ElastPQ provides tissue stiffness information. 8 ElastPQ is an elastography mode on the ultrasound equipment in which a burst of push pulses is transmitted, creating shear waves in the soft tissues. The tissue stiffness is estimated by determining the speed at which these shear waves travel.
One-dimensional TE (e.g., Fibroscan) is a dynamic elastographic technique in which the stimuli used are low-frequency vibrations (50 Hz). An ultrasound transducer is mounted on the axis of a vibrator for TE. The vibrations produce shear waves in the tissues. The shear wave speed is measured and displayed in a quantitative manner. No real-time imaging is available using this technique. The operator has to use percussion on the right side of the chest and right hypochondrium and an A-mode image for selection of liver tissue, which may give rise to errors.
Multidimensional SWE (e.g., 2D SWE and 3D SWE) is an adynamic elastographic technique in which focused ultrasound beams are transmitted continuously to tissue at different depths. As in TE and ElastPQ, the property is measured in shear wave speed. However, the region of interest (ROI) is fan shaped and larger than the ROI with other modalities. The shear wave speed measurements are displayed in the form of a 2D map.
Limited research has been done on the ElastPQ technique.8–10 This study was completed to further assess the accuracy of ElastPQ in assessing the stage of fibrosis.
Materials and Methods
This prospective study was conducted in the Department of Radiodiagnosis and Imaging, Kasturba Medical College, Manipal, India, from September 2015 to Augusut2017. Institutional ethics committee approval was obtained a priori. Informed consent was taken from the recruited patients. The study prospectively enrolled 100 patients who (1) had a proven case of cirrhosis based on histopathology (HPE), (2) were diagnosed with a chronic liver disease (viral hepatitis B or C, sonographic features of chronic liver disease such as a coarse echotexture and surface nodularity), or (3) suspected to have chronic liver disease with risk factors such as alcohol intake or abnormal liver function tests. Pregnant patients and patients with breathlessness or those who could not hold their breath were excluded from the study.
The ultrasound equipment used for the study was a Phillips EPIQ5, which allowed for conventional gray-scale imaging and SWE measurements. The elastography technique employed by the EPIQ5 US system was ElastPQ. ElastPQ was given the approval of the US Food and Drug Administration for a liver stiffness measurement (LSM). A convex transducer (C5-1) was used for conventional sonography as well as SWE measurements.
The patient was placed in the supine position or in the left lateral position with the right arm abducted. Conventional gray-scale sonography was performed initially. Depending on those sonographic findings of the liver, the patients were classified as having coarse echotexture or fatty infiltration or normal echotexture.
Point Quantification SWE
SWE measurements were obtained through an intercostal approach. After placing the probe over the abdomen, the patient was asked to hold his or her breath, and the gray-scale sonographic image was used to place the ROI in an area of the liver that was devoid of visible ducts and vessels. The size of the ROI was predetermined on the ultrasound equipment, at 0.5 cm × 1.5 cm. The ROI was placed at a distance <8 cm from the liver capsule, which was positioned using the trackball of the equipment console. On pressing the “update” button, the stiffness was expressed in terms of kilopascals (kPa) of Young’s modulus. Fifteen serial SWE measurements were taken on every patient. The ultrasound equipment displayed the “Stiffness Average,” based on the 15 SWE measurements taken as an indication of liver stiffness, for that particular patient.
Depending on the value of obtained SWE measurements, an assessment of significant fibrosis (F ⩾ 2), advanced fibrosis (F ⩾ 3), and cirrhosis (F = 4), respectively, were matched to the cutoff values 6.43 kPa, 9.54 kPa, and 11.34kPa, as reported by Ferraioli et al. 8
In seven patients, liver biopsy was performed under sonographic guidance and a 16- to 18-gauge full core biopsy instrument. All biopsy specimens were fixed in formalin. Staging of liver fibrosis was done according to the METAVIR scoring system 9 on a scale from 0 to 4 as follows: F0, no fibrosis; F1, portal fibrosis without septa; F2, portal fibrosis with few septa; F3, septal fibrosis without cirrhosis; and F4, cirrhosis.
Serum Liver Fibrosis Indices
For all patients, serologic tests including total bilirubin, alanine transaminase, aspartate transaminase (AST), alanine transaminase (ALT), alkaline phosphatase, platelet count, and prothrombin time were performed. Liver fibrosis indices, including aminotransferase-to-platelet ratio index (APRI), fibrosis-4 (FIB-4), and King’s score, which have previously proved to be efficient in the estimation of liver fibrosis, were used in this study.
The serum algorithm models, AST to APRI, FIB-4 index, and King’s score were calculated as follows:
APRI (AST-to-platelet ratio index):
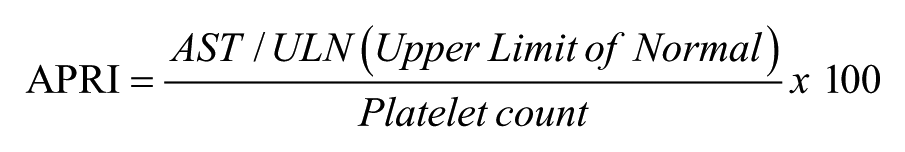
where the upper limit (UL) was considered to be 40 U/L. 11
FIB-4 index:
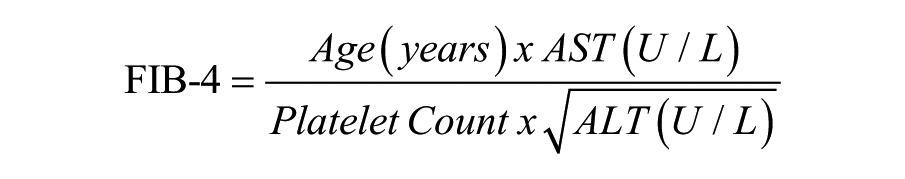
where A is age (in years), AST and ALT were measured in units per liter, and PLT was measured in 109 per liter. 12
King’s score:

where INR is the international normalized ratio. 13
Depending on the APRI values obtained, the patients (n = 100) were divided into the following groups: no significant fibrosis (F0–F1), significant fibrosis–advanced fibrosis (F2–F3), and cirrhosis (F = 4), based on the cutoffs of 0.5 and 1 reported in a recent meta-analysis by Xiao et al. 14
Depending on the FIB-4 values obtained, the patients (n = 100) were divided into the following groups: no significant fibrosis (F0–F1), significant fibrosis (F ⩾ 2), advanced fibrosis (F ⩾ 3), and cirrhosis (F = 4), based on the cutoffs of 0.8, 1.45, and 1.6 referenced in a recent meta-analysis. 14
Depending on the patients’ King’s score values, they (n = 100) were divided into the following groups: no significant fibrosis (F0–F1), significant fibrosis–advanced fibrosis (F2–F3), and cirrhosis (F = 4), based on the cutoffs of 12.3 and 16.7 published by Cross et al. 13
Statistical Analysis
Statistical analysis was performed using SPSS20. Descriptive statistics were produced for the demographic characteristics of the patients in the study sample. The level of agreement between SWE and serum fibrosis indices (APRI, FIB-4, King’s score) was measured using the Kendall tau correlation coefficient. The diagnostic performance of SWE for staging liver fibrosis compared with serum fibrosis indices APRI, FIB-4 (reference standards), was assessed using receiver-operator characteristic (ROC) curves and the area under the curve (AUROC) analysis. The mean and median values of patients with sonographic findings of coarse echotexture, fatty infiltration, and normal echotexture were calculated.
Results
The SWE measurements and serum fibrosis indices for 100 patients are reported as follows:
The mean age of the patients was 46.9 years, with the maximum number of patients in the age group of 30 to 39 years. Among the 100 patients, 24 were women and the remainder were men.
The distribution of stage of fibrosis among the 100 patients was segregated into a lack of significant fibrosis (F0–F1), significant-advanced fibrosis (F2–F3), and cirrhosis (F4) based on the SWE measurements, APRI values, FIB-4 values, and King’s score (see Table 1).
Distribution of the Sample Into No Significant Fibrosis (F0–F1), Significant and Advanced Fibrosis (F2–F3), and Cirrhosis (F4) Based on SWE Measurements, APRI Values, FIB-4 Values, and King’s Score.
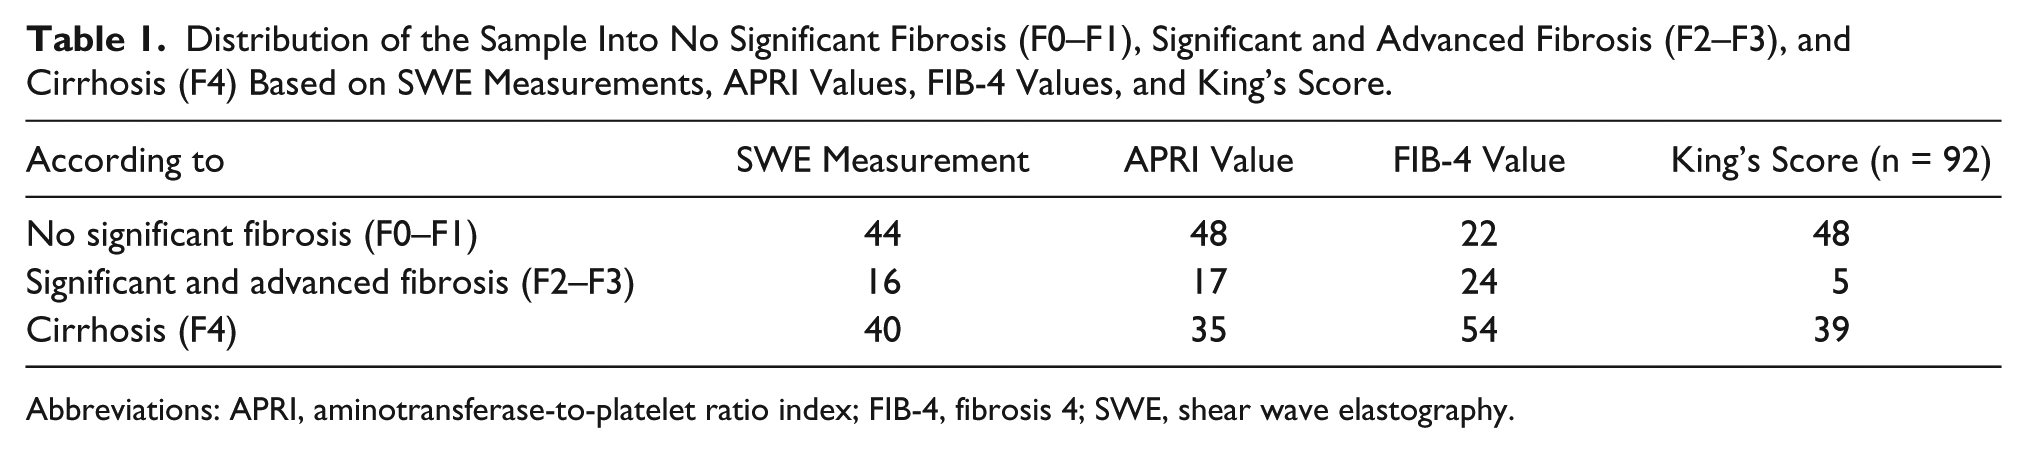
Abbreviations: APRI, aminotransferase-to-platelet ratio index; FIB-4, fibrosis 4; SWE, shear wave elastography.
Performance of SWE in the Estimation of Fibrosis
The level of agreement between the liver stiffness measured by SWE and serum fibrosis indices was evaluated by using the Kendall Tau C correlation coefficient. The Kendall Tau C correlation coefficient between the SWE measurements and APRI, the SWE measurements and FIB-4 values, and the SWE measurements and King’s score were 0.46, 0.44, and 0.39, respectively.
The diagnostic ability of SWE to differentiate the stage of fibrosis was evaluated by ROC curve analysis. Patients were divided into a lack of significant fibrosis (F0–F1), significant-advanced fibrosis (F2–F3), and cirrhosis (F4), taking APRI values as the reference standard. The ROC curves were plotted using SWE measurements for (1) prediction of significant-advanced fibrosis (F2–F3) over a lack of significant fibrosis (F0–F1) and (2) prediction of cirrhosis (F4) over significant-advanced fibrosis (F2–F3)
The AUROC was 0.873 for the prediction of significant and advanced fibrosis (F2–F3) over a lack of significant fibrosis (F0–F1) using SWE measurements, and the cutoff value of the SWE measurements with optimum sensitivity and specificity was 7.07 (see Figure 1). The AUROC was 0.504 for the prediction of cirrhosis (F4) over significant-advanced fibrosis (F2–F3) using SWE measurements, and the cutoff value of SWE measurements with optimum sensitivity and specificity was 11.94 (see Figure 2).
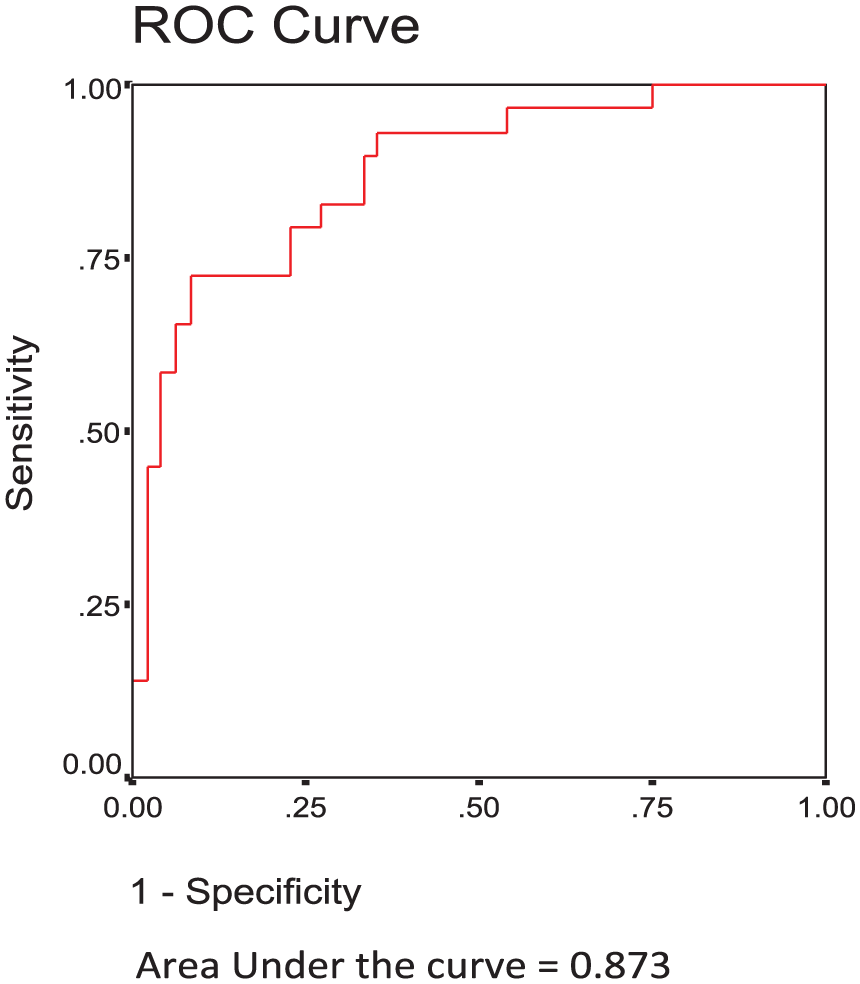
The receiver-operator characteristic curve for the prediction of significant and advanced fibrosis (F2–F3) over no significant fibrosis (F0–F1) using shear wave elastography measurements.
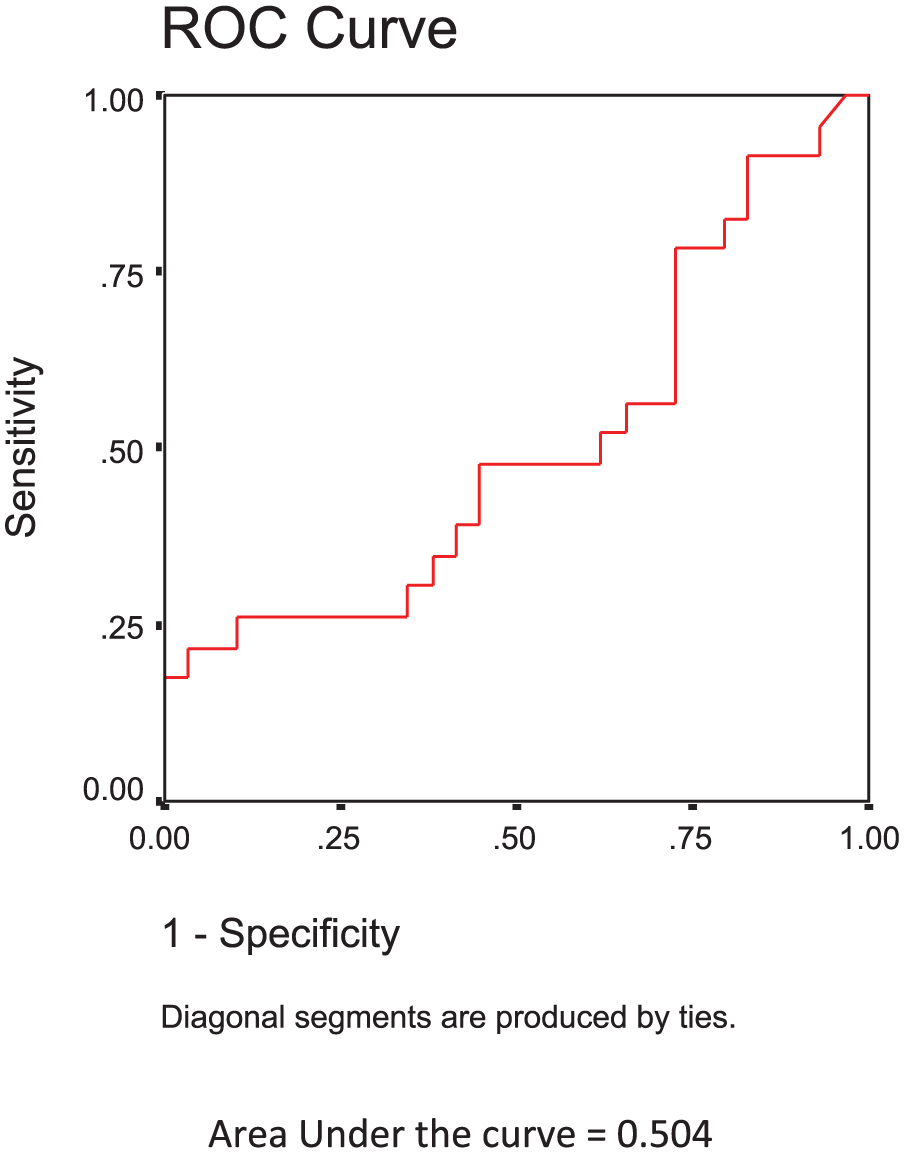
The receiver-operator characteristic curve for prediction of cirrhosis (F4) over significant and advanced fibrosis (F2–F3) using shear wave elastography measurements based on aminotransferase-to-platelet ratio index.
Comparison of SWE Measurements With Sonographic Findings
Among the 100 patients, 52 patients had coarse echotexture, 24 patients had fatty infiltration, and 24 patients had normal echotexture.
In patients with coarse echotexture, the mean value of SWE measurements was 28.8 kPa, and the median value was 16.1 kPa. In patients with fatty infiltration, the mean value was 6.8 kPa, and the median value was 5.3 kPa. In patients with normal echotexture, the mean value was 6.8 kPa, and the median value was 4.9 kPa.
The slightly elevated values of the mean of SWE measurements in patients with fatty infiltration and normal echotexture could likely be due to outliers. The median values of 5.3 kPa and 4.9 kPa in patients with fatty infiltration and normal echotexture correctly depicts the average SWE measurements in these groups. The comparison of SWE measurements based on ultrasonographic findings is given in Table 3.
Comparison of SWE Measurements With HPE Findings
Of the seven patients in whom HPE was done, both SWE and HPE indicated F4 (cirrhosis) in one patient. SWE demonstrated F4 (cirrhosis) and HPE indicated F3 (advanced fibrosis) in one patient. SWE demonstrated F4 (cirrhosis) and HPE indicated F2 (significant fibrosis) in three patients. In one patient, SWE demonstrated F4 (cirrhosis) and HPE indicated F1 (a lack of significant fibrosis). In one patient, SWE demonstrated F0–F1 (a lack of significant fibrosis) and HPE indicated F4 (cirrhosis)
Discussion
The management of chronic liver disease and its prognosis depends on the stage of fibrosis. 1 Liver biopsy is the gold standard for the diagnosis of liver fibrosis. In the past few years, there has been a decrease in the number of liver biopsies because of the availability of noninvasive methods such as SWE and serum fibrosis indices for liver fibrosis estimation. Serum fibrosis indices such as APRI, FIB-4, and King’s score are being used for the noninvasive assessment of liver fibrosis.9,11–13 A meta-analysis completed by Xiao et al. 14 indicated that serum fibrosis indices such as APRI, FIB-4, and King’s score have moderate sensitivity and accuracy in the identification of fibrosis.
Comparison of Liver Stiffness Measured by SWE and Serum Fibrosis Indices
The results of the present study demonstrated moderate agreement, based on the Kendall Tau C correlation coefficient, between the SWE measurements and APRI, which was 0.46. In addition, there was moderate agreement based on the Kendall Tau C correlation coefficient between SWE measurements and FIB-4, which was 0.44. The SWE measurements and King’s score showed fair agreement based on the Kendall Tau C correlation coefficient between SWE and FIB-4, which was 0.39.
Based on a limited search, there were no previous studies comparing the SWE measurements and serum fibrosis indices. Lee et al. 15 and Lu et al. 16 evaluated the correlation of SWE measurements and serum fibrosis indices (APRI and FIB-4) with HPE findings. Lee et al. 15 reported a significant positive correlation of ElastPQ, TE, and APRI with HPE findings. Lu et al. 16 concluded that liver stiffness (based on ElastPQ) demonstrated a significantly stronger correlation compared with fibrosis stages than APRI and FIB-4.
Diagnostic Performance of SWE: ROC Curve Analysis
In the present study, the AUROC for the prediction of significant-advanced fibrosis (F2–F3) over a lack of significant fibrosis (F0–F1), using SWE, was higher compared with the AUROC for the prediction of cirrhosis (F4) over significant-advanced fibrosis (F2–F3).
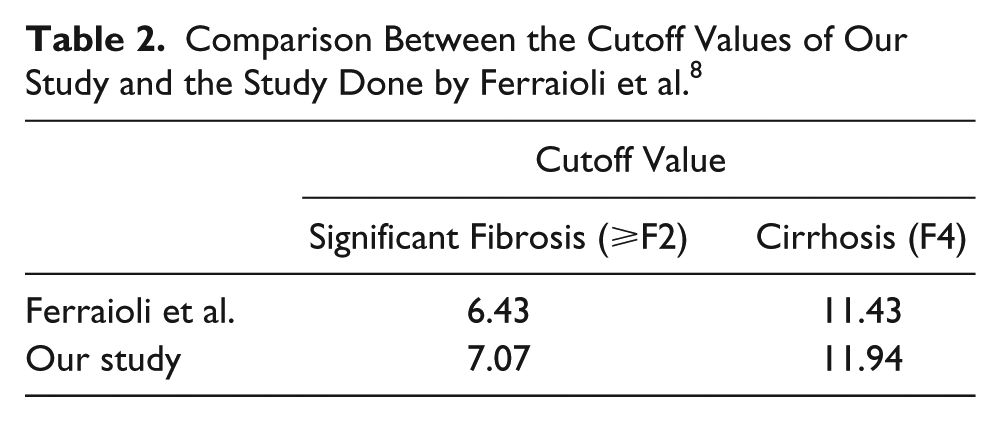
Ferraioli et al. 8 used the FibroScan (TE) as the reference standard for evaluation of the diagnostic performance of ElastPQ using the AUROC curve analysis. The cutoff values derived from the present study (e.g., 7.07 and 11.94, respectively, for significant fibrosis [⩾F2] and cirrhosis [F4]) were comparable to those derived by Ferraioli et al. 8 (e.g., 6.43 and 11.43; see Table 2).
Comparison Between the Cutoff Values of Our Study and the Study Done by Ferraioli et al. 8
Comparison of Shear Wave Elastography Measurements Based on Ultrasonography Findings.
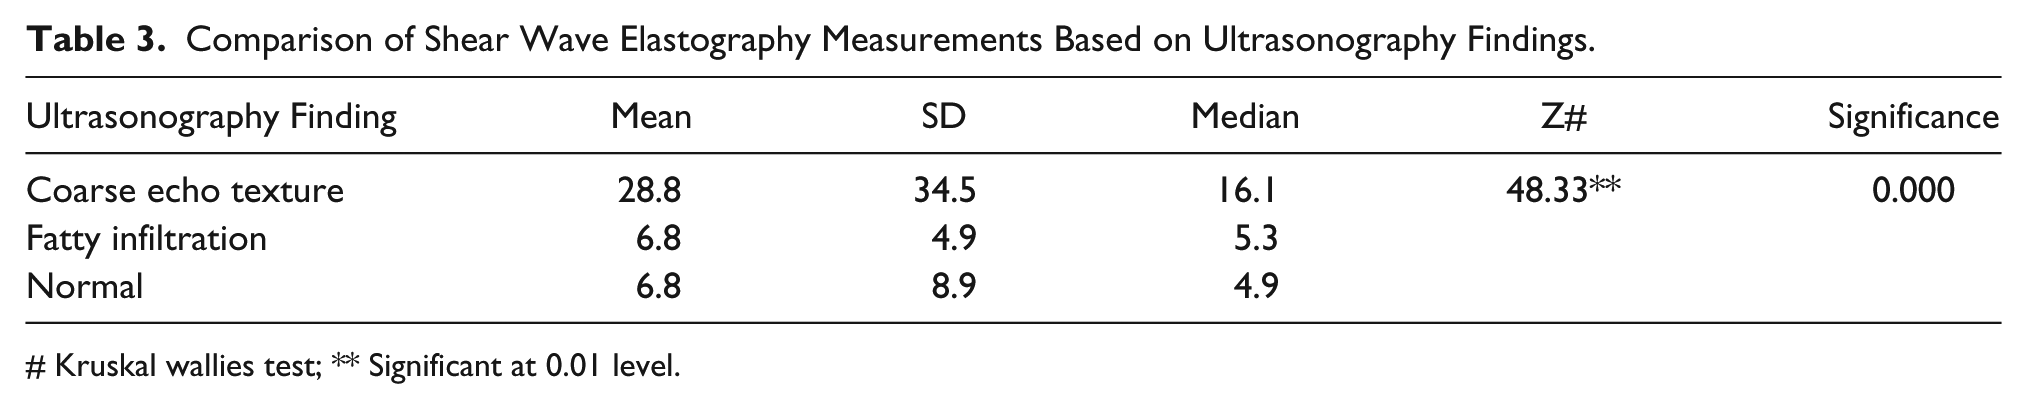
Kruskal wallies test; ** Significant at 0.01 level.
Ma et al. 10 evaluated the reproducibility of ElastPQ technology in the determination of liver stiffness and also investigated the value of ElastPQ in liver fibrosis staging among chronic hepatitis B patients. The cutoff value in the present study for the differentiation of cirrhosis (F4) and significant-advanced fibrosis (F2–F3) compared with APRI, as the reference standard, was 11.94. This was slightly higher than that obtained by Ma et al. (e.g., 9.0). However, the sensitivity and specificity was less in the present study compared with that of Ma et al. The lower sensitivity and specificity of the present study compared with Ma et al. 10 could be attributed to the use of APRI as a reference standard. Ma et al. used the HPE findings as their reference standard.
The results of the present study demonstrated that the mean value of SWE measurements (28.8 kPa) was higher in the study patients who had coarse echotexture compared with patients with fatty infiltration and normal echotexture.
Of the seven patients with values for SWE and HPE, the same stage of fibrosis indicated by both SWE and HPE was noted in only one patient. This may be due to the small number of patients who had an HPE examination.
The limitations of our study were the convenient sample of patients who were available and the use of APRI as a reference standard.
Conclusion
The diagnostic performance of SWE was comparable in this study with that of serum fibrosis indices, APRI, and FIB-4. However, the accuracy of SWE needs to be substantiated by further studies with the HPE examination as a reference standard and larger sample size.
Footnotes
Declaration of Conflicting Interests
The authors declared no potential conflicts of interest with respect to the research, authorship, and/or publication of this article.
Funding
The authors received no financial support for the research, authorship, and/or publication of this article.