
Abstract
Objective:
To determine the diagnostic ability of the spleen and liver stiffness in predicting the presence of esophageal varices (EVs).
Methods:
A sample of cirrhotic patients, diagnosed with sonography, was recruited. The cohorts’ liver stiffness (LS) and spleen stiffness (SS) were measured with the Philips’ Elast PQ technique. Platelet count and spleen size were also documented. The endoscopic report was used as the diagnostic gold standard. Singular and combined parameters were assessed to determine the presence of EV using an independent variable t test, area under the receiver operating characteristic curve, and multilogistic regression analysis statistical tests.
Results:
In predicting the presence of EV, there was a statistically significant difference in means of SS (2.13 ± 0.69 m/s vs. 3.23 ± 1.32 m/s) and LS (2.33 ± 1.20 m/s vs. 3.05 ± 1.4 m/s), as well as discriminating between groups of patients, with and without EV. The ability to diagnostically classify EV with SS and LS was fair while the remaining parameters were deemed poor, using a SS cutoff value of 1.99 m/s.
Conclusion:
Despite the difference in means, none of the assessed parameters demonstrated a better classification ability than endoscopy. LS and SS were equal in the prediction of EV in these patients. The LS estimate of fibrosis would have grossly predicted the presence of varices. However, the addition of SS, for the estimation of varices, provided no significant benefit.
One of the significant complications of portal hypertension is esophageal varices (prevalence 50%), 1 with an increase in rates of morbidity and mortality due to variceal hemorrhage (20%–35%).2,3 Hence, newer guidelines recommend diagnostic endoscopy for the periodic screening of varices in all cirrhotic patients so that primary prophylaxis and treatment, depending on severity, may be planned. 4 Portal hypertension is measured by the hepatic venous pressure gradient (HVPG). Both endoscopy and measurement of HVPG are invasive and require expertise. Therefore, what is needed is a noninvasive, objective method to predict esophageal varices in cirrhosis patients. Furthermore, this method should be reproducible and accurate. According to the American College of Radiology (ACR) Appropriateness Criteria, magnetic resonance (MR) elastography, acoustic radiation force impulse (ARFI) elastography, and transient elastography are appropriate for the diagnosis of fibrosis. Point shear wave elastography is a more advanced technology that has the advantage of repeatability over ARFI elastography, but there are few studies to date. Hence, it was important to assess the role of liver stiffness (LS) and spleen stiffness (SS), measured by point shear wave elastography and other noninvasive parameters, to predict esophageal varices.
Noninvasive transabdominal sonographic parameters like collaterals, portal vein diameter, and spleen size, in the prediction of esophageal varices (EVs), have been studied; however, there are no imaging protocols and a lack of consistency. 5 Collaterals can be present in patients with and without varices. According to a 2008 study by Berzigotti et al., 6 a model that includes spider angiomas, alanine transaminase, and albumin predicted varices with good sensitivity. Unfortunately, in that study, sonography did not have statistical power. 6 The ACR criteria indicate that color Doppler signals in the main portal vein, including slow velocity or hepatofugal (reversed) direction of flow, may indicate portal hypertension. However, these findings will be seen only in advanced cirrhosis and not in the early stages of fibrosis. Hence, there is a need for a noninvasive diagnostic parameter that can predict portal hypertension in its early stages.
Initially, measurement of liver stiffness by transient elastography (TE) was studied for prediction of EVs and demonstrated that the accuracy of LS was good for predicting clinically significant portal hypertension but inadequate for predicting EVs. 7 Later, spleen stiffness of ARFI was tried and found useful for predicting the presence of varices.8–10
Point shear wave elastography is a new technique that has the additional advantage of reproducibility over ARFI. 11 Previous studies have shown that a combination of noninvasive parameters has better diagnostic performance than individual parameters. 12 Hence, in this study, the role of noninvasive parameters SS and LS using point shear wave elastography, spleen size, and platelet count individually and in combination was studied as a way of predicting the presence of varices. This study has the potential to reduce the number of diagnostic endoscopies, as well as the associated medical costs, and decrease variceal hemorrhage-related mortality.
Materials and Methods
This prospective study was conducted collaboratively in the Departments of Radiology Gastroenterology, and Hepatology of a medical college in Manipal, from November 2016 to September 2018.
The study was initiated after obtaining institutional ethical committee approval (IEC approval #781/2016), as well as an Indian clinical trial registry (CTRI/2018/04/012933). Informed consent was taken from the patients prior to their participation.
Patients with cirrhosis of the liver, ages 18 to 80 years, regardless of sex were included. Those who had undergone point shear wave elastography for measurement of LS and SS, as well those who had undergone upper gastrointestinal (GI) endoscopy and platelet count measurement as a standard of care in evaluation of cirrhosis, were recruited. However, patients with ongoing GI hemorrhage or intrahepatic malignancy portal vein thrombosis, those undergoing treatment for portal hypertension (beta-blocker, transjugular intrahepatic portosystemic shunt/balloon-occluded retrograde transvenous obliteration), pregnant women, and those who did not give consent were excluded. Patients who were unable to hold their breath, sick patients, and patients with gross ascites were also excluded since shear wave elastography could not be performed.
Data Collection
The diagnosis of liver cirrhosis was based on the sonographic findings of coarse echotexture and surface nodularity/irregularity. Shear wave elastography was measured using both a Philips (Philips India Limited) EPIQ 5G and an IU22 machine. Philips Healthcare’s point shear elastography is referred to as “Elast PQ” and is their trade name. The C5-1 transducer was used for gray-scale and shear wave elastographic imaging.
After confirming the diagnosis of cirrhosis with gray-scale sonography and excluding focal lesions and portal vein thrombosis, shear wave elastography was performed.
The patient was placed in the supine left lateral position for LS measurement and right lateral decubitus position for SS measurement, and a maximum window for liver and spleen free from rib shadow was obtained.
A region-of-interest (ROI) box measuring 1.5 × 0.5 cm was placed in this region (Figures 1 and 2). The size of the ROI box was predetermined specifically for the type of elastography and was not altered. ROI was placed 1.0 cm below capsule to 8.0 cm from the capsule of the liver and spleen. After placing the ROI, the patient was asked to hold his or her breath. The ROI was again adjusted using the trackball on the ultrasound machine and placed in a region, free of the blood vessels and rib shadowing. 13 Then the stiffness value was obtained and measured in kilopascals (KPa) using the update button. Stiffness values measured in KPa were converted to meters/second (m/s) using the equipment’s conversion feature. It was in this manner that the measurements, in m/s, were acquired. Invalid measurements, such as 0.00, and extreme measurements were excluded. A total of six valid consecutive measurements were taken for both the liver and the spleen. 14 The equipment displayed the average liver stiffness, and that was considered the patient’s liver and spleen stiffness, respectively. Images of the measurements acquired and also the final report generated on the equipment were selected and sent to the picture archiving and communication system (PACS). These data were also manually entered in the proforma for each patient.
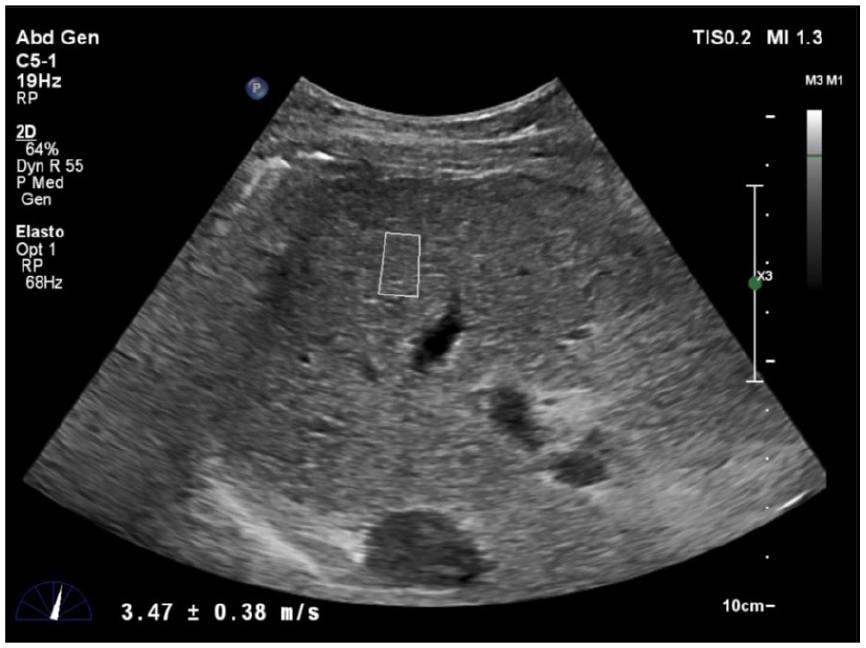
Image showing region-of-interest placement in liver in an area free of major vessels and rib shadows.
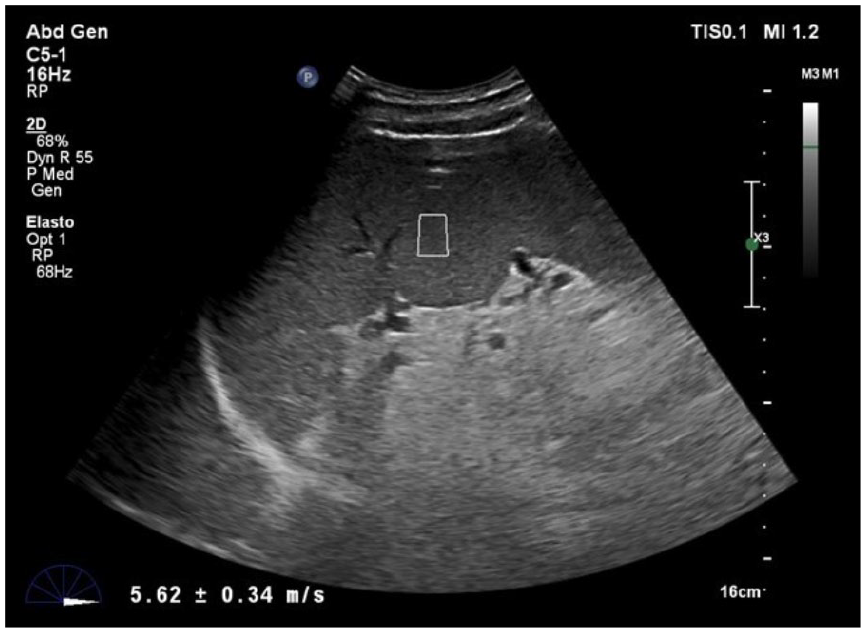
Image showing region-of-interest placement in spleen in an area free of major vessels and rib shadows.
The maximum length of spleen was measured using the C5-1 transducer, during gray-scale sonography, and expressed in centimeters. The presence or absence of ascites was also documented. The records of all patients were followed up for six months, and endoscopic findings and platelet counts were documented.
Data Analysis
Patients were divided into two groups based on endoscopy findings: patients with the presence of varices (EVs) and patients without varices.
Statistical analysis was done by an independent variable t test for comparison of means. Receiver operating characteristic (ROC) curves were generated to assess diagnostic accuracy. The best possible cutoff was taken such that the sum of sensitivity and specificity was maximized. Multilogistic regression analysis was done to assess the individual contribution of parameters. Given that there was a lack of comparison data to assess the validity of combined spleen stiffness and spleen size, one had to be generated. A validation set is based on a population for which a derived formula can be applied and accuracy of the formula can be verified. A varices risk score was calculated as follows:
−4.364 + 0.538 × spleen diameter −0.049 × platelet count −0.044 × LS + 0.001 × (LS × platelet count). 12
The risk score was calculated for each patient, and the diagnostic performance of score was calculated and compared to each individual parameter. A P value of .05 was set a priori for statistical significance.
Results
Out of total of 117 cirrhotic patients selected, LS and SS were obtained in 116 patients. A ROI could not be placed in one patient because of the amount of gross ascites. With the cohort of 116 patients, a follow-up endoscopy was not completed on 10, and therefore they were excluded from the analysis. This left 106 study patients to complete the data analysis. Most of the study patients (58%) were middle-aged, 40 to 60 years, and a majority were male (89%). The major cause of cirrhosis (64%) in these study patients was alcohol induced. Other causes of cirrhosis in this study group were viral etiology, cryptogenic causes, and autoimmune causes.
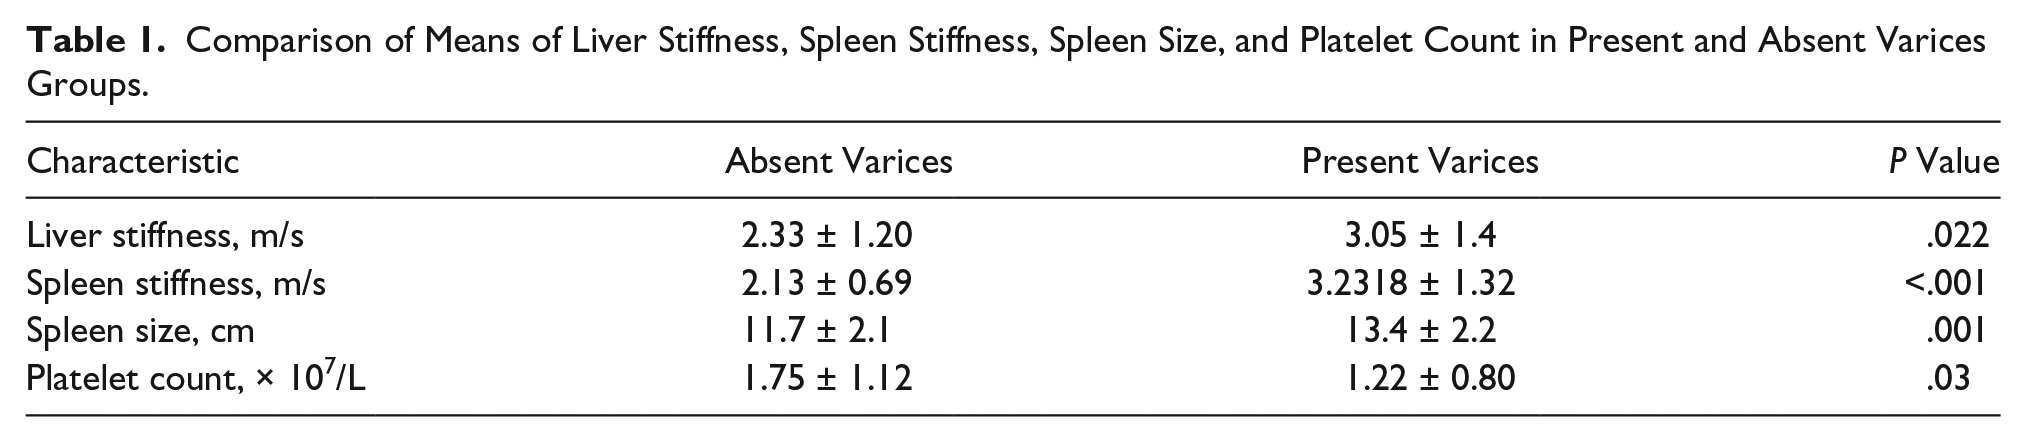
Of the 106 cirrhosis patients assessed, 79 had varices and 27 did not, as demonstrated on endoscopy. Comparison of the parameters between the two groups showed that mean liver stiffness, spleen stiffness, and spleen size were higher in the varices group and statistically significant (P < .05) (see Table 1). The platelet count was lower in the varices group and was statistically significant (P < .05) (see Table 1).
Comparison of Means of Liver Stiffness, Spleen Stiffness, Spleen Size, and Platelet Count in Present and Absent Varices Groups.
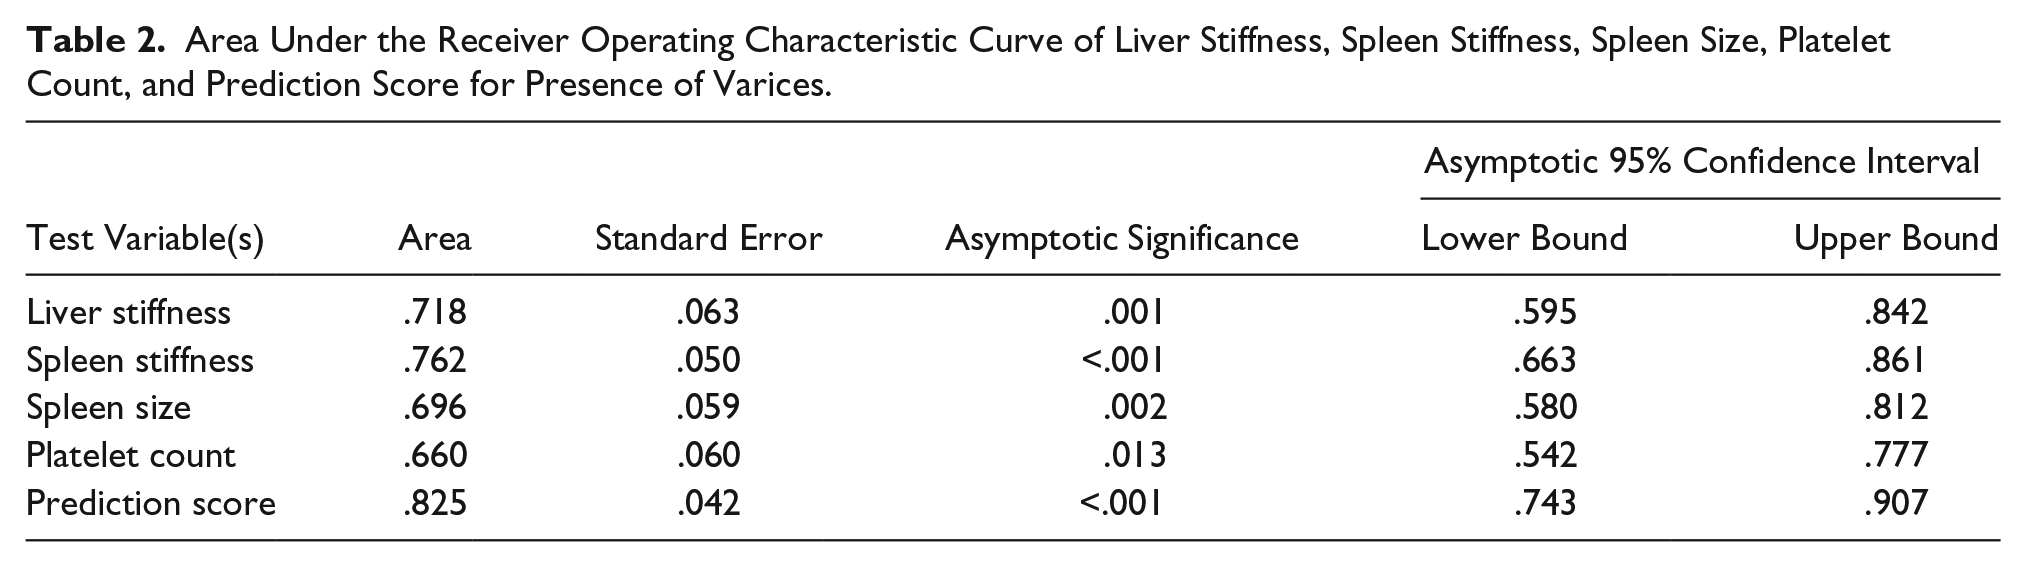
Classification ability of the test was represented by the area under the ROC (AUROC) curve (see Figure 3). The AUROC for spleen stiffness and liver stiffness was considered fair (see Table 2); however, there was no significant difference in comparison. The AUROC for spleen size and platelet count was considered poor (see Table 2). The platelet count was inversely related to the presence of varices for these study patients.
Area Under the Receiver Operating Characteristic Curve of Liver Stiffness, Spleen Stiffness, Spleen Size, Platelet Count, and Prediction Score for Presence of Varices.
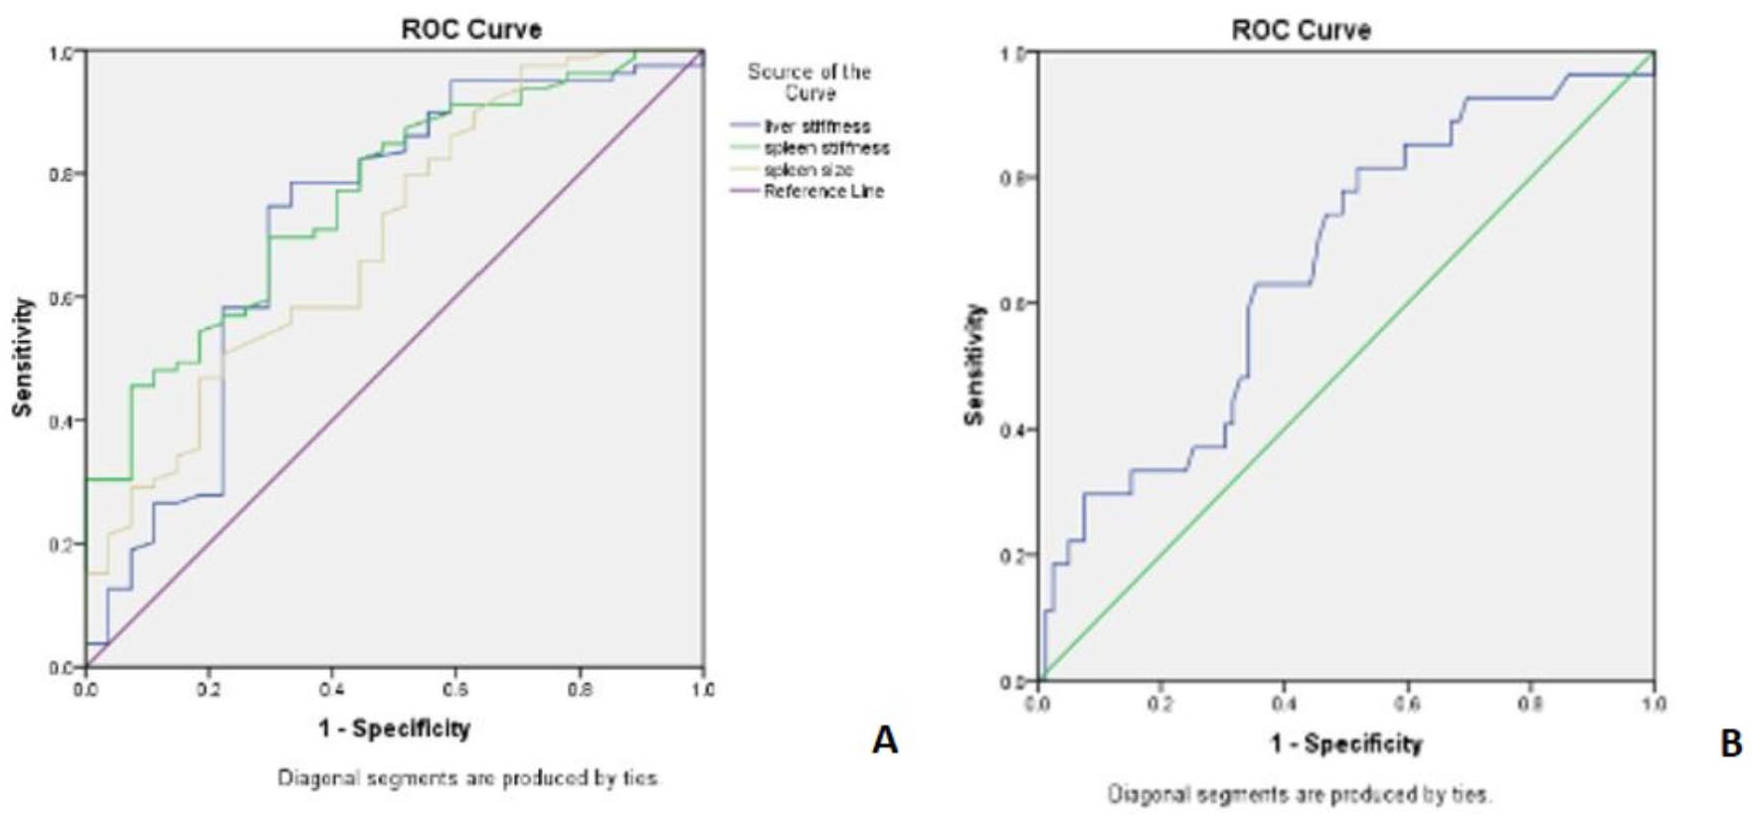
Receiver operating characteristic curves of liver stiffness, spleen stiffness, and spleen size (A) and platelet count (B) for presence of varices.
Based on the results from these study patients, the cutoff value for SS was 1.99 m/s with a sensitivity of 84.8% and a specificity of 51.9%. A subset of 80 patients with SS >1.99 m/s indicated that 67 had varices but 13 did not, which had a positive predictive value (PPV) of 83.7%. A subset of 26 patients with SS <1.99 m/s indicated that 14 patients did not have varices on endoscopy, which had a negative predictive value (NPV) of 53.6%. A cutoff value for LS was 2.13 m/s and had a sensitivity of 74.7%, specificity of 70.4%, PPV of 86.2%, NPV of 48%, and accuracy of 73.5%. A subset of 58 patients with LS >2.13 m/s indicated that 50 had varices but 8 did not, which had a PPV of 86.2%. A subset of 39 patients with LS <2.13 m/s demonstrated that 19 did not have varices on endoscopy, yielding an NPV of 48%.
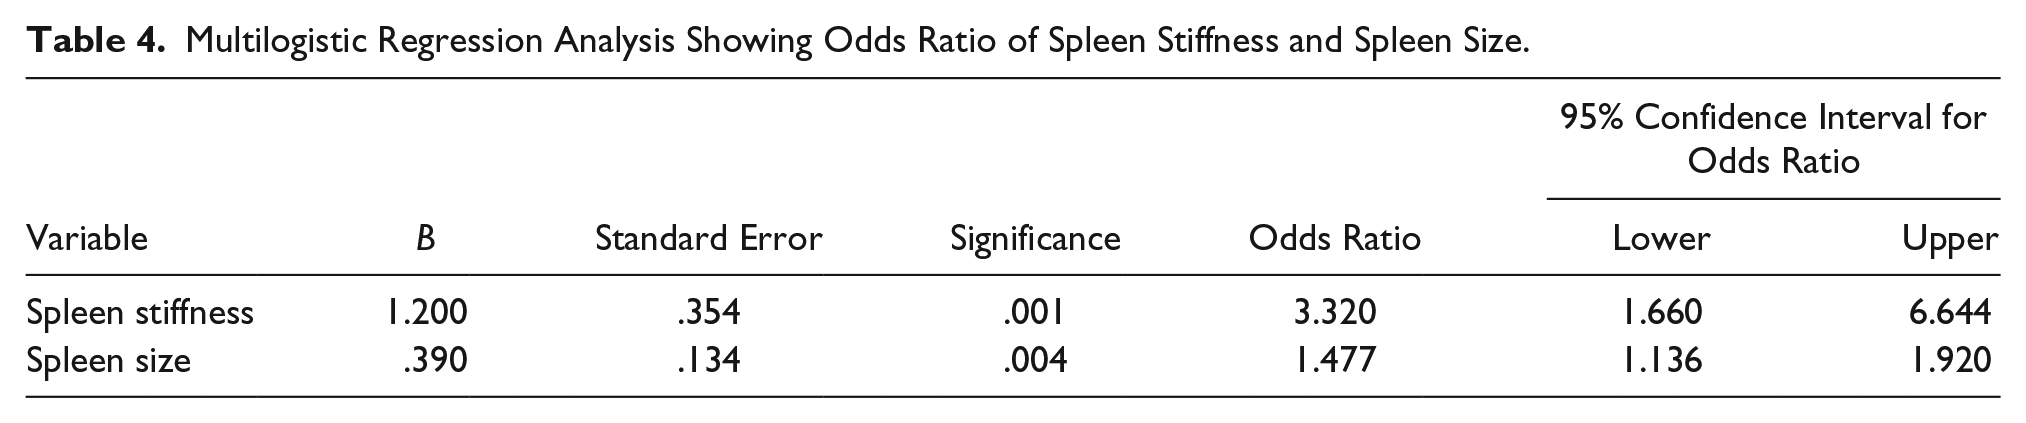
As outlined, an analysis was conducted to determine whether a combination of parameters could better predict the presence of varices. On multilogistic regression analyses, only spleen stiffness and size were statistically significant, as shown in Tables 3 and 4. Hence, these two parameters were taken and a prediction equation was derived. The prediction equation for presence of varices was −6.9 + (1.2 × spleen stiffness) + (0.39 × spleen size). The score was calculated for each patient, and the ROC curve was derived for that score (see Figure 4). The AUROC for the score with spleen stiffness and spleen size was 0.825 (see Table 2), which was higher than spleen stiffness and spleen size alone. A risk score was calculated based on the Berzigotti et al. 12 formula for each patient. This allowed for an assessment of diagnostic performance, since the risk score was validated in a subset of 56 patients. In this study cohort, the results demonstrated that combined parameters yielded better accuracy than a single parameter.
Univariate Analysis for the Presence of Varices.
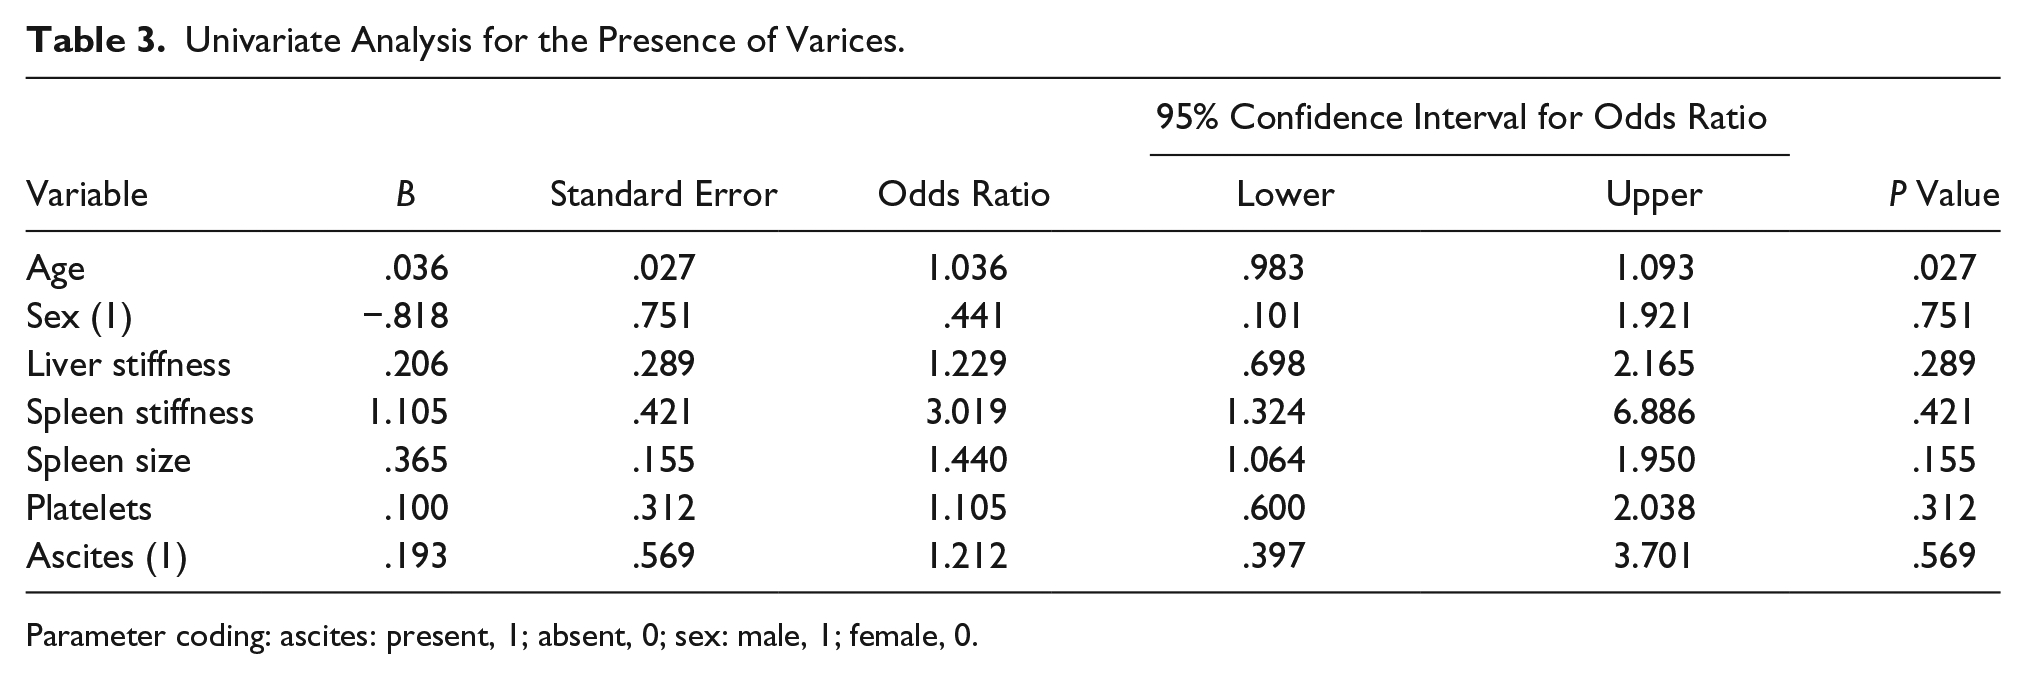
Parameter coding: ascites: present, 1; absent, 0; sex: male, 1; female, 0.
Multilogistic Regression Analysis Showing Odds Ratio of Spleen Stiffness and Spleen Size.
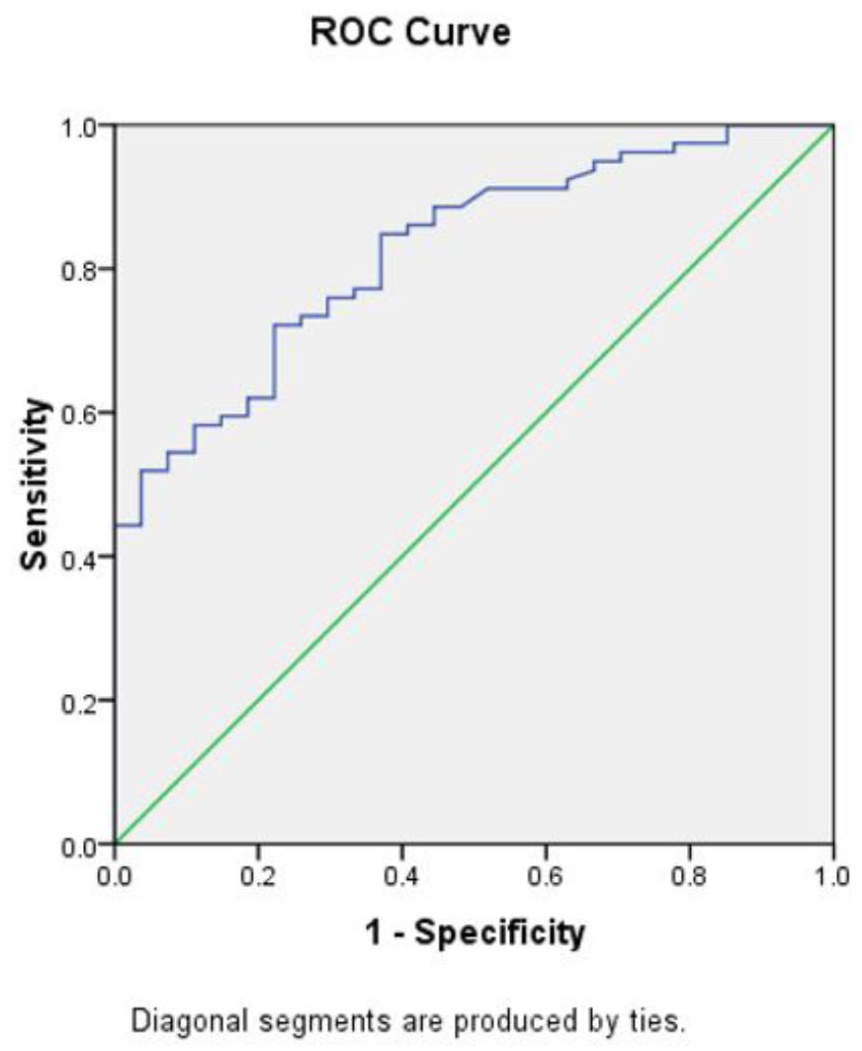
Receiver operating characteristic curve of prediction score for presence of varices, which includes spleen stiffness and spleen size.
A varices risk score was calculated as earlier indicated. This demonstrated that there was a statistically significant difference in means of the risk score between the group with varices compared to the group without (P = .001). The AUROC curve for the derived risk score (0.690) was less than that of spleen stiffness (0.762) and liver stiffness (0.718).
Discussion
Esophageal varices due to portal hypertension are a major cause of morbidity and mortality in cirrhosis patients. For the diagnosis of esophageal varices, noninvasive gray-scale sonographic parameters such as the presence of collaterals were studied. However, there was no set protocol for gray-scale sonographic diagnosis of varices. 5 However, elastography is a new sonographic technique that can be used to evaluate the degree of fibrosis of tissue.
The recently introduced point shear wave elastography technique has an additional Doppler function. 15 Because of this added function, the stiffness range may be different from any other ARFI technology 15 and has increased repeatability. There was varied opinion regarding the role of noninvasive parameters in the prediction of esophageal varices. Although elastography of liver is helpful in staging the liver for fibrosis and predicting portal hypertension, recent studies have indicated that elastography of liver is not reliable in predicting esophageal varices.
Berzigotti et al. 12 concluded that a combination of parameters may offer better diagnostic accuracy than LS, spleen size, and platelet count independently. Kim et al. 16 concluded that SS had better diagnostic accuracy than LS. The pathophysiology of early stage esophageal varices was dependent on intrahepatic changes, but later stages were dependent mainly on extrahepatic circulation changes. Portal hypertension can result in hyperplasia and splenic fibrosis due to changes in the extrahepatic circulation. Hence, spleen stiffness is pathophysiologically related to esophageal varices, although not a causative factor. In this study cohort, point shear wave elastography of liver and spleen was assessed to determine whether SS/LS as a single parameter would suffice or if a combination of parameters would offer any further advantage in the prediction of the presence of varices.
Lucchina et al. 17 studied the role of point shear wave elastography of spleen, and it appeared to be the only study done with Elast PQ. In that cohort, there was a statistically significant difference (P < .05) in the means of liver stiffness, spleen stiffness, spleen diameter, and platelet count between those with varices and those without, which has been previously well documented.16,17 For further evaluation, the ability to classify parameters was determined by the AUROC curve. The SS had the highest classification ability (AUROC = 0.768) and the best possible diagnostic cutoff value of 1.9 m/s = 13.23 KPa, which was comparable to work by Kim et al. 16 (AUROC = 0.785 with higher cutoff of 3.16 m/s). However, Lucchina et al. 17 reported that LS had the highest AUROC curve (0.913 with similar cutoff of 12.27 KPa) and higher sensitivity (100%) compared to the current study, with similar specificity. The reason for their reported results may be due to a difference in inclusion criteria. Lucchina et al. 17 excluded patients with large varices, while the present study included both small and large varices patients. Structural changes in the liver can influence the formation of varices in early stages, whereas extrahepatic factors can affect them in later stages. 18 However, extrahepatic factors do not influence LS. Since the current cohort study included both small and large varices, indicating early and late stages of portal hypertension, spleen stiffness had a better diagnostic performance.
The difference in cutoff values between this cohort study and Kim et al. 16 could also be due to a difference in the elastography technique, as has been reported by Sporea et al. 15 According to that study, stiffness values of point shear wave elastography are usually less than those of ARFI elastography.
Statistical analysis demonstrated a higher diagnostic accuracy for a combination of spleen stiffness and spleen size, compared with individual parameters, which concurs with Berzigotti et al. 12 However, in the present study, a validation set was not available to prove the accuracy of their scores. Additionally, this study cohort was heavily skewed toward the presence of varices, which might have significantly affected the outcome of regression analysis.
Further studies in this aspect, including patient populations with nonskewed data and diverse populations, would be recommended. The classification ability of varices risk scores by Berzigotti et al., 12 when applied to this study cohort, was poor. This again could be explained by the differences in population, elastography technique, and prevalence rate in the samples. Another difference was that Berzigotti et al. 12 used transient elastography, and this study used point shear wave elastography.
A limitation of this cohort study included the threats to internal and external validity based on research design. Another limitation was that endoscopy was not performed by a single investigator, so there may have been variation in the interpretation of varices. An added limitation was that the study patients were heavily skewed toward varices and were not classified according to etiology of varices. This patient cohort had a significantly greater number of patients with varices than without varices, leading to a skewed distribution of study parameters. This might significantly affect the diagnostic accuracy of the study parameters. Recent studies have shown that the etiology of cirrhosis affects stiffness; however, in this study, the patients were not assessed according to an etiology of cirrhosis. Further studies with a large sample size and selected from a more diverse population are recommended.
Conclusion
Unfortunately, there was a poor estimation of the presence of varices, although a statistically significant difference existed between means of multiple noninvasive classification parameters. In addition, none of the individually assessed parameters were accurate enough to be used in clinical practice and therefore could not be substituted for endoscopy. From this cohort study, the classification ability of both LS and SS falls in the same category, but clinically, liver stiffness measured for estimation of fibrosis is a gross predictor of varices. It is noted that in this cohort of patients, the addition of spleen stiffness, for the estimation of varices, gives no significant additional benefit. However, in a setup where equipment and expert personnel for endoscopy are not available, elastography may offer an estimation as to the presence of varices. According to this study, a combination of spleen stiffness and spleen size might improve diagnostic accuracy. However, lack of a validation set and a significant number of cases without varices were the major pitfalls and may have affected the results. Further studies in this aspect with a larger and diverse population of patients would offer an additional benefit.
Footnotes
Declaration of Conflicting Interests
The authors declared no potential conflicts of interest with respect to the research, authorship, and/or publication of this article.
Funding
The authors received no financial support for the research, authorship, and/or publication of this article.