
Abstract
Although ultrasound elastography is established as a reliable and valid tool for assessment of skeletal muscles, guidelines around the technical specifications, data selection, and acquisition parameters still lack consensus. One such parameter is the use of the quantification box (Q-box) that calculates the shear wave velocity/modulus, within a selected region of interest (ROI). Currently, no data compare the effect of the elastographic area within the ROI to the mean shear wave velocity calculations, using a Q-box. In this study, the mean shear wave velocity calculated over a smaller (single Q-box) ROI is compared to the mean shear wave velocity calculated over maximum area of elastogram, within a ROI. Comparison of mean shear wave velocity revealed a significant difference (t = 2.79, P = .007) between the means calculated over maximum area of elastogram for only nonuniform elastograms. The rater agreement for the classification scheme was assessed (κ = 0.85). To prevent possible overestimation of shear wave velocities, it may be necessary to place the Q-box over the maximum elastographic area.
Assessment of the biomechanical properties of skeletal muscles is of interest to biomechanists but also clinicians. Several chronic pathologic musculoskeletal conditions result in changes to the properties of the muscle tendon unit.1,2 For example, prolonged overuse of the glenohumeral joint (GHJ) in overhead athletes leads to both acute and chronic changes in muscle stiffness. 1 Muscle stiffness is usually assessed using a variety of clinical skills such as palpation, a handheld dynamometer, and/or with electromyography. Ultrasonographic (US) elastography is a relatively new tool that assesses shear wave propagation velocity to assess the muscle stiffness objectively. 3 The advantages of using US elastography include its portability, short data acquisition, and expedited processing times. In addition, US elastography may also provide an objective outcome measure of change in the biomechanical properties of muscles for providers in physical therapy and rehabilitation. For example, the rehabilitation of a joint’s range of motion (ROM) is used as a surrogate measure of muscle flexibility. 1 However, in addition to muscle, joint ROM is also influenced by noncontractile elements around the joint, limiting the use of joint ROM as a measure of stiffness.2,4
Skeletal muscles are anisotropic, meaning that the biomechanical properties of skeletal muscles differ when measured along different axes. 5 For example, the shear modulus of a muscle represents its stiffness in a cross-sectional plane, while Young’s modulus is the measure of stiffness along the long axis of a muscle. Despite this anisotropic behavior, a strong linear correlation exists between the shear and Young’s modulus of skeletal muscles. 6 This would indicate that the shear modulus of a muscle can provide an accurate estimate of a skeletal muscle’s elasticity along its long axis. 7 US elastography represents a potentially reliable and valid tool for assessing skeletal muscles, but guidelines around the technical specifications, data selection, and acquisition parameters still lack consensus.
One critical issue with US elastographic data is quantitatively assessing muscle stiffness using the quantification (Q)–box function, which is designed to provide a calculated shear wave velocity/modulus within a selected region of interest (ROI). Many published studies do not report the Q-box size, the ROI, or the criteria for Q-box placement. 8 It is conventionally assumed that the shear wave velocity calculated from this small region is representative of the whole muscle. 9 However, in a recent study, researchers reported a significantly increased error when the shear elastic modulus was averaged over a smaller ROI compared to data averaged over a larger ROI. 7 This study suggested that the dimensions of the ROI should be as large as possible to obtain an accurate measurement of muscle shear modulus.
Sonography is an operator-dependent imaging modality, especially during acquisition and image analysis. Since an image’s visual appearance can be influential in determining the stiffness of a skeletal muscle, it seemed important to test an operator’s ability to identify an elastogram as either uniform (single-color map) or nonuniform (multicolor map). Therefore, the purpose of this study was to compare the shear wave velocities calculated with a traditional approach of using a single Q-box to shear wave velocities calculated using multiple Q-boxes. The first hypothesis was that the shear wave velocity will be different when calculated over a small US elastographic area compared to a larger elastographic area. The second hypothesis was that two operators will have a substantial rating agreement in classifying selective US elastograms.
Materials and Methods
Thirty-one US elastograms were captured in a convenience sample of 16 college-aged adult volunteers. The muscles imaged were rotator cuff muscles (infraspinatus and supraspinatus) and the deltoid muscle. All participants were informed about the procedures of the study prior to obtaining written informed consent. The study was approved by the sponsoring institution’s internal review board.
Gray-Scale Sonography and Elastography Protocol
To build on the evidence provided by Lima et al., 10 all measurements were completed by the same sonographer with postdoctoral training in US elastography and expert oversight. An Aixplorer (SuperSonic Imagine, Aix-en-Provence, France) ultrasound machine equipped with a linear transducer (4–15 Hz) was used for gray-scale and US elastographic imaging. In this cohort, three specific shoulder muscles were imaged. These muscles were the posterior deltoid, supraspinatus, and infraspinatus, respectively. Participants were instructed to sit with their back supported and arms by their side, elbow flexed, and forearm resting on the thigh. The participants were further instructed to relax their shoulder and not to contract their arm muscles during imaging. Following this, a conventional sonographic gray-scale set of images was used to identify the individual muscles. The following landmarks were used for transducer positioning.
Deltoid: 2.5 cm below the posterior lateral angle of the acromion
Supraspinatus: over the supraspinatus fossa
Infraspinatus: 2.5 cm inferior to the midpoint of the spine of scapula
Data Acquisition/Data Analytics
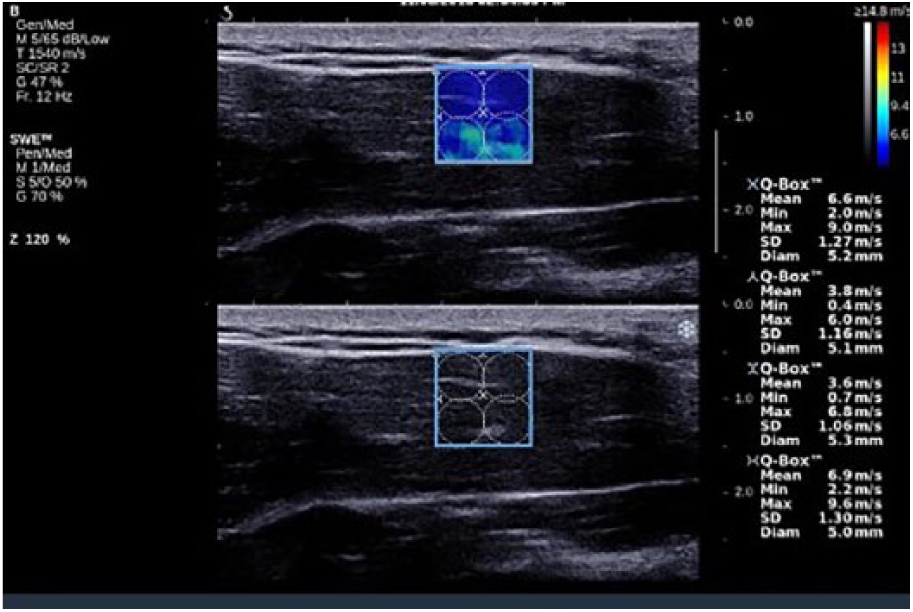
All the measurements were completed using the SSI mode-musculoskeletal preset. The transducer (5–14 MHz) was aligned parallel to the muscle fibers. A 1-by-2 cm rectangular ROI was placed on the image of the muscle belly, at a depth of 1 to 2 cm. The center of the ROI was approximately 1.5 cm from the skin surface. Care was taken to avoid dense connective tissue that could affect the shear wave velocity map. The shear wave elastography (SWE) function was initiated and shear wave maps were recorded. During the SWE mapping, the researcher made sure that there was minimal to no compression of the muscle during the B-mode acquisition. Each muscle that was listed was imaged once with the following parameters: mode, Pen/Med; transmit speed, 1540 m/s; frequency, 12 Hz; and Q-box parameters, 1 cm in diameter. Briefly, two methods were used to assess the SWE propagation velocity. This was predicated on the concern for deeper muscles and tendons to be affected by loss of SWE amplitude and the reception of possible guided waves. A Q-box was placed within the image based on the quality indicator during SSI. A more detailed discussion on the use of Q-boxes is provided by Barr. 3 The experimental methods used in this study were as follows:
Method 1: A single Q-box was placed in the center of the ROI (Q-box size: 1 cm in diameter) and the equipment’s software displayed values (see Figures 1 and 2).
Method 2: Multiple Q-boxes were placed within the ROI to cover the maximum area of the elastogram, and the values were averaged over the sum of the Q-boxes (see Figures 3–5). The mean values were used for comparison of shear wave propagation velocity for uniform and nonuniform images.
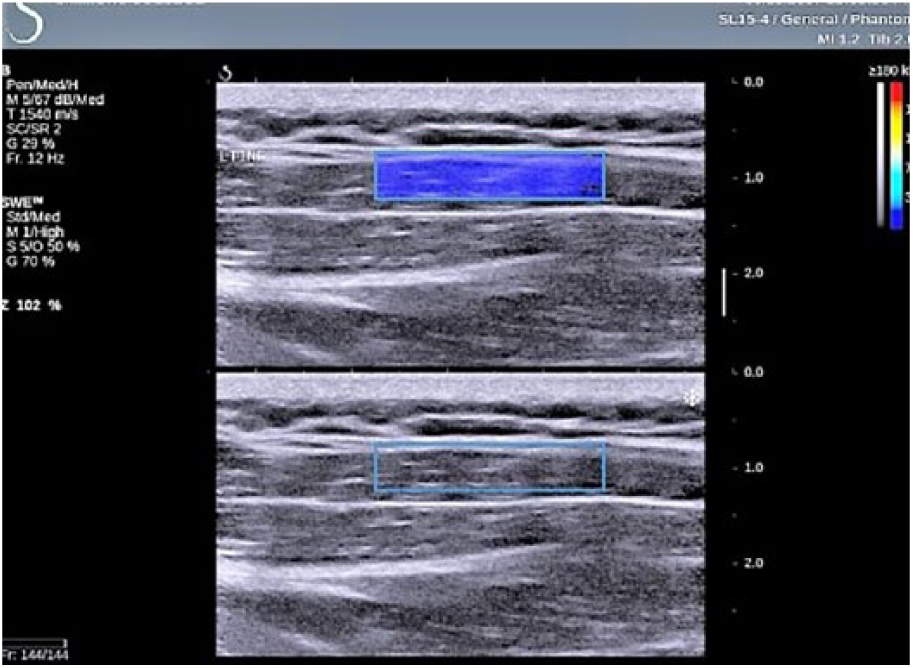
Elastographic assessment of the infraspinatus muscle using a region of interest (ROI) box that attempts to cover a large portion of the muscle interrogated.
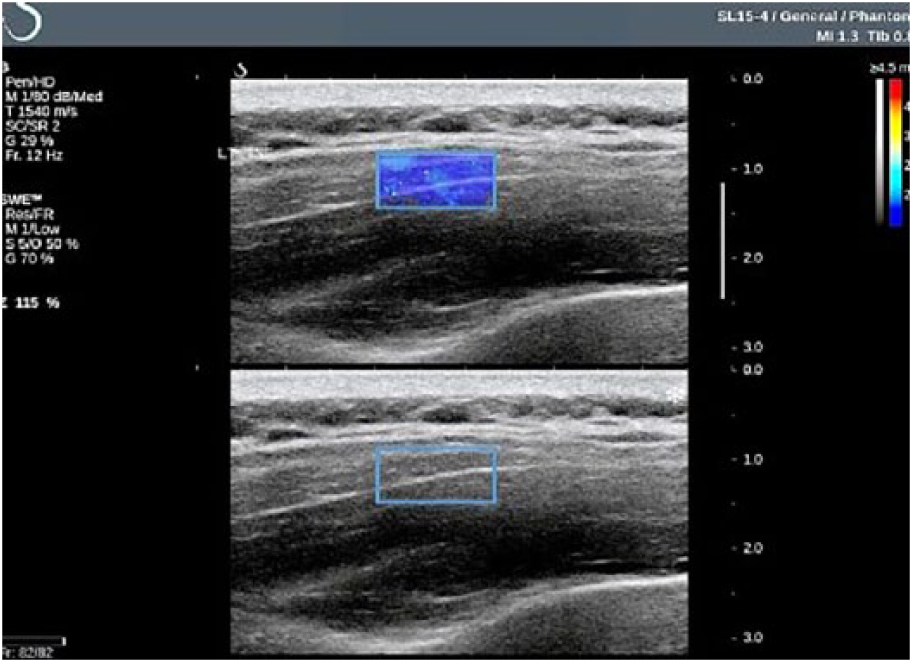
Elastographic assessment of the infraspinatus muscle using a region of interest (ROI) box that attempts to cover a small portion of the muscle interrogated.
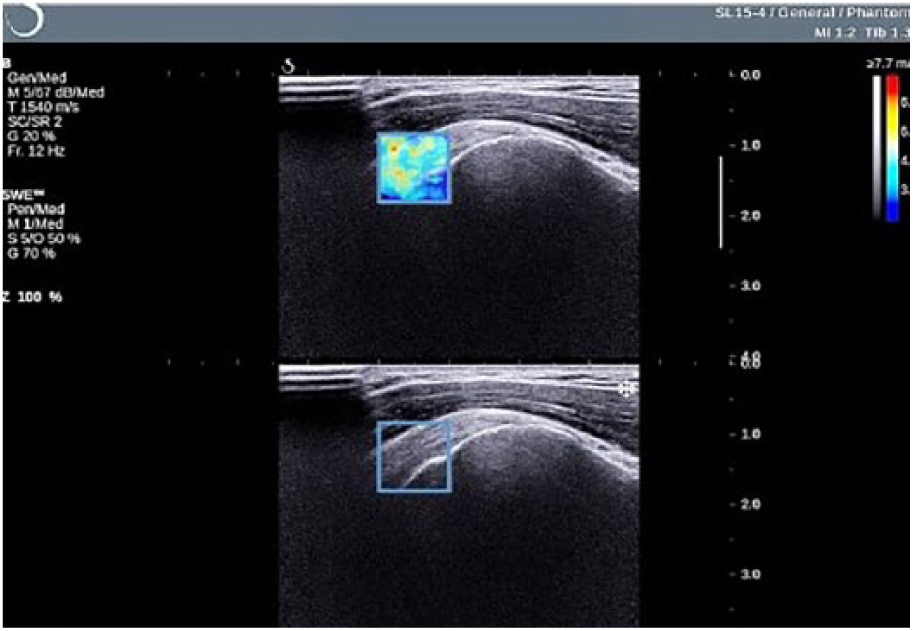
Elastographic assessment of the supraspinatus muscle using a region of interest (ROI) box that attempts to cover a small portion of the muscle interrogated.
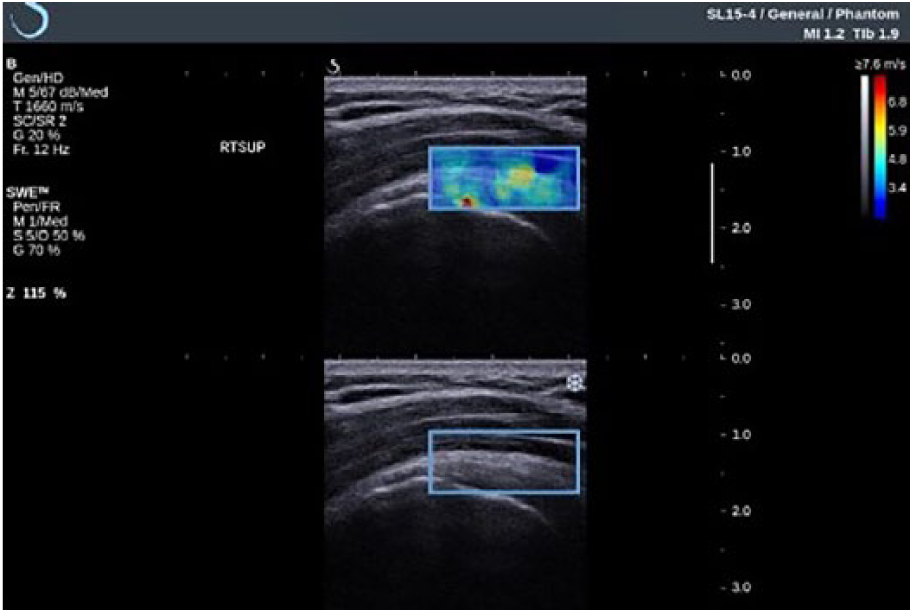
Elastographic assessment of the supraspinatus muscle using a region of interest (ROI) box that attempts to cover a large portion of the muscle interrogated.
Multiple Q-box placement within the infraspinatus muscle to assess quantitative elasticity.
Statistical Analysis
Statistical analysis was performed to determine operator agreement in classifying the US elastograms. The operator agreement in classifying the US elastograms was assessed using a κ statistic, which is a chance-corrected measure of agreement. 11 The interpretation of κ was based on the guidelines provided by Landis and Koch. 12 Briefly, κ values above 0.80 represent excellent agreement, above 0.60 represents substantial agreement, between 0.40 and 0.60 indicates moderate agreement, and values below 0.40 indicate poor agreement. 11 For the comparison of mean shear wave velocity, two separate t tests were planned one each for uniform and nonuniform images. The statistical significance was set at P = .05 a priori. All statistical analyses were performed using NCSS 8 (NCSS Statistical Software, Kaysville, UT).
Results
Rater Agreement
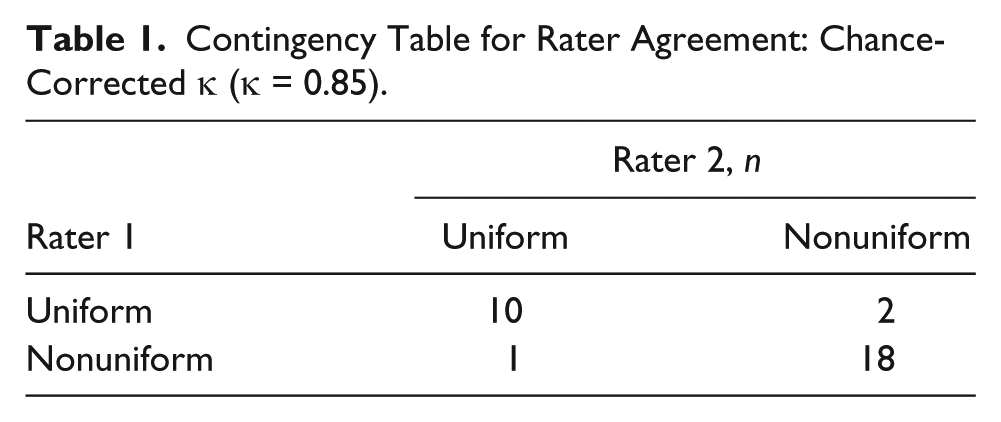
Descriptive statistics for the classification of the images by raters 1 and 2 are provided in Table 1. The chance-adjusted κ value of 0.85 was calculated to assess the level of agreement between the two operators who rated the images.
Contingency Table for Rater Agreement: Chance-Corrected κ (κ = 0.85).
Shear Wave Velocity
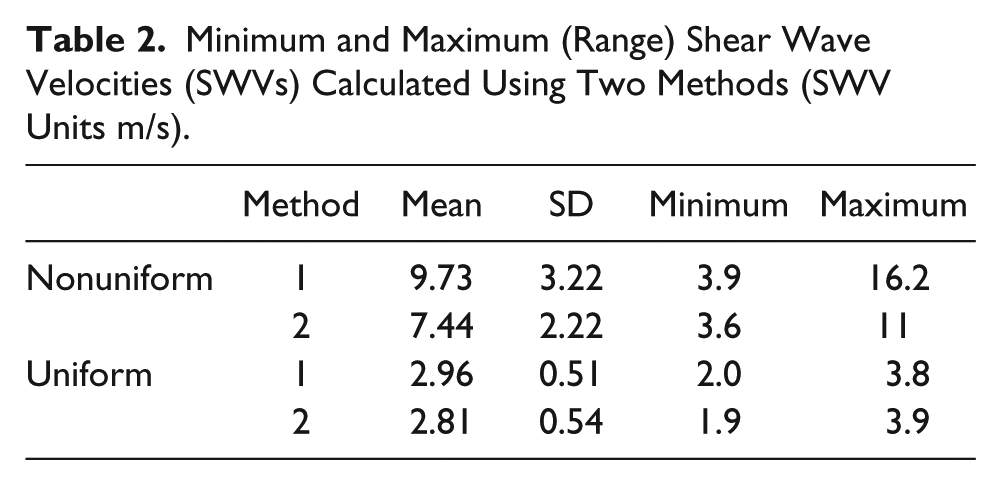
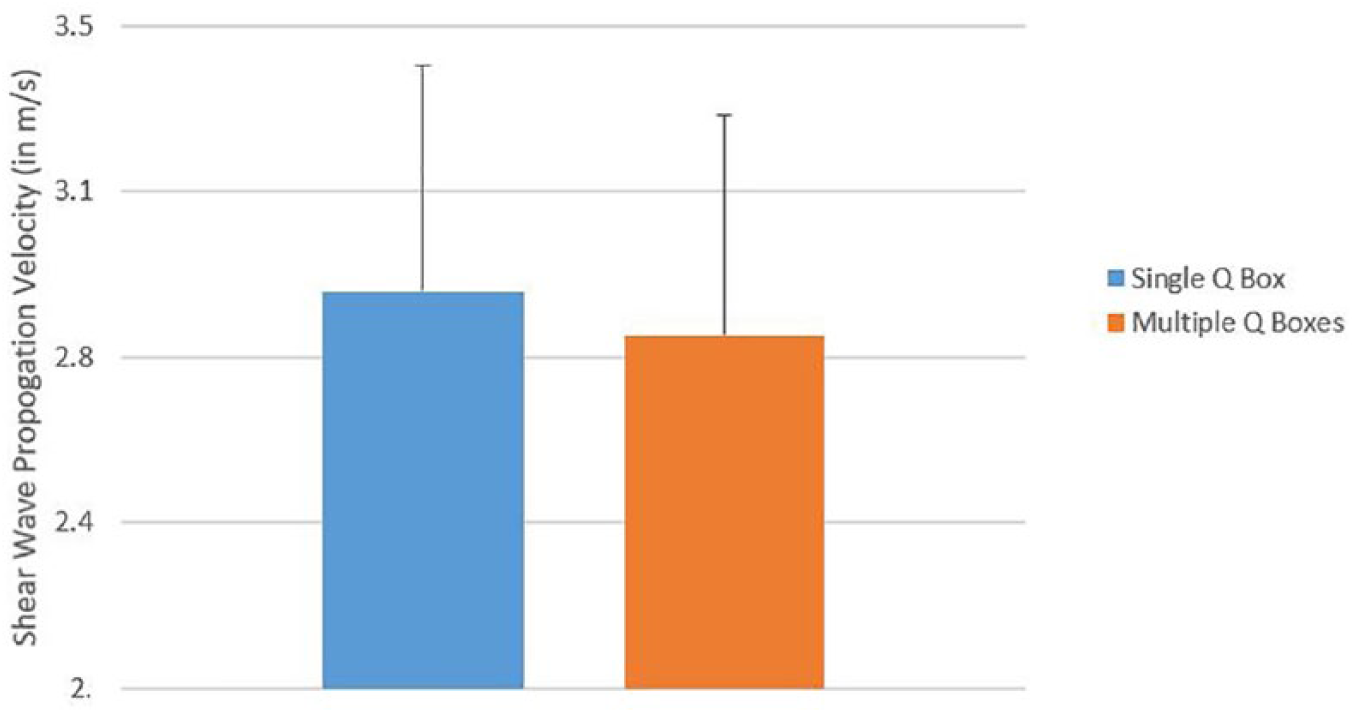
The shear wave velocities for both methods are provided in Table 2. For nonuniform images the mean shear wave velocity was significantly different (t = 2.79, P = .007) when compared using the two different methods (Figure 6). No significant difference was observed between the two methods for uniform images (t = 0.66, P = .51) (Figure 7).
Minimum and Maximum (Range) Shear Wave Velocities (SWVs) Calculated Using Two Methods (SWV Units m/s).
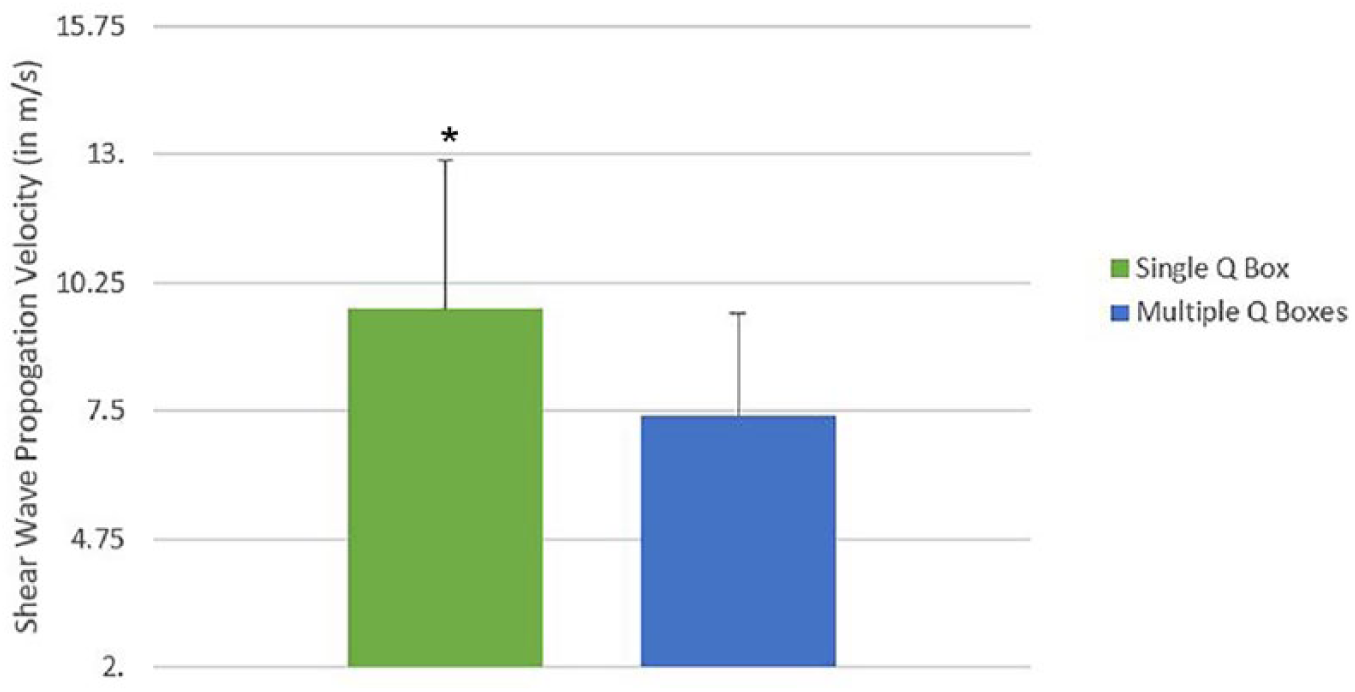
Comparison of mean SWV between single and multiple Q-boxes; nonuniform images. SWV, shear wave velocity.
Comparison of mean SWV between single and multiple Q-boxes; for uniform images. SWV, shear wave velocity.
Discussion
It is traditionally assumed that the shear wave velocities represent the entire muscle’s stiffness, 9 but this has never been empirically demonstrated. 7 The primary purpose of this study was to evaluate whether image appearance and the size of the measured area, within the ROI, affect the shear wave velocity calculation. These results would suggest that for nonuniform US elastograms, the shear wave velocity calculated, over the maximum area of the elastogram, was significantly lower compared to shear wave velocity calculated using a single Q-box.
The results of the present study are in agreement with a previous report by Ateş et al. 7 In that study, the researchers observed significantly increased errors in the calculation of shear modulus averaged over a small area compared to data averaged over a whole elastogram. Kot et al. 13 studied the effects of different transducer pressure, ROI size, and data acquisition time on the resting shear modulus of the rectus femoris under passive conditions. They reported that both the pressure applied to the transducer and the ROI size affected the shear wave modulus. Specifically, their study demonstrated significant differences in the maximum values of shear elastic modulus when different ROI sizes were used. In contrast, when the shear wave modulus was calculated by averaging over maximum area, these differences disappeared. 13 The authors concluded that this is due to the averaging of the elastic modulus over different areas of the US elastogram. The findings of the present and past studies suggest that there may be a risk of overestimating the shear wave velocity/modulus if the values from select regions of the US elastogram are used.
Table 2 compared the ranges of shear wave velocity between method 1 and method 2. For nonuniform images, the maximum shear wave velocity was 16.2 m/s using method 1 compared to 11.0 m/s for method 2. However, the lower boundary of the range was comparable. Since the area covered in method 1 is small, the likelihood that an artifact or an outlying data point may bias the calculation is much higher compared to method 2. In contrast, for uniform images, both the upper and lower bounds of the shear wave velocity range were close. This would support a recommendation for using a simple visual classification system for differentiating US elastograms before further image analysis.
The present study also used a simple classification system for US elastograms based on a visual appearance of uniform or nonuniform. This system can be somewhat subjective and operator dependent; therefore, this study evaluated the rater agreement for assessing US elastograms using a classification system. This study’s results suggest that, when corrected for chance agreements, the two raters agreed on the image classification 85% of the time, which is considered almost perfect agreement. In this study, the two raters classifying the elastograms had varying levels of experience working with US elastograms. The near perfect agreement in this study suggests that US elastograms can be easily categorized as having a uniform or a nonuniform appearance. This early classification is important as it may influence the decision of selecting the most appropriate method of quantifying the SWE velocity.
Limitations
This study has several limitations that should be noted. Transducer pressure was not objectively measured in this study, but during imaging, special attention was paid to the gray-scale image for the signs of compression. Pressure was adjusted based on the visual feedback during imaging. In addition, all the elastograms were captured by the same operator. This was a pilot study exploring the methods of collecting US elastographic data, and a larger scale study would be needed before the results and recommendations of this study can be used.
Conclusion
At present, there is no standard for capturing and reporting the technical settings for the musculoskeletal US elastography. This study would suggest that some guidelines should be developed for obtaining valid and reliable data. In order for US elastography to gain added diagnostic credibility, clinical applications will need to standardize the technical specification, data selection, and acquisition parameters. This research addressed the issue of placement and number of Q-boxes used to gauge stiffness of selected skeletal muscles. An image classification system was also piloted. This work needs to be replicated in a larger cohort of participants and perhaps compared to other stiffness-assessing techniques, such as magnetic resonance elastography. Adoption of US elastography to assess the stiffness of skeletal muscles is highly dependent upon the continued research that influences application.
Footnotes
Declaration of Conflicting Interests
The authors declared no potential conflicts of interest with respect to the research, authorship, and/or publication of this article.
Funding
The authors received no financial support for the research, authorship, and/or publication of this article.