
Abstract
Objective
This study was performed to clarify the influence of nonalcoholic fatty liver disease (NAFLD) on liver stiffness measurement (LSM) and establish a new diagnostic model.
Methods
A retrospective cohort of 601 patients with chronic hepatitis B (CHB) was enrolled as the derivation group, and a prospective cohort of 30 patients with concurrent CHB and NAFLD was enrolled as the validation group.
Results
The area under the receiver operating characteristic curve of LSM in patients with CHB without NAFLD (0.792) was higher than that in patients with concurrent CHB and NAFLD (0.720) in diagnosing significant liver fibrosis. Patients with concurrent CHB and NAFLD had significantly higher LSM values than those without NAFLD among the overall F0-F1 patients (6.88 vs. 5.80). The LSM value in the higher controlled attenuation parameter (CAP) quartile was significantly higher than that in the normal CAP quartile among F0-F1 patients (6.80 vs. 5.74). The efficacy of our new diagnostic model for liver fibrosis (Fibro-NAFLD) was higher than that of LSM in both study groups.
Conclusion
NAFLD with a high CAP value increases the risk of false-positive diagnosis of significant fibrosis. The Fibro-NAFLD model improves the diagnostic efficacy of LSM in patients with concurrent CHB and NAFLD.
Keywords
Introduction
Hepatitis B virus (HBV) infection and its associated morbidities, including cirrhosis, hepatocellular carcinoma (HCC), and liver failure, remain global public health problems. In patients who are hepatitis B e-antigen (HBeAg)-positive, the incidence of spontaneous cirrhosis is 1.6% per year in the East Asian area, and the corresponding 5-year cumulative incidence of cirrhosis is 8.0%. In patients who are HBeAg-negative, the incidence rate of cirrhosis increases to 2.8% per year with a corresponding 5-year cumulative incidence of 13.0%. 1 Although the prevalence of HBV infection is decreasing in several highly endemic regions because of an improved socioeconomic status, universal vaccination programs, and effective antiviral therapies, the number of HBV-related deaths due to cirrhosis and/or HCC increased by 33% from 1990 to 2013. 2 , 3
The development of cirrhosis has important significance as a clinical milestone because the mortality and incidence of HCC increase thereafter. Recent studies have indicated that liver fibrosis and cirrhosis are reversible when effective treatments such as anti-virus and anti-fibrosis therapies are given.4–6 For patients with chronic hepatitis B (CHB), precise identification of the stage of liver fibrosis is essential for making decisions about antiviral drug administration, which would be a turning point in the clinical course.
Liver biopsy is the gold standard technique in the assessment of liver fibrosis. However, considering its invasiveness, complexity, and potential risks, liver biopsy is unacceptable for routine examination in most patients. The development of ultrasound technologies has provided new insight into the measurement of liver stiffness. Transient elastography (TE) using FibroScan is a new, noninvasive, and reproducible technique that is used to evaluate hepatic fibrosis and cirrhosis, mainly in patients with chronic hepatitis. 7 , 8
Nonalcoholic fatty liver disease (NAFLD) has now become the most common liver disease in the general population worldwide. The clinical spectrum of NAFLD ranges from relatively benign nonalcoholic fatty liver to nonalcoholic steatohepatitis. The prevalence of NAFLD with comorbid CHB may exceed 13% according to recent studies. 9 , 10 However, hepatic steatosis induction has been found to affect the diagnostic performance of TE.11–13 Notably, the controlled attenuation parameter (CAP) provided by FibroScan is a reliable noninvasive marker with which to quantify hepatic steatosis, and it has also been found to be independently associated with obesity. 14 In the present study, we estimated the diagnostic efficacy of TE in patients with CHB and clarified the influence of NALFD on liver stiffness measurement (LSM) in patients with CHB. A new model of evaluating fibrosis among patients with concurrent CHB and NAFLD was established to estimate their fibrosis stage.
Materials and methods
Patients
In this study, we evaluated a retrospective derivation cohort and a prospective validation cohort. First, we retrospectively enrolled consecutive adult patients who had undergone liver biopsy and FibroScan tests at the First Affiliated Hospital of Anhui Medical University (Hefei, China) from January 2014 to December 2017. The inclusion criteria were as follows: (a) positivity for serum hepatitis B surface antigen (HBsAg) for >6 months and positivity for serum HBV DNA, (b) acceptance of liver biopsy, and (c) performance of a FibroScan test on the same day as the liver biopsy. The exclusion criteria were as follows: (a) coinfection with other viruses such as hepatitis C or hepatitis D virus; (b) histologic evidence of other concomitant chronic liver diseases; (c) HCC; (d) high alcohol consumption (>30 g of alcohol per day for men and >20 g of alcohol per day for women); (e) a liver biopsy length of <10 mm and/or fewer than six portal spaces and/or more than two fragments, except in cases of cirrhosis; and (f) a skin-to-liver capsule distance of >2.5 cm.15–17 An external validation cohort of patients with concurrent CHB and NAFLD from the Second Affiliated Hospital of Anhui Medical University (Hefei, China) from January 2018 to December 2018 was prospectively enrolled. The study protocol was approved by the Ethics Committee of the First Affiliated Hospital of Anhui Medical University. All the patients were well informed, and written consent was obtained from the patients or their legal guardians before conducting the liver biopsies.
Clinical and laboratory assessment
Fasting blood samples were collected the same day as the liver biopsy. The serum levels of HBsAg, HBeAg, and antibodies to HBsAg, HBeAg, and hepatitis B core antigen were assessed using commercially available kits (Abbott, Chicago, IL, USA). The serum HBV DNA level was determined using a TaqMan real-time polymerase chain reaction assay (Shanghai ZJ Bio-Tech, Shanghai, China) that had a lower detection limit of 1000 copies/mL. The serum concentrations of alanine aminotransferase, aspartate aminotransferase, total bilirubin, direct bilirubin, albumin (Alb), globulins, alkaline phosphatase, and gamma-glutamyl transpeptidase; the platelet count; the white blood cell (WBC) count; the hemoglobin concentration; and the international normalized ratio were examined using an automatic biochemical analyzer (Roche, Basel, Switzerland).
Liver biopsy
Before the procedure, the patients’ medical records and blood sample tests were reviewed to identify contraindications. After induction of local anesthesia, an ultrasound-guided percutaneous liver biopsy was performed using a 16-G needle (Bard Peripheral Vascular, Tempe, AZ, USA) with an automated biopsy gun. Liver biopsy was repeated in patients with a liver specimen length of <13 mm. The liver specimen was immediately immersed in formalin for fixation before hematoxylin–eosin and Masson staining. Liver fibrosis was diagnosed according to the METAVIR fibrosis staging score. Significant fibrosis and cirrhosis were defined as a METAVIR score of ≥F2 and ≥F4, respectively. The pathological findings in this study were interpreted by two pathologists with clinical experience of ≥5 years. If the interpretations of the results were inconsistent, another senior pathologist resolved the discrepancy. All pathologists were blinded to the TE results.
Transient elastography
LSM and CAP were evaluated by an experienced operator immediately before liver biopsy using the M probe (also called the standard probe) of a FibroScan device (Echosens, Paris, France). The quality control criteria for FibroScan were defined as examinations with >10 valid measurements, LSM interquartile range/median value of <0.21, and success rate of ≥60%. If the measurements could not pass quality control, the FibroScan examination was repeated until the measurements passed quality control or we considered that the FibroScan test was not suited for the patient. Hepatic steatosis was defined as CAP of ≥238 dB/m. Mild steatosis (proportion of affected hepatocytes: 10%–33%), moderate steatosis (34%–66%), and severe steatosis (>66%) were defined as CAP of 238 to 259, 260 to 292, and >292 dB/m, respectively, based on a recent meta-analysis correlating CAP measurements with histological steatosis grading and the reference values recommended by FibroScan.18–20
Statistical analyses
Statistical analyses were performed using SPSS 21.0 (IBM Corp., Armonk, NY, USA). Continuous data are presented as mean ± standard deviation or median with interquartile range as appropriate. Student’s t-test or the nonparametric Mann–Whitney U test was used to conduct comparisons among groups. Categorical data are presented as number (percentage), and the chi-square test was used for comparison. Univariate and multivariate logistic regression analyses were performed to identify independent indicators of the fibrosis stage. Areas under the receiver operating characteristic curve (AUROC) were calculated and compared by the Z test (DeLong’s method). Two-tailed P-values of <0.05 were considered statistically significant.
Results
Patients and clinical characteristics
From January 2014 to December 2017, 820 eligible participants were prospectively screened for inclusion in this study, among whom 157 patients were excluded because of active alcoholism; 31 patients were excluded because of other concomitant chronic liver diseases, such as autoimmune liver disease or chronic hepatitis C; 18 patients were excluded because of a skin-to-liver capsule distance of >2.5 cm; 12 patients were excluded because of failure to undergo a liver biopsy; and 1 patient was excluded because of the possibility of liver cancer. In total, 601 eligible participants were enrolled for analysis (Figure 1). The external validation group comprised 30 patients with concurrent CHB and NAFLD from the Second Affiliated Hospital of Anhui Medical University from January 2018 to December 2018. The patients’ baseline characteristics, laboratory results (alanine aminotransferase, aspartate aminotransferase, platelet count, total bilirubin, direct bilirubin, Alb, alkaline phosphatase, gamma-glutamyl transpeptidase, international normalized ratio, WBC count, red blood cell count, hemoglobin, platelet count, and HBV DNA level), FibroScan results, and histological features are summarized in Table 1.

Flowchart of the study. Screening, enrollment, and classification of patients. CHB, chronic hepatitis B; CHC, chronic hepatitis C; AIH, autoimmune hepatitis; NAFLD, nonalcoholic fatty liver disease.
Clinical characteristics of patients in the derivation and validation groups.
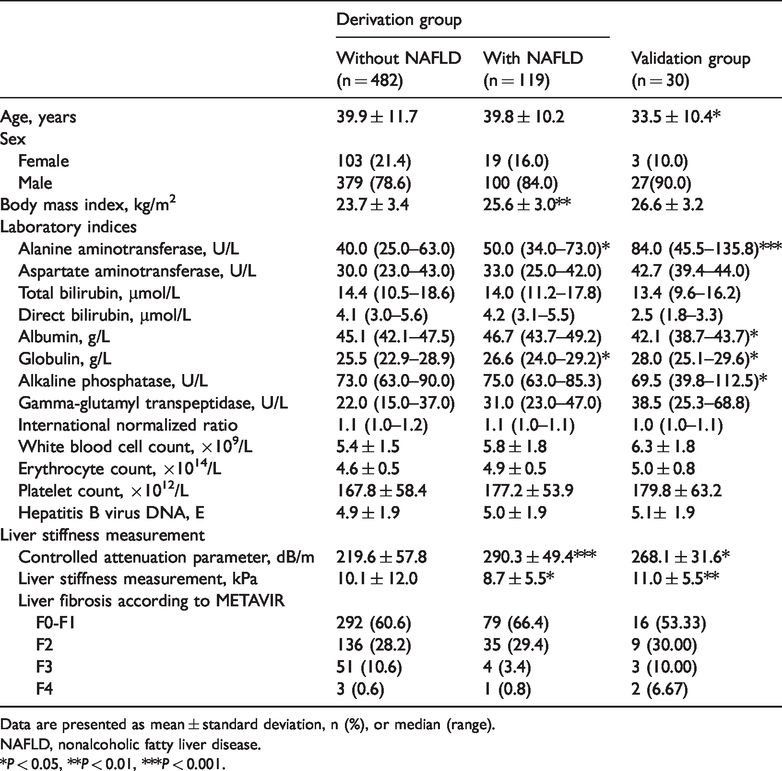
Data are presented as mean ± standard deviation, n (%), or median (range).
NAFLD, nonalcoholic fatty liver disease.
*P < 0.05, **P < 0.01, ***P < 0.001.
The derivation group was divided into two subgroups according to the presence of NAFLD. The mean age of the 119 patients with concurrent CHB and NAFLD was 39.8 ± 10.2 years, and that of the 482 patients without NAFLD was 39.9 ± 11.7 years; the difference between the two groups was not statistically significant. Male sex was predominant in both patients with CHB with and without NAFLD (84.0% and 78.6%, respectively). The mean body mass index (BMI) was 23.7 ± 3.4 kg/m2 in the CHB without NAFLD group, which was significantly lower than that in the CHB with NAFLD group (25.6 ± 3.0 kg/m2, P < 0.01). In the validation group, the mean age was 33.5 ± 10.4 years. Similar to the derivation group, men accounted for the vast majority of patients, and their mean BMI was 26.6 ± 3.2 kg/m2.
Diagnostic efficacy of LSM in patients with CHB with and without NAFLD
A receiver operating characteristic curve analysis was performed to investigate the diagnostic efficacy of TE in diagnosing significant fibrosis in patients with CHB. The AUROC of TE in the total patients with CHB and in the patients with CHB without NAFLD was 0.775 (95% confidence interval [CI], 0.735–0.815) and 0.792 (95% CI, 0.749–0.834), respectively. The AUROC in the patients with concurrent CHB and NAFLD decreased to 0.720 (95% CI, 0.616–0.824), which was lower than that in the total patients with CHB and in the patients with CHB without NAFLD (Figure 2). Among patients with hepatic fibrosis stage F0-F1, 45 patients had CHB with NAFLD and 155 patients had CHB without NAFLD (Table 1). The LSM was significantly higher in the patients with than without NAFLD (7.46 ± 3.85 vs. 6.18 ± 2.51 kPa, respectively; P < 0.001), indicating a possible false-positive diagnosis in the patients with NAFLD with stage F0-F1 hepatic fibrosis (Figure 3(a)). The CAP values were grouped by quartiles (normal, <238; low, 238–259; middle, 260–292; and high, >292 dB/m). Significant differences were observed between the CAP >292 versus <238 dB/m groups, indicating that patients with severe hepatocyte steatosis had higher LSM values in the F0-F1 fibrosis stage (Figure 3(b)). However, the difference was not significant in patients in the F2-F4 fibrosis stage (Figure 3(c)). These results suggest that severe hepatocyte steatosis may increase the rate of false-positive diagnosis of the fibrosis stage in patients with F0-F1 hepatic fibrosis, whereas its influence on patients with advanced fibrosis and cirrhosis is limited.

Receiver operating characteristic curves for the ability of liver stiffness measurement to predict the fibrosis stage of patients with and without NAFLD. AUC, area under the curve; NAFLD, nonalcoholic fatty liver disease.

Overestimation of LSM in patients with F0-F1 fibrosis with severe hepatic steatosis. (a) LSM value of patients with CHB with and without NAFLD in the F0-F1 fibrosis stage. (b) LSM value of patients with CHB with an increased CAP value in the F0-F1 fibrosis stage. (c) LSM value of patients with CHB with and without NAFLD in the F2-F4 fibrosis stage. CHB, chronic hepatitis B; LSM, liver stiffness measurement; CAP, controlled attenuation parameter; NAFLD, nonalcoholic fatty liver disease.
The patients were divided into two groups according to the cutoff LSM (7.85 kPa) for diagnosing F2 fibrosis: the LSM ≤7.85 kPa group and the LSM >7.85 kPa group. Among patients with NAFLD, 28 patients had an LSM of >7.85 kPa, resulting in a false-positive diagnosis of F2 fibrosis. The false-positive diagnosis rate was significantly higher than that in patients without NAFLD (0.354 vs. 0.178, respectively; P < 0.05) (Figure 4(a)). In the F0-F1 group, significant differences were observed among different CAP quartiles. In the lower CAP quartile, nine patients had an LSM of >7.85 kPa, and the false-positive diagnosis rate was 20% (9/45). In the middle CAP quartile, the false-positive diagnosis rate was 19.7% (12/61). However, the false-positive diagnosis rate significantly increased to 31.5% (23/73, P < 0.05) in the higher CAP quartile (Figure 4(b)–(d)).

Increased false-positive diagnosis rate in patients with F0-F1 fibrosis with severe hepatic steatosis. (a) False-positive diagnosis rate of patients with and without NAFLD in the F0-F1 fibrosis stage. (b) False-positive diagnosis rate of patients with CHB with CAP of <238 in the F0-F1 fibrosis stage. (c) False-positive diagnosis rate of patients with CHB with CAP of 238 to 259 in the F0-F1 fibrosis stage. (d) False-positive diagnosis rate of patients with CHB with CAP of 260 to 292 in the F0-F1 fibrosis stage. (e) False-positive diagnosis rate of patients with CHB with CAP of >292 in the F0-F1 fibrosis stage. CHB, chronic hepatitis B; LSM, liver stiffness measurement; CAP, controlled attenuation parameter; NAFLD, nonalcoholic fatty liver disease.
Development of a novel model for fibrosis staging in patients with concurrent CHB and NAFLD
The above results suggest that TE has a considerably high false-positive diagnostic rate in patients with concurrent CHB and NAFLD. A new model for fibrosis staging in these patients would be helpful in clinical practice. First, we performed a univariate logistic regression analysis, and the results showed that sex, CAP, LSM, aspartate aminotransferase, Alb, globulins, and WBC count were significantly associated with significant liver fibrosis in patients with concurrent CHB and NAFLD. The multivariate logistic regression analysis showed that sex, CAP, LSM, Alb, and WBC count were independent risk factors for liver fibrosis. Based on these results, we established a novel diagnostic model for fibrosis staging: Fibro-NAFLD (significant fibrosis) = 3.88 − 1.10 × (male = 1) − 0.01 × CAP + 0.20 × LSM − 0.03 × Alb − 0.08 × WBC. The AUROC of Fibro-NAFLD for the diagnosis of significant fibrosis in patients with concurrent CHB and NAFLD in the derivation group was 0.765 (95% CI, 0.667–0.863), which outperformed use of the LSM value (0.711; 95% CI, 0.605–0.818) (Figure 5(a)).

ROC curves for the LSM and Fibro-NAFLD models. (a) ROC curve for the ability of LSM and Fibro-NAFLD to predict the hepatic fibrosis stage in the derivation group. (b) ROC curve for the ability of LSM and Fibro-NAFLD to predict the hepatic fibrosis stage in the validation group. ROC, receiver operating characteristic; LSM, liver stiffness measurement; AUC, area under the curve; NAFLD, nonalcoholic fatty liver disease.
Validation of the Fibro-NAFLD model for fibrosis staging
To further validate the diagnostic value of the newly established Fibro-NAFLD model, 30 patients with concurrent CHB and NAFLD from the Second Affiliated Hospital of Anhui Medical University from January 2018 to December 2018 were enrolled as an external validation group. The mean age was 33.5 ± 10.4 years in the validation group, which was similar to that in the derivation group. As in the derivation group, men accounted for the vast majority of patients, and the mean BMI was 25.1 ± 2.8 kg/m2. In total, 56.7% (17/30) of patients were histologically diagnosed with F0-F1 hepatic fibrosis in the validation group. The AUROC of Fibro-NAFLD was 0.804 (95% CI, 0.642–0.965), which was higher than that of LSM (0.694; 95% CI, 0.494–0.895) (Figure 5(b)).
Discussion
Liver biopsy is often limited by its invasiveness, sampling error, and intraobserver/interobserver variability in histological interpretation. During the past few decades, TE has been developed as a noninvasive method that can replace liver biopsy to reduce the potential associated costs and risks. TE has been demonstrated to be a convenient and reliable tool with which to stage liver fibrosis and cirrhosis in patients with chronic liver diseases such as CHB and chronic hepatitis C. 20 , 21 Among patients with CHB, those with significant fibrosis have faster progression to cirrhosis. Identifying the fibrosis stage and administering precise antiviral therapy administration is essential to reverse the disease course and prevent cirrhosis. Generally, the diagnosis by TE in patients with CHB shows comparable accuracy.
Of the 601 patients with CHB in this study, TE showed comparable diagnostic performance in predicting significant fibrosis, suggesting the ability to avoid unnecessary liver biopsy in many of these patients. However, the situation may differ in patients with CHB with comorbid NAFLD. 22 , 23 Other studies have shown that a high BMI and insulin resistance, perhaps through hepatocyte steatosis induction, can affect the diagnostic performance of TE. 24 In our study, the presence of severe liver steatosis (CAP of >292 dB/m) was not only independently associated with higher LSM values, especially in patients with low grades of fibrosis, but also interfered with the overall diagnostic performance of TE in patients with concurrent CHB and NAFLD, leading to overestimation of liver fibrosis. This phenomenon was found in F0-F1 fibrosis, but not in patients with advanced fibrosis and cirrhosis. The reason for this might be that the presence of fat droplets in the hepatocytes affects the architectural structure of the liver, potentially altering the propagation time of the vibratory wave through the liver, which is the core principle of TE. Therefore, our study suggests the need for careful interpretation of TE in patients who have CHB with severe steatosis, where use of the LSM value might overestimate liver fibrosis.
Various noninvasive models, including the LSM value and the APRI and FIB-4 models, have been developed in recent years to evaluate fibrosis in patients with chronic hepatitis. However, the diagnostic performance of these models in staging fibrosis in patients with NAFLD is not satisfactory.25–27 In the present study, we observed the influence of demographic, biochemical, and histological factors on steatosis. We performed univariate and multivariate logistic regression analyses and found that sex, CAP, LSM, Alb, and WBC count were independent risk factors for liver fibrosis. Based on the above results, a novel model (Fibro-NAFLD) was developed to improve the diagnostic efficacy of TE in diagnosing liver fibrosis. The Fibro-NAFLD model showed higher predictive ability in both the derivation and validation groups. Our results indicate that Fibro-NAFLD as a fibrosis staging model is more suitable for patients with CHB and NAFLD.
The study had two main limitations. First, the sample size of the validation group was relatively small. More data with larger sample sizes can help to validate our algorithm. Second, we did not elucidate the detailed mechanism underlying how NAFLD increased the LSM results in patients with CHB. This will require further study.
In summary, severe hepatic steatosis can decrease the diagnostic efficacy of LSM in patients with concurrent CHB and NAFLD. The fibrosis stage may be overestimated in patients with CHB with a high CAP, and this will result in an increased rate of false-positive diagnosis of significant fibrosis in the lower stages of hepatic fibrosis. We have established a new model that improves the diagnostic accuracy of LSM for assessing the liver fibrosis stage in patients with concurrent CHB and NAFLD.
Footnotes
Acknowledgments
The authors thank Dr. Zhenhua Zhang (Liver Department, the Second Affiliated Hospital of Anhui Medical University) for providing helpful comments on the manuscript preparation.
Authors’ contributions
The study was designed by XL and supervised by XL and YG. The manuscript was written by NX, QX, and JL. The data analyses were performed by NX, QX, JL, YG, and XL. All authors were involved in critical revision of the manuscript.
Declaration of conflicting interest
The authors declare that there is no conflict of interest.
Funding
This research received no specific grant from any funding agency in the public, commercial, or not-for-profit sectors.