
Abstract
Targeted contrast-enhanced ultrasound (TCEUS) is an innovative method of molecular imaging used for detection of inflammatory biomarkers in vivo. By targeting ultrasound contrast to cell adhesion molecules (CAMs), which are known inflammatory markers within neural tissue, a more direct evaluation of neural inflammation can be made. Due to the novel nature of TCEUS, standardized methods of image analysis do not yet exist. Time intensity curve (TIC) shape analysis is currently used in magnetic resonance contrast imaging to determine temporal behavior of perfusion. Therefore, the presented research attempts to determine TIC shape analysis utility in TCEUS imaging by applying it to TCEUS scans targeted to CAMs present in neural inflammation. This was done in an animal model that underwent a traumatic spinal cord injury to induce inflammation (n = 31). Subjects were divided into four groups, each receiving a TCEUS targeted to a different CAM seven days after surgery (P-selectin, intracellular adhesion molecule 1 [ICAM-1], vascular cell adhesion molecule 1 [VCAM-1], and control). TICs were generated using average pixel intensity within the injured region of the spinal cord. TIC shape analysis found similar curves were produced while targeting P-selectin and VCAM-1, both demonstrating rapid and sustained enhancement. Control injections demonstrated no enhancement. ICAM-1 injections demonstrated limited enhancement and a shape similar to the control.
Keywords
Ultrasound contrast agents are composed of gas-filled microbubbles held in an aqueous solution. These have been demonstrated in Europe and Asia to be an effective method of detecting blood perfusion at the tissue level. 1 The use of small gas bubbles to enhance ultrasound imaging was first reported for the enhancement of the aortic root in echocardiographic imaging. 2 After multiple years of in vitro and in vivo research, properties of ultrasound contrast agents are well established. Most notably, contrast-enhanced ultrasound (CEUS) is used in the evaluation of liver lesions, but multiple other applications exist, pushing diagnostic ultrasound to enter into a new era. 3 It has been hypothesized that further research in this area will allow ultrasound to play a competitive role in abdominal imaging, relative to computed tomography (CT) and magnetic resonance imaging (MRI). 4
Because of its small size, ultrasound contrast maintains the ability to cross the capillaries of the lungs and recirculate, enabling the contrast to remain in circulation for extended periods of time and allow for an elongated time of enhanced imaging.5–8 This window of opportunity for imaging can be lengthened even further, however, by employing targeted ultrasound contrast technology.9,10 By attaching biological markers to the surface of the ultrasound contrast microbubble, the contrast agent can target and tether to physiologic markers in vivo.5,6,9–12 This allows for not only elongated imaging time but also the evaluation of biochemical processes at the molecular level.5,6,9–11,13
The composition of ultrasound contrast microbubbles causes them to be restricted to the vascular compartment, and they are therefore ideal for investigating disease processes taking place on the endothelial surface. 14 To this end, cell adhesion molecules (CAMs), such as P-selectin, intracellular adhesion molecule 1 (ICAM-1), and vascular cell adhesion molecule 1 (VCAM-1), are known biomarkers that express in the early stages of inflammation on the endothelium surface.15–17 Therefore, it is fitting that targeting these CAMs, by way of targeted contrast-enhanced ultrasound (TCEUS) imaging, be used for the determination of the presence of an inflammatory process. Successful TCEUS imaging has been demonstrated on each of the CAM inflammatory markers listed above, but it has not been used for the detection of neural inflammation.5,15,18–23
Because of the novel nature of TCEUS, further research in this field is necessary, including methods of analysis. Time intensity curve (TIC) shape analysis is primarily used in the interpretation of MRI contrast studies and could potentially be a method of TCEUS analysis, if properly translated to that imaging technique. 24 There is a general consensus that the most important components of the TIC are the initial enhancement phase and the delayed enhancement phase. 25 These are also known as the wash-in and wash-out phases, representing the temporal behavior of contrast as it enters and exits the imaged tissues, and will be referred to as such for the remainder of the article (Figure 1). Kuhl et al. 26 have reported an analysis technique for TICs, in which they are classified into three categories based on the shape of the wash-in and wash-out portions of the curve. A second analysis technique has been proposed by van Rijswijk et al., 27 in which TICs were subjectively placed into five different categories based on their shape (Figure 2).
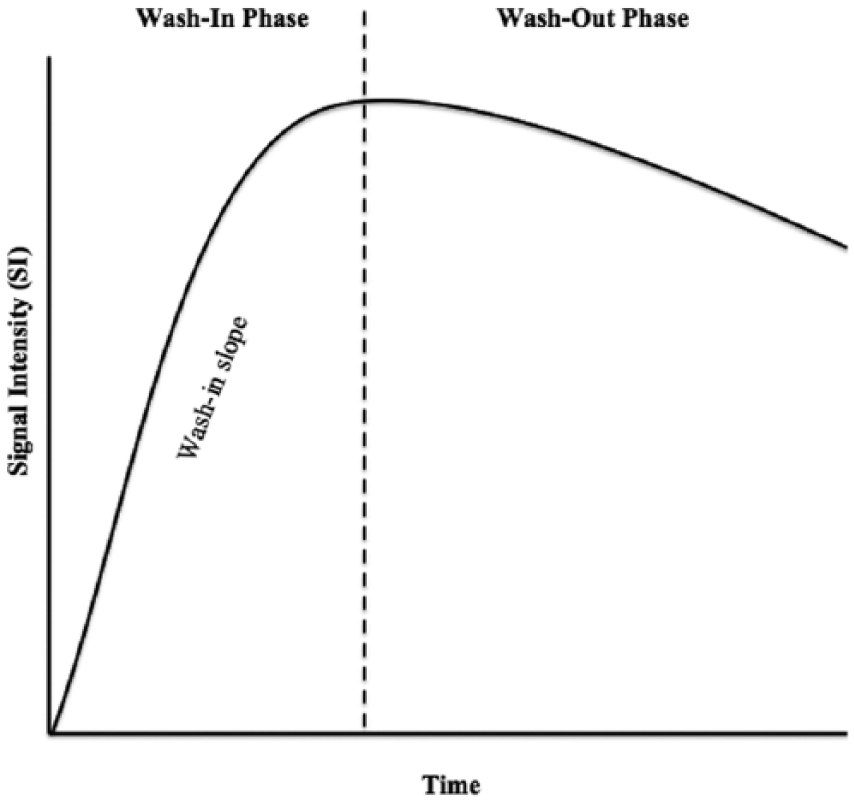
Time intensity curve diagram showing the components of the curve that are evaluated during analysis.
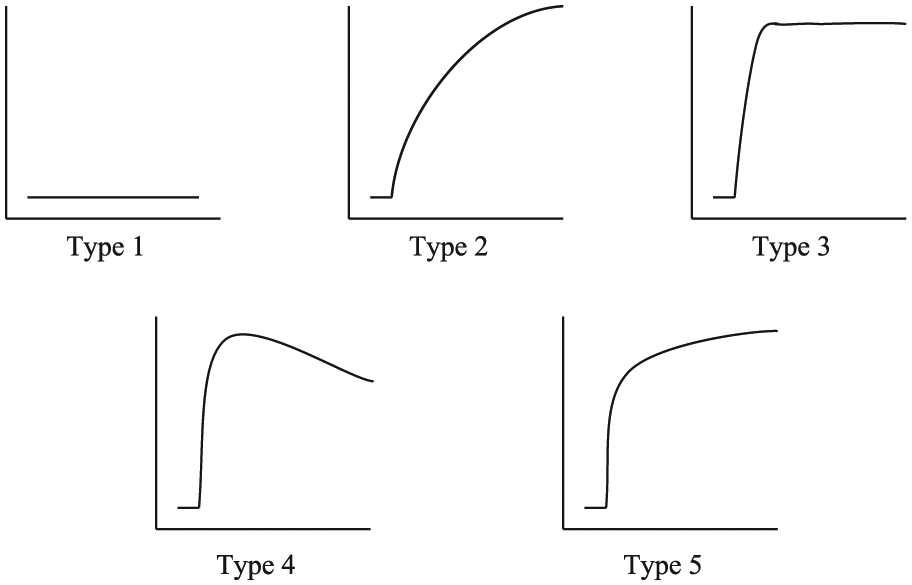
Time intensity curve shape analysis classifications as proposed by van Rijswijk et al. 27
Recent research in this area has focused on applying this perfusion analysis method to CEUS. TIC shape analysis is advantageous to this area of ultrasound imaging, as it adds objective data to the largely subjective analysis of CEUS. 28 Intriguingly, multiple research studies in this area have demonstrated promising results while using shape analysis methods of TICs generated from CEUS. Thus, investigation of TIC shape analysis in TCEUS imaging represents a novel analytical method worthy of investigation.
Therefore, the following research question was posed: Can ultrasound contrast that has been nanoengineered to target CAMs present in the early stages of inflammation be detected and analyzed using TIC shape analysis to provide information regarding the presence of neural inflammation and the temporal behavior of the targeted contrast agent?
Based on the existing literature, which reports successful results of using TCEUS for the detection of inflammation via CAM targeting, the hypothesis is that ultrasound contrast that has been nanoengineered to target CAMs expressed in the early stages on inflammation (P-selectin, ICAM-1, and VCAM-1) will tether and produce an enhanced signal in the presence of neural inflammation. This enhanced signal will then be examined using TIC shape analysis, which will provide information regarding the temporal behavior of the targeted ultrasound contrast.
Review of the Literature
Molecular ultrasound imaging, or TCEUS, was first used for the detection of thrombus formation by Unger et al. 29 Current research in this area focuses on the detection of biological markers that are thought to be present in the early stages of various disease processes, in an attempt to facilitate a more sensitive diagnostic tool. 16 This research is occurring particularly with biological markers that are expressed on the surface of the endothelium, as ultrasound contrast is restricted to the vascular compartment. 14 Therefore, much of the current research in this area is aimed at the early detection of disease processes occurring on the endothelium. 30 A number of preclinical TCEUS animal studies have been conducted to evaluate the early presence of angiogenesis in tumors, by way of targeting integrins. 9,31–34 Another application for TCEUS that is also being highly investigated is in the area of inflammation.
The inflammatory process is mediated by the initial capturing and adhesion of rolling leukocytes by CAMs on the endothelial surface.35,36 Such CAMs include P-selectin, ICAM-1, and VCAM-1 and therefore have all been described as early inflammatory biomarkers. To this end, the determination of their presence could aid in an early diagnosis of inflammation. Weller et al. 20 investigated TCEUS targeted to ICAM-1 in cardiac tissue for the detection of early stage cardiac transplant rejection. In this preclinical study, a statistically significant increase in microbubble binding was seen in the experimental group experiencing rejection compared with the control group, which was experiencing no tissue rejection. 20 In a similar study, signal intensities obtained in TCEUS imaging targeted to ICAM-1 were statistically significantly elevated in an inflamed coronary artery. 37 VCAM-1 has also been investigated for the determination of its role in the early detection of inflammation via TCEUS. Promising results have been reported in atherosclerosis and other conditions.19,38,39 Last, particular success has been attained through the targeting of P-selectin using TCEUS in preclinical in vivo studies. In a study examining renal tissue inflammation, microvascular adhesion of ultrasound contrast microbubbles to P-selectin was found within the inflamed kidney, resulting in an enhanced signal on the ultrasound image. 40 Another application has been established by the successful targeting of P-selectin proteins in an inflamed femoral vein wall. 41 Furthermore, Kaufmann et al. 42 demonstrated 10 times more binding of microbubbles targeted to P-selectin than controls while examining myocardial ischemia and reperfusion. Similarly, a study conducted by Villaneuva et al., 43 also examining P-selectin targeting in myocardial ischemia and reperfusion, produced similar findings. Last, studies have demonstrated the ability of CEUS to detect inflammation in its early stages within the bowel. 44 Success in targeting P-selectin may be due to its large size, as it is one of the biggest CAMs, or its uniqueness of being expressed on the surfaces of both platelets and the endothelium. 23
This brief review of the existing literature provides evidence for the ability of targeted ultrasound contrast to bind to P-selectin, ICAM-1, and VCAM-1 for the early evaluation of inflammation. Successful visualization of these inflammatory biomarkers has been accomplished in a variety of different models and tissues. However, there is no apparent literature that attempts to target early inflammatory markers in neural tissue. Furthermore, none of the reported studies in the existing literature use TIC shape analysis as a method interpreting a TCEUS.
Methods
Mouse Model
This research protocol was approved by the Institutional Animal Care and Use Committee (IACUC). Thirty-one adult female C57BL/6 mice underwent contusive spinal cord injury, followed by a TCEUS scan seven days later. The average subject weight was 17.1 g (15.0–18.8 g), and the average subject age was 65.9 days (62–70 days). This mouse strain has been commonly used in similar studies and was therefore selected so that appropriate comparisons could be possible. All surgeries were performed under aseptic conditions. Briefly, under deep anesthesia with ketamine and xylazine (intraperitoneal injection 90 mg/kg and 10 mg/kg, respectively), mice received a dorsal laminectomy of the ninth thoracic vertebra (T9). An Infinite Horizon Impactor (Precision Systems, Kentucky, IL) device administered a moderate to severe contusion injury using an experimentally controlled force of 75 kdynes (mean actual force, 77.0 ± 2.0 kdyne). After securing the lateral processes of T8 and T10, the stainless steel impactor tip displaced the cord 597.7 ± 54.0 microns. 45 The contusion severity was derived from previous studies with C57BL/6 mice.46,47 The structure of the spinal cord lesion was characterized as a central lesion with a small peripheral rim of spared white matter within the T9 segment. 46 The exposed micro-circulation at the injury epicenter caused the expression of the CAM inflammatory biomarkers after the induced moderate to severe contusion.48,49
The subjects were divided into four groups. Each group received an ultrasound contrast injection targeted to a different CAM (P-selectin, n = 8; ICAM-1, n = 7; VCAM-1, n = 8; and isotype control, n = 8) (Figure 3). The isotype control injection consisted of a bolus of contrast conjugated to an antibody that does not bind to any of the CAMs being investigated. This will serve as the baseline measure.
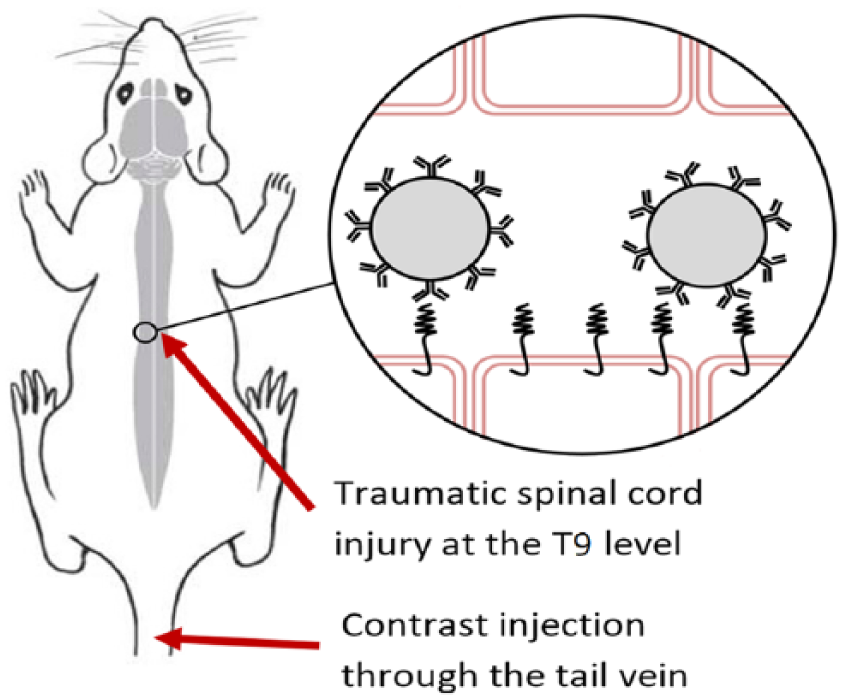
Diagram of ultrasound contrast microbubbles attaching to the targeted cell adhesion molecule within the inflamed spinal cord.
A TCEUS sonogram was performed seven days after the traumatic spinal cord injury. This allowed for an appropriate amount of time for suture healing on the skin surface but was still early enough to capture CAM expression. 50 During the TCEUS, the animals were anesthetized with 2.5% isofluorane mixed with 1 L/min carbogen and were maintained with 0.5% to 1.5% isofluorane. Once anesthetized, a tail vein catheter was placed to provide a route for targeted ultrasound contrast administration. The animal was then positioned prone, to allow for a posterior scanning approach. The hair of the animal was also removed to allow for optimized sonographic imaging. Physiologic parameters such as electrocardiogram (ECG), respiration, and temperature of the animals were monitored during the entire length of the TCEUS, using the small animal monitoring system integrated into the Vevo 2100 (VisualSonics, Toronto, Canada) unit. Heart rate was maintained at the range of 300 to 450 beats per minute by adjusting the level of anesthesia, while the core temperature was maintained at 37°C using the heated warming pad on the Vevo US system.
Ultrasound Contrast
A bolus of 0.03 mL Targestar SA (Targeson, San Diego, California) microbubble ultrasound contrast solution, nanoengineered to target the various CAMs being examined, was used for TCEUS imaging. Targeting ligands were bioconjugated and attached to the surface of the microbubbles via a biotin-streptavidin-biotin interaction. The nanoengineering process began by dispersing the microbubble base solution until a uniformly opaque color was achieved. This opaque color was due to the suspended microbubble formation, which was then ready to be attached to the targeting antibody (anti P-selectin, anti ICAM-1, anti VCAM-1, and isotype control). Then, 200 µL of the targeted antibody solution was injected into 1 mL of the microbubble base, which was then redispersed by shaking of the vial. A washing process was used to remove any excess and nonattached antibodies. Buffer solution was then added to the vial to achieve a total volume of 5 mL. Next, the solution was centrifuged at 400 × g for four minutes, causing the microbubbles to form a cake at the top of the solution. Excess solution was drained without disturbing the cake to attain a final volume of 1.0 mL. The final step in the nanoengineering process was to redisperse the microbubbles by shaking the vial containing the now targeted contrast agent. The isotype control injections were prepared and administered in the same manner as the contrast injections to allow for a proper comparison to be made. The isotype control injections consisted of microbubbles conjugated to antibodies of the same isotype as the targeted antibody but possessed no specificity to the target antigen. Targeted ultrasound contrast dosing and technical parameters were derived from previous studies in the literature examining similar mouse biochemical processes using the Targestar SA contrast agent. 31
TCEUS
A Vevo 2100 ultrasound (US) unit was used to perform TCEUS imaging. A linear transducer operating at 40 MHz and 2% power was employed to collect sagittal images at the level of the T9 spinal cord. Quality control data were collected using a tissue-mimicking phantom to ensure consistent axial and lateral resolution parameters throughout the course of the research study.
Sagittal images were acquired using a posterior approach on the animal. This approach allowed for the least possible distance between the transducer face and the spinal cord, facilitating the use of the highest possible operating frequency. Once an elongated image of the spinal cord was obtained, the transducer was locked into a transducer mounting system, which secured the transducer in a stationary position. This allowed for consistent imaging to take place. Imaging began 10 seconds prior to contrast administration in order to acquire nonenhanced images. These images serve as the reference for nonenhanced pixel intensity and provide a baseline for which contrast enhanced images can be compared. The contrast bolus was then administered and followed by seven minutes of imaging. At the seven-minute time point, the burst mechanism was activated, rupturing all microbubbles within the beam profile.5,12,15,19,31,40,51–54 Imaging continued for two more minutes to monitor the effect of the bursting pulse on the contrast distribution at the site of injury. This was done to confirm binding of the US contrast microbubbles to inflammatory biomarkers. 43 All images were recorded in the form of video (AVI) clips, which allowed for the option of selecting individual frames during the analysis process. All TCEUS scans were performed by an American Registry of Diagnostic Medical Sonography (ARDMS) credentialed sonographer, with experience in musculoskeletal and animal imaging.
Data Analysis
Retrospective TCEUS analysis was done using the Vevo analysis computer software. A region of interest (ROI) was drawn around the spinal cord at the level of T9 using electronic calipers. This ROI was then applied to the entire seven-minute AVI clip of the TCEUS. Once completed, a quantified value of pixel intensity, or signal intensity, within the T9 spinal cord was assigned to each frame of the TCEUS. Signal intensities were then plotted over time to generate TICs. This was done to provide a semiquantitative display of signal intensity data, representing the temporal behavior of targeted ultrasound contrast throughout the entire TCEUS. 55 The signal intensities comprising the TICs were then averaged within each CAM group to generate an average TIC for each CAM condition. These TCEUS TICs were then classified using the two methods of TIC shape analysis (Kuhl and van Rijswijk) mentioned earlier.25,27
Results
The TCEUS TICs from each CAM group are represented in Figures 4 to 7. A TCEUS TIC displaying all four conditions was also constructed to allow for relative comparison between each of the targeted CAMs (Figure 8). Based on the TIC shape analysis classifications set forth by Kuhl et al., 26 ultrasound contrast targeted to P-selectin, ICAM-1, and VCAM-1 was categorized as a type 1 TIC curve, as a continuous increase in signal intensity (SI) was seen. The TCEUS TIC generated from the isotype control injections depicted no enhancement and therefore did not fit into a category proposed by Kuhl et al.
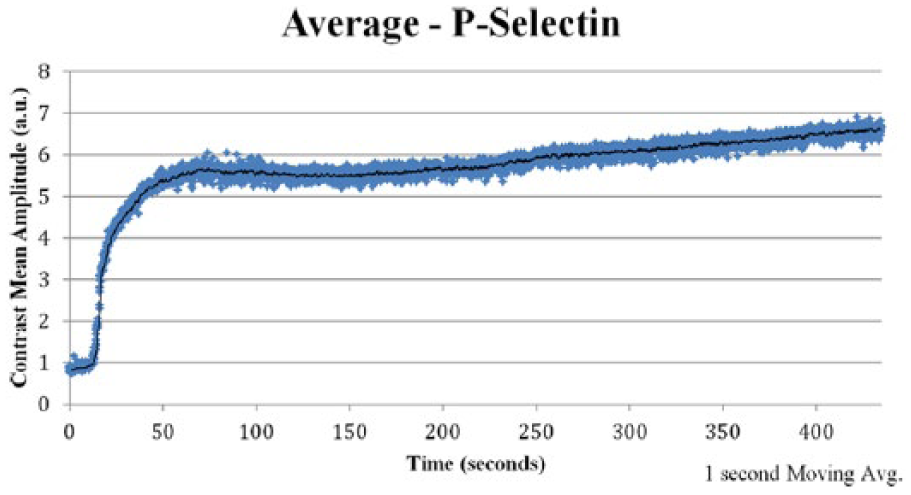
Targeted contrast-enhanced ultrasound (TCEUS) time intensity curve derived from the average signal intensity values of the group that underwent contrast administration targeted to P-selectin.
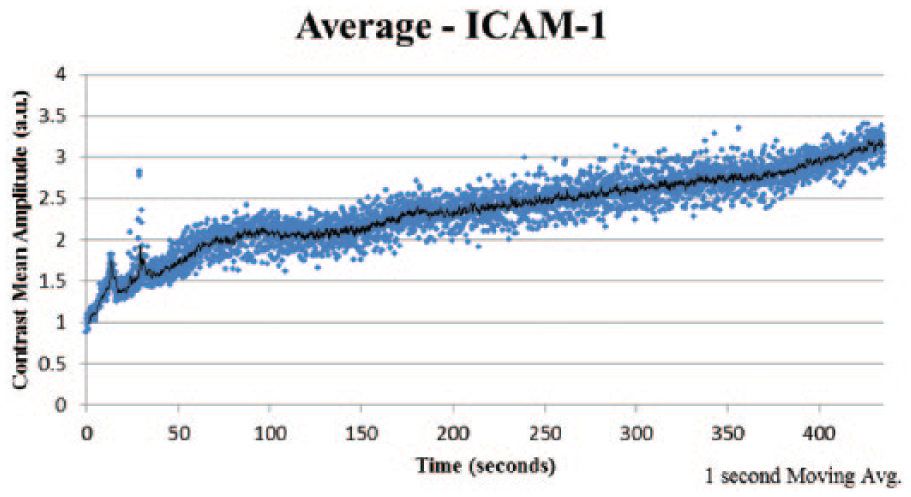
Targeted contrast-enhanced ultrasound (TCEUS) time intensity curve derived from the average signal intensity values of the group that underwent contrast administration targeted to intracellular adhesion molecule 1 (ICAM-1).
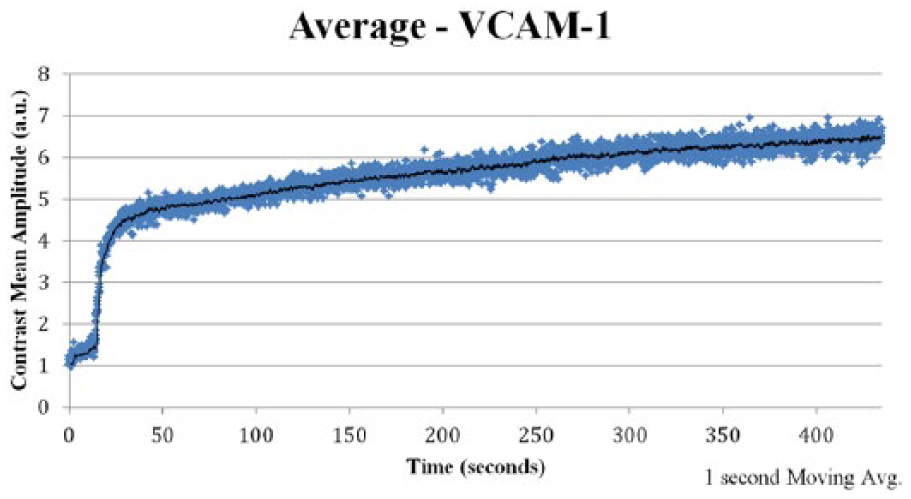
Targeted contrast-enhanced ultrasound (TCEUS) time intensity curve derived from the average signal intensity values of the group that underwent contrast administration targeted to vascular cell adhesion molecule 1 (VCAM-1).
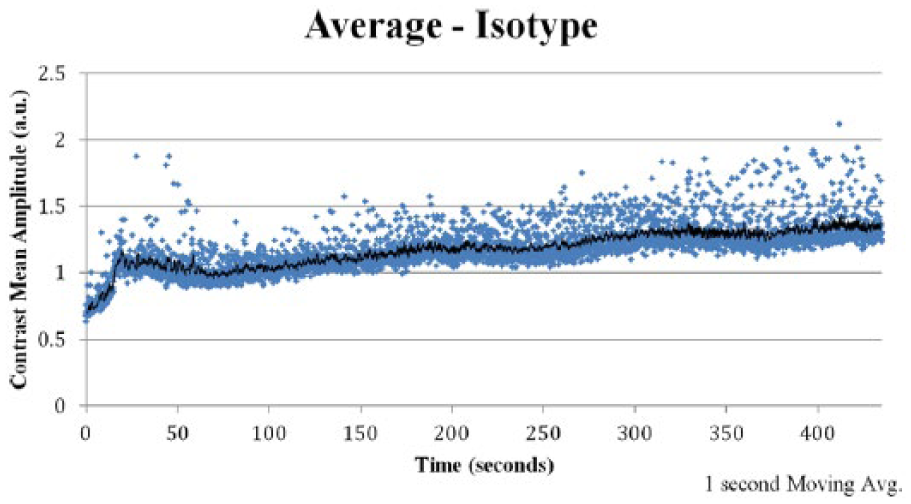
Targeted contrast-enhanced ultrasound (TCEUS) time intensity curve derived from the average signal intensity values of the group that underwent administration of isotype control contrast.
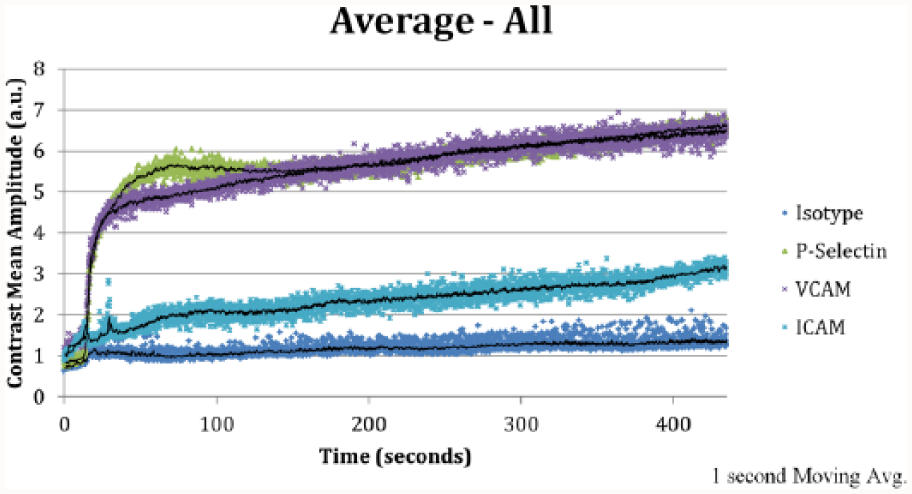
Targeted contrast-enhanced ultrasound (TCEUS) time intensity curve of each experimental condition, derived from the average signal intensity values within each targeted cell adhesion molecule group. ICAM, intracellular adhesion molecule 1; VCAM, vascular cell adhesion molecule.
Using the TIC shape analysis classifications proposed by van Rijswijk et al., 27 the temporal behavior of ultrasound contrast targeted to P-selectin and VCAM-1 was categorized as a type 5 TIC, since a rapid slope in the wash-in phase was seen, followed by a sustained signal intensity in the wash-out phase. The TCEUS TIC generated from ICAM-1 targeted contrast was categorized as a type 2 curve, since a gradual increase in signal intensity was seen, with the absence of a rapid slope in the wash-in phase. Last, the isotype control–generated TCEUS TIC was categorized as type 1, in that no enhancement was demonstrated.
Discussion
Semiquantitative analysis of contrast-enhanced imaging by way of TIC shape analysis is an effective way to attain perfusion information of an area being investigated. 24 Currently, this is being used primarily in the field of MRI for the evaluation of tumor perfusion, 25 but more recent research in this area is focused on applying the principles of TIC shape analysis used in MRI to CEUS studies. This is being done in an attempt to determine its utility and provide a more objective analysis of CEUS imaging studies. The current research being presented aims to extend the principles of TIC shape analysis used in MRI even further by applying them to the alternative imaging strategy of TCEUS.
Many reasons drive the rationale for applying TIC shape analysis to TCEUS. Although TIC shape analysis is considered a semiquantitative measure, as it does not allow for pharmacokinetic modeling, it possesses many advantages. 24 TIC shape analysis is considered more reproducible among examinations. Because in this method a quantitative value is not being obtained, TIC shape analysis is less sensitive to variations. 24 In the field of ultrasound, quantitative analysis of contrast activity is difficult, as this typically requires the use of color and/or spectral Doppler. 56 However, the use of any Doppler mode is often contraindicated while performing a CEUS, as this raises the mechanical index and causes the unwanted destruction of the microbubbles. 56 Last, TICs can be generated with relatively low computational power, allowing them to be generated and analyzed almost immediately upon completion of imaging. 24
TCEUS remains a novel method of imaging and is still in its infancy. Multiple future studies are required to advance our knowledge in this form of molecular imaging, to establish guidelines for both image collection and analysis/interpretation of findings. The aforementioned advantages of TIC shape analysis and the findings we report here support further investigation of this technique. Future investigation into TIC shape analysis should extend beyond determining its role in TCEUS analysis and be examined in other contrast imaging modalities. This includes imaging modalities currently performing TIC shape analysis, such as MRI and CEUS, as further investigation will lead to the determination of optimal image analysis guidelines and parameters. Future TIC analysis studies should also examine its use in a wide variety of physiologic and pathologic conditions, as wide variations in TIC shapes and patterns exist depending on what part of the body is being imaged.26,57
Before such research is conducted, however, it is important that a standard nomenclature be used to describe TIC shape analysis. Multiple terms are used throughout the literature that refer to the shape of the TIC. In the field of MRI, Yankeelov and Gore 58 coined the term curve-ology for the examination of TICs, while other terms such as enhancement kinetics and morphologic analysis are also used.24–25 A similar problem exists among the existing CEUS literature, as the terms perfusion kinetics, contrast uptake curves, and time variance imaging are all used to connote the same method.55,59,60 In 1999, Tofts et al. 61 recognized this problem and, along with other leading experts, attempted to standardize nomenclature in the field, but complete agreement on a single set of terms was not attained between all manuscript authors. In a 2013 review of MRI TIC shape analysis, Lavini et al. 62 also recognized this lack of standardized nomenclature and suggested terms that may aid in the field moving toward a more homogeneous language. It is from this review that the terms describing TICs in this article are derived, terms including TIC shape analysis, wash-in, and wash-out phases. Our research team has adopted the term TIC shape analysis (as opposed to contrast uptake curves, perfusion kinetics, curve-ology, or enhancement kinetics) for visual assessment of TICs. In a similar way, our research team used the terms wash-in phase and wash-out phase (as opposed to initial enhancement phase and delayed enhancement phase) to describe the components of the TIC located before and after the peak signal intensity is reached.
Without a common nomenclature, further advancement in this area may be limited or prevented. It is imperative that TIC nomenclature be consistent within imaging modalities, as this facilitates a clear understanding of the imaging and analysis that is occurring. Inconsistent nomenclature can lead to the misunderstanding of the information being presented, thereby stifling new insights and interpretations of physiological processes. This is relevant in the research arena, as clear and full understanding of the methods and outcomes reported will lead to replication studies being conducted. Similarly, a clinical translation maintaining consistent terminology will lead to the reduction of errors, comparable results, and arriving at an accurate diagnosis.
For the same reasons, nomenclature in this area must also be consistent across imaging modalities. An inconsistency of terms exists not only within the modalities of MRI and CEUS but also between them. This must be reconciled in order for optimal advancements in this area to occur. Nomenclature discrepancies between imaging modalities are becoming especially troublesome with the advancement of imaging technologies and the adoption of fusion imaging. Fusion imaging incorporates data from multiple imaging modalities simultaneously to automatically form a composite image. 63 This method of imaging will prove very difficult if consistent terms are not used.
Also evident in the literature is the lack of consistency in TIC shape analysis classification methods. This inconsistency is likely more detrimental to the field than that of inconsistencies in the nomenclature, as it makes the comparison of studies very challenging. Kuhl 25 proposes a categorization consisting of three types of TIC shapes. These categories were derived from the findings of a study examining breast tumors, conducted by the same researchers who demonstrated relationships between the TIC categories, and the benign or malignant nature of the tumors was determined. 26 However, a classification system consisting of only three curve types may not be inclusive to all TIC shapes. For example, in this reported study, the TIC shape representing the temporal behavior of the isotype control exhibits no enhancement and therefore could not be categorized by Kuhl et al., 26 whereas it was classified as a type 1 curve using the van Rijswijk et al. 27 categorization method. Thus, the categorization based on five TIC shapes may be a more inclusive and rigorous method of curve shape classification, as more categories of curve shapes provide a deeper level of detail in their description. However, unlike Kuhl et al., relationships were not able to be obtained between TIC shape classifications and features classically derived from MRI, such as tumor size and homogeneity, in the van Rijswijk et al. study. Therefore, it is impossible to determine which method of TIC shape classification is most appropriate, for one was validated through gold-standard measures but was not inclusive, while the other was more inclusive but could not be validated.
Thus far, this article has used two methods of TIC shape classification (Kuhl and van Rijswijk) that were proposed in the literature to perform TCEUS TIC shape analysis. Using only these two, discrepancies in which the data were interpreted were produced. In the review mentioned previously, Lavini et al. 62 outlined 29 different methods of TIC shape classifications that were found in the literature, with the number of categories within them ranging from two to seven. 62 Furthermore, these studies were conducted by examining a variety of physiologic and pathologic processes, further adding to the difficulties of the interpretation and comparisons of these examinations. 62 In an attempt to vanquish the inconsistencies in TIC shape classifications, Lavini et al. propose a more universal two-letter nomenclature system, in which the first letter describes the behavior of the wash-in phase of the TIC, while the second letter represents the behavior of the wash-out phase, and where uppercase and lowercase letters represent a growing or decreasing pattern, respectively (S or s = slow, F or f = fast, P = plateau, O = absence of enhancement, X = other). 62 Applying this nomenclature system to the research being presented, the following TCEUS TIC classifications are P-selectin (FS), ICAM-1 (SS), VCAM-1 (FS), and isotype control (O).
To aid in a clinical diagnosis, it is important to determine associations between TIC shapes and the presence of various disease processes. As mentioned previously, CEUS, and even more so TCEUS shape analysis, is a novel diagnostic method that has not been extensively investigated. Therefore, it is difficult to predict the presence of disease processes using CEUS TICs alone. This is mainly due to the broad range of shapes that TICs can take and the various ways in which they can be interpreted depending on the anatomy and disease process being investigated. 62 However, general principles of perfusion can be applied to contrast-enhanced imaging findings, providing physiologic information to aid diagnosis.
Ultrasound contrast is present within the blood and restricted to the vascular compartment, and therefore its presence is associated with a tissue’s vascular permeability and perfusion. 56 Because many acute pathological processes are associated with elevated vascular perfusion, large levels of contrast concentration can be suggestive of disease. Increased vascular permeability and tissue perfusion can be represented on CEUS TICs by a short wash-in phase, a large wash-in phase peak magnitude, short reperfusion time, and/or a delayed wash-out phase.56,62,64 These TIC shape characteristics have been demonstrated as markers of disease in multiple disease processes, such as renal cell carcinoma, renal transplant infection and rejection, hepatocellular carcinoma, liver metastases, a variety of breast cancers, and rheumatoid arthritis.55,56,64–68
Examining the TCEUS TICs in the present research, it is clear that curves generated from the targeting of P-selectin and VCAM-1 demonstrate a much shorter wash-in phase and wash-in phase peak amplitude than those obtained from ICAM-1 and the isotype control. These findings are counterintuitive to the perfusion principles described, as all subjects underwent the same injury and therefore should have maintained similar vascular permeability and perfusion rates in the contused area of the spinal cord. This discrepancy can be explained by the nature of the contrast used, as it was targeted to specific CAMs, as opposed to free-floating contrast. Therefore, the TCEUS TICs presented represent the concentration of targeted contrast bound to a specific CAM on the endothelium of the vasculature, within the area of the contused spinal cord, as opposed to the overall perfusion of the contused area. To this end, we are not able to report the wash-out phase duration parameter, since all of the TCEUS TICs (with the exception of the isotype control) demonstrate delayed contrast wash-out. This finding is expected, however, for this is the purpose of targeted imaging: to perform enhanced sustained imaging.
Isotype control TICs were found to demonstrate little to no wash-in and very small magnitude. This finding was expected, as this contrast administration was not meant to bind to any CAMs and was to remain free floating in circulation. TICs generated from P-selectin and VCAM-1 targeted contrast administrations, which demonstrate a shorter and larger wash-in phase than ICAM-1, suggest more contrast binding to these CAMs than ICAM-1. The reason that more binding occurred while targeting these two CAMs can be explained in two ways; initially and intuitively, it could be assumed that P-selectin and VCAM-1 are more prevalent than ICAM-1 in the spinal cord after an acute moderate injury. Disputably, however, VCAM-1 and ICAM-1 are both largely expressed within the spinal cord upon induced trauma, and ICAM-1 may have greater expression than VCAM-1. 49 Thus, the difference in TIC shape for ICAM-1 suggests that technical issues in targeting ICAM-1 may exist. Perhaps the targeted CAMs are expressed at similar levels, but the targeted contrast may not be able to interact and tether to ICAM-1 as easily and/or efficiently as it can to P-selectin and VCAM-1. Indeed, in vitro studies found that targeted ultrasound contrast to P-selectin contained significantly more bound microbubbles than that of ICAM-1. 69 Furthermore, similar studies have also found the microbubble saturation of targeted P-selectin and VCAM-1 to be similar and much more than ICAM-1 compared with the literature.70,71 By comparing tissue expression of the CAM to the ultrasound measures collected here, we would be able to determine if differences are due to protein expression or to the binding ability of the microbubbles. Additional studies of the ability and fidelity of CAM targeting for imaging should be carried out in a variety of tissues to improve clinical utility. This again points to the novelty of this molecular imaging technique and reiterates the need for further research in this area.
Other limitations that are also important to note include the rate at which the targeted contrast agent was administered. Differences in injection rate can influence the wash-in phase of the TIC. Although care was taken to standardize the injection rate, the use of an auto-injector is needed to eliminate any variations in the rate of contrast administration. Also, changes in heart rate can influence TIC shapes. Although animal subject heart rates were closely maintained at 300 to 450 beats per minute during the TCEUS, rapid fluctuations could result in changes to systemic circulation patterns and subsequently affect the shape of the TIC. To minimize this risk, a high imaging frame rate was used, which provided a large number of data points within each TCEUS. Therefore, the likelihood of an observable change in TIC shape resulting from heart rate fluctuation was minimal. Finally, ROIs were placed around the area of the spinal cord being evaluated during the analysis process to compute pixel intensities. Although bony landmarks were identified and used to aid in the standardization of the ROI placement across subjects, potential for ROI variation still exists.
Conclusions
The TIC shape classification system represents a promising method of interpreting the temporal behavior of a contrast agent. TIC shape analysis has the potential to be used across multiple imaging modalities, but terminology used to describe TIC shape classifications must be ubiquitous. Standardization of practice will result in easier comparisons between studies, facilitate clarity and understanding of TIC shapes, and make the completion of a meta-analysis a possiblity. 62 Standardized measures of nomenclature and analysis must be implemented within and across imaging modalities to allow for optimal advancements in this area.
In the reported study examining TCEUS in the detection of neural inflammation, it was found that TCEUS TIC was able to visually and semiquantitatively describe the temporal behavior of targeted US contrast in each CAM group, allowing for comparison among them. TIC shape analysis visually demonstrated that ultrasound contrast targeted to P-selectin and VCAM-1 behaved similarly. Interestingly, the temporal behavior of ICAM-1 demonstrated a diminished and different shape of curve compared with the other targeted contrast types, although this finding is consistent with some existing studies. Last, the isotype control demonstrated no enhancement based on TIC shape analysis, as would be expected since no tethering of contrast agent occurred. TCEUS TIC shape analysis using the three methods of classification presented in this article, for each of the contrast injection conditions, is outlined in Table 1.
TCEUS TIC Shape Classifications Using Different Proposed Methods of Categorization.
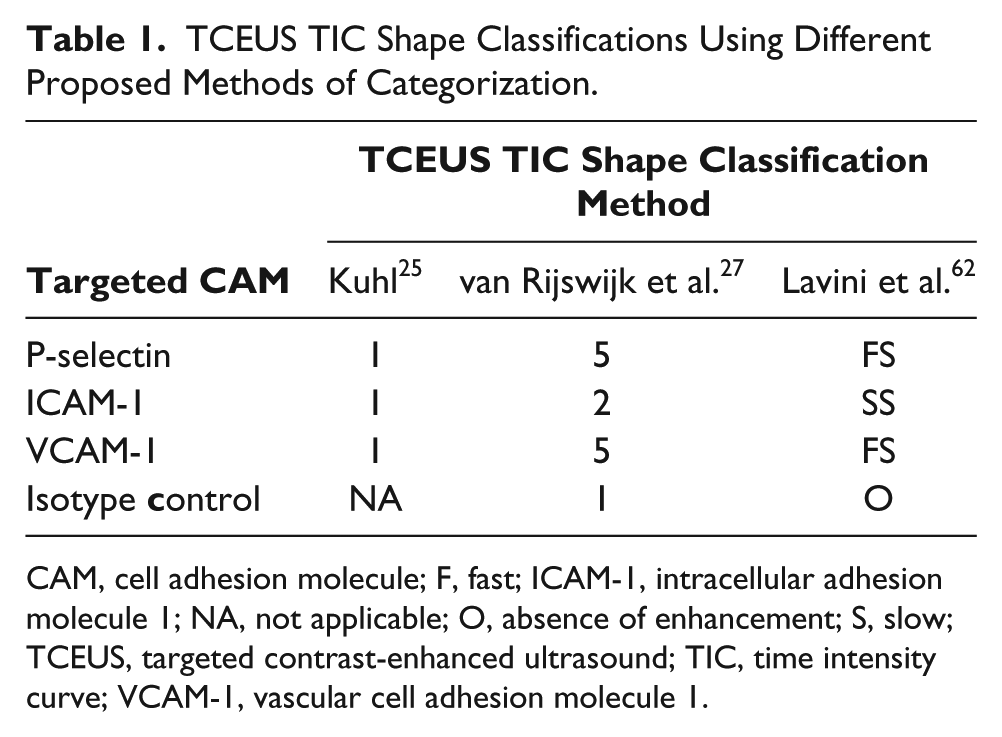
CAM, cell adhesion molecule; F, fast; ICAM-1, intracellular adhesion molecule 1; NA, not applicable; O, absence of enhancement; S, slow; TCEUS, targeted contrast-enhanced ultrasound; TIC, time intensity curve; VCAM-1, vascular cell adhesion molecule 1.
These findings, although preclinical, demonstrate early evidence regarding the use of TIC shape classification analysis in TCEUS imaging of neural inflammation. To build on this evidence, larger and more robust studies must be conducted in an attempt to move this research from a preclinical to a clinical setting.
Footnotes
Acknowledgements
We thank the ASRT Educational Foundation for funding this phase of the project. We are also indebted to Dr. Joshua Rychak for his advice and support.
Declaration of Conflicting Interests
The authors declared no potential conflicts of interest with respect to the research, authorship, and/or publication of this article.
Funding
This project was funded in part by the ASRT Educational Foundation Grant S15_RG_003.