
Abstract
Sonographers have been the focus of documenting work-related musculoskeletal disorders. The literature has focused on self-reported survey data, which point to more than 80% of sonographers performing their jobs in pain. However, few intervention studies have been designed to address these risks. A pre-post pre-experimental design was employed, and longitudinal data were collected from a cohort of first-year sonography students (n = 12). Three groups of participants (n = 4 each) were exposed to a combination of ergonomics education and mind-body techniques. Analysis of survey data did not demonstrate statistically significant changes across any of the groups. However, participants who specifically practiced mindful sonography yoga and cueing indicated an improvement in mental health, stress level, and right upper extremity pain. Posture was improved with biofeedback training, while participants who used both biofeedback training and mindful sonography yoga and cueing demonstrated even greater improvement in posture.
Introduction
The activities that are required to provide patient care have long been acknowledged as a major contributor to the high incidence of work-related musculoskeletal disorders (WRMSD) among health care workers.1,2 This has been exacerbated by the reliance on technology within medicine, and one example is the use of ultrasound transducers for making medical diagnoses. The increase in use of sonographic exams for screening, diagnostic, and therapeutic purposes has led to an increased demand in highly trained and skilled sonographers. While continued growth in the field shows promise for vast opportunities and future development of those in the field, it also brings increased physical expectations of sonographers.
The demand for sonographic examinations influences the ergonomic interface between sonographer and the equipment to quickly render a diagnosis. At this micro-ergonomic level, a sonographer may often manipulate their body in ways that result in statically held or repeated dynamic loading of the muscles of the neck, shoulder, arm, and back. Additionally, they may exhibit repeated fine motor movements of the shoulder, forearm, wrist, hand, and fingers throughout an exam. 3
The effects of the continued physical strain that occurs among sonographers has been linked to an increased risk of WRMSD. Concern for the issue gained much attention in 1985, when Craig 4 published a series of case reports relating WRMSD to working with patients and equipment specific to the practice of sonography. Since that time, numerous studies have sampled groups of sonographers to determine the prevalence of WRMSD symptoms and attempted to identify risk factors for injury. Further descriptive data were gathered regarding potential macro-ergonomic contributing factors, such as age, gender, workplace culture, mental health status, and workload.
The existing literature on WRMSD prevalence and ergonomic issues among sonographers varies greatly in sample size, geographic location, and population demographics. Much of these data were gathered through the use of self-reported surveys, and results consistently demonstrate that the majority of sonographers are performing their jobs in pain.5–13 In fact, a recent cross-sectional survey performed by Evans et al. 14 of 2963 registered sonographers found that 90.4% were scanning in pain. There were also several higher level (macro) ergonomic factors identified that have likely exacerbated WRMSD, such as increased patient workload, inability to take breaks, and low job satisfaction.
Several studies have evaluated specific sonographer behaviors by quantitatively assessing their clinical work.15–19 A number of instruments were used to quantify ergonomic variables, such as muscle activity, upper extremity joint angles, push force, and posture during scanning. The data affirm survey data about WRMSD risk factors for sonographers, such as excessive force and repetitive awkward wrist and hand angles while performing certain sonographic exams. 19 However, when reviewing the overall literature of this nature, the respondent sample sizes were rather small, and most sonographic procedures were performed at one point in time.
A number of studies have introduced a single or set of ergonomic interventions for WRMSD prevention to a cohort of sonographers.20–25 While many of these studies were cross-sectional, Euler and Meadows 26 did conduct an analysis of ergonomic interventions at one medical facility and over time found that procedure volume increased while incidence of WRMSD decreased. However, the study did not report any sample demographics, such as number of sonographers employed, and did not document any psychosocial or environmental data that were reported by the sonographers involved in the study. This makes it impossible to determine the significance of the decrease in reported WRMSD or if the interventions affected sonographer level of pain, stress, or perception of workplace changes.
There is an extensive amount of evidence that sonographers are at high risk for injury compared to other health care professionals.4–26 However, much of this evidence is revealed through the use of self-reported survey data. While certain case control and cohort studies have reinforced sonographers’ WRMSD risk by assessing current workplace methods and in some cases introduced ergonomic interventions,15–26 their existence is limited. Particularly, a gap exists in the longitudinal investigation of interventions that address both micro-ergonomic concerns between the sonographer and workplace equipment as well as macro-ergonomic concerns between the sonographer and the work system.
To gain higher-level information on ergonomic solutions that have the potential to positively influence the prevention of WRMSDs among sonographers, the present study was designed to pilot a series of mind-body techniques and determine their utility in addressing both micro- and macro-ergonomic concerns. The particular mind-body techniques that were proposed include: biofeedback and mindful sonography yoga and cueing. The research question that drove this study was: What combination of mind-body techniques, taught to a cohort of novice sonography students, would provide a reduction in the risk of WRMSDs?
Methods
This study investigated the exploratory impact of providing a series of mind-body techniques to a cohort of sonography students throughout their first semester of coursework. Because they had virtually no experience in the use of clinical sonography, it was assumed that they would lack a bias toward ergonomic solutions, habitual sonographic scanning positions, and WRMSD. Also, they had no exposure to scanning postures that would trigger acute or chronic injuries to the neck, shoulder, and upper extremity. By teaching a series of mind-body techniques to a cohort of sonography students from the onset of their training and following them over the first semester of their professional coursework, we hypothesized that this could influence their risk of injury. This has the potential to pinpoint which of the mind-body techniques would be best suited for curricular implementation.
Longitudinal data were collected from a cohort of first-year students at a university’s sonography program. A pre-post experimental design was utilized for this study. To quantitatively measure perceived pain, stress, and physical and mental health, three survey instruments were administered to participants both pre- and post-intervention; the Short Form health survey (SF-12v2), 27 Perceived Stress Scale (PSS), 28 and a visual analog scale (VAS) for upper extremity pain. 29 All students who volunteered to participate in the study were exposed to two types of interventions: ergonomics education and mind-body techniques. The two mind-body techniques used were biofeedback and mindful sonography yoga and cueing. As ergonomics education is a curriculum requirement for accredited programs, each of the treatment groups received the program’s didactic instruction as well as exposure to one or more mind-body techniques. Participants were randomly assigned to a group within this study, which eliminated bias due to age, gender, or ethnicity. All students in the first-year sonography class consented to be volunteer participants, yielding a total sample size of n = 12 (see Table 1).
Participant Demographics and Treatment Level.
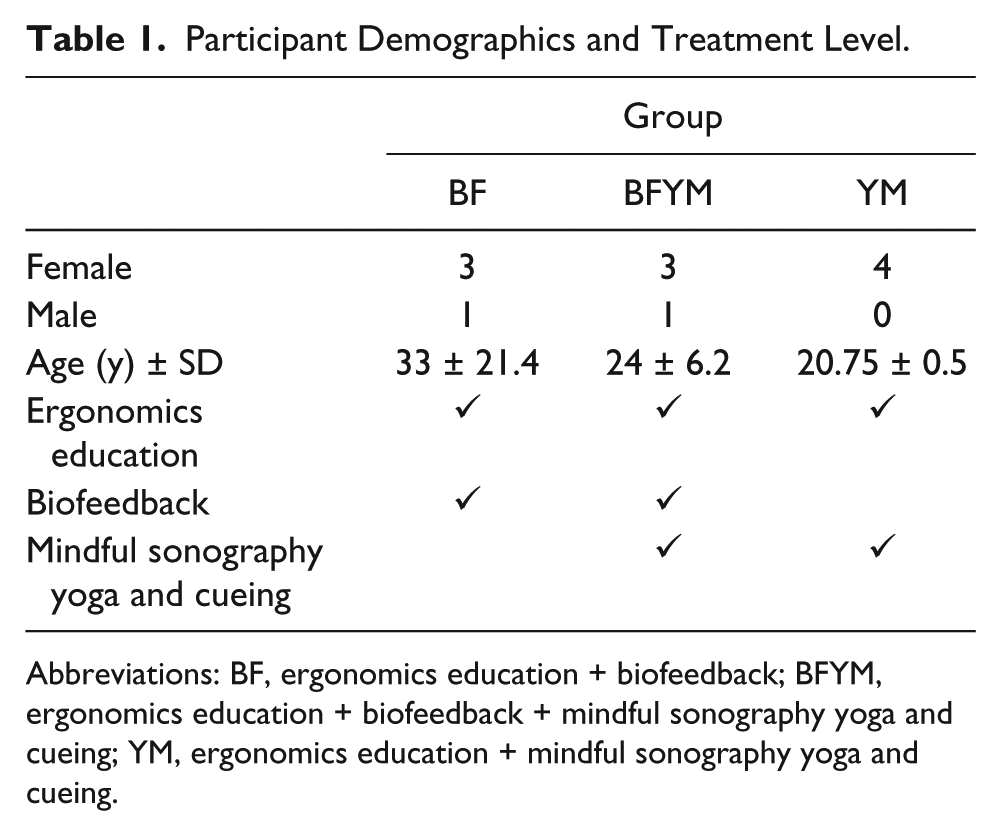
Abbreviations: BF, ergonomics education + biofeedback; BFYM, ergonomics education + biofeedback + mindful sonography yoga and cueing; YM, ergonomics education + mindful sonography yoga and cueing.
The treatment that each group received was the independent variable in this study. There were three total groups (n = 4 each) that were each exposed to one or more mind-body techniques plus didactic ergonomics education: (1) ergonomics education + biofeedback (BF), (2) ergonomics education + biofeedback + mindful sonography yoga and cueing (BFYM), or (3) ergonomics education + mindful sonography yoga and cueing (YM).
Pretesting survey data were collected at the start of the first week of sonography coursework, and interventions were given at six intervals, every 2 weeks, throughout the 12-week semester. Posttesting survey data were collected upon completion of the first semester. Participants who received the biofeedback intervention were recorded on video during their six scanning sessions. These videos were used to obtain retrospective measures of participant posture and muscle activity, as described in the following. The study was peer-reviewed and approved by the university’s biomedical Institutional Review Board (Protocol No. 2013H0105).
Interventions
Ergonomics education
Ergonomics education was delivered to participants in the form of two didactic lectures at the beginning and middle of the first semester of the sonography program to all three treatment groups (BF, BFYM, YM). The two instructors who provided these lectures were credentialed sonographers with graduate-level preparation in the study of ergonomic solutions for the workplace. The content of these lectures was co-created and also edited by an occupational therapist who specializes in musculoskeletal disorders.
Biofeedback
One of the mind-body techniques was biofeedback. One of the most common forms of biofeedback, surface electromyography, was employed in the study. While scanning, muscle activity was emphasized using the Ergometer by Sound Ergonomics, LLC (see Figure 1). The Ergometer is a specialized portable system that uses a set of surface electromyographic sensors and provides audible tones as biofeedback to the individual who is hooked up to the unit. Recordings were also done of the scanning sessions using iPads (Apple, Inc.).
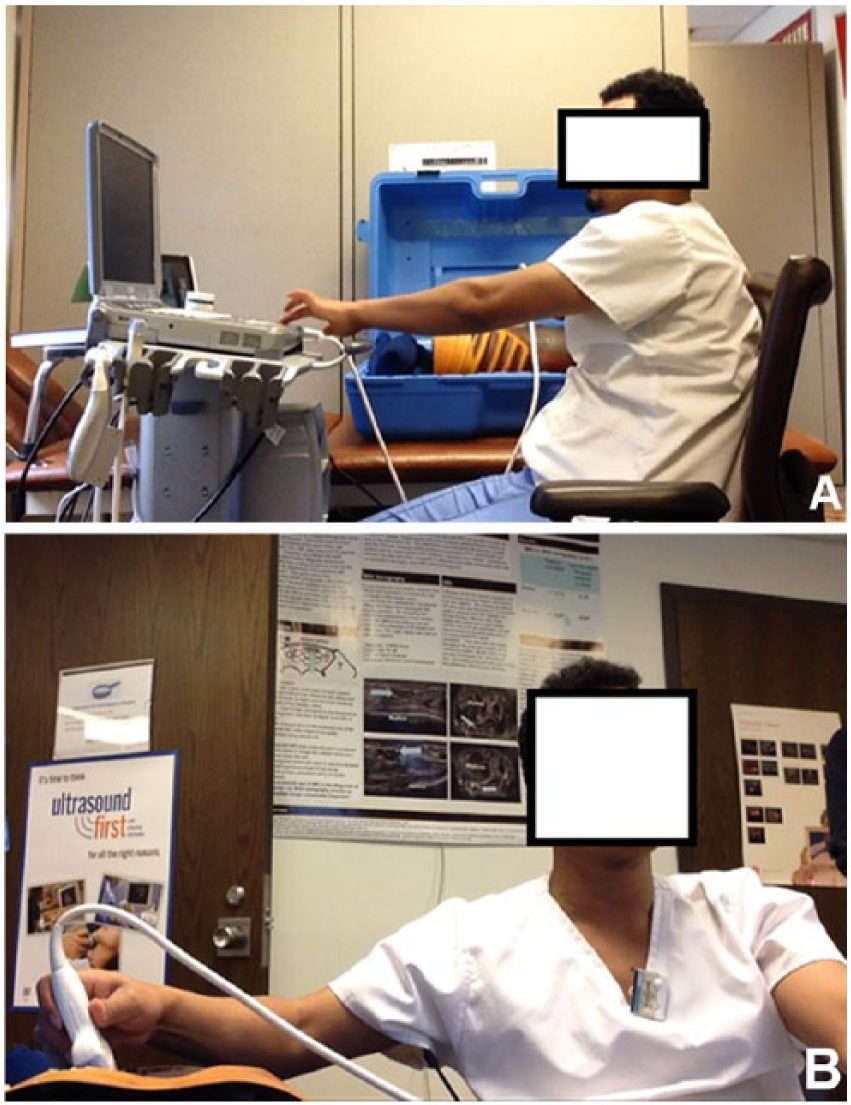
(A) Sonography student hooked to the Ergometer and completing a simulated clinical exam: lateral view of the student. (B) Sonography student hooked to the Ergometer and completing a simulated clinical exam: frontal view of the student.
Participants in the BF and BFYM group received the biofeedback treatment during a series of six scanning sessions at the time of their normally scheduled simulation labs. At the beginning of each session, participants were read a set of instructions, informing them to use the sounds from the Ergometer to adjust scanning position. They were then asked to scan with the ultrasound transducer in their right hand and capture a longitudinal image of the left kidney on a teaching phantom. Handedness of the student was not considered, and as it is standard practice to perform renal ultrasound exams from the patient’s right side, the right hand was used by each participant at each session.
Video recording of the sessions was started as the participant began scanning and lasted until the participant froze the image and raised their hand. This time ranged from 35 seconds to 3 minutes, 53 seconds across all scanning sessions. The participants were not given any further instructions regarding biofeedback, posture, or image quality after the recording began. The goal was that over time, they would use the biofeedback to learn to control the amount of muscle tension and adjust their posture.
Mindful sonography yoga and cueing
Mindfulness-based stress reduction (MBSR) is a structured, participatory educational program that utilizes mindfulness meditation to help manage a variety of adverse health issues. 30 Participation in a formal MBSR program includes an individual commitment to meditation and yoga stretching. Mindfulness in motion (MIM) is a mindfulness-based intervention (MBI) that was developed to serve as a modified, less time-intensive version of MBSR. 31
Participants who received the mindful sonography yoga and cueing intervention were exposed to a version of MIM specifically designed for sonographers by one of the researchers. The researcher and a sonographer graduate student discussed the physical and mental challenges associated with working in the sonography workplace. This intervention was customized so that the presentation and exercise series would address these challenges.
These mindful yoga sessions provided instruction to the participants on both cognitive habits as well as yoga to encourage heightened awareness of the sonographer to their work routine body mechanics. The stretching exercises are meant to improve core strength, flexibility, balance, and coordination. Second, training on progressive muscle relaxation is included to reduce tension and relieve stress in order to enhance stretching. These techniques have been shown to promote psychological benefits such as relaxation, improved concentration, and elevated mood in other populations of health care professionals. 32
Finally, cueing is a mind-body technique that provided participants with mental exercises meant to develop automatic responses associated with sonographer work tasks. These exercises encourage both work satisfaction for the sonographer as well as providing patient-centered care. For example, sonographers can think about how they will individually connect with the patient as they physically reach for the exam door or curtain. Other examples include mental cues to check physical posture when touching a patient’s identification band and developing a habit to actively relax muscles by taking in a deep breath and exhaling when first touching the sonography equipment or computer workstation.
Delivery of mindful sonography yoga and cueing instruction occurred in six sessions for the YM and BFYM groups. The sessions were given prior to the participant’s scheduled simulation labs, when the biofeedback treatment was given. These sessions were manualized as well as captured on video for further review and were 12 to 15 minutes in length.
Dependent Variables and Instruments of Measure
The dependent variables in the study were the participants’ self-reported survey scores, Rapid Upper Limb Assessment (RULA) postural scores, and muscle activities measures. Self-reported health and pain are considered highly reliable measures of overall health and can be taken at various times and compared within and across subjects. 27 The SF-12v2 survey was used to assess the change in perceived mental and physical health, and the PSS measured the change in perception of stress throughout the time of the study.27,28 Additionally, participants were asked to rate their pain in each upper extremity pre- and post-intervention using a VAS. 29 Each of the three treatment groups completed this set of surveys pre- and post-intervention.
All of the study participants completed the SF-12v2 survey, PSS, and VAS for upper extremity pain as pretest measures at the beginning of their first semester of the sonography program before their clinical training experience began. These instruments were administered again, post-intervention, at the end of the first semester of the curriculum and their sonographic training.
The postures of participants receiving the biofeedback treatment were evaluated while scanning using the RULA tool. The RULA is a postural targeting method developed to evaluate the exposure of employees to work-related risk factors associated with upper extremity musculoskeletal (MSK) disorders. 33 A single worksheet was used to enter a set of scores for the arm and wrist as well as a set of scores for the neck and trunk. Overall scores for each body area are used to generate a single, overall RULA score that represents the level of musculoskeletal risk for a particular posture. This score is a numerical value 1 to 7, with 1 indicating acceptable posture and 7 indicating the need to investigate and implement change of the assessed posture.
Participants in the BF and BFYM groups were knowingly captured on video for each simulation lab that included the phantom scanning session with biofeedback. This was done by using two iPads, which provided biplane (frontal and lateral) video files and allowed for subjective identification of the exact time that the participant’s posture and position elicited the loudest tone while wearing the Ergometer electrodes.
Validity and Reliability
Corresponding grading of the video of scanning posture was completed retrospectively with the RULA grading sheet by the graduate researcher, who was blinded to biofeedback group assignment and intervention session date. The graduate researcher was closely supervised by faculty to ensure consistency with grading the video clips with the RULA tool. The principal investigator (PI), who has experience using the RULA, graded video clips independently, and then the same clips were graded by the graduate researcher. Any discrepancies in grading were identified by an undergraduate student researcher, and those videos were regraded by both the PI and the graduate researcher. These steps helped to provide consistency and reproducibility for the RULA scoring.
The sounds from the Ergometer were also recorded on the video files from each biofeedback session and loaded into Audacity 2.0 software. The software is a free, open source, cross-platform audio editor software program that was used to display the sounds from the Ergometer as a waveform on a graph (X, time-seconds and Y, sound pressure −1 to +1). The waveforms for each participant at each session were evaluated by the graduate researcher and the PI. Features of the software were used to measure and record the amplitude (dB) as well as frequency (Hz) of the sound from the Ergometer. The frequency of beeps from the Ergometer at the time that the RULA score was generated was recorded for each participant at each biofeedback session.
Data Analysis and Statistics
Mean scores for the PSS and VAS for pain were determined for each group pre- and postintervention. Change scores over the course of the study were also determined for the VAS and PSS by individual participant, and the mean change scores for each group were calculated. Additionally, the mean Physical Composite Score (PCS), Mental Composite Score (MCS), and Bodily Pain domain scores for the SF-12v2 were determined for each group pre- and postintervention as well as change scores for each individual and across the groups for these three scores. All scoring for the SF-12v2 was completed using software purchased from OPTUM.
The statistical significance of the data was set at P level <.05. To determine the cohesive strength of the interventional measurement tools, Spearman correlation coefficients were determined for the individual RULA scores versus the beep frequency, pitch frequency, and amplitude of the biofeedback sounds on Audacity 2.0. To determine whether significant changes existed between the three groups over the study period, an independent samples Kruskal-Wallis test was performed using the change scores from the SF-12v2 PCS, MCS, bodily pain score, PSS, and VAS for right and left upper extremity pain.
Results
Demographic information describes a student cohort (n = 12) with a mean age of 25.9 at the time of baseline survey administration. The participants were predominately female (n = 10), with an average female age of 23.4. The two male participants were also the oldest participants, with ages 65 and 33. The 12 study participants were randomly assigned to one of the three treatment groups, each with a size of n = 4. The study concluded with an attrition rate of 0%, and attendance at each of the intervention sessions for each group was 100%.
Self-Reported Survey Data
The SF-12v2 scores are reported numerically as a percentile value from 0 to 100, with 0 being the lowest level of reported health and 100 being the highest level of reported health. The software algorithm analyzes survey responses to yield scores for eight separate health domains, which are used to compute two composite scores: Physical Composite Score and Mental Composite Score. Questions included on the survey are multiple choice, and participants are asked to subjectively choose the most appropriate answer. No objective data regarding the participant’s physical health, such as BMI, height, or weight, is considered in the scores.
The mean pretreatment PCS for our sample was 57.7 for the BF group, 56.9 for the BFYM group, and 57.9 for the YM group, and the mean posttreatment PCS was 57.1, 55.4, and 50.7, respectively. The reported 2006 mean U.S. population norm on the PCS for females age 20 to 29 was 53.0 (males = 53.8) with a 95% confidence interval of ±0.3. 34 The only study group that did not maintain a slightly higher than average age- and gender-matched PCS score both pre- and posttreatment was the YM group. This group reported a mean decreased PCS of 7.2 over the treatment period, from 57.9 to 50.7. The participants in the YM group were all female, with a mean age of 21. One participant in this group reported a pre- and posttreatment PCS of 60.38 and 42.35, respectively, which is a decline in reported physical health of 18.03 and was the most changed PCS across the sample. In the absence of this participant’s PCS scores, the YM group would have had a mean decreased PCS score of 3.6, with a mean pretreatment PCS of 57.11 and posttreatment PCS of 53.55 (see Figure 2).
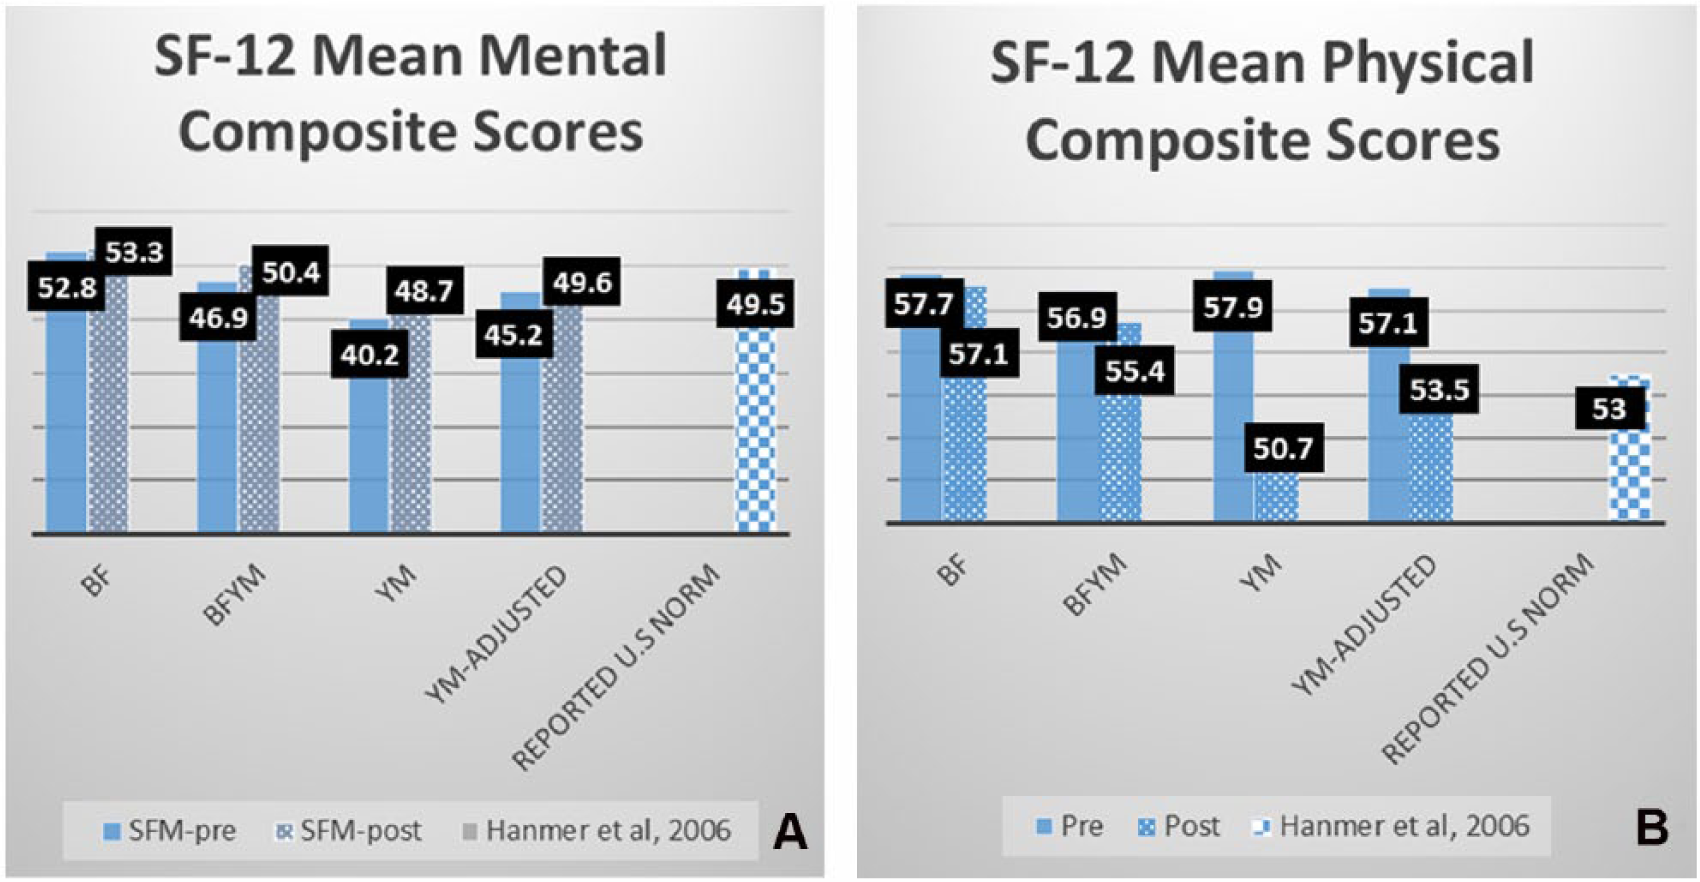
Group mean Short Form health survey responses. (A) Mental Composite Score versus reported U.S. norm for females age 20 to 29. (B) Physical Composite Score versus reported U.S. norm for females aged 20 to 29.
The group with the lowest level of reported mental health on the SF-12 pretreatment was the YM group, with a mean MCS of 40.2. However, they did demonstrate an average increased MCS of 8.5 over the treatment period (post = 48.7), which is slightly lower than the reported U.S. population norm of 49.5 for females aged 20 to 29. 34 One participant from this group did have a pretreatment MCS of 25.55, which is more than 2 SD (10) below the calibrated mean of 50. The same participant demonstrated an increase in reported mental health of 21.32 over the treatment period. In the absence of this participant’s scores, the YM group would have a mean increased MCS score of 4.2, with a pretreatment mean MCS of 45.2 and a posttreatment mean MCS of 49.6 (see Figure 2).
The BF and BFYM groups also showed an increase on the MCS over the treatment period, with BF going from a mean of 52.8 to 53.3 and BFYM from 46.9 to 50.4. The BF group had the highest mean MCS across the study both pre- and posttreatment.
The possible range of scores for the PSS is 0 (no stress) to 40 (most stress). The lowest reported level of perceived stress both pre- and posttreatment was reported by the BF group, with average scores of 10.7 and 10.3, respectively. These scores are lower than reported U.S. population norms for ages 25 to 34 (mean = 17.46, SD = 7.31) matched to our sample’s mean age of 25.9. 35 The BF group contained one participant who was a 65-year-old male. This participant demonstrated PSS scores of 5 pretreatment and 4 posttreatment, which were both lower than any other participant in all three groups. The mean reported U.S. norm values on the PSS for age 65 and older is 11.09 (SD = 6.77). 35 In the absence of this participant’s scores, the BF group’s mean PSS scores would be 12.67 pretreatment and 12.3 posttreatment, with a mean decrease in stress of 0.33 over the treatment period.
The BFYM and YM groups both showed a slight decrease in level of perceived stress over the study period. The BFYM scored lower than the age-matched U.S. population norm (17.46, SD = 7.31 for age 25–34) 35 with a pretreatment mean PSS score of 16 and a posttreatment mean PSS score of 15.5. However, only one participant in the BFYM reported a decrease in stress over the treatment period, with a pretreatment PSS score of 17 and a posttreatment score of 10. This participant was a 33-year-old male. Thus, his PSS changed from above the reported sex-matched U.S. population norm (mean = 15.52, SD = 7.44) 35 to below the reported sex-matched U.S. population norm. In the absence of this participant’s scores, the BFYM group’s mean PSS scores would be 15.7 pretreatment and 17.3 posttreatment, with a mean increase in stress of 1.67 over the treatment period (see Figure 3).
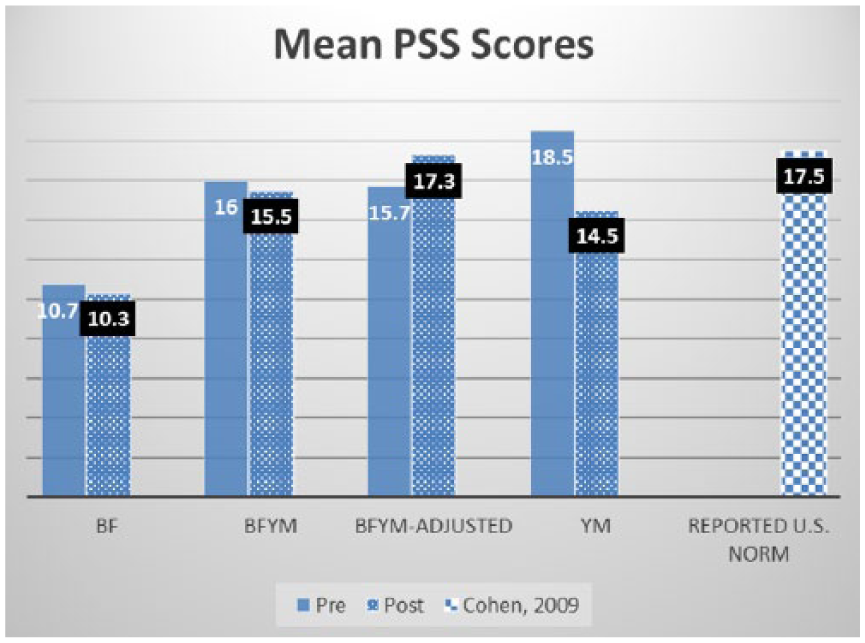
Group mean Perceived Stress Scale scores versus reported U.S. norm for adults age 25 to 34.
The group with the highest level of psychological stress pretreatment was the YM group, with a mean score of 18.5, which is slightly higher than the reported U.S. norm for age 25 to 34 of 17.46. 35 The YM group also demonstrated the most change in psychological stress over the treatment period, with a mean decrease of 4 to 14.5 posttreatment. In fact, three of the four participants in this group demonstrated a mean pretreatment score above the reported U.S. age-matched norm, with PSS scores of 24, 17, and 26, respectively. Of these three participants, only one had an average score above the U.S. population after the study period, with a posttreatment score of 21. Additionally, all of the participants in the YM showed a decrease in level of psychological stress over the treatment period.
The VAS is an instrument that is used to quantify a characteristic or attitude. 29 In the present cohort, it was used to measure the participant’s perceived level of upper extremity pain pre– and post–ergonomics education and mind-body technique intervention. Participants were asked to mark their level of pain at the appropriate point of a continuous rating scale labeled with whole integers 0 through 10, each spaced 1 cm apart. Anchors were provided on the scale at 2 cm intervals to assist the participants in quantification of pain level, with written descriptions above the anchors as follows: 0 = none, 2 = annoying, 4 = uncomfortable, 6 = dreadful, 8 = horrible, and 10 = agonizing. Two responses were requested, one for the right upper extremity and one for the left upper extremity.
The BF group was the only group to report an average increased level of pain over the course of the treatment period (see Table 2). Their mean pretreatment VAS scores were 0 for the right side and 0 for the left side, and their mean posttreatment VAS scores were 0.5 for the right side and 0.5 for the left side. The BFYM group showed a mean decrease in level of pain in both extremities, with a pretreatment mean of 1 on the right and 0.25 on the left and a posttreatment mean of 0.5 on the right and 0.25 on the left. The BFYM did have one participant who indicated a pain level of 3 in the right upper extremity pretreatment, which was reduced to 0 over the course of the study.
Group Mean VAS Across the Treatment Period.
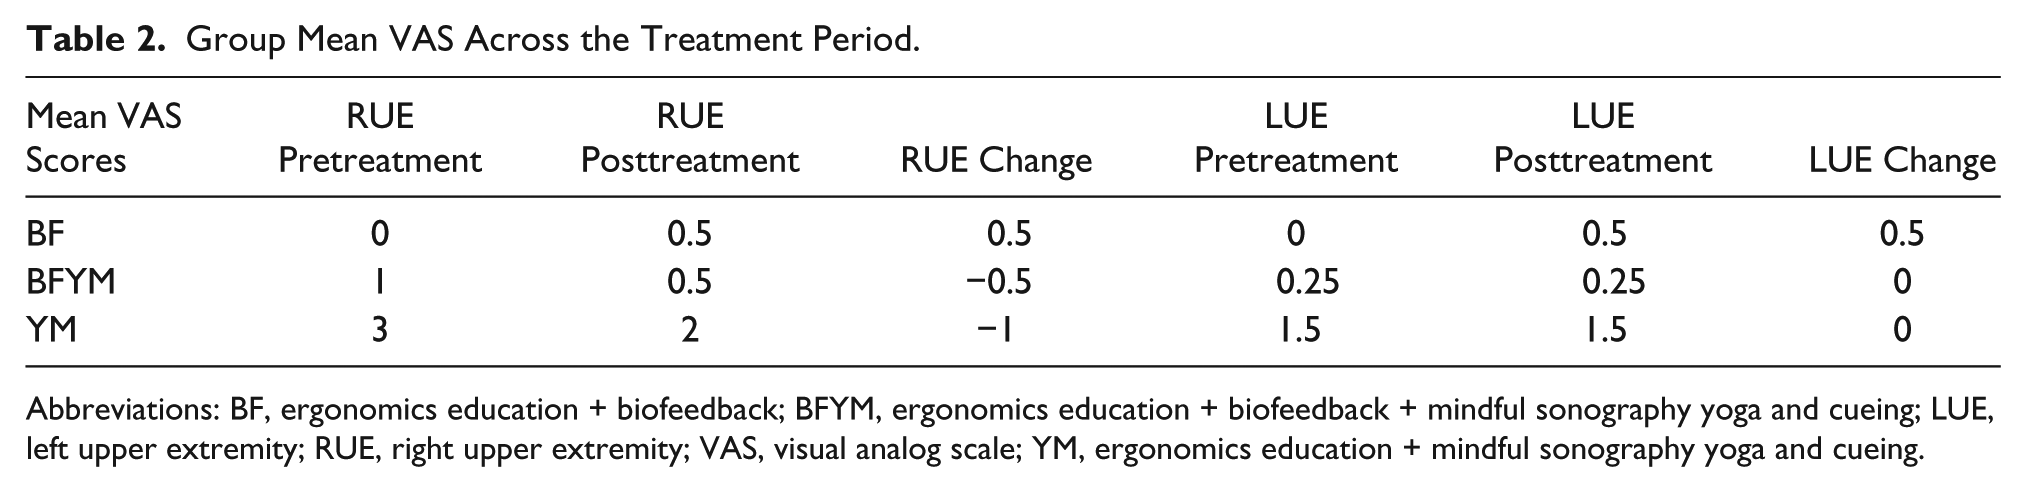
Abbreviations: BF, ergonomics education + biofeedback; BFYM, ergonomics education + biofeedback + mindful sonography yoga and cueing; LUE, left upper extremity; RUE, right upper extremity; VAS, visual analog scale; YM, ergonomics education + mindful sonography yoga and cueing.
The YM demonstrated the highest mean pain scores overall, with pretreatment averages of right = 3 and left = 1.5 and posttreatment averages of right = 2 and left = 1.5. There was one participant in the YM group who indicated a pain level of 4 in both extremities pretreatment. However, this participant’s right upper extremity pain decreased to 1 posttreatment, while her left upper extremity remained the same. The YM group also included a participant who indicated a pain level of 5 in her right upper extremity pretreatment, which was the highest pain score reported by participants in all groups both pre- and posttreatment. Her posttreatment score for the right side was reported as 3.
RULA
The mean RULA scores (out of 7) for the BF group across the six biofeedback treatment sessions were 5.3, 5.5, 5.3, 6.3, 4.8, and 4.8. The mean RULA scores for the BFYM group across the six biofeedback treatment sessions were 6.5, 5.3, 4.5, 5.8, 4.8, and 5.3 (see Figure 4). Both groups demonstrated a decrease in average RULA score over the course of the study, indicating an improvement in posture during the scanning sessions. The BFYM group demonstrated the higher of these decreased mean scores, with an average RULA total of 6.5 at session 1 and 5.25 at session 6, an overall 1.25 improvement.
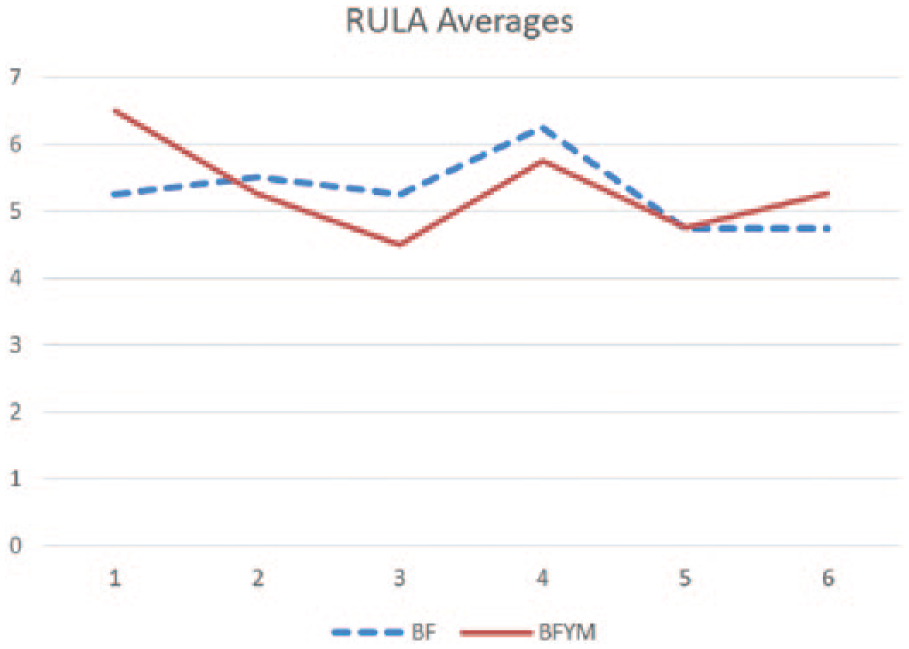
Mean Rapid Upper Limb Assessment scores of participants across the treatment periods.
Muscle Activity
The mean values for muscle activity using the sounds from the Ergometer for the BF group all demonstrated slight changes from biofeedback session 1 to session 6. The average amplitude increased from −32.0 dB to −31.6 dB (maximum value = 0 dB) from biofeedback session 1 to biofeedback session 6. The mean pitch frequency for the BF group decreased from 4320 Hz to 4314 Hz, and the mean beep frequency decreased from 17 to 16.25 beeps over the course of the study.
The mean values for muscle activity for the BFYM group all slightly increased. The average amplitude for the BFYM group increased from −50.8 to −32.9 (maximum value = 0 dB) from session 1 to session 6. The mean pitch frequency for the BFYM group increased from 2813 Hz to 4543 Hz from session 1 to session 6. The mean beep frequency for the BFYM group increased from 5.75 to 16 (10.25 beeps) from session 1 to session 6.
Spearman’s Correlation
To determine the strength of association between the RULA scoring and the Ergometer, a Spearman’s correlation was completed for the RULA total score and the corresponding measures of muscle activity (see Table 3). None of these measures were found to be highly correlated, with an r value of 0.06 for the RULA versus beep frequency (P = .70), −0.08 for the RULA versus amplitude (P = .61), and 0.07 for the RULA versus pitch frequency (P = .68).
Spearman’s Correlation of Muscle Activity Measures.
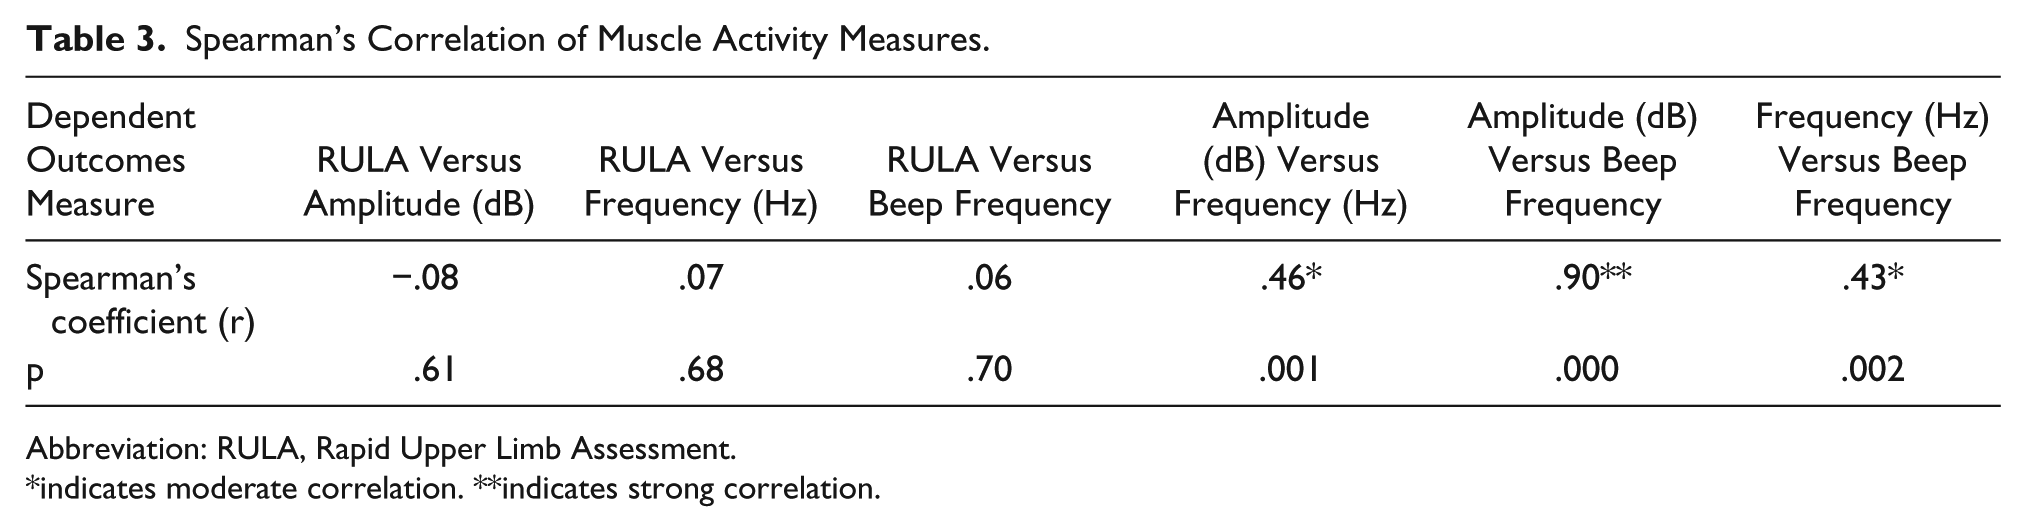
Abbreviation: RULA, Rapid Upper Limb Assessment.
*indicates moderate correlation. **indicates strong correlation.
Additional Spearman correlation coefficients were determined for the strength of association between the individual measures of the Ergometer themselves. Amplitude versus frequency as well as frequency versus beep frequency were shown to be moderately correlated, with r values of 0.46 (P = .001) and 0.43 (P = .002), respectively. The most highly correlated of these relationships was between amplitude and beep frequency, with r = 0.9 (P = .000).
Study Group Comparisons
To determine whether changes in survey scores between the three treatment groups over the study period were meaningful, a Kruskal-Wallis test was performed using the pretreatment and change scores of each group for the SF-12v2 PCS, MCS, and Bodily Pain (BP) domains; PSS; and VAS for right and left upper extremity pain. This test is a nonparametric one-way analysis of variance (ANOVA) test of ranked independent samples used to determine whether two or more samples originate from the same distribution. The significance level was set at P < .05. Results revealed that pretreatment scores were distributed the same across all three groups on each of the survey tools except for the VAS for right upper extremity pain. Mean change scores from pre- to posttreatment across the three groups did not show statistical significance for any of the survey tools (see Table 4).
Comparisons Between Treatment Groups: Statistical Significance of Differences Between Groups on Pretreatment and Survey Change Scores.
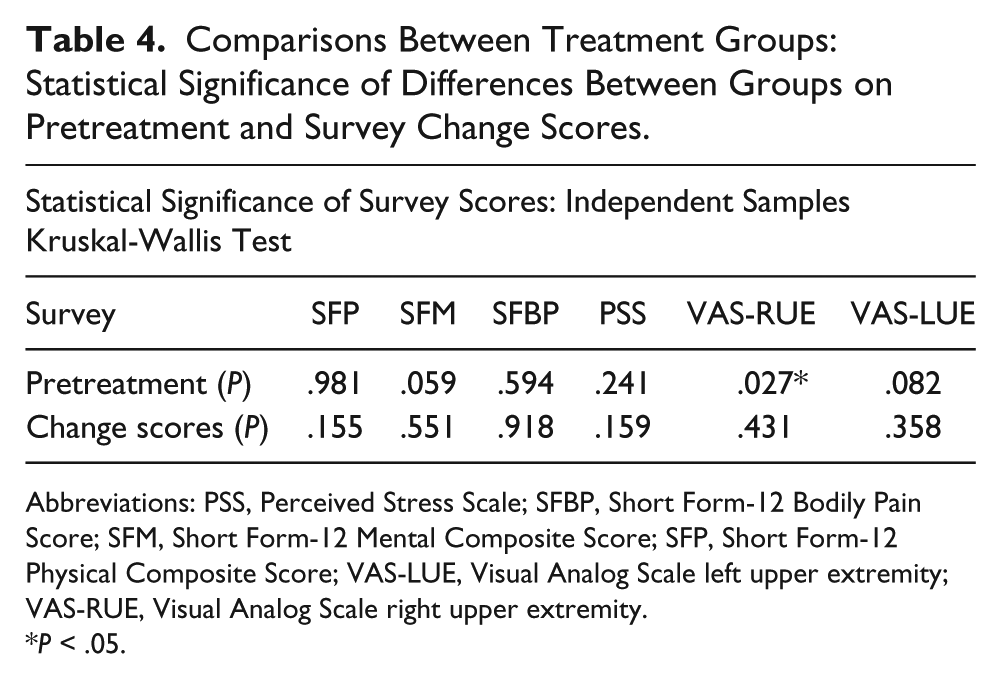
Abbreviations: PSS, Perceived Stress Scale; SFBP, Short Form-12 Bodily Pain Score; SFM, Short Form-12 Mental Composite Score; SFP, Short Form-12 Physical Composite Score; VAS-LUE, Visual Analog Scale left upper extremity; VAS-RUE, Visual Analog Scale right upper extremity.
P < .05.
Discussion
As previously mentioned, an independent sample Kruskal-Wallis test of statistical significance (P < .05) did not show statistical significance for mean change scores from pre- to posttreatment across any of the three groups for any of the survey tools. However, the combination of data from this set of scales provides measures that demonstrate both micro- as well as macro-ergonomic issues from the participant’s point of view. Therefore, for this pilot data to offer more insight for the direction of future research on the implementation of mind-body techniques in educational sonography programs, a separate discussion of each dependent variable is provided.
SF-12v2: Micro- and Macro-Ergonomic Assessment
Each of the three treatment groups did show a mean decrease in PCS over the course of the study. One participant in the YM group, who was a 21-year-old female, demonstrated a pretreatment PCS of 60.38 and a posttreatment PCS of 42.35, which is the most changed across the sample. Interestingly, this participant demonstrated a decrease in BP on the SF-12v2, no change in right upper extremity pain on the VAS, and decreased left upper extremity pain on the VAS. It is possible that this participant’s responses on the SF-12v2, which influenced her PCS scores, were due to variables of physical health unrelated to the study. In the absence of this participant’s scores, the YM group would have also had pre- and posttreatment mean scores above the age- and gender-matched reported U.S. norm.
Conversely, each of the three treatment groups did show an increase in mental health over the course of the study. The YM group demonstrated the greatest increase in level of mental health, and they did have once participant whose baseline MCS was 25.55. Although this participant may have had external influences at the time of baseline survey administration, which would cause a decreased mental health score, her MCS was raised from more than two standard deviations lower (10) than the calibrated norm of 50 to 46.87 after participation in the mindful sonography yoga and cueing intervention.
PSS: Macro-Ergonomic Assessment
All three of the treatment groups demonstrated a mean decrease in level of perceived stress over the treatment period. While the BF group reported the lowest levels of stress both pre- and postintervention, only one member of this group actually showed a slight decrease in their PSS score over the treatment period. The YM group was the only group in which all four of the participants demonstrated a decrease in stress over the treatment period. In fact, only one participant had a stress level greater than the age-matched reported U.S. norm of 17.46 posttreatment. 35 Two of the participants had pretreatment scores greater than the U.S. norm and posttreatment scores lower than the U.S. norm. Also interesting is that the participant who reported the highest level of perceived stress across the sample pretreatment is the same participant who reported the lowest level of mental health across the sample pretreatment but improved more than anyone in both of these measures after participation in mindful sonography yoga and cueing.
VAS: Micro-Ergonomic Assessment
Notably, the VAS pretreatment scores for the right upper extremity were the only survey scores for which the groups were significantly different at baseline survey administration (P = .027). This was likely due to the differences between the BF and YM groups. Also interesting was that the BFYM and YM both reported a slight decrease in right upper extremity pain and no change in their left upper extremity.
In a convenience sample of 77 patients with isolated extremity trauma, Bird and Dickson 36 sought to test the amount of change in pain along the Visual Analog Scale that was clinically significant. For respondents of the survey who indicated an initial pain score of 3.4 or less, an absolute value of change in VAS of 1.3 (SD = 1.4) was required to be clinically significant. In comparison with the study performed by Bird and Dickson, three participants in the current study indicated decreased pain levels on the VAS over the treatment period, which would be clinically significant. One of these participants was in the BFYM group, and two were in the YM group. They were all observed in the participant’s right upper extremity, which is the arm that was used by all participants in the BF and BFYM group during the biofeedback treatment sessions.
RULA: Micro-Ergonomic Assessment
Both of the groups who received the biofeedback treatment (BF, BFYM) demonstrated a decrease in their mean RULA scores from the first to last intervention session. Group mean scores for the BF and BFYM group across all six of the biofeedback intervention sessions were between 4.5 and 6.4, indicating that the posture of the participants in both groups needed either “investigated further” or “investigated further and changed soon” according to the guidelines on the RULA tool itself.
In a comparable study of scan-specific ergonomic risk factors for sonographers in 2009, Burnett et al. 19 used the RULA tool to evaluate a cohort of seven sonographers while performing several types of scans. Included in these exams was the Left Abdomen, which is an ultrasound exam of the patient’s left abdomen. This would include the left kidney for analysis, which is the anatomic region that was scanned by participants in the current study. The sonography cohort in Burnett et al.’s study demonstrated a mean RULA score of 7.0 on the Left Abdomen scan, indicating the need to investigate and change immediately. Thus, our cohort, while their posture indicated the need for further evaluation, was more ergonomically correct than the sonographers in the Burnett et al. study. This indicates the need for future prospective studies that evaluate posture changes over time, after student sonographers begin practice as a professional sonographer.
Muscle Activity: Micro-Ergonomic Assessment
It was anticipated that muscle activity would decrease for these groups from the first to last session. While the BF group did demonstrate a decrease in pitch frequency (Hz) and beep frequency, the BFYM group demonstrated an increase in muscle activity measures. In future studies of this nature, it may be beneficial to perform a controlled pretreatment validity study on the muscle activity measures from the Ergometer to ensure successful demonstration of the change in sound amplitude and pitch. An additional component of consideration for this study is that the analysis of sounds from the Ergometer was only done at one point in time during the biofeedback scanning. The use of the Audacity 2.0 program to further explore the change in muscle activity measures at different points in the scanning sessions themselves may be useful.
Limitations
It is the responsibility of the sonography program to maintain accreditation, limiting the extensiveness of treatments that can be given to a group of students. An example of this limitation was that all students are mandated by the Commission on Accreditation of Allied Health Education programs (CAAHEP) to receive ergonomics education (unspecified). Being in compliance with CAAHEP standards made it impossible to form a control group of students who received no interventions. The university also stipulates that all students receive an equitable education, thus no conditions were set for participants regarding previous MSK injury, diagnosis of mental health disorder, or exposure to mind-body technique instruction.
Additional threats to internal validity may have occurred due to history and maturation effects. While the students had no clinical experience hours prior to the study, they were learning and practicing during scan labs throughout the treatment period. Thus, events that occurred during the labs may have affected outcomes of surveys and mind-body techniques, and students may have improved their posture score over time regardless of the treatment they received. Additionally, exposure to outside activities, such as time spent using other equipment and electronic devices, was not considered. These extraneous variables could have potentially influenced participant responses to surveys regarding physical and mental health, stress, and level of pain.
External validity may have been jeopardized by the fact that multiple treatments were given to the same subjects, making it difficult to control for the effects of prior treatments. Because pre-experimental research is a descriptive level of research, no generalization can be made beyond the participants in this study themselves. The current study included sonography students from only one program, leading to a small sample size that was further divided into smaller treatment groups. It is suggested that future, larger scale studies are performed that investigate the use of mind-body technique to address WRMSD risk factors.
Additionally, it is important to note the limitations in the use of self-reported survey data. Responses to the survey tools used in the present study provided subjective information from the participant regarding self-reported physical and mental health, stress level, and level of pain in the upper extremities, which was then scored and analyzed as quantitative data. While the results do provide a unique set of prospective data regarding WRMSD risk for student sonographers, it is difficult to control for over- and underreporting of pain and stress and the influence of outside life factors on the students’ view of their own health. Pre- and postintervention measurements of specific biological markers of physical and mental health may have provided supplemental, objective data regarding change in participant health after the introduction of mind-body technique instruction. One feasible example would be the collection of saliva samples to evaluate change in cortisol, a biological marker that has been shown to reduce with reduction in perceived stress, 37 over the course of the study.
Previous literature regarding stress in college has shown that students report experiencing the most academic stress at predictable times during a semester, namely, when studying for exams, during times of grade competition, and at times when they have a large amount of content to master. 38 While the student cohort was given distinct instruction that the activities during mind-body technique instruction did not count toward a formal grade, it is possible that they felt a sense of pressure to perform at a certain level. This may have affected not only effectiveness of the mind-body techniques but also survey responses of individual students. An adaptation of these methods using a lab environment that requires student participants to attend mind-body technique instruction outside of class time might assist in controlling for these variables.
Conclusion
Results from this pilot study to address WRMSD risk in a cohort of student sonographers failed to demonstrate any statistically significant reduction in micro- and macro-ergonomic outcomes measures of physical and mental health, perceived stress, and upper extremity pain. However, statistical power was limited by a small sample and treatment group size. Furthermore, internal validity of the results was threatened by inability to comprise inclusion and exclusion criteria to students in the program, lack of health history, and implementation of treatment during formal lab time.
Nevertheless, improvements in measures of mental health, perceived stress, pain, and scanning posture were observed for specific treatment groups. Most notably, the YM group, who received ergonomics education + mindful sonography yoga and cueing, demonstrated a group mean improvement in mental health, perceived stress level, and right upper extremity pain over the study period. Three of the study participants experienced a possibly clinically significant reduction in right upper extremity pain over the study period, one of which was in the BFYM group and two who were in the YM group. Also, biofeedback training was shown to improve posture in both groups who received this treatment over the study period and to a greater extent when it was combined with mindful sonography yoga and cueing for the BFYM group.
The findings of this prospective, pilot study indicate the need for future, larger scale studies that investigate the use of mind-body techniques to address micro- and macro-ergonomic risk factors for WRMSD. The combination of quantitative data from health surveys, postural and muscle activity analysis, health biomarkers, and qualitative data from focus groups in larger samples of student sonographers would allow for greater generalizability of results. Furthermore, the addition of longitudinal follow-up intervals in the study design as participants progress in their career would provide further evidence of the efficacy of mind-body techniques to address WRMSD risk in future sonographers.
Footnotes
Declaration of Conflicting Interests
The authors declared no potential conflicts of interest with respect to the research, authorship, and/or publication of this article.
Funding
The authors received no financial support for the research, authorship, and/or publication of this article.