
Abstract
The mean blood velocity is required to calculate blood flow and to determine the associated shear rate. The maximal blood flow velocity is assumed to have a parabolic velocity profile; therefore, the mean velocity is half of the maximal value. Previous studies have been carried out on vessels such as the brachial and femoral artery, but none have been reported for the popliteal artery. To assess the velocity profile of the popliteal artery, a spectral Doppler analysis was performed on ten healthy patients during varied flow states (resting, distal occlusion, hyperemia). The results were then averaged over the entire cardiac cycle. The flow described in these patients’ popliteal artery had a blunted parabolic flow profile with a TAVmean:TAVmax ratio of 0.68 ± 0.07 at baseline. The baseline measures were compared to a TAVmean:TAV max ratio of 0.68 ± 0.12 during distal occlusion and 0.67 ± 0.16 during reactive hyperemia. These descriptive results may suggest that adjustments may be needed for a blunted parabolic profile, especially when calculating the mean velocity of the popliteal artery.
Blood flow within the peripheral arterial system depends on the pumping action of the heart, the elastic recoil of the conduit arteries, and distal microvasculature resistance. 1 Blood flow is quantified as a product of the mean blood velocity and the luminal area. 2 According to the Hagen–Poiseuille equation, if the pressure difference, length, and viscosity are constant, as the radius or velocity increases, the quantity of flow increases. During local vasodilatation, both the radius and velocity increase. 3 When applying the Hagen–Poiseuille equation for arterial flow, it is assumed that the vessel is straight, is cylindrical, and has rigid walls. 4 Other assumptions are that blood is an ideal Newtonian fluid with constant viscosity, whereas the flow is steady and laminar, with a parabolic flow profile. 4
Shear forces exist between adjacent flow laminar, as well as the outermost laminar, and the vessel wall. 2 Shear stress on the vessel wall stimulates the endothelium to produce nitric oxide, and this causes vasodilatation. This flow-mediated vasodilatation (FMD) is a measure of endothelial function. The greater the wall shear stress, the greater the FMD. When there is increased oxygen demand and accumulation of metabolites in the tissues during a transient ischemic episode, the microvascular arteries dilate, leading to a pressure gradient that drives blood downstream at an increased rate, once blood flow is restored. This is termed reactive hyperemia. 5 The shear rate increases when there is reactive hyperemia.
The time averaged intensity weighted mean velocity (TAVmean) is required to quantify reactive hyperemia and shear rate, respectively. Reactive hyperemia is a ratio of the maximum flow recorded before an ischemic episode compared to the maximum flow immediately blood flow is restored.
6
Conversely, shear rate is a function of the mean velocity and the diameter.
7
TAVmean is calculated with the assumption that blood flow is laminar with a fully formed parabolic velocity profile.
7
With parabolic flow, the maximal velocity is found in the central concentric lamina and the mean velocity (
For quantifying blood flow and wall shear rate (WSR), respectively, the luminal diameter and the blood velocity can be acquired using sonography. The luminal diameter is obtained from gray-scale images of an artery at diastole, which is a period when the arterial size is less varied. 10 Spectral Doppler waveforms obtained simultaneously or immediately after the gray-scale images are captured, provide velocity information. 11 Using Equation 1, the WSR can be calculated if the degree of bluntness of the parabolic velocity profile is known, 12
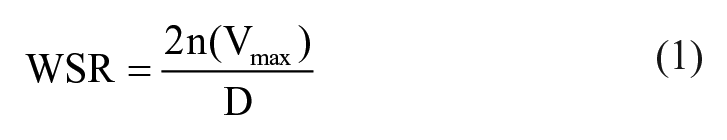
where n is a bluntness factor that characterizes the parabolic flow profile and is calculated using Equation 2: 12
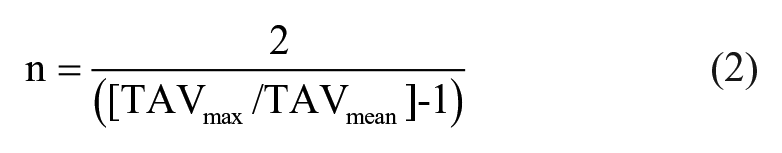
For fully developed parabolic flow profiles, the degree of bluntness is 2. This is the ideal hemodynamic situation. However, in cases where there is turbulence, the flow rate is high or the artery is large, as well as the arterial segment is not long enough to accommodate the required entrance length for the development of a fully formed parabolic profile, then the degree of bluntness will be greater than 2. 13 It is important to determine the bluntness factor of the velocity profile of an artery during data acquisition, to ensure reliable measurements of the WSR and blood flow. Spectral Doppler analysis provides a means of assessing the velocity profile of an artery such as the popliteal artery, which is rather short in length.
The popliteal artery is a continuation of the femoral artery beyond the adductor canal and typically measures 19.11 ± 3.47 cm from its origin to its termination at the anterior tibial artery. 14 The artery gives off muscular branches, cutaneous branches, and genicular arteries. 14 As a result, the popliteal artery may not have a fully formed parabolic profile. If the length of the artery is shorter than the required entrance length for parabolic flow, the velocity profile will be blunted with the Vmean:Vmax ratio greater than 0.5. 2
The hypothesis was that the popliteal artery has a fully formed parabolic velocity profile during data acquisition. Therefore, the aim of this study was to (1) demonstrate that the popliteal artery has a Vmean:Vmax ratio of 0.5, with a degree of bluntness of 2, and (2) determine the duration of different phases within the popliteal spectral Doppler waveform, so that an appropriate time delay could be included when imaging is required at a given phase of the waveform.
Materials and Methods
Participant Selection
Ten healthy adult male volunteers with ages between 19 and 27 years were recruited for the study. This convenience sample of participants provided written informed consent, and institutional ethics approval was obtained. Potential participants were excluded if they had a history of smoking, cardiovascular disease, dyslipidemia, or diabetes. The participants had their popliteal arteries assessed with spectral Doppler at baseline, during distal occlusion, and during reactive hyperemia, in order to determine the velocity profile of the artery at different hemodynamic states. The participants were scanned in a temperature controlled room after a period of rest. 15
Sonographic Technique
An experienced registered vascular technologist performed the sonographic studies and Doppler interrogation. A Philips iU22 ultrasound system (Philips Healthcare, Andover, MA, USA) was used to image all the participants. Each male participant was positioned prone on an examination couch with the pneumatic cuff of an aneroid sphygmomanometer (D.E. Hokanson Inc., Bellevue, WA, USA) placed for distal occlusion just above the ankle. A linear-array 9-3 MHz transducer was used to image the artery. The ultrasound probe was positioned in the popliteal fossa behind the knee. The popliteal artery was identified on a transverse image of the popliteal fossa, and then the transducer was rotated perpendicularly so that longitudinal images of the vessel could be visualized. To avoid turbulent flow, data were acquired at a sampling site 2 cm above the origin of the anterior tibial artery. On a longitudinal image, the vessel diameter was measured with electronic calipers at the sampling site. The calipers were placed at the luminal intima boundaries of the near and far walls of the artery and the average of three measurements was recorded. Then, pulsed wave spectral Doppler interrogation was performed at a frequency of 3.5 MHz. A sample volume was placed within the artery at the sampling site. The sample volume was expanded from wall to wall to capture velocities within the lumen. The average length of the Doppler sampling volume was 6 mm. The insonation angle was set to 60° with the angle correction control on the equipment. To ensure that the angle correction cursor was positioned centrally and parallel to the long axis of the popliteal artery, the Doppler beam aperture was steered 16 or a head-to-toe technique was used. 17 In cases of aliasing, the scale was adjusted so that high velocities were correctly represented above the baseline. 18
To assess the velocity profile at baseline, a spectral Doppler tracing of an unperturbed, disease free, and nontortuous artery was obtained. The cuff was then inflated to 240 mmHg for 5 minutes to induce ischemia. To assess the velocity profile during distal occlusion, a spectral Doppler tracing was obtained 1 minute before the cuff was released. To assess the velocity profile during reactive hyperemia, a tracing was obtained immediately after the cuff was released. Beat-to-beat variability was reduced by recording the spectral Doppler tracing over more than four cardiac cycles and averaging data from the second, third, and fourth waveforms.
Postprocessing
The maximal velocity (Vmax) at which there was fully formed parabolic flow, in the popliteal artery, was theoretically estimated as follows. Since the sampling site was fixed at a point 2 cm proximal to the termination of the popliteal artery, the distance that blood was expected to travel within the popliteal artery before reaching the sampling site was calculated as 17.11 cm. This was accomplished by subtracting 2 cm from the known length of the popliteal artery. 14 The 17.11 cm length was taken as the entrance length so that fully formed parabolic flow could develop. The upper limit for Vmax compatible with this entrance length was calculated as 15.84 cm/s, using Equation 3, which is a derivative of Equations 4 and 5 from hemodynamics.19,20
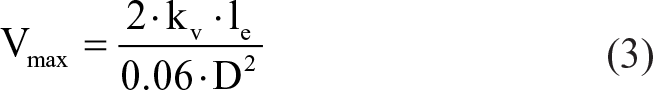
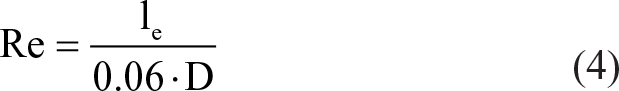
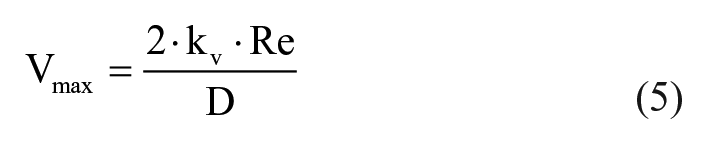
The variable kV is the kinematic viscosity of water in cm2/s, le is the entrance length for fully developed laminar flow in centimeters, D is the luminal diameter in centimeters, and Re is the Reynold’s number.
Spectral Doppler waveforms at different hemodynamic states were analyzed to obtain the time averaged velocities (TAV) and velocity profiles at the different states. The TAVmax of a given cardiac cycle was calculated as the integral of the magnitude of Vmax over the cardiac cycle divided by the R-R interval. 21 For anterograde velocities, Vmax at each time point was defined by the upper boundary of the spectral envelop as shown in Figure 1, whereas for retrograde velocities, Vmax at each time point was defined by the lower boundary of the spectral envelop. To calculate TAVmax, the spectral Doppler waveform was converted to a binary image in ImageJ (US National Institutes of Health, Bethesda, MD, USA) and the area under the curve for positive velocites and the area above the curve for negative velocities were summed and then divided by the R-R interval 22 (Figure 2a).
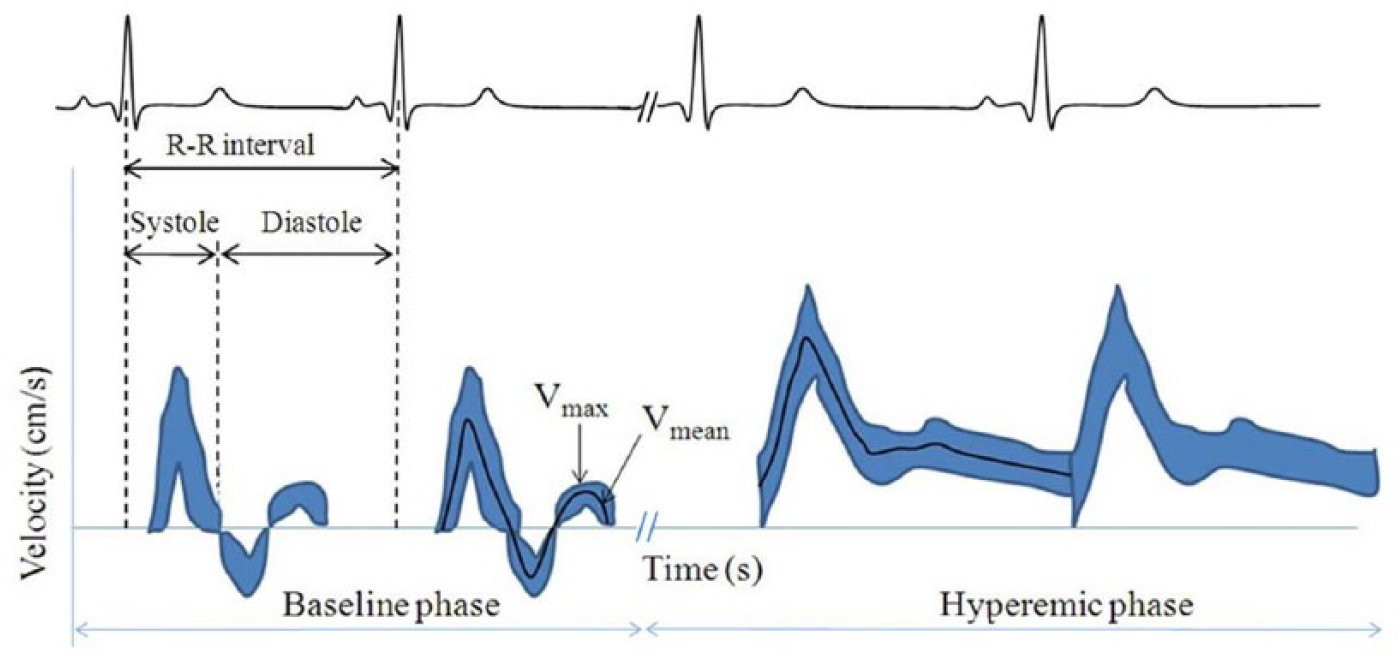
A schematic drawing of the spectral Doppler tracing at baseline and during hyperemia, respectively. The electrocardiogram tracing lies above the Doppler waveform, whereas the direction of flow in the vessel is illustrated above the electrocardiogram tracing. For velocities above the zero baseline, Vmax is represented by the upper bound of the Doppler waveform envelope, whereas it is represented by the lower bound for velocities less than zero. The black line represents Vmean.
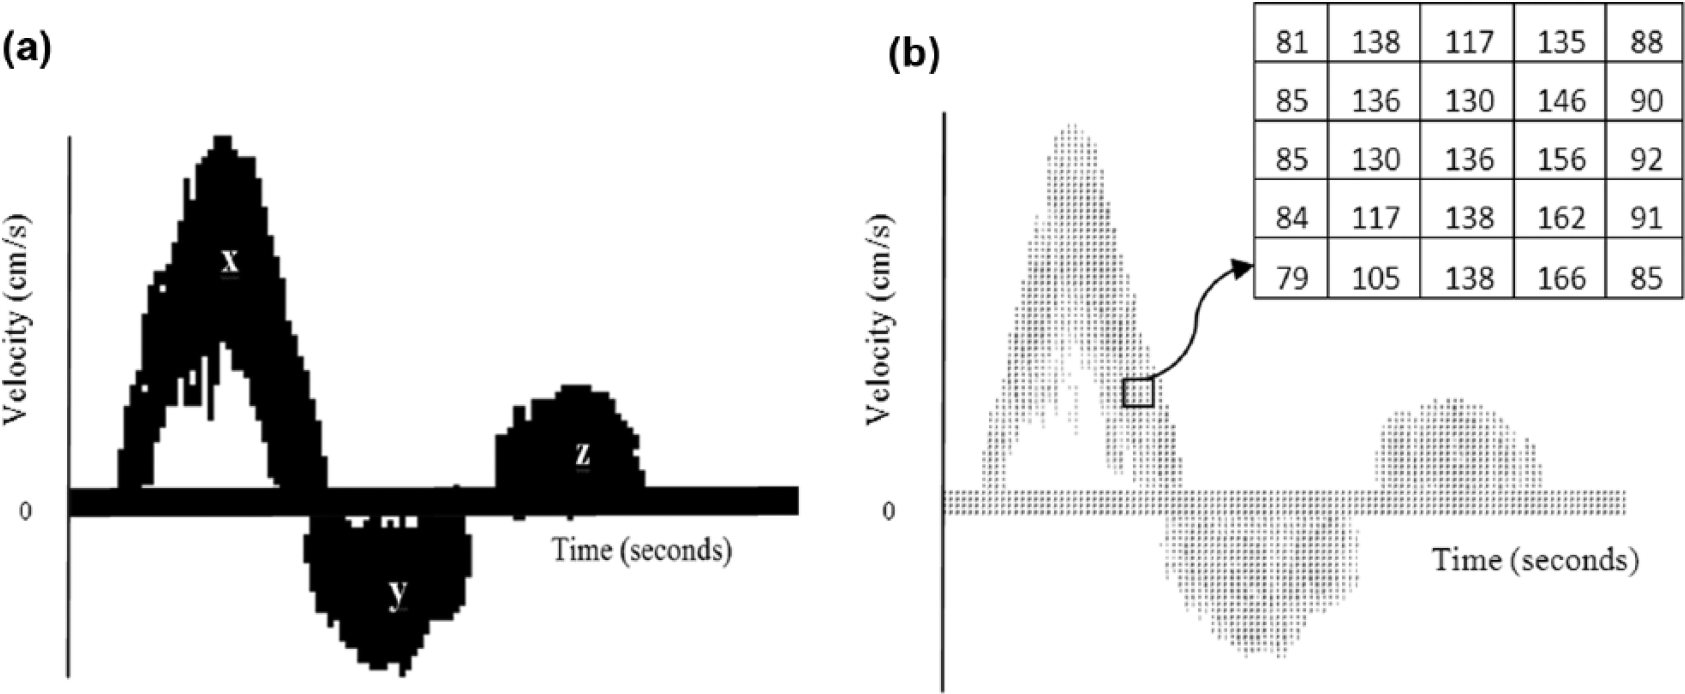
Postprocessing to obtain the time averaged maximal velocity (TAVmax) and time averaged intensity weighted mean velocity (TAVmean). (a) Binary image of a spectral Doppler waveform. TAVmax was calculated by adding the area under the curve for positive velocities (x and z) and the area above the curve for negative velocities (y) and then dividing by the R-R interval. (b) Matrix of the pixel intensities of all velocities over a cardiac cycle. The TAVmean was calculated from this matrix. The pixel intensities representing the x-axis were not included in the calculations.
The TAVmean of the cardiac cycle23,24 was obtained using a matrix of the pixel intensities of all velocities over each cardiac cycle, which was exported from ImageJ (Figure 2b). The pixel intensities were representative of the amount of blood particles moving at that velocity. The total number of particles moving at a given time was calculated by summing all the pixels at that time. The sum of the velocities of all particles at a given time was obtained by multiplying each pixel value by the corresponding velocity and the average velocity at each time was calculated. Subsequently, TAVmean was calculated by dividing the sum of the average velocity at each time in a cardiac cycle by the R-R interval to obtain the average velocity during the cardiac cycle. TAVmax and TAVmean were also computed for the anterograde and retrograde portion of the tracing as well as the entire diastolic period. The TAVmean and TAVmax values were calculated as the mean of three cardiac cycles and the corresponding TAVmean:TAVmax ratios were also calculated. Then, the degree of bluntness, n, was calculated using Equation 2.
Fully formed parabolic velocity profiles were expected to have a TAVmean:TAVmax ratio of 0.5, with a degree of bluntness (n) of 2. Velocity ratios greater than 0.5 but less than 1.0 were termed blunted parabolic profiles, 21 with the degree of bluntness (n) being greater than 2.
Statistical Analyses
The waveforms of three cardiac cycles were analyzed on each spectral Doppler tracing obtained at baseline, during distal occlusion, and immediately after the occlusive cuff was released, respectively. The data obtained were presented as mean ± standard deviation. The TAVmean was plotted as a function of TAVmax during the various portions of the cardiac cycle and at the three physiologic states. To compare the TAVmean:TAVmax ratio during the three physiologic states with the values of 0.5, expected for fully developed parabolic flow, an independent one-tailed t test was used. Data were analyzed with the R Project for Statistical Computing version 3.1.2 (R Foundation for Statistical Computing, Vienna, Austria).
Results
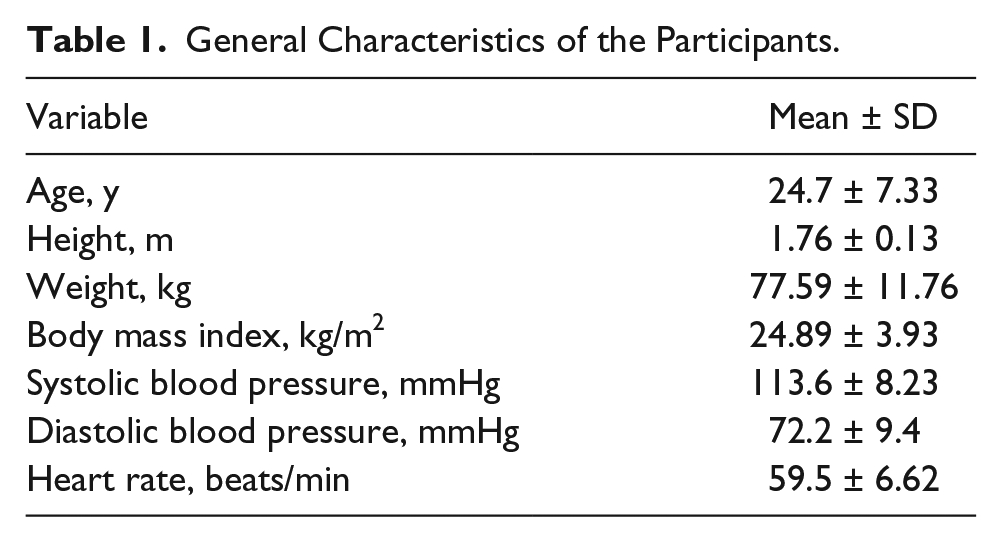
The general characteristics of the participants are summarized in Table 1. The cohort was nonhypertensive and nonobese, with a mean age of 25 years. On average, the popliteal artery was at a depth of 3.4 cm below the skin surface. In the resting state, the arteries displayed a triphasic waveform. The participants’ vessels demonstrated forward flow that occurred during systole, whereas retrograde flow followed by anterograde flow occurred at diastole. There was an intervening pause with little to no flow before the next waveform (Figure 3a). Sometimes, retrograde flow occurred again after the anterograde diastolic flow, giving a quadriphasic waveform that may be seen in lower extremity arteries at rest. 25 This second retrograde flow during diastole was present in two participants at baseline and in five others at the distal occlusion phase (Figure 3b). This second retrograde flow was included when calculating the TAV during diastole and during the entire cardiac cycle. During hyperemia, the flow velocities increased, and the waveform changed from triphasic to monophasic with continuous anterograde flow due to the pressure gradient created as a result of tissue ischemia, capillary dilatation, and decreased peripheral resistance (Figure 3c).
General Characteristics of the Participants.
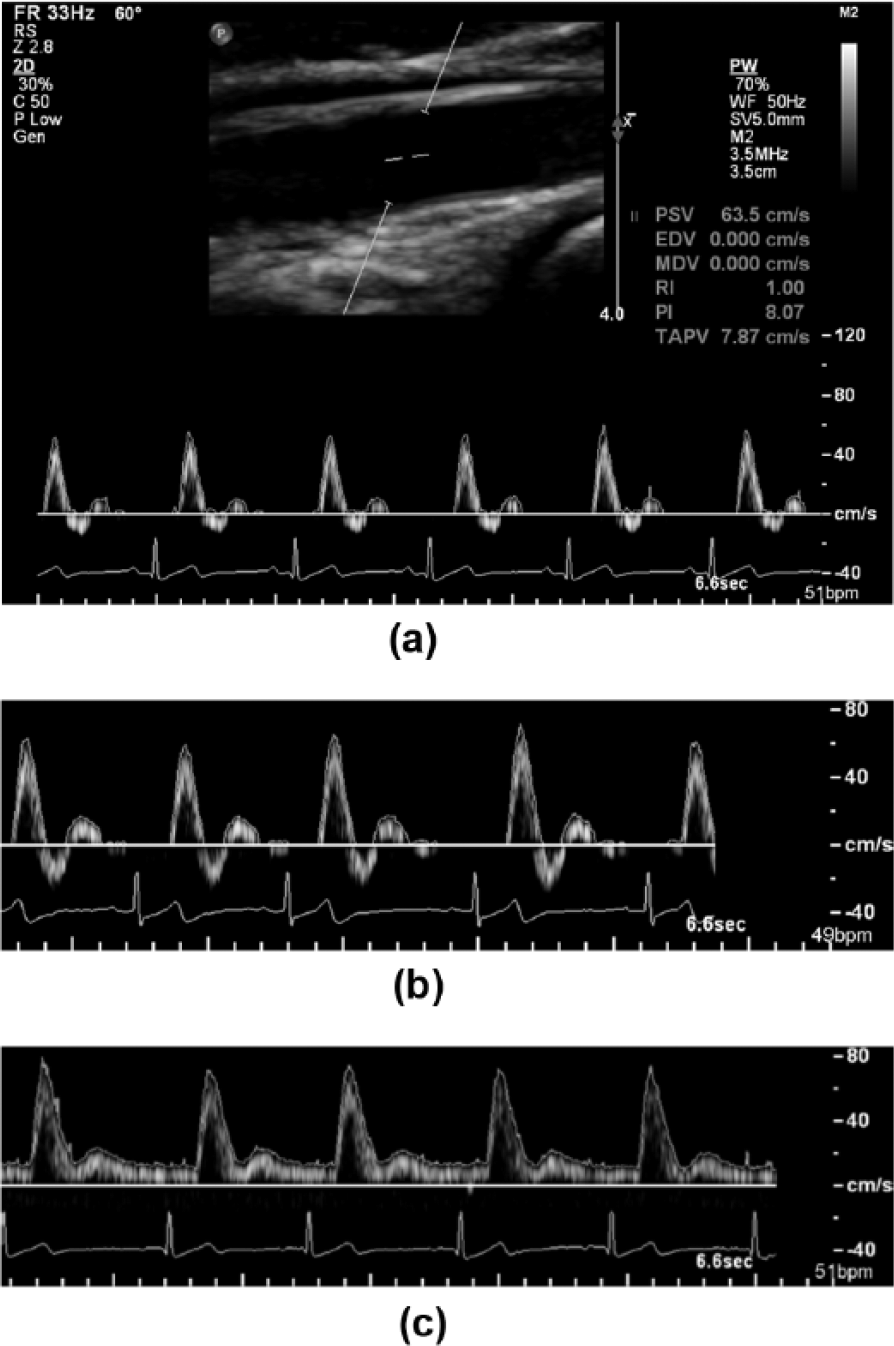
Spectral Doppler ultrasound of the popliteal artery. (a) Duplex ultrasound image showing a pulsatile popliteal spectral Doppler tracing in an unperturbed artery. The sample volume was placed within the lumen at an insonation angle of 60°. (b) Uncommon second retrograde diastolic flow (white arrow) that is sometimes seen during cuff inflation. (c) Hyperemic phase during which there is forward flow throughout the entire cardiac cycle.
Postprocessing and Statistical Analysis
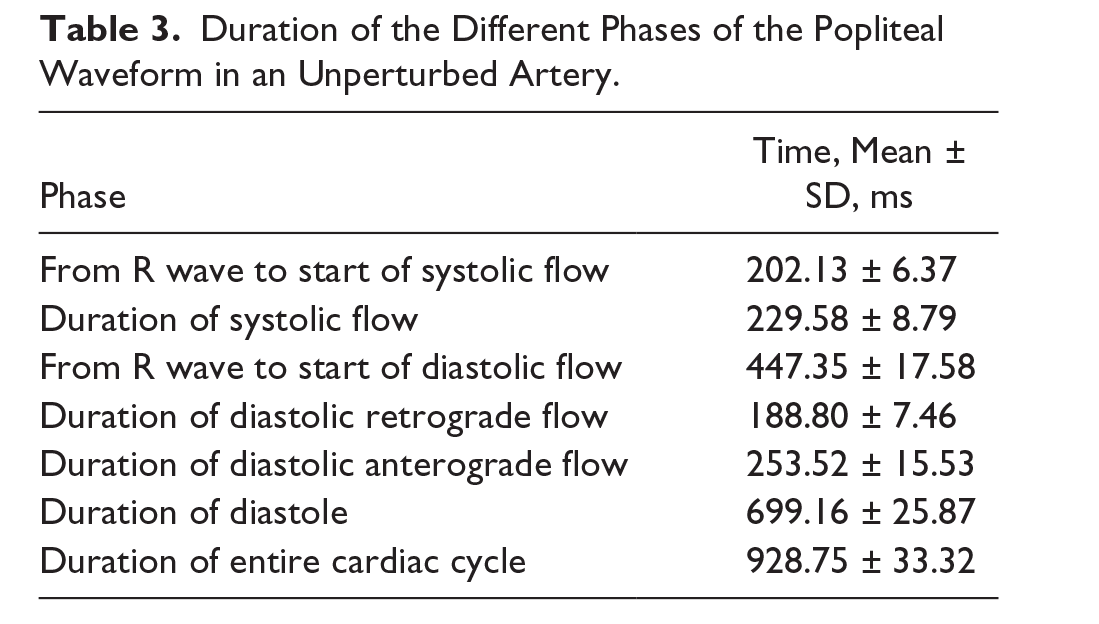
The baseline diameter was 5.56 ± 0.67 mm, whereas the maximal diameter postreactive hyperemia was 5.84 ± 0.69 mm. The popliteal artery had a blunted profile at almost all flow states, with the degree of bluntness being highest during the systolic phase of hyperemic flow (Table 2). The TAVmax:TAVmean ratios were ≥ 0.6 at various phases of the cardiac cycle. This was observed during the three hemodynamic states, with the exception of the cuff inflation period, in which the diastolic retrograde and diastolic anterograde flow had velocity ratios of 0.48 ± 0.12 and 0.58 ± 0.05, respectively (Table 2). Scatter plots showed that the velocity ratios were greater than 0.5 for most datasets (Figures 4a, 4b, and 4c), with data points lying predominately to the left of the line representing parabolic flow (slope = 0.5) for anterograde flow, whereas most data points were to the right of the line for retrograde flow. The duration of the entire cardiac cycle was 928.75 ± 33.32 ms, with the duration for different phases of the waveform in an unperturbed artery listed in Table 3.
Velocities for Different Phases of the Cardiac Cycle at Baseline, During Cuff Inflation, and During Reactive Hyperemia. a
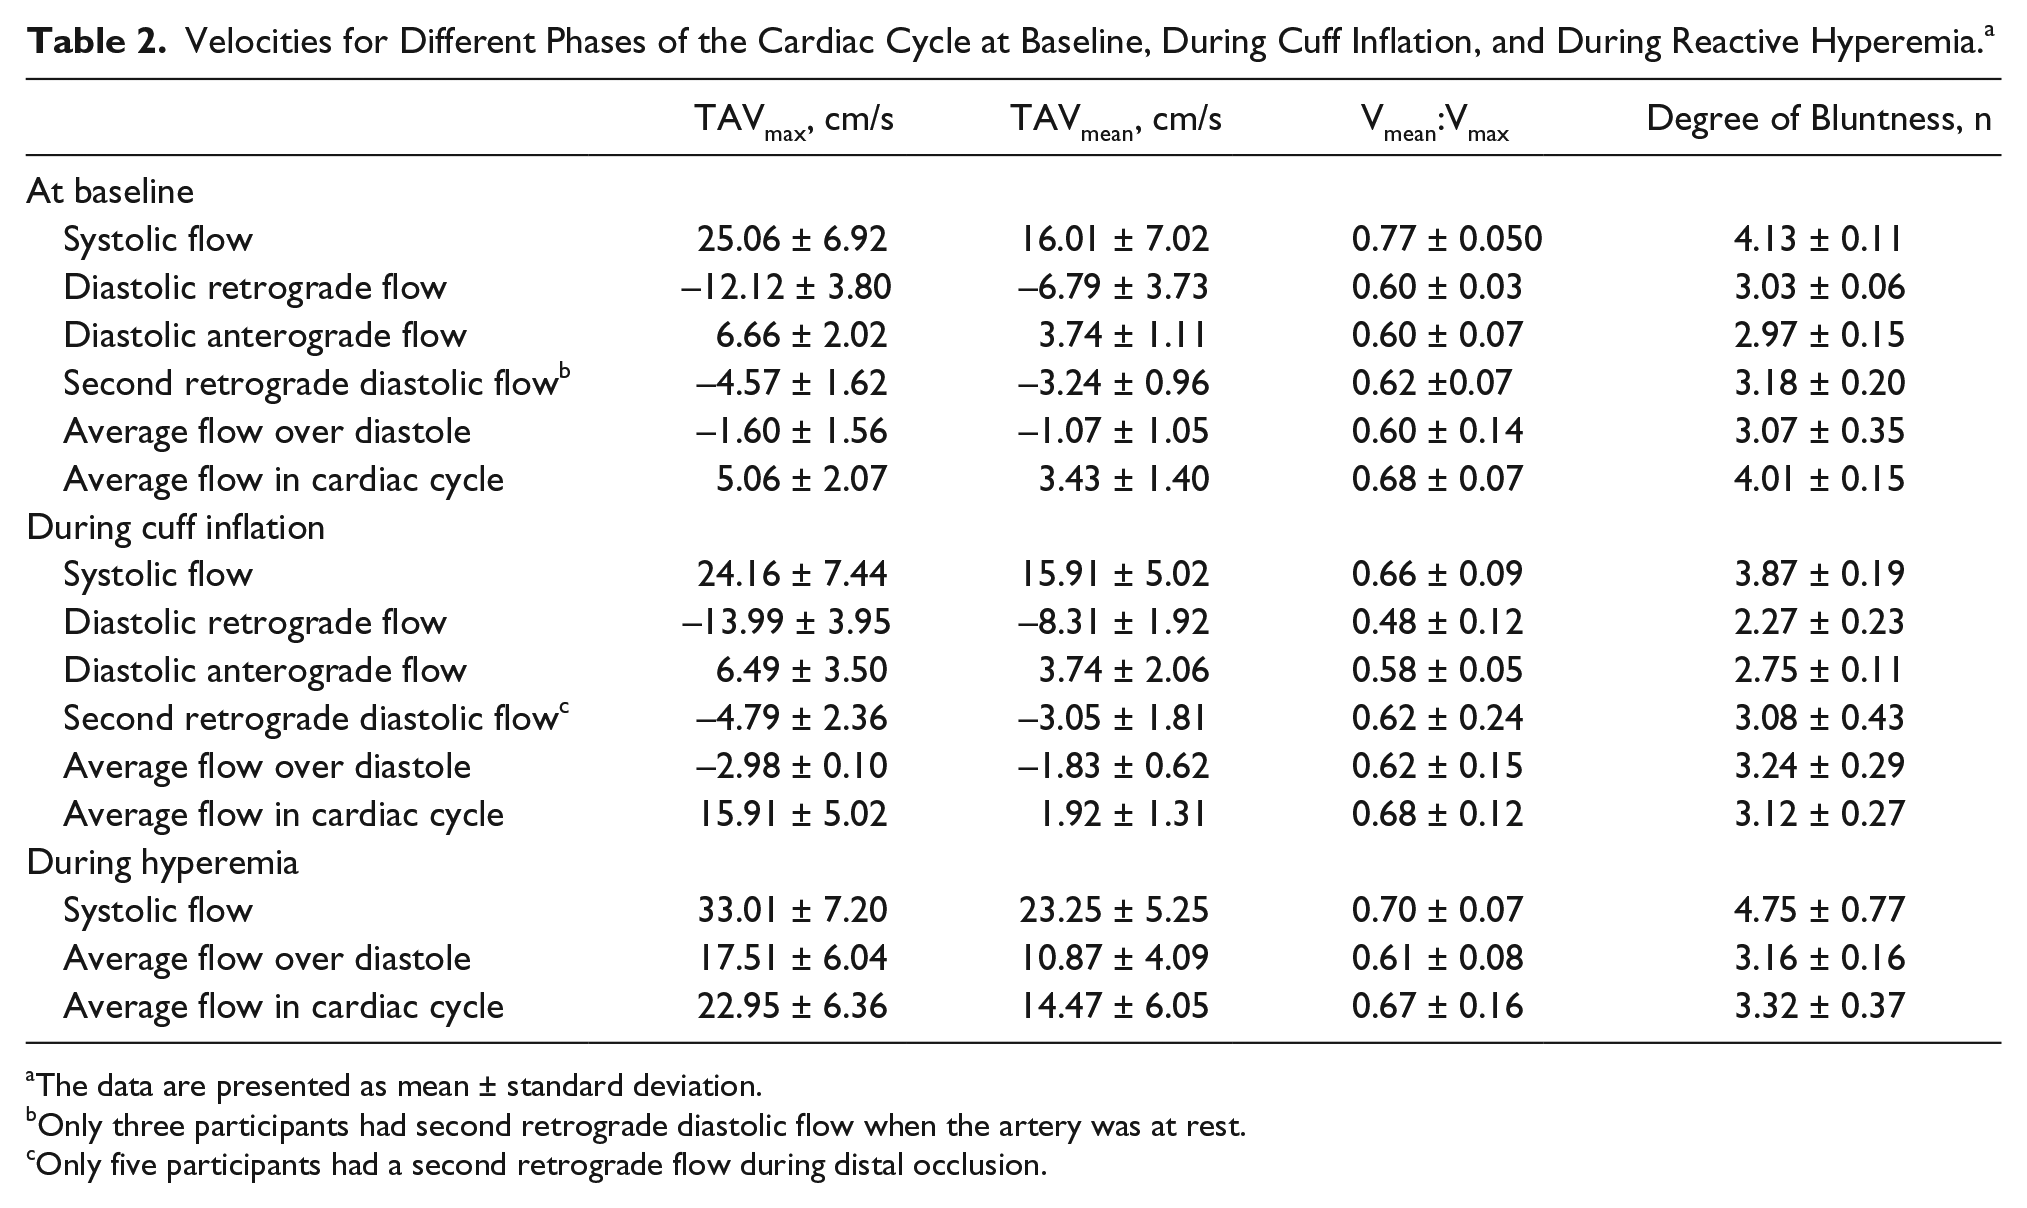
The data are presented as mean ± standard deviation.
Only three participants had second retrograde diastolic flow when the artery was at rest.
Only five participants had a second retrograde flow during distal occlusion.
Duration of the Different Phases of the Popliteal Waveform in an Unperturbed Artery.
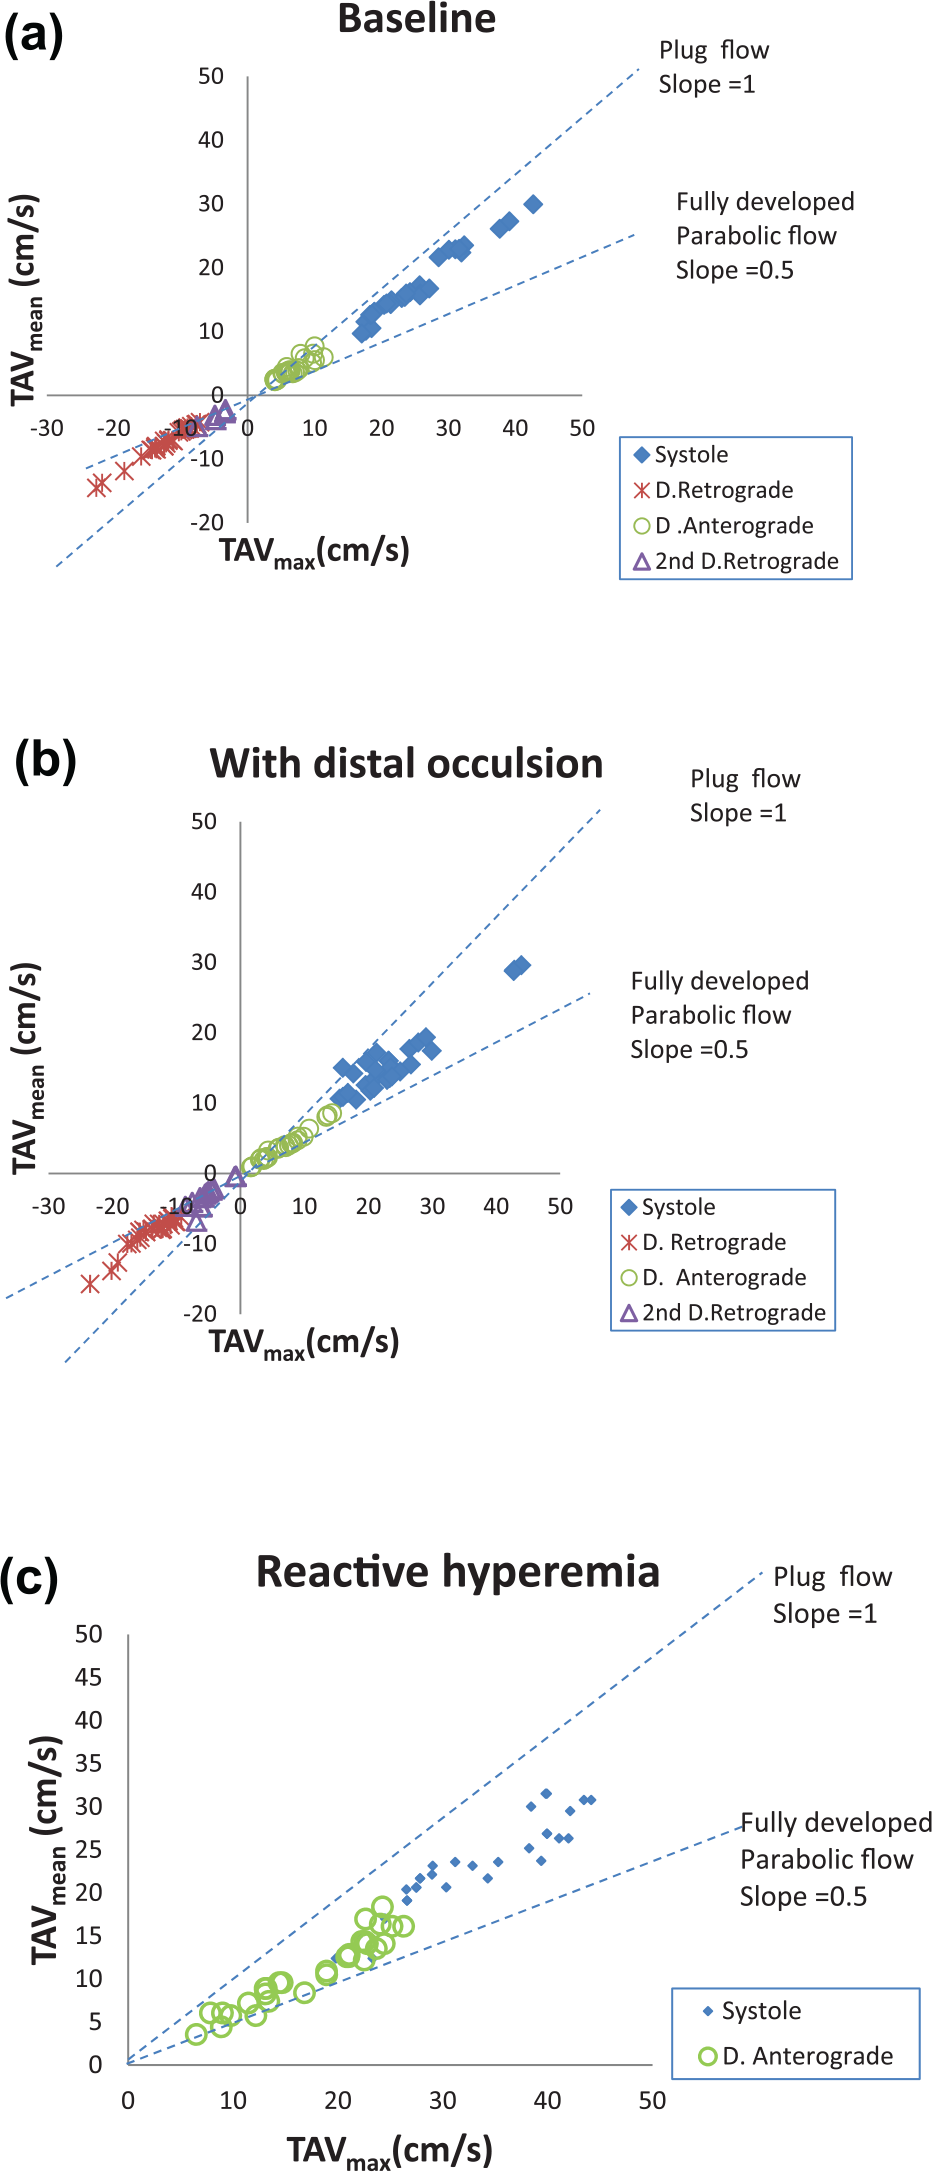
Scatter plot of time averaged intensity weighted mean velocity (TAVmean) against time averaged maximal velocity (TAVmax) at baseline (a), during distal occlusion (b), and during reactive hyperemia (c). The dataset in each graph was divided into the systolic phase, the retrograde portion of diastole (D. Retrograde), the anterograde portion of diastole (D. Anterograde), and the second retrograde portion of diastole (2nd D. Retrograde). A line of unity was included for plug flow (slope = 1) and another line was included for fully developed parabolic flow (slope = 0.5).
Discussion
In this group of male participants, the popliteal artery has a blunted profile at various physiologic states. This differed from the original hypothesis that the popliteal artery has a fully formed parabolic velocity profile. A blunted velocity profile would affect blood flow or shear rate estimates in the popliteal artery if calculations are based on the assumption that the artery has a fully formed parabolic velocity profile.
Previous studies have examined the velocity profile of peripheral arteries focusing on the brachial or femoral artery, not the popliteal artery.21,26 Velocity profile estimates obtained from the brachial artery may not be applicable for flow or shear rate quantifications in the lower limb, and values obtained from the femoral artery may not be an adequate representative of the velocity profile in the popliteal artery. To the best of our knowledge, the velocity profile of the popliteal artery has not previously been assessed.
This cohort study suggests that the TAVmean:TAVmax ratio of the popliteal artery during the three different physiologic states differed significantly from the expected ratio of 0.5 when there is fully formed parabolic flow. The systolic velocity ratio of 0.77 and diastolic ratio of 0.60 in unperturbed popliteal arteries in this cohort study are similar to the systolic and diastolic ratios of 0.76 and 0.57, respectively, reported in the femoral artery. 26 However, they differ from another study that showed a systolic ratio of 0.57 and a diastolic ratio of 0.48 in the femoral artery. 21 In the study by Ade et al., 21 only the first retrograde portion of diastole was considered without the anterograde diastolic flow or the occasional second retrograde portion, which might explain why their study differed from both the present study and that by Osada and Radegran. 26 The higher velocity ratio during systole may be because of the relationship between velocity and the entrance length required for parabolic flow.19,20 At high velocities associated with systole, the distance from the origin of the popliteal artery to the site of imaging may be shorter than the required entrance length for parabolic flow.
In the present cohort study, diameter measurements of the popliteal artery agreed with the value of 6 mm from previous authors. 27 Using this diameter and an entrance length estimated from the known length of the popliteal artery, 14 the threshold for maximal velocities (TAVmax) associated with a parabolic flow profile in the popliteal artery was calculated as 15.84 cm/s. In this study, TAVmax exceeded this theoretical threshold during systole for all three physiologic states. During diastole, when the vessel was unperturbed, and during distal occlusion, TAVmax did not exceed 15.84 cm/s. However, it was exceeded during the diastolic phase of reactive hyperemia. The presence of maximal velocities that exceeded the theoretically calculated upper limit of 15.84 cm/s for fully formed parabolic flow explains the current findings of a blunted parabolic flow profile in the popliteal artery.
The velocity profile of the popliteal artery is dependent on the maximal velocity, luminal diameter, and entrance length and assumes that the artery is intact without any branches, but this is not the case. The popliteal artery gives off various branches, 14 and the presence of turbulence at these locations may also contribute to the blunted parabolic velocity profile observed. 2
Three-dimensional sonographic imaging, using mechanically swept probes, provides a means of acquiring the mean velocity, peak velocity, and average volume flow estimates independent of the vessel orientation, 28 and it may be applied for in vivo pulsatile blood flow conditions. 29 However, the 3D technique has a relatively slow acquisition time, which may be a limitation to real-time volumetric imaging during the cardiac cycle. 29 Other methods for assessing the velocity profile and the degree of bluntness (n) include photometry, cinematography or using an image intensifier, 30 and phase contrast magnetic resonance imaging (MRI).12,13 With phase contrast imaging, the degree of bluntness is incorporated into calculations for the WSR.12,13 The degree of bluntness in the present cohort was higher than the value of 3.2 ± 1.0 found in the brachial artery using phase contrast MRI. 13
Although MRI is an alternate means of assessing the velocity profile of an artery, it is more expensive and less available than sonography-based spectral Doppler analysis. In addition, unlike 2D sonography, which provides imaging at a high temporal resolution, MRI is limited by the tradeoff between spatial and temporal resolution. 31 This poses some difficulty when obtaining the changes in luminal diameter for multiple consecutive flow and shear rate measurements during MRI. The information obtained in this study from spectral Doppler analysis on the duration of diastole and the interval from the R wave to the onset of diastole may be helpful in designing diastolic gated MRI sequences.
Limitations
The sample size and characteristics are limitations in this study because data were obtained from a convenience sample of 10 healthy young men. This sample size is small and may not reflect the entire population of healthy young men. The results may be different in women due to effects of estrogen on vascular function. 32 It may also differ in those at risk for atherosclerosis, for example, older adults and those with hypertension or diabetes, due to turbulent flow in diseased arteries. 33
The accuracy of 2D sonography plus spectral Doppler for flow analysis depends on vessel orientation, with erroneous frequency shifts obtained when the vessel is out of plane. 23 Other possible sources of error include the Doppler angle, the sample volume size, and the sample volume position. Velocity calculations from the Doppler equation are most accurate when the Doppler angle is close to zero, and the error is high for angles greater than 60°. 17 Intentional efforts were made in this study to keep the Doppler angle at or below 60°. In addition, the sample volume extended from wall to wall to detect the slower velocities close to the vessel wall. One explanation for the blunted velocity profile would be a mismatch between the maximum velocity of the blood flow and the entrance length required for parabolic flow. Therefore, values from a prior cadaveric study 14 were used to estimate the entrance length based on the distance between the sampling site and the distal end of the artery, rather than measuring the length of the artery.
Further research to determine the velocity profile of the popliteal artery in other physiologic states such as during exercise or cold pressor test 34 may be useful in the future. It may also be helpful to assess the velocity profile in those with vascular disease because stenosis and vessel stiffness may produce a different result in such a study population. These values will be useful for wall shear stress and blood flow quantification during popliteal blood flow studies. The bluntness factors may also be helpful for accurate assessment of reactive hyperemia when evaluating microvascular function.
In conclusion, this cohort study of young healthy men at different hemodynamic states suggests that the velocity profile of the popliteal artery may not have a fully formed parabolic shape. Therefore, the degree of bluntness of the velocity profile may need to be measured during flow studies and incorporated into calculations for shear rate and blood flow.
Footnotes
Declaration of Conflicting Interests
The authors declared no potential conflicts of interest with respect to the research, authorship, and/or publication of this article.
Funding
The authors received no financial support for the research, authorship, and/or publication of this article.