
Abstract
Background
Aortic root rupture is a rare but lethal complication of transcatheter aortic valve replacement (TAVR). It is often the result of excessive radial forces experienced by the aorta during stent deployment. Current pre-procedural planning methods lack the predictive ability to capture interactions between the patient's native anatomical tissue and the transcatheter heart valve.
Objectives
This study aimed to investigate whether 3-dimensional (3D) computational modeling could be used to derive a biomarker that analyzed peak areal stretch to predict patient-specific risk for aortic root rupture.
Methods
In a 2-phase study, a derivation cohort (n = 26) was used to establish a peak areal stretch threshold for rupture risk, followed by a blinded validation cohort (n = 40) where modeling was performed using the federal drug administration-cleared PrecisionTAVI software. Researchers were blinded to the clinical outcomes of each case until after computational analysis had been completed. Peak areal stretch's predictive ability was compared to traditional factors such as calcium score or valve oversizing.
Results
A significant association was found between peak areal stretch and aortic root rupture. Rupture-positive cases had a higher mean stretch (1.956 ± 0.216) than negative cases (1.635 ± 0.284, P = .0285). A threshold of 1.6 showed strong predictive performance with an area under the curve (AUC) of 0.81, outperforming traditional metrics such as calcium score (AUC = 0.643) and valve oversizing (AUC = 0.697).
Conclusion
Peak areal stretch derived from computational modeling may serve as a patient-specific predictor of aortic root rupture, with potential to improve pre-TAVR planning and patient outcomes.
Keywords
Central Message
Blinded 3-dimensional computational modeling of peak areal stretch predicts patient-specific risk of aortic root rupture during transcatheter aortic valve replacement (TAVR) and outperforms traditional planning metrics alone.
Perspective Statement
Despite its lethality, aortic root rupture during TAVR remains difficult to predict using standard pre-procedural metrics. This study demonstrates that computationally derived peak areal stretch identifies patients at risk with a higher area AUC compared to traditional planning metrics alone. These findings highlight critical limitations in current pre-procedural planning approaches and offer a data-driven method to address it.
Central Picture
Central Picture Legend
Schematic representation of a study to derive and test the computationally derived biomarker, peak areal stretch to predict aortic root rupture.
Background
Aortic stenosis (AS) is a prevalent cardiovascular condition in older adults, characterized by the narrowing of the aortic valve, which restricts blood flow from the heart. 1 Transcatheter aortic valve replacement (TAVR) has become a treatment modality for AS that is comparable, in all risk categories, to surgical aortic valve replacement.2–5 Early complications with TAVR include aortic root rupture, paravalvular leakage, valve thrombosis, and the need for permanent pacemaker insertion, some of which can be life-threatening. 6 While the risks for TAVR complications have improved in the past decade, there remain inherent challenges of preprocedural planning which typically is conducted using 2-dimensional (2D) analysis of multiphase cardiac computed tomography (CT) scans, which only allows visualizing overlays of stent deployment rather than providing a comprehensive assessment of tissue and valve deformation. Furthermore, intraoperative fluoroscopy relies solely on (2D) angiography, which limits the ability to accurately assess the dynamic interaction between the transcatheter heart valve (THV) and the patient's unique native anatomy. 7
Aortic root rupture is one of the most severe complications associated with TAVR, with a mortality rate approaching 50%. 8 This condition typically arises when excessive radial forces from the THV stent overstretch and tear the annular and surrounding tissue. 7 The risk is especially pronounced in patients with a small aortic annulus, heavily calcified valves, bicuspid aortic valves (BAV), and calcified left ventricular outflow tracts (LVOT), as these anatomical features predispose the tissue to rupture under the mechanical stress induced by balloon-expanding (BE) stents. 7 Notably, studies have shown that preprocedural planning techniques, such as measuring the calcium burden and considering the amount of valve oversizing, often fail to accurately predict which patients are at the highest risk of rupture, as current methods do not fully account for patient-specific factors such as calcification distribution and tissue compliance. 7 Additionally, in patients with bicuspid aortic valves, the incidence of aortic root rupture increases from 1% to 4.5%. 9 Although the incidence of rupture is low, its high mortality rate makes it an incredibly feared complication within the cardiac catheterization laboratory. As such, being able to predict it with more accuracy may be a beneficial preplanning tool for clinicians.
As TAVR volumes continue to increase, the need for improved preprocedural planning becomes increasingly important. 10 Higher volume centers have consistently demonstrated better outcomes, raising concerns about inequities in care, especially as more hospitals begin offering TAVR. 10 A sophisticated computational tool capable of predicting risk for aortic root rupture based on individual anatomical and physiological risk factors could not only enhance patient safety but also standardize care across diverse healthcare settings.
This research aims to enhance current approaches to predicting aortic root rupture in TAVR preprocedural planning by incorporating patient-specific computational modeling. The central hypothesis is that the degree of stent-induced deformation of the aortic root, specifically peak areal stretch within the aortic root induced by the radially displaced calcific nodules, can serve as a reliable predictor of root rupture. By using blinded 3-dimensional (3D) computational modeling, this study seeks to identify the predictive power of the precise location and magnitude of peak areal stretch and its correlation with aortic root rupture. A comprehensive understanding of these biomechanical variables could potentially lead to the development of more robust preprocedural planning tools that minimize the risk of catastrophic outcomes in patients with TAVR.
Methods
Cohort Design and Workflow
To determine the optimal threshold for peak areal stretch in predicting the risk of aortic root rupture during TAVR, a 2-phase study was conducted. Initially, a derivation cohort of 26 patients was analyzed to quantify a peak areal stretch threshold associated with aortic root rupture risk. Once this threshold was established, a validation cohort of 40 additional patients underwent computational modeling, where the areal stretch was detected in a blinded manner, without knowledge of the clinical outcomes. After completing the simulations and calculating the peak areal stretch for each case, the clinical results were revealed. The predictability of aortic root rupture was then evaluated based on the relationship between the computed peak areal stretch values and the actual clinical outcomes of aortic root rupture. This comprehensive, blinded-validation approach allowed for an accurate assessment of the model's ability to forecast aortic root rupture risk, refining the threshold for clinical application. The predictability of more classical factors such as calcium score was also evaluated and compared.
The Institutional Review Board of the Piedmont Heart Institute approved the study protocol and publication of data (1962255-2, approved on October 1, 2024). Patient written consent for the publication of the study data was waived by the Institutional Review Board because the study involved only retrospective cases.
Three-Dimensional Digital Twin Segmentation and Aortic Root Model Preprocessing
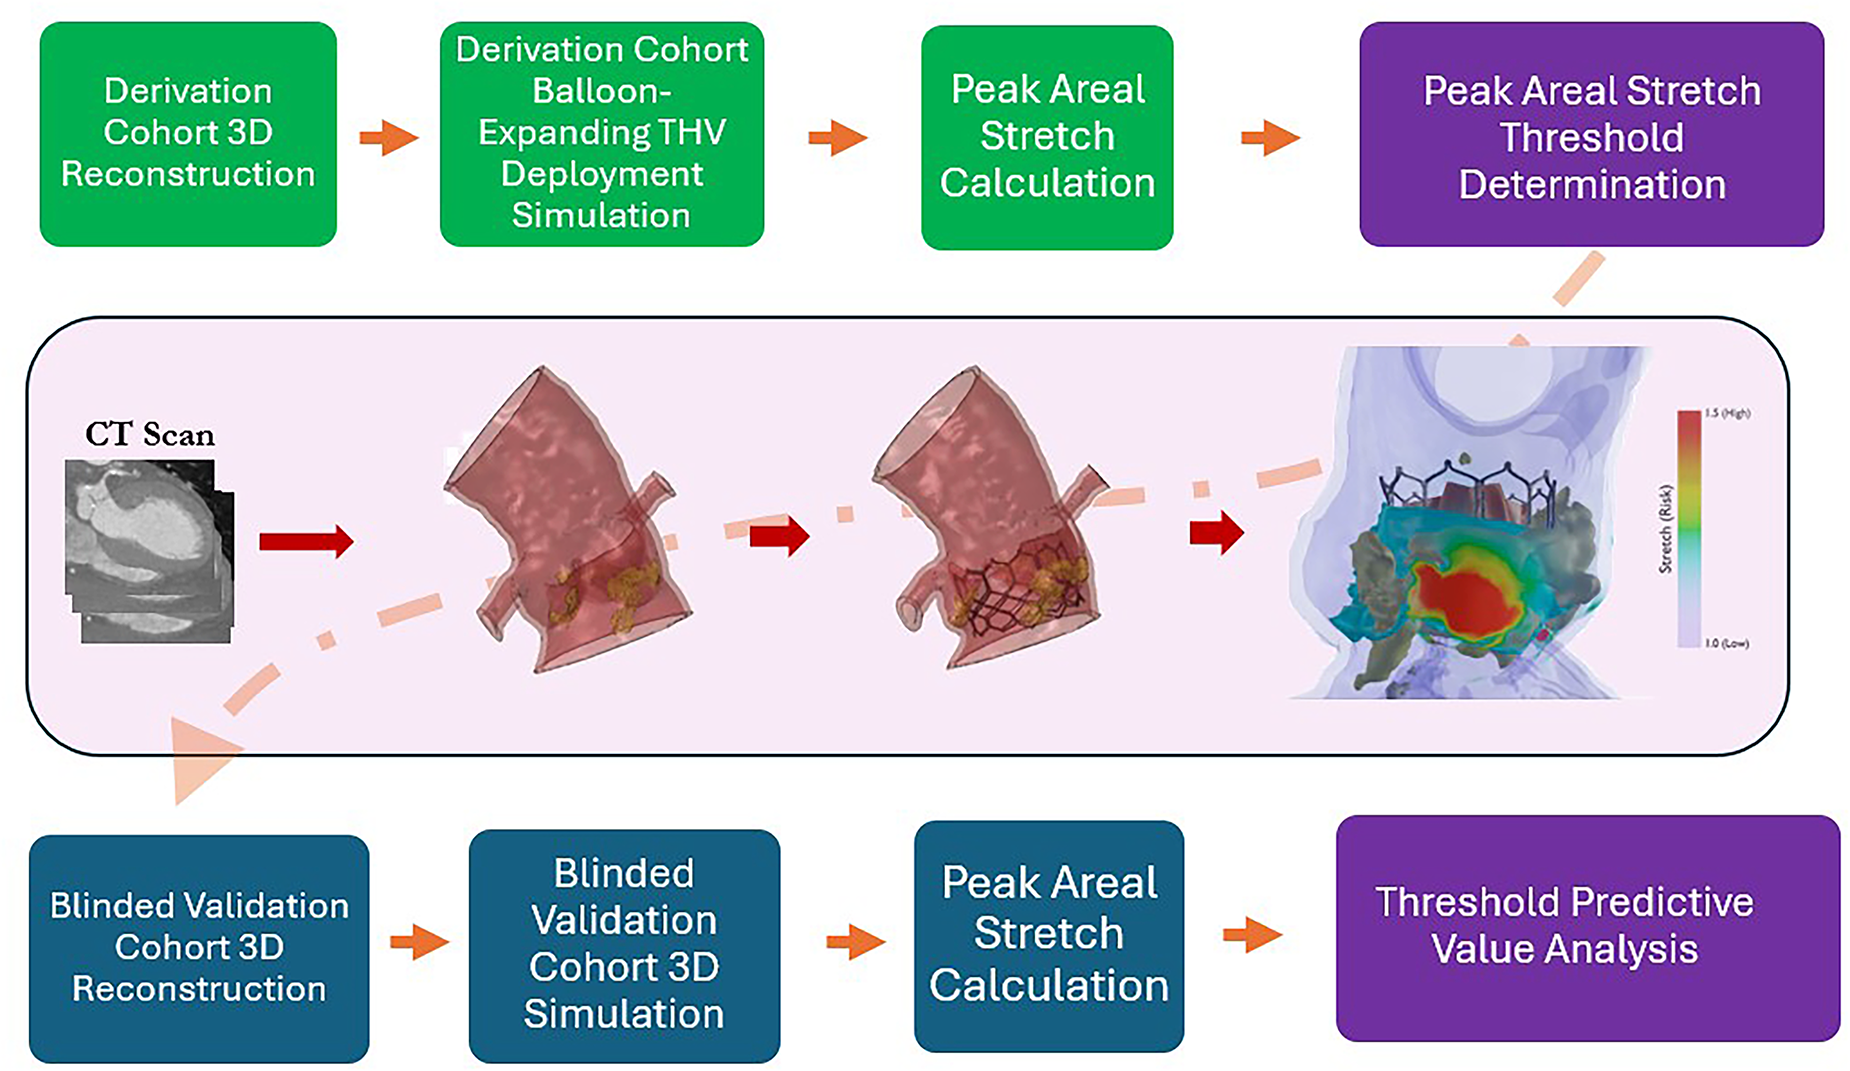
In both the derivation and blinded study cohorts, pre-TAVR contrast CT angiograms de-identified to be Health Insurance Portability and Accountability Act compliant were used to generate a 3D digital twin of each patient's pre-TAVR anatomy, followed by predictive simulation of BE valve representing the Edwards Sapien 3 family using the federal drug administration (FDA)-cleared PrecisionTAVI service (DASI Simulations LLC, USA). PrecisionTAVI is novel FDA-cleared software-as-a-medical device indicated to predict the deformed expansion of the stent and the anatomy to less than 10% error between the predicted stent deformation and the ground truth of matched post-TAVR CT (PrecisionTAVI FDA Clearance; K223809). The basis of PrecisionTAVI is a SimPlified forcE-drivEn particle moDel (SPEED), where the algorithm is trained to predict the relationship between the deformed stent and patient-specific anatomy on a dataset of pre- and post-TAVR CT pairs. As such, patient-specific material properties and device-specific material properties are not required as inputs to the model. Figure 1 shows a schematic of this process, which culminated in the calculation of the peak areal stretch field, represented as a color contour overlaid on the 3D anatomy. Figure 2 demonstrates views of an exemplary 3D reconstruction of tri-leaflet and bicuspid aortic valve anatomy, color-coded to appreciate the root, native cusps, and calcific lesions at both the level of the sinotubular junction and annulus. To be included in the study, all patient CT scans had to meet the image specification criteria outlined in Table 1.
Workflow illustration demonstrating the overall process of taking a 2D CT scan and simulating the deployment of a BE THV and establishing a quantitative stretch threshold indicative of aortic root rupture risk. Abbreviations: 3D, 3-dimensional; BE, balloon-expanding; CT, computed tomography; THV, transcatheter heart valve.
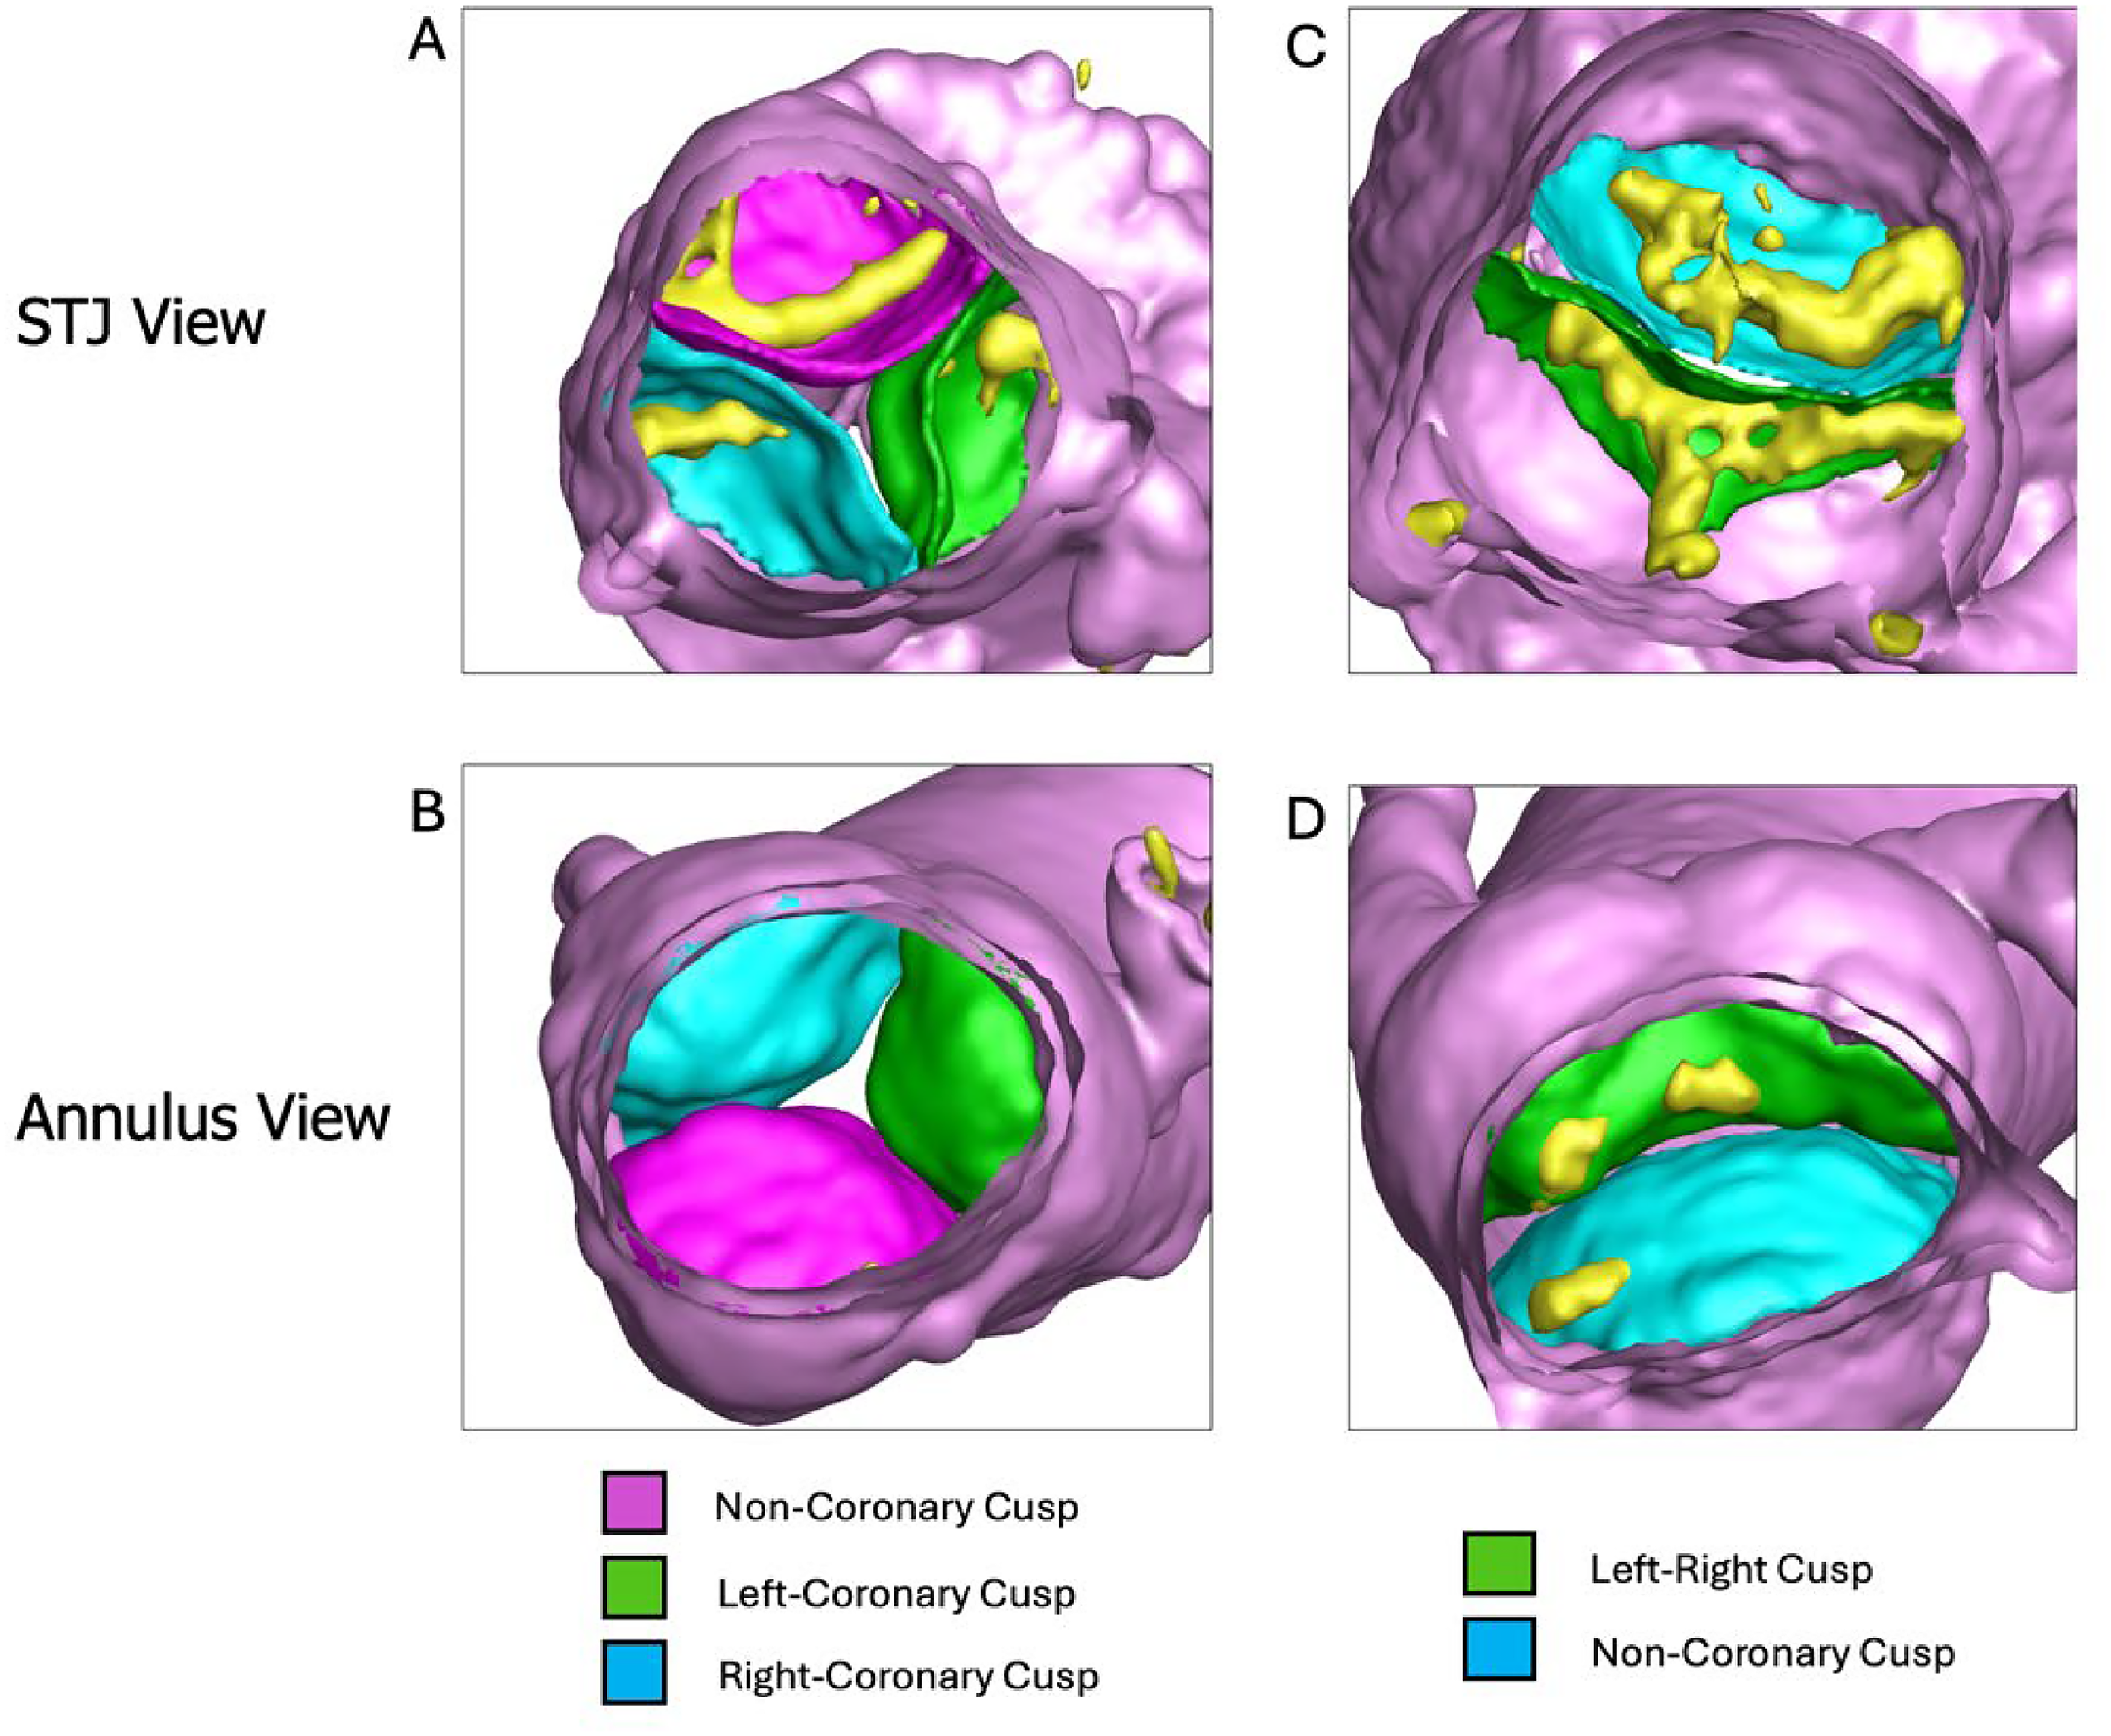
(A) 3D reconstruction of the aortic valve from the STJ, (B) 3D reconstruction of the aortic valve from the annulus, (C) a 3D reconstruction of a bicuspid aortic valve from the STJ, (D) 3D reconstruction of a bicuspid aortic valve from the annulus. This figure illustrates a 3D reconstruction of the aortic valve, providing 2 perspectives to visualize the anatomical structure and relationship of the valve cusps for exemplary tricuspid and bicuspid anatomies. Panel A (STJ view): Displays the exemplary tricuspid aortic valve from the STJ, offering a top-down view of the 3 cusps. The noncoronary cusp is shown in purple, the left-coronary cusp in green, and the right-coronary cusp in blue. This view highlights the alignment and relative positioning of the cusps within the aortic root. Panel B (annulus view): Presents the exemplary tricuspid aortic valve as viewed from the annulus level, looking upward from the LVOT. The same color scheme is used to depict the noncoronary, left-coronary, and right-coronary cusps, emphasizing their arrangement and spatial geometry at the valve's base. Panel C (STJ view): Displays the bicuspid aortic valve from the STJ, offering a top-down view of the fused and nonfused cusps. The non-coronary cusp is shown in blue, the left-right fused cusp in green. This view highlights the alignment and relative positioning of the cusps within the aortic root. Panel D (annulus view): Presents the bicuspid aortic valve as viewed from the annulus level. The same color scheme is used to depict the fused and nonfused cusps, emphasizing their arrangement and spatial geometry at the valve's base. Abbreviations: 3D, 3-dimensional; LVOT, left ventricular outflow tracts; STJ, sinotubular junction.
CT Imaging Requirements.
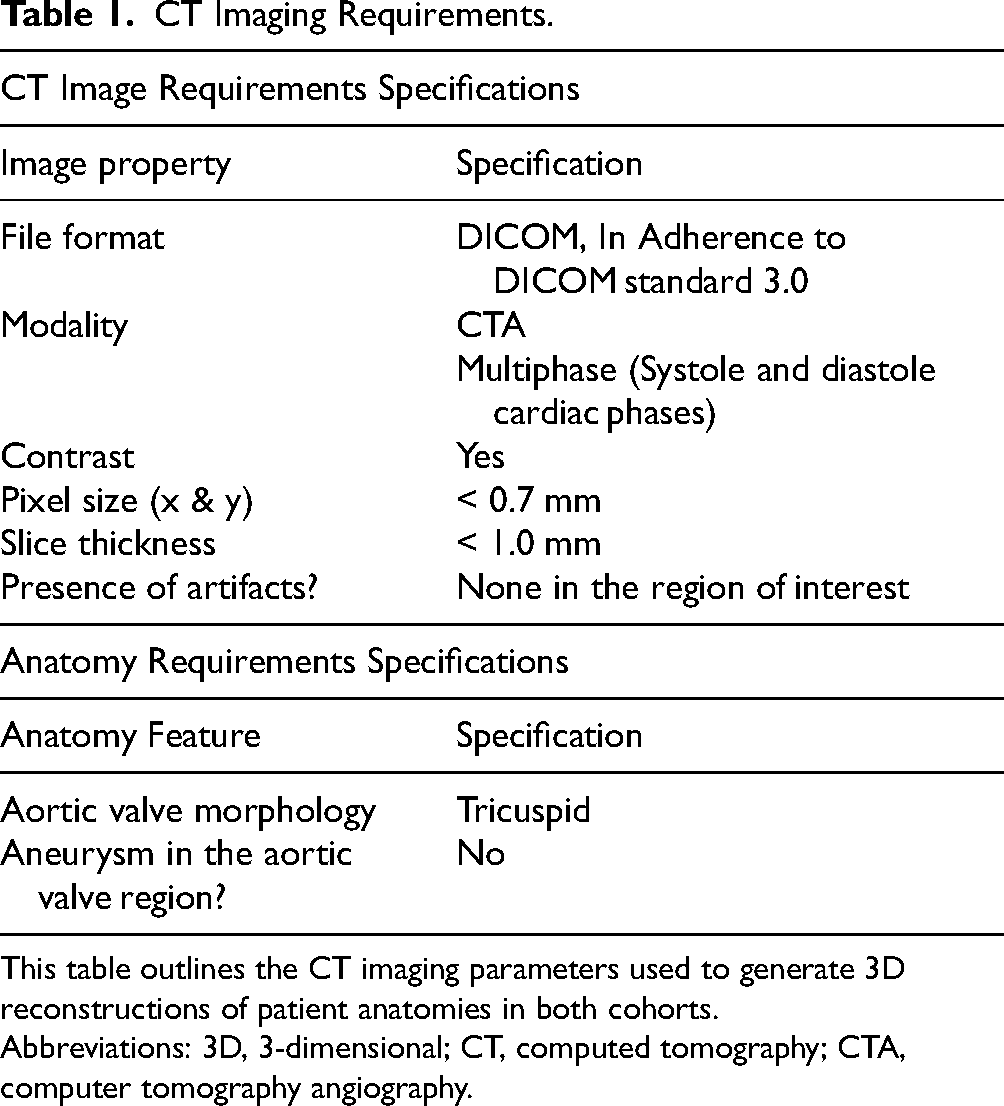
This table outlines the CT imaging parameters used to generate 3D reconstructions of patient anatomies in both cohorts.
Abbreviations: 3D, 3-dimensional; CT, computed tomography; CTA, computer tomography angiography.
Segmentation of the aortic root, native cusps, and calcific lesions was performed using the commercially available software Materialise Mimics (Materialise NV, Leuven, Belgium) following a previously described workflow. 11 Briefly, patient-specific thresholding based on the Hounsfield Unit (HU) histogram was used to reconstruct the aortic root, left ventricle, and ascending aorta, including detailed anatomical features such as leaflet geometry, raphe structures, and calcification distribution. Threshold values for the root and calcium were determined individually for each case by identifying the blood pool peak in the CT histogram and defining region-specific HU ranges. After thresholding, manual refinement was performed to isolate the region of interest and accurately delineate leaflet boundaries, as thresholding alone is insufficient for precise leaflet segmentation. This standardized segmentation protocol was applied to all cases to ensure consistency across the dataset.
Reproducibility of this segmentation methodology has previously been evaluated in an interoperator variability study in which a subset of 5 computer tomography angiography cases was independently segmented by two trained operators using the same protocol. 12 The resulting segmentations were qualitatively similar, with only minor differences primarily in the delineation of smaller branching vessels. Quantitative comparison demonstrated minimal variability in derived geometric measurements, with average differences of 0.0021 and 0.0034 mm−1 in maximum curvature of the ascending and descending aorta, respectively, and mean cross-sectional area differences of 52.5 and 33.3 mm2. These results support the reproducibility of the segmentation workflow and its suitability for use in the present study.
Balloon Expanding THV Deployment Simulations—Derivation Cohort
The retrospective Derivation Cohort (DC) to establish a peak areal stretch threshold consisted of 12 confirmed aortic root rupture patients combined with 14 randomly selected confirmed negative aortic root rupture patients who underwent retrospective computational modeling to simulate BE THV deployment using the FDA-cleared software as a medical device (SaMD) PrecisionTAVI (DASI Simulations LLC, Dublin, OH). The DC consisted of patients from multiple high-volume TAVR centers across the United States. These automatic simulations generated a postdeployment configuration from the pre-CT-derived 3D anatomy. The software was used to simulate a BE THV expansion representing the Edwards Sapien 3 (Edwards Life Sciences, Irvine, CA, USA) THV family at a nominal inflation volume and 80/20 deployment depth. The computational model not only predicts the deformation of the BE stent frame, but also the movement of the calcium and any corresponding deformation of the native cusps and root tissue. Figure 3 illustrates the expansion of the BE THV, including the displacement of calcium nodules as the valve expands in both tricuspid and bicuspid anatomies. Figure 3 also shows the hot spots of areal stretch caused by the deployment of the THV.

BE THV deployment and areal stretch analysis. Panel A/D: This image shows the pre-deployment view of a BE THV. Panel B/E: This image shows the postdeployment view of the BE THV demonstrating how calcific nodules are displaced along the aortic wall. The valve stent frame is shown interacting with the calcifications during the deployment process. Panel C/F: This heatmap illustrates the regions of peak areal stretch caused by the deployment of the BE THV. The areas of highest stretch are represented in red, indicating potential points of stress on the aortic tissue, which could contribute to complications such as aortic root rupture. Abbreviations: BE, balloon-expanding; THV, transcatheter heart valve.
After the valve was virtually deployed for each of the 26 cases, the peak areal stretch (λ=1+ℯ; where ℯ is defined as the areal strain) was automatically calculated in each patient's anatomy to quantify tissue deformation from the post-simulation aortic root relative to the pre-deployment aortic root. We developed an automated algorithm that localizes and reports the maximal areal stretch within the aortic root, reducing dependence on manual landmarking and improving reproducibility. The calculated tissue stretch can be visualized as a color contour shown in Figures 3 and 4.
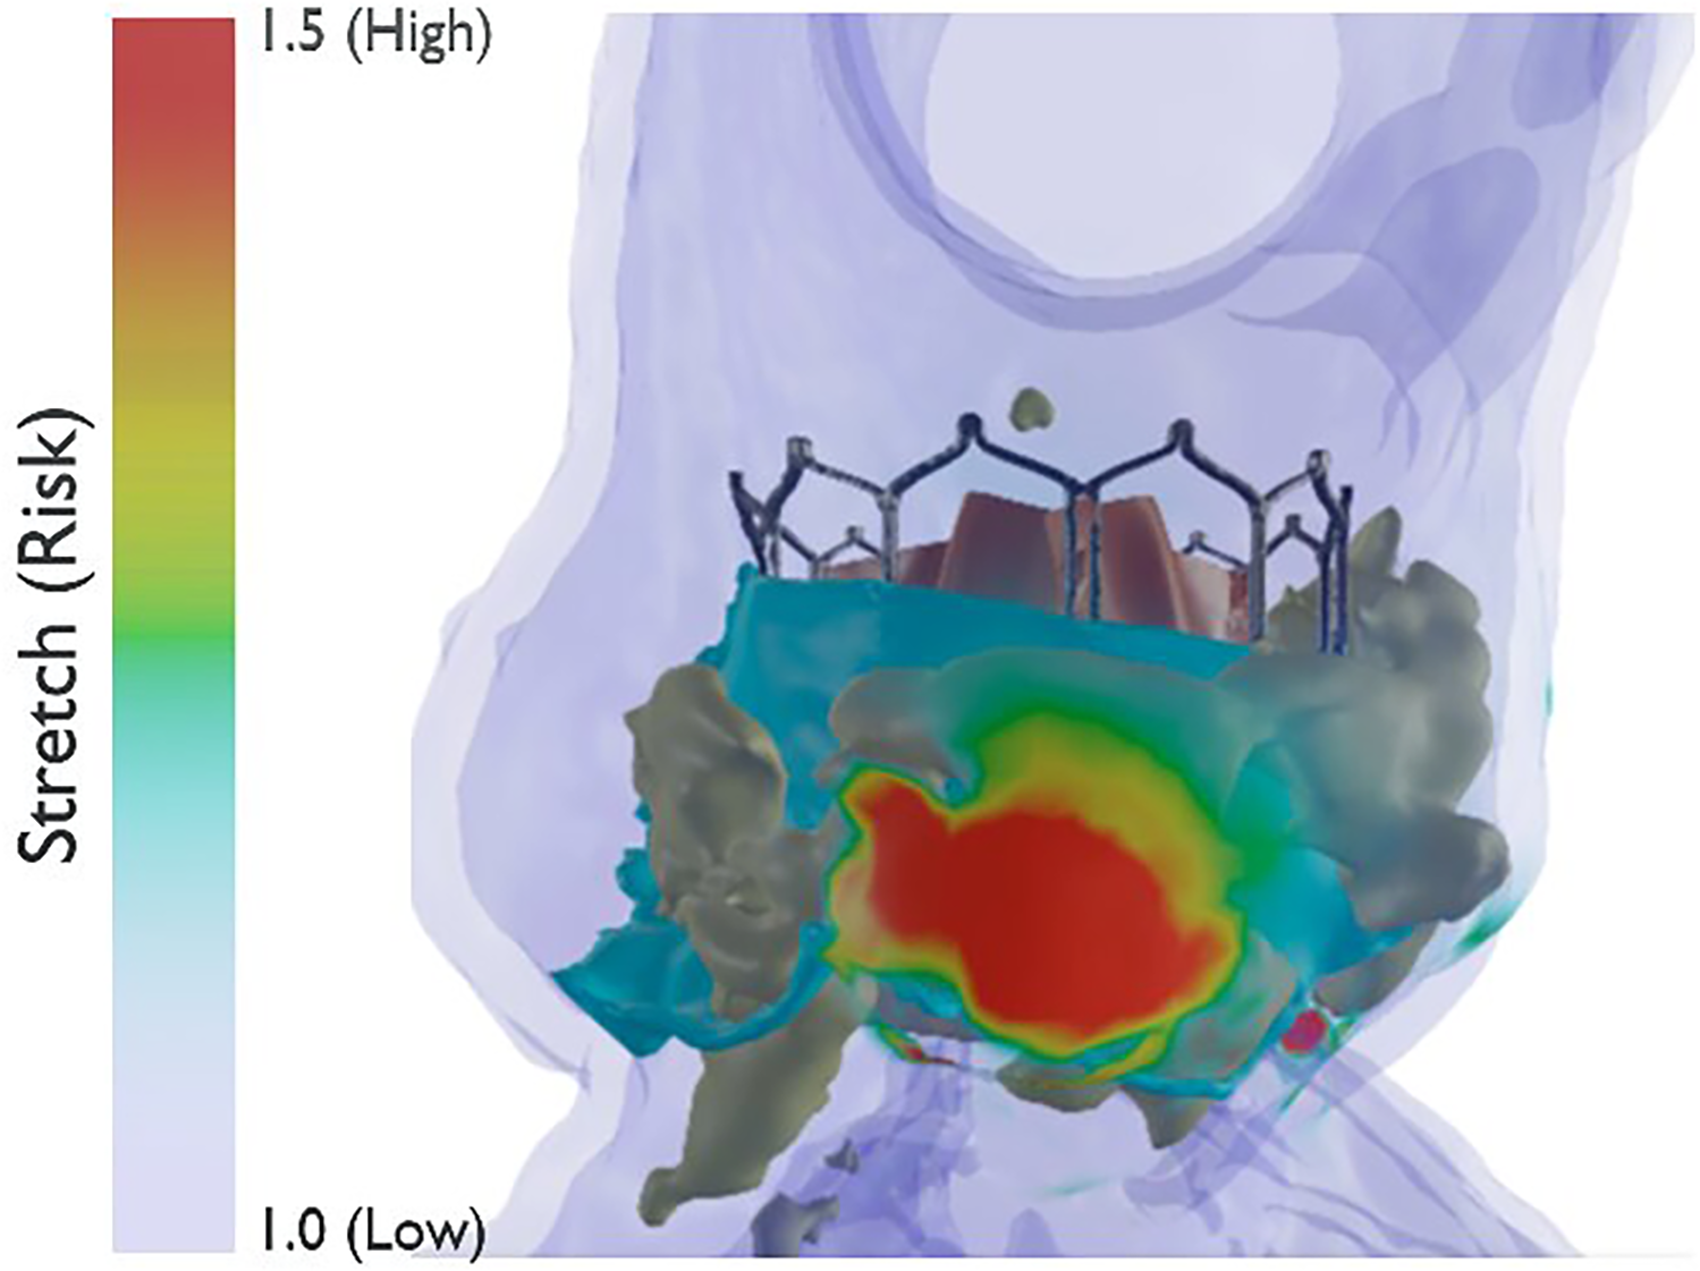
Peak areal stretch visualization. Visualization of the peak areal stretch after virtual valve deployment in a patient's anatomy. For each of the 26 cases, the peak areal stretch (λ=1+ℯ; where ℯ represents the areal strain) was calculated to quantify tissue deformation in the aortic root following transcatheter valve implantation. The color contour displayed in the figure highlights areas of tissue stretch, with regions of higher stretch (and thus higher risk of rupture) shown in red, and areas of lower stretch shown in blue. This visual representation aids in assessing potential rupture risk by identifying regions of elevated strain within the aortic tissue. Abbreviation: TAVR, transcatheter aortic valve replacement.
Blinded Validation Cohort Data Collection
After the results of the derivation cohort stretch and threshold determination studies were analyzed, a different single-center cohort of 40 patients, consecutively labeled high risk for aortic root rupture by the heart team, were assigned a unique identifier to ensure the simulation and stretch analysis was conducted in a blinded manner. A key with information on patient demographics as well as the type, size, and volume expansion of the valve used in each case was provided prior to the segmentations and simulations being conducted. However, no clinical outcome data was provided. Anatomical information such as valve morphology, valve calcium score, and the calcium score of each sinus was also included. The percentage over/under-sizing for BE valves was determined by measuring the annular area and comparing it to the nominal area of corresponding valve size.
Aortic Root Stretch Analysis
The same automatic analysis conducted in the DC was conducted on the blinded validation (BV) cohort. The stretch analysis for each case was done prior to the unblinding of clinical outcomes. Deployment simulations for BE valves were parameterized by the planned balloon fill volume/target frame diameter (per manufacturer compliance charts); the aortic root rupture biomarker (peak areal stretch) was defined as areal strain between baseline CT and the simulated deployed state under that inflation, such that intentional under- or over-fill is inherently reflected in the computed risk. The analysis involved the automatic identification of both the location and magnitude of calcium-induced peak areal stretch for each coronary cusp, in addition to the raphe for bicuspid cases. The peak stretch of all the cusps was labeled as Maximum Stretch. After the Maximum Stretch for each case was documented and compared to the threshold established from the derivation cohort analysis, the clinical outcomes of each patient's TAVR procedure were revealed. Once the simulations and computational measurements were completed for each case, the dataset was unblinded. Of the 40 patients, 5 experienced an aortic root rupture. Two of the positive cases occurred in patients with tri-leaflet aortic valves, and the remaining 3 occurred in patients with BAVs (Figures 5 and 6). Based on the comparison with the threshold derived from the derivation cohort, true positives, true negatives, false positives, and false negatives were tallied to compute the sensitivity and specificity of areal stretch as a predictor for aortic root rupture.

Positive aortic root rupture cases (bicuspid morphology): comparison of peak areal stretch distribution across 3 patient cases during bicuspid aortic valve TAVR valve deployment, highlighting the variation in tissue deformation risk. (A) Case 10 shows the highest maximum stretch value of 2.30, with significant stretch (red regions) observed on the left-right coronary cusp, indicating a high risk of aortic root rupture. (B) Case 27 exhibits a maximum stretch of 1.98 located on the left-right coronary cusp. (C) Case 40 presents a lower maximum stretch of 1.83, with most of the tissue stretch confined to smaller areas. The color scale on the left represents the stretch ratio (1.0 = low, 1.5 = high), with red indicating higher tissue deformation and greater rupture risk. Green represents regions near the left-right cusp, and blue represents the noncoronary cusp, aiding in the visualization of stretch distribution within the aortic root. Abbreviation: TAVR, transcatheter aortic valve replacement.
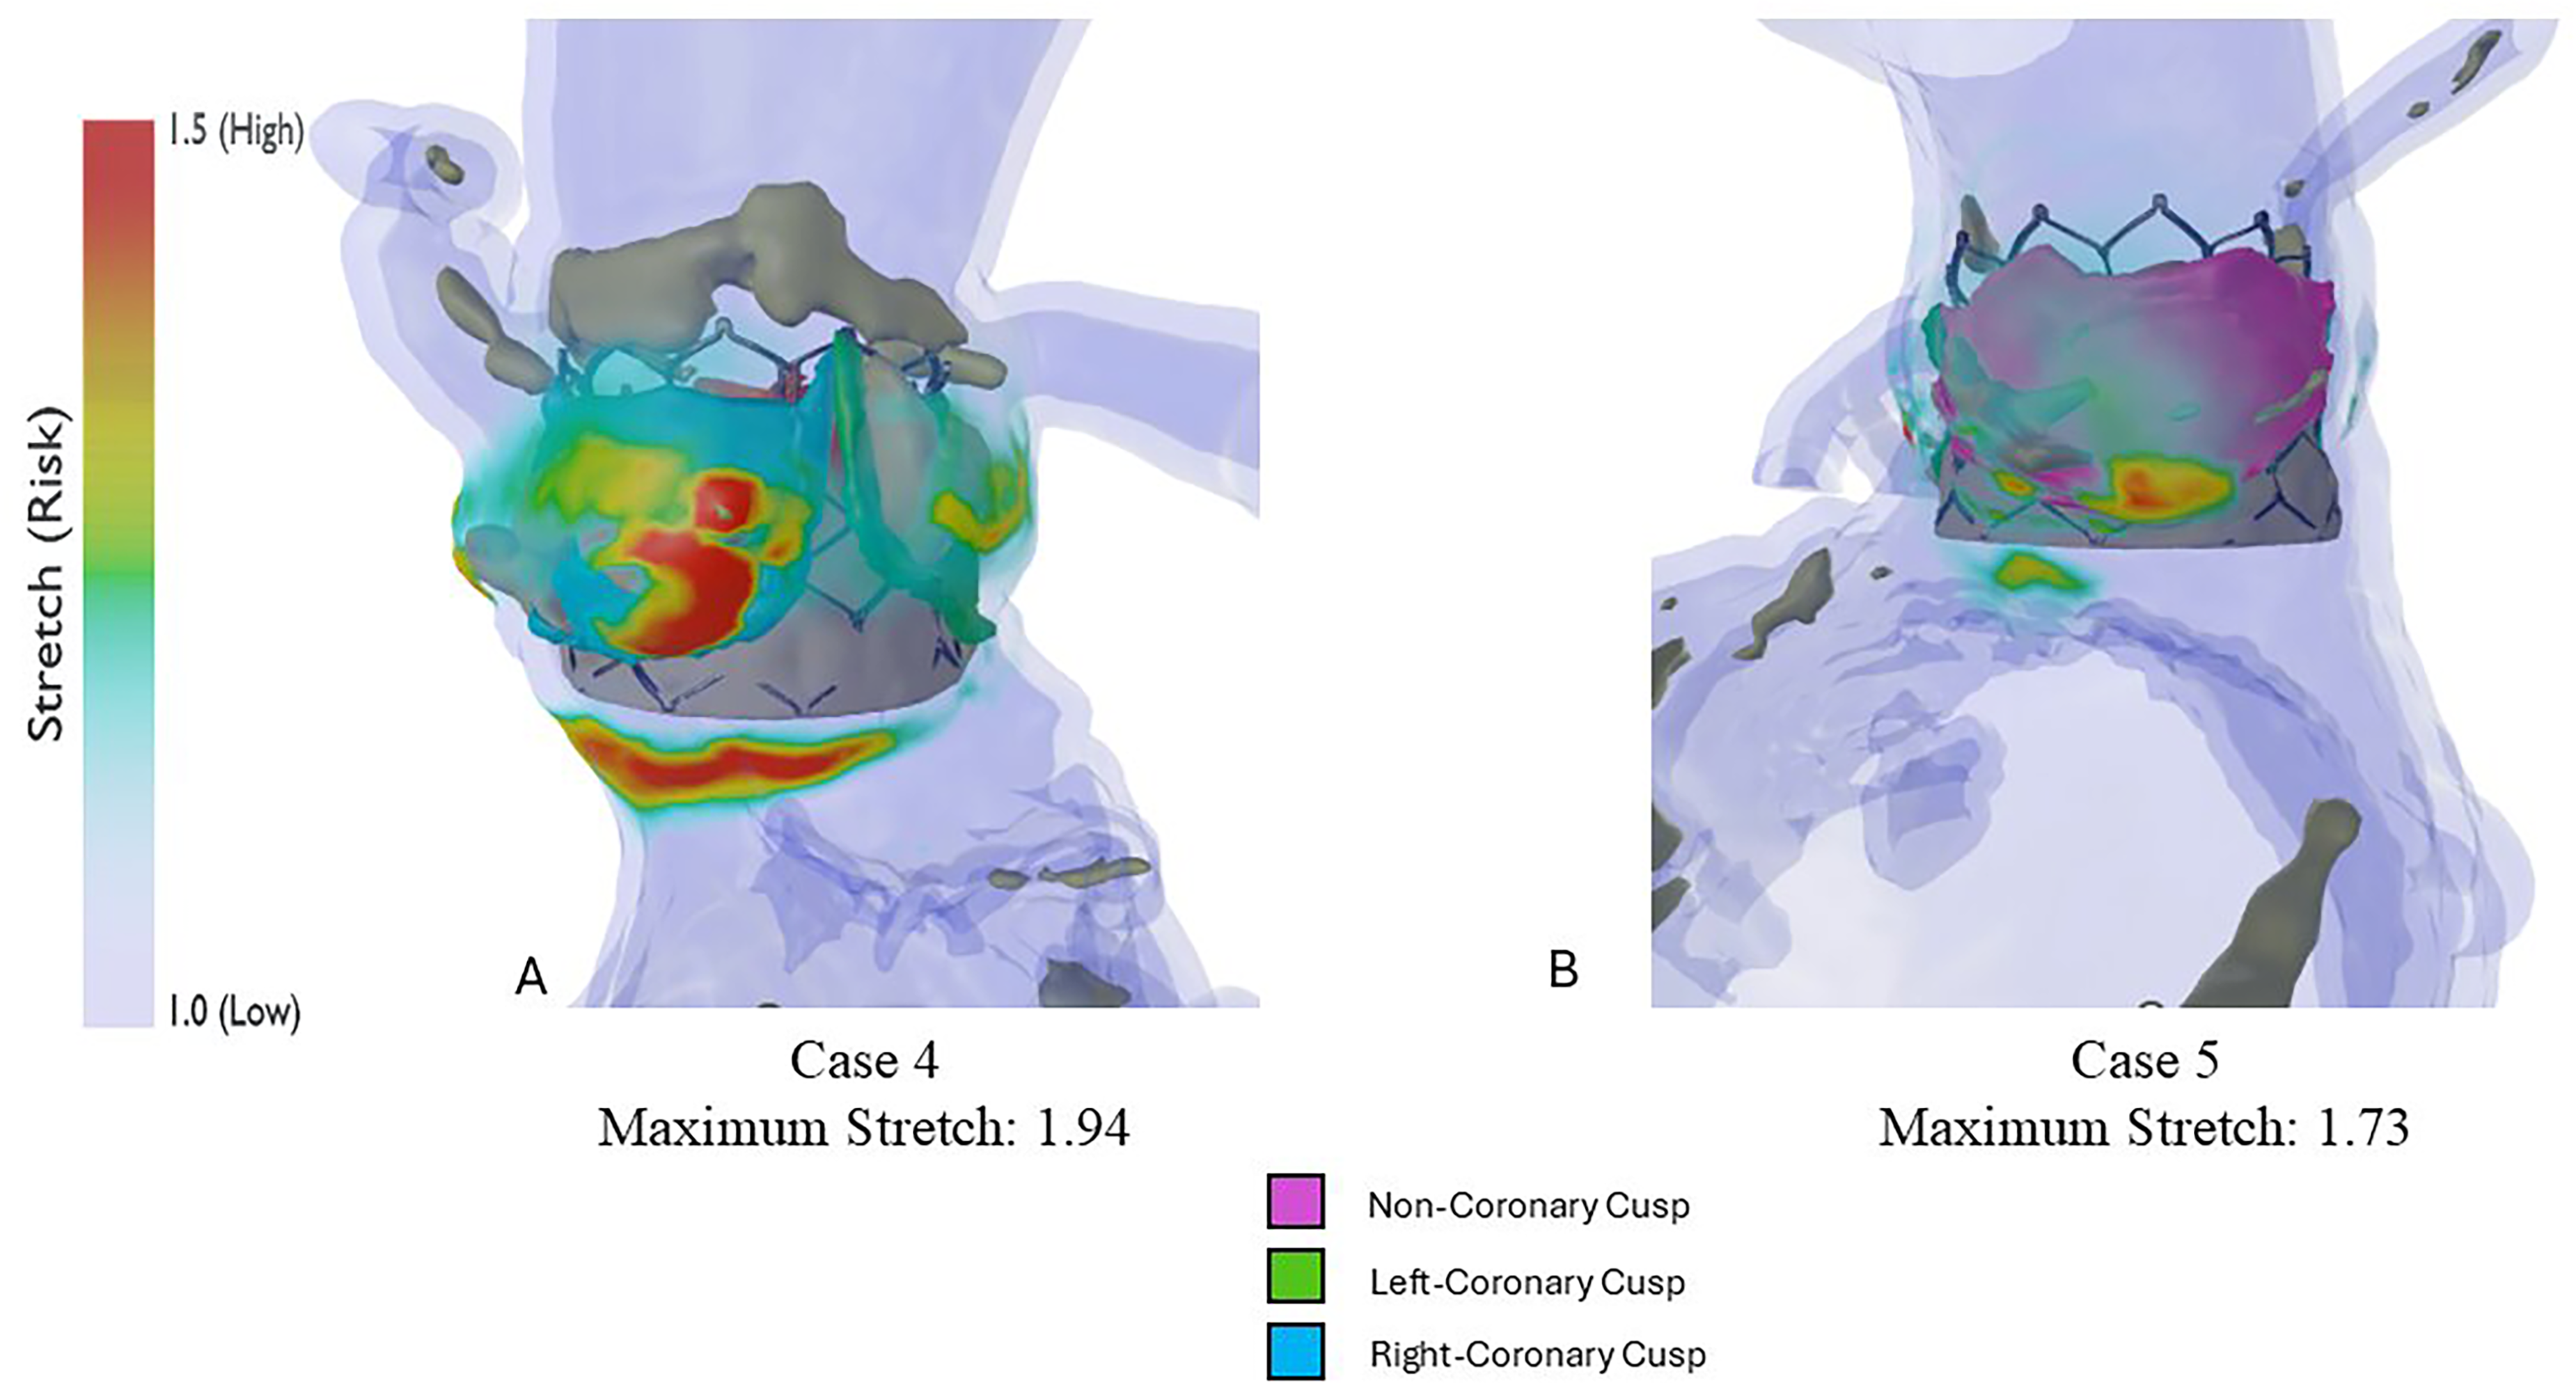
Positive aortic root rupture cases (tri-leaflet morphology): comparison of peak areal stretch distribution across 2 patient cases during tri-leaflet aortic valve TAVR valve deployment, highlighting the variation in tissue deformation risk. (A) Case 4 shows a maximum stretch value of 1.94, with significant stretch regions (red areas) located near the right coronary cusp, indicating an elevated risk of tissue deformation. (B) Case 5 presents a lower maximum stretch of 1.73, with a more diffuse distribution of stretch, primarily focused on the noncoronary cusp. The color scale on the left represents the stretch ratio, where 1.0 (blue) indicates minimal stretch, and 1.5 (red) indicates high stretch and potential rupture risk. The color-coded key highlights the cusps for visualization: the noncoronary cusp (purple), the left-coronary cusp (green), and the right-coronary cusp (blue).
Statistical Testing
All statistical analyses were conducted to assess the relationship between various clinical and demographic factors with patient outcomes. Continuous variables, such as age, calcium score, calcium volume, and oversizing, were compared across outcome groups using either a 2-sample t-test or a Mann-Whitney U test, depending on the results of assumption testing.
Normality of the data was assessed using the Shapiro-Wilk test, while homogeneity of variances was tested using Levene's test. For normally distributed variables with equal variances, a 2-sample t-test was performed to compare means between groups. In cases where normality or variance assumptions were violated, a Mann-Whitney U test was used to compare the medians between groups.
For categorical data, such as sex, associations between sex and outcome were evaluated using the Chi-square test. A contingency table was constructed, and the Chi-square test was applied to determine whether there was a statistically significant relationship between sex and outcome.
In addition to these tests, the diagnostic performance of variables (age, calcium score, calcium volume, and oversizing) in predicting outcomes was assessed using receiver operating characteristic (ROC) curves. Sensitivity and specificity were calculated across thresholds for each variable, and the area under the curve (AUC) was computed to quantify predictive ability. The optimal threshold for each variable was determined by maximizing the sum of sensitivity and specificity.
All analyses were conducted using Python, and statistical significance was considered at P-values <0.05.
Results
Demographics of Blinded Validation Patient Cohort
The 40 patients included in this study were consecutively deemed high risk for aortic root rupture via routine preprocedural TAVR planning and heart team discussion across multiple centers within Baylor Scott and White The Heart Hospital—Plano, over 5 years (2018-2022). BE THV simulations modeling the Edwards Sapien 3 family were conducted retrospectively, blinded to the clinical outcome of each case. The average age of the patients in the cohort was 79.9 ± 7.7 years. Sex data were available for 37 patients; 19 (51.4%) were male and 18 (48.6%) were female. The mean age between the 2 cohorts showed no significant difference (P = .928).
Derivation Cohort Threshold Determination
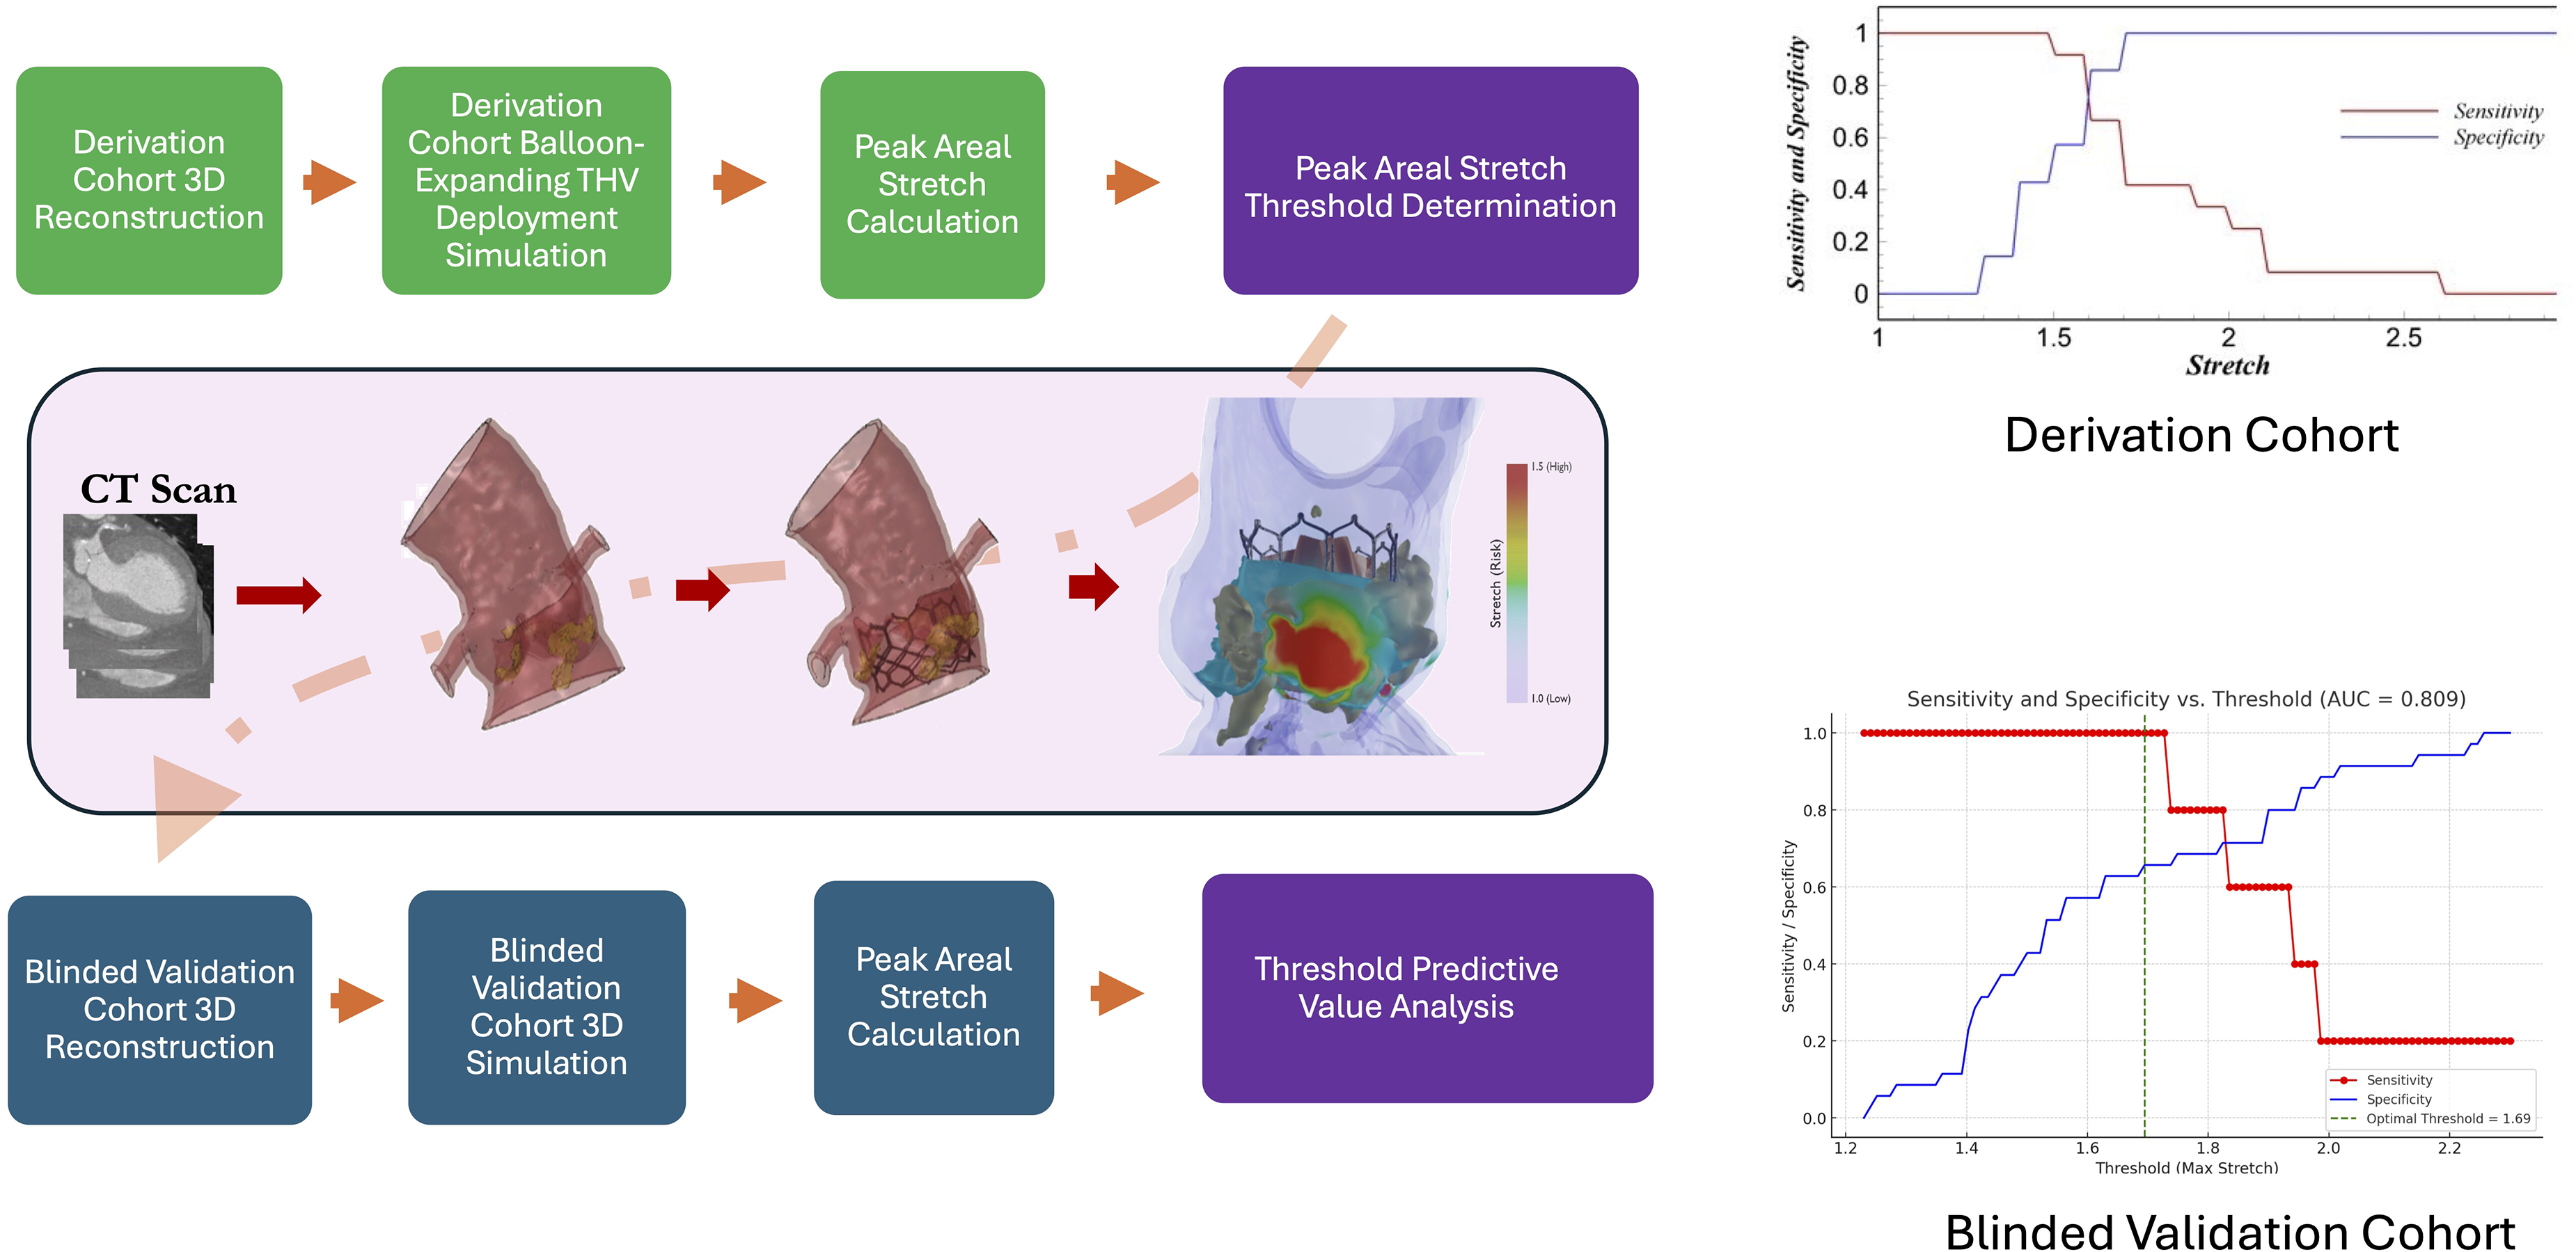
There was a statistically significant relationship found between the maximum stretch and incidence of aortic root rupture in the 26-patient DC (P = .011) (Figure 7A). Additionally, there was a statistically significant difference in average peak areal stretch in the left coronary sinus (LCS) for the positive and negative aortic root rupture patients (P = .050) (Figure 7A). Sensitivity and specificity plots demonstrated an AUC for the ROC of 0.87 for a maximum stretch threshold of 1.6 (Figure 7B and C). Therefore, in the BV arm of the study, a threshold of 1.6 or higher was used to predict high risk for an aortic root rupture.
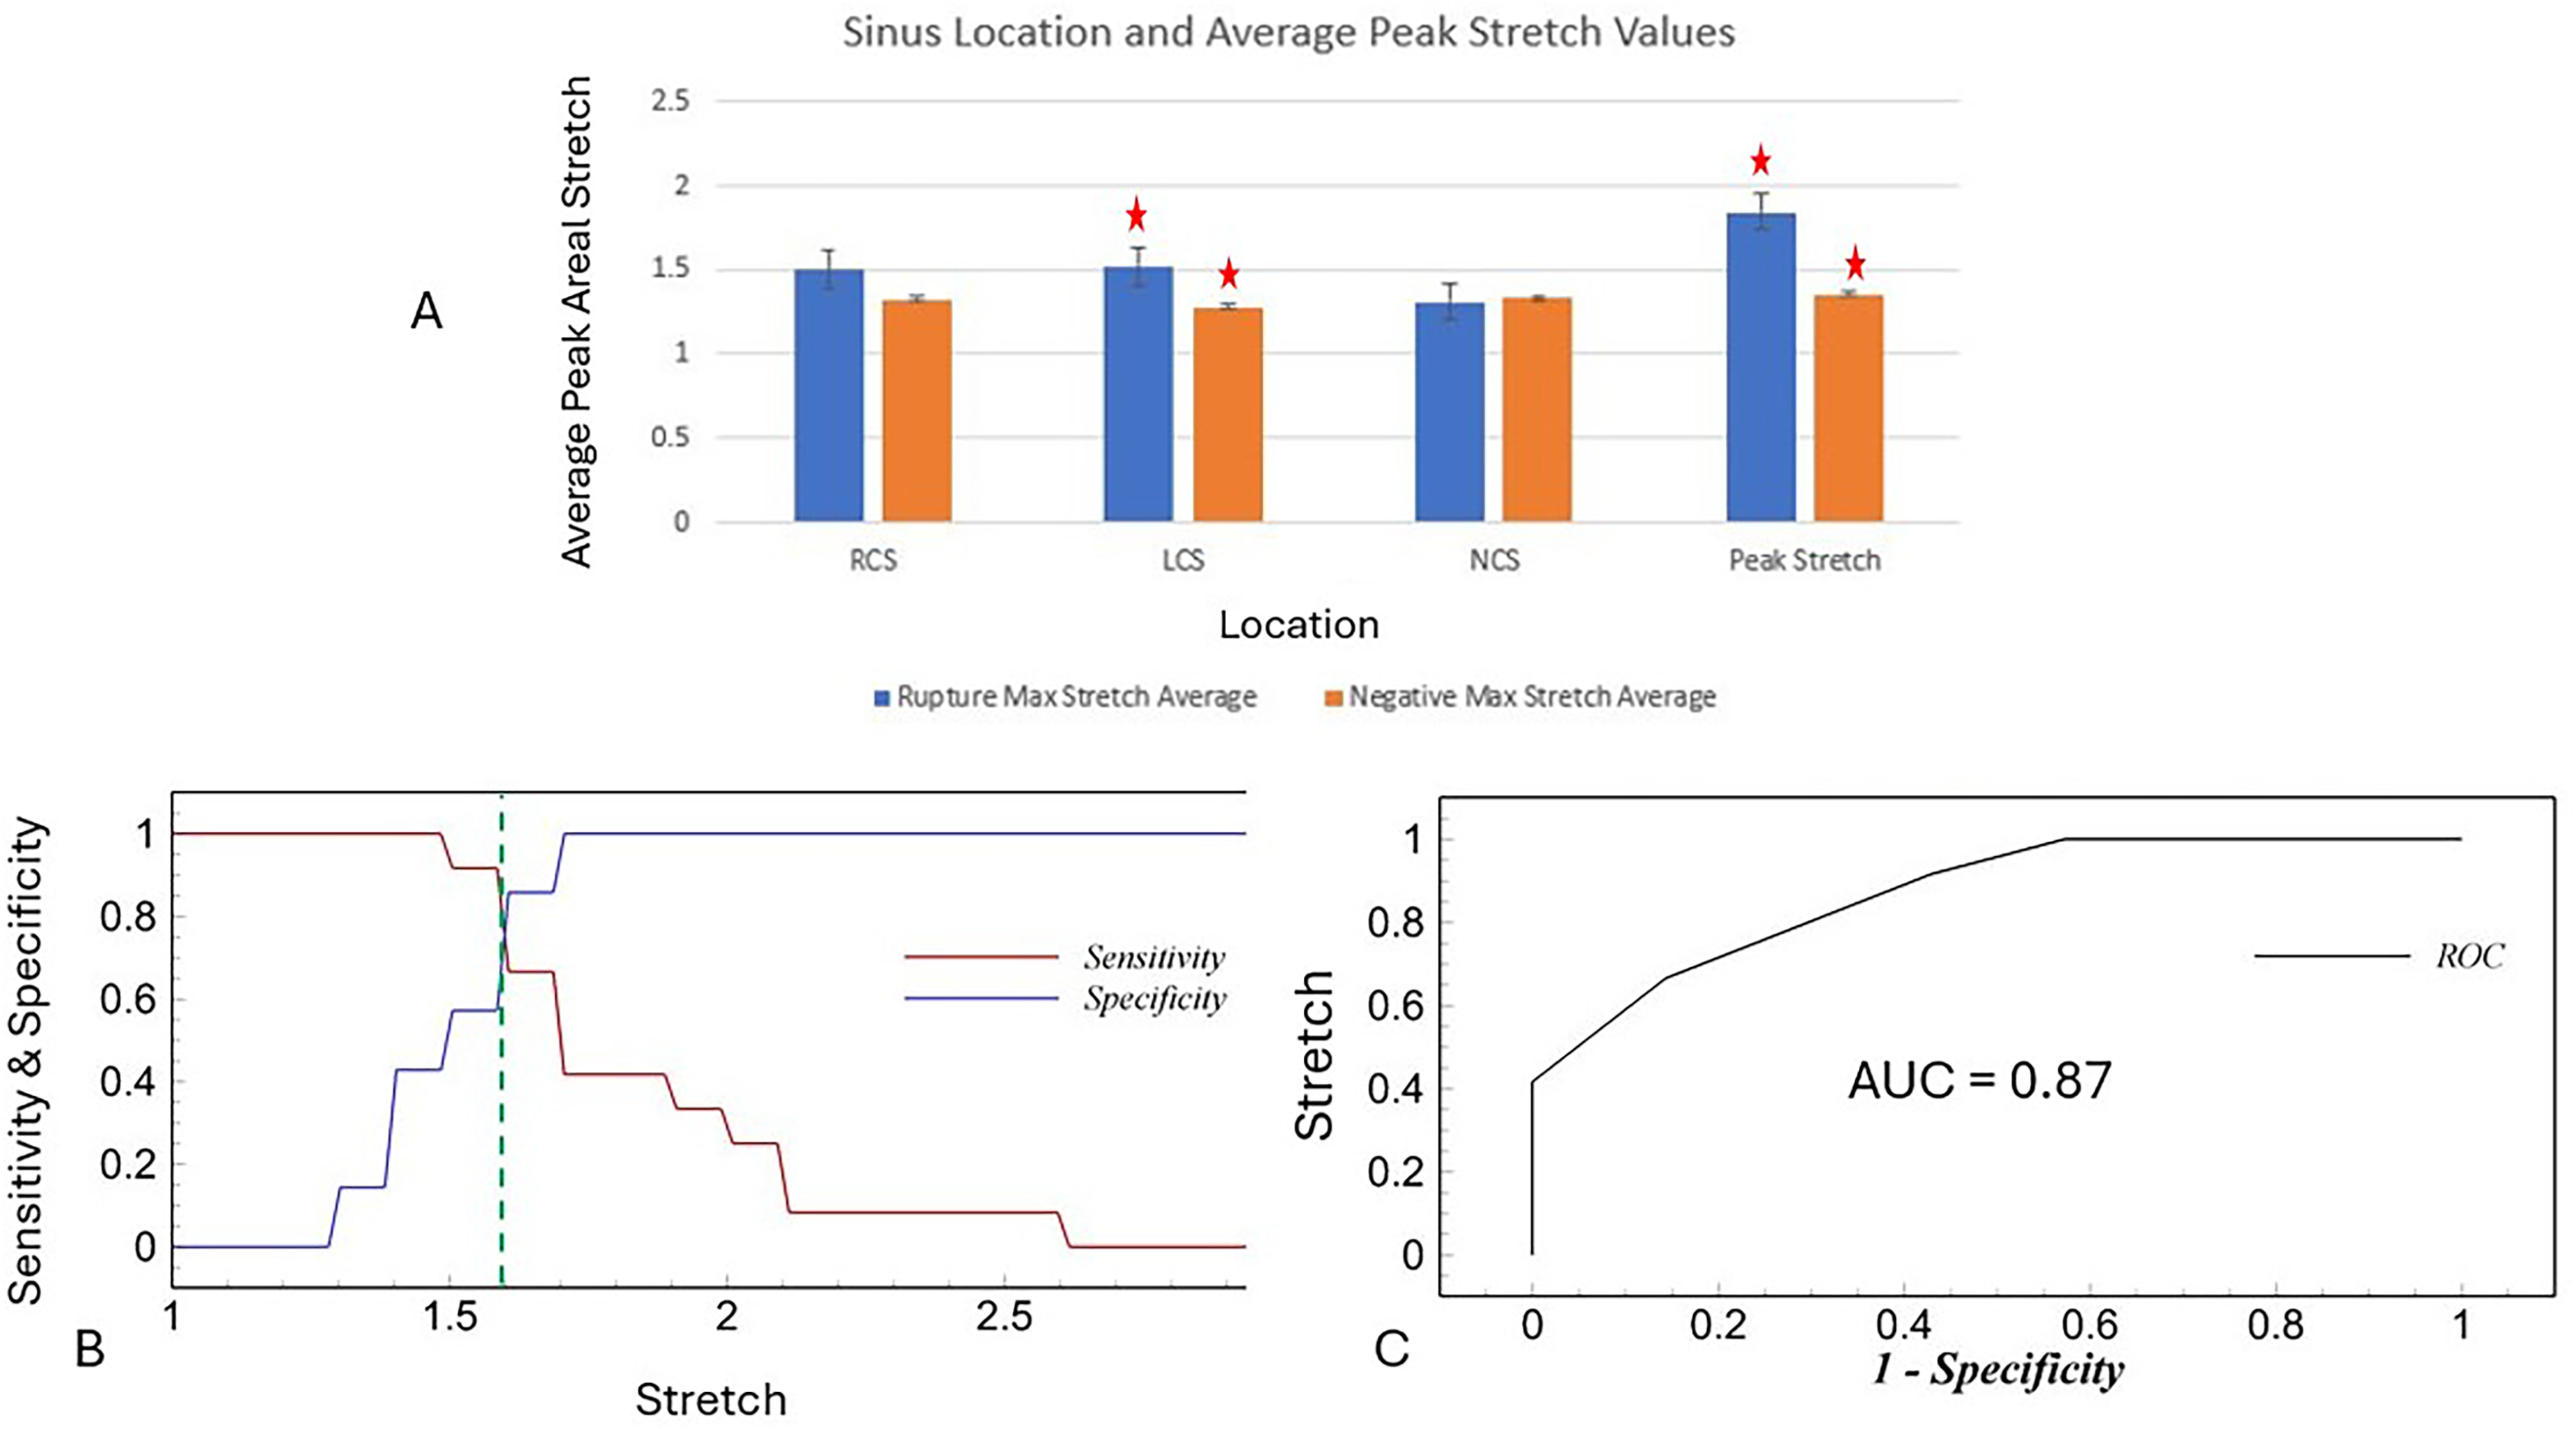
Analysis of peak areal stretch and its correlation with the risk of aortic root rupture. (A) Bar graph showing the average peak areal stretch values for rupture-positive and rupture-negative patients at 3 sinus locations: RCS, LCS, and NCS, as well as overall peak stretch. A statistically significant difference (P = .011) was observed in the maximum stretch between the 2 groups, with rupture-positive patients showing higher stretch values. A significant difference was also noted in the LCS between positive and negative rupture patients (P = .050). Red stars indicate statistically significant differences. (B) Sensitivity and specificity plot identifying a peak areal stretch threshold of 1.6, demonstrating an optimal balance for predicting rupture risk. The dashed green line marks the threshold with the highest combined sensitivity and specificity. (C) ROC showing an AUC of 0.87, indicating a high predictive accuracy of the peak stretch threshold in forecasting aortic root rupture. Abbreviations: AUC, area under the curve; LCS, left coronary sinus; NCS, noncoronary sinus; RCS, right coronary sinus; ROC, receiver operating characteristic.
Maximum Stretch Values in the Rupture Positive Cases Versus the Rupture Negative Cases for the Blinded Validation Cohort
The mean maximum stretch for the positive aortic root rupture cases was 1.956 ± 0.216. The mean maximum stretch for the negative aortic root rupture cases was 1.635 ± 0.284. The difference of the two medians was compared using a Mann-Whitney U test because the negative cohort violated the normality assumption used in a parametric t-test. The results indicated that there was a statistically significant difference between the maximum stretch values in the positive versus negative aortic root rupture cohort (P = .0285).
Calcium Score Differences in Rupture Positive Cases Versus Rupture Negative Cases for the Blinded Validation Cohort
The average calcium score for the negative rupture cohort was 2574.74 ± 1441.80 AUs compared to the positive cohort, which had a mean calcium score of 3388.8 ± 1710.12 AUs. A nonparametric Mann-Whitney U test was performed, and there was no statistically significant difference between the positive versus negative rupture cohorts (P = .347).
Predictive Ability for Aortic Root Rupture Risk Assessment—Results From the Blinded Validation Cohort
Conventional methods for patient-specific risk assessment, including age, calcium score, valve sizing, and calcium volume were analyzed to determine their predictive capabilities. Sensitivity and specificity were calculated for each variable, and ROC curves were generated to compute the AUC for each. The AUCs for age, calcium score, valve oversizing, and calcium volume were 0.477, 0.643, 0.697, and 0.634, respectively (Figure 8), reflecting the varying degrees of predictive performance of these traditional risk factors.
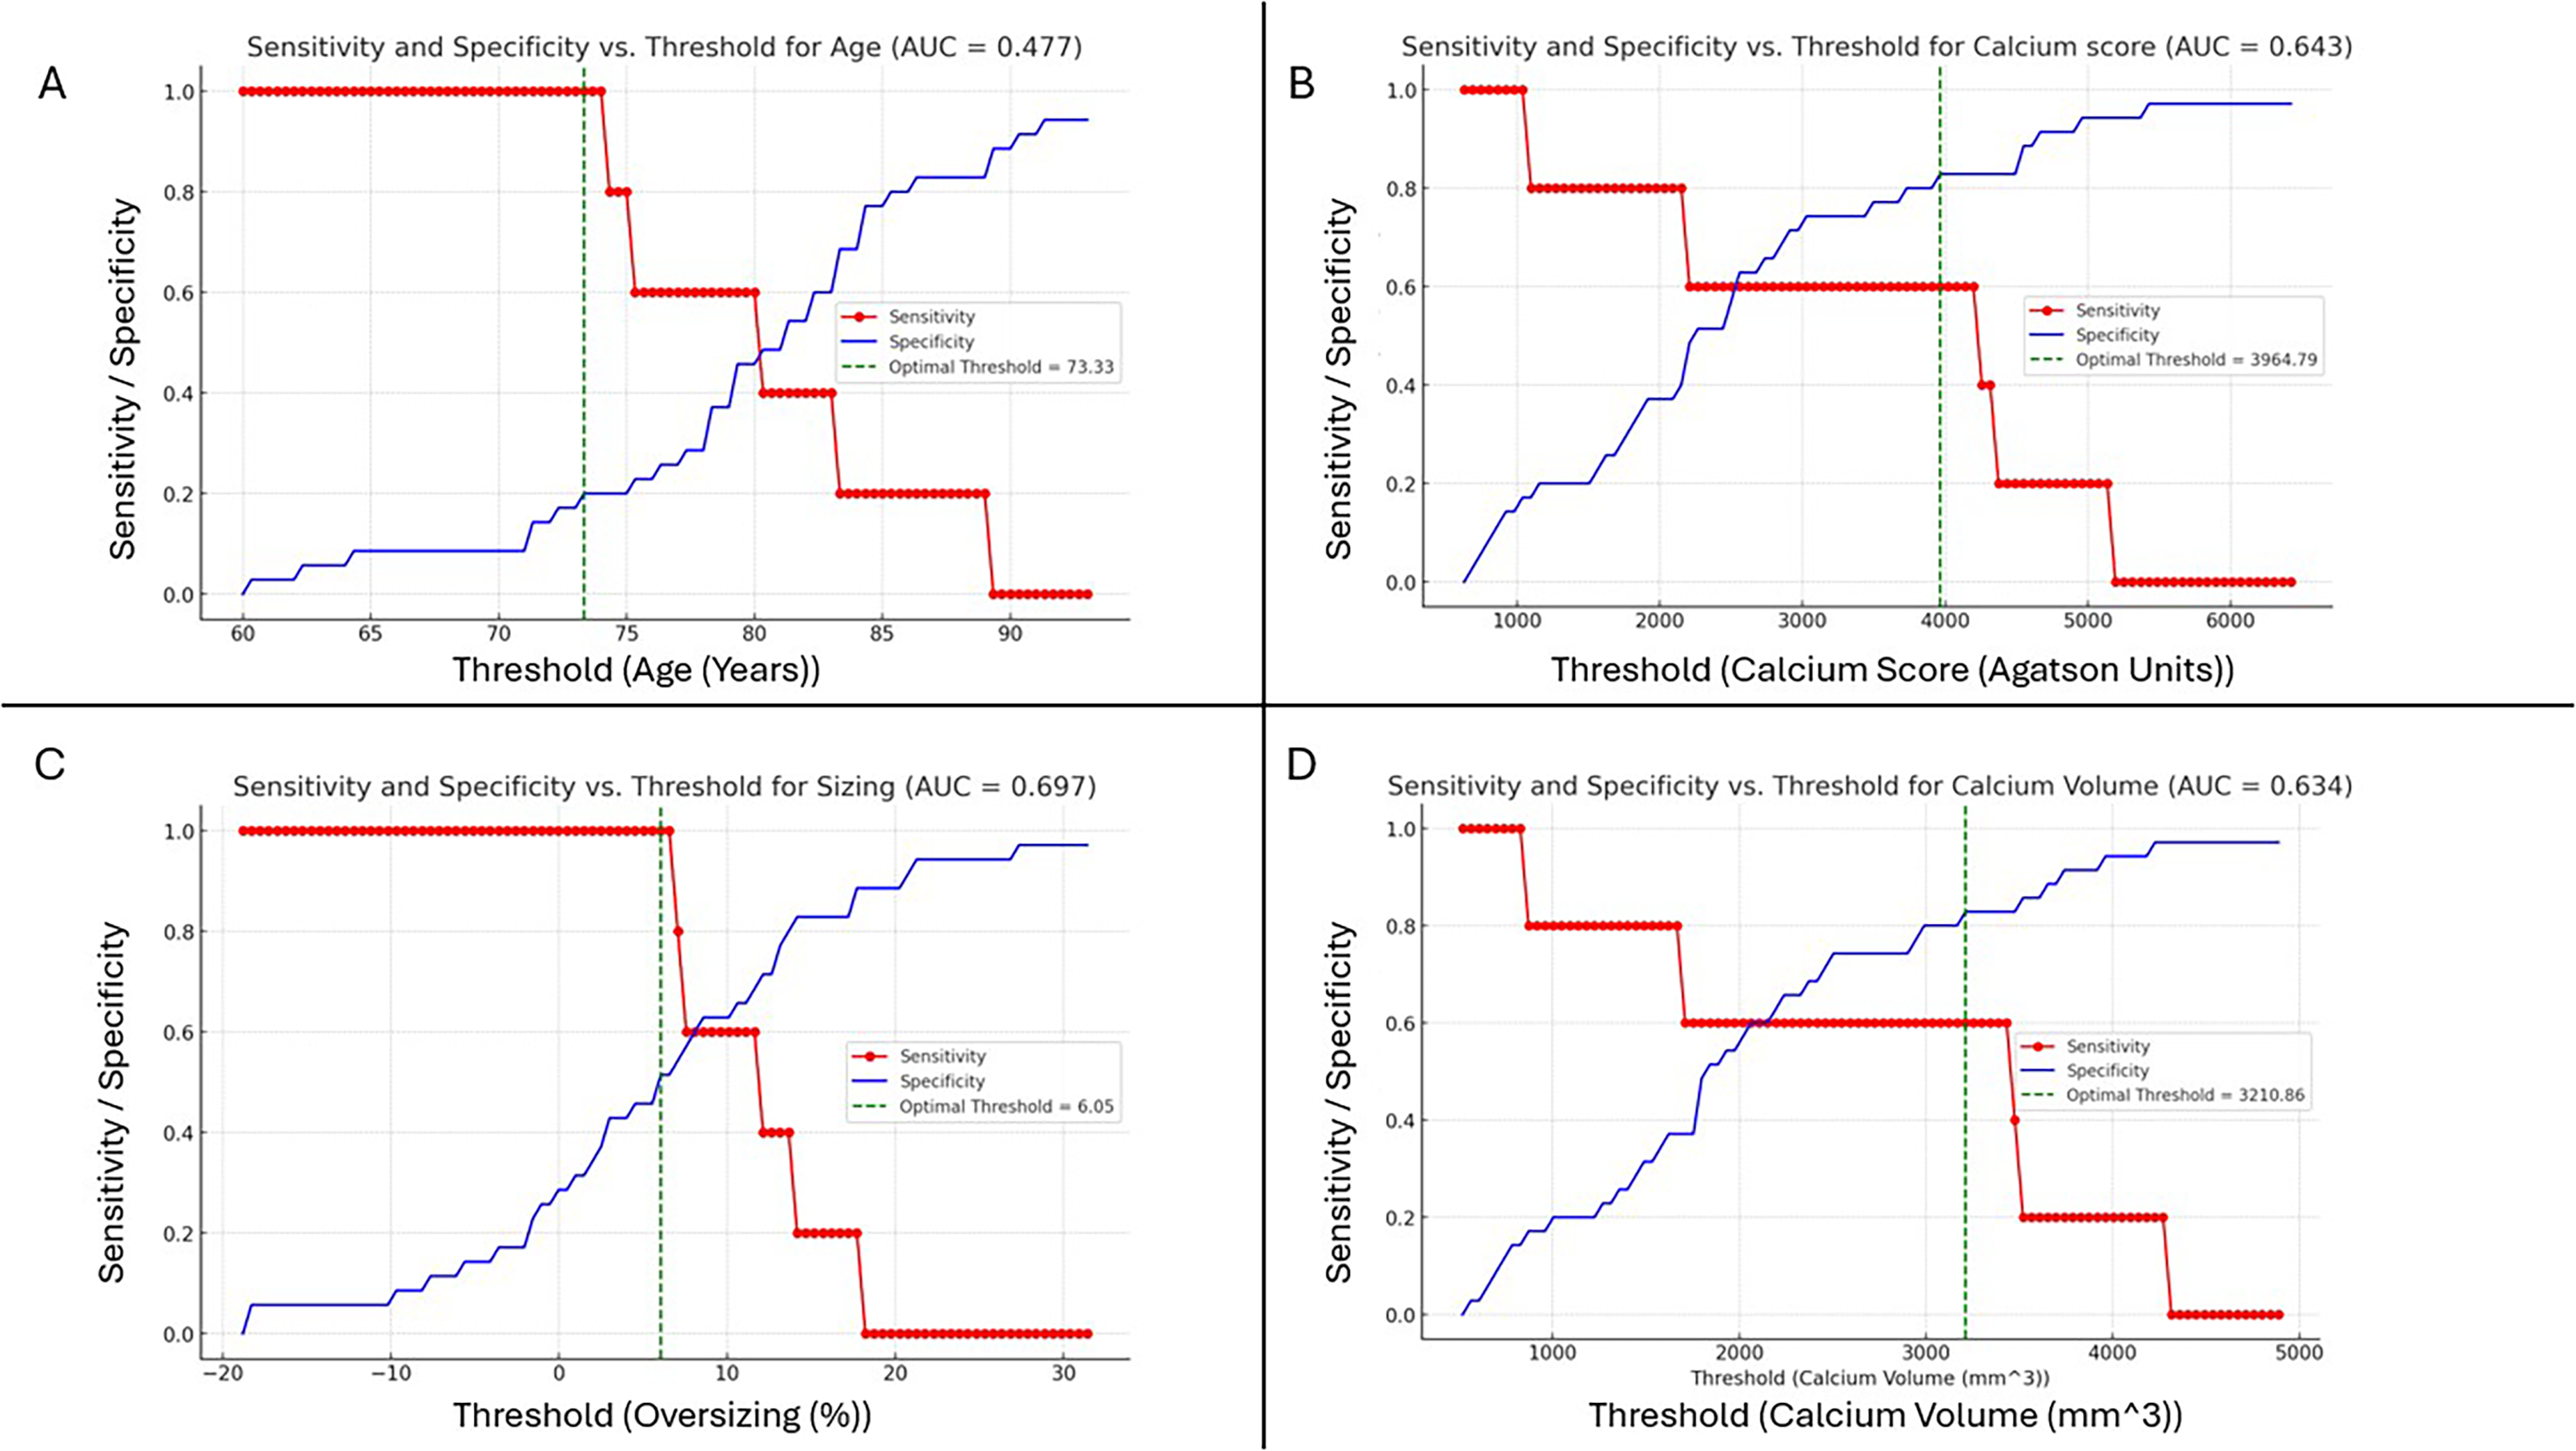
Sensitivity and specificity versus thresholds for various variables. This figure shows the sensitivity (red line with circles) and specificity (blue line with crosses) for different variables, plotted against their respective thresholds. The green dashed vertical line in each subfigure marks the optimal threshold that maximizes the combined sensitivity and specificity. The AUC values quantify the predictive power of each variable: (A) Age (AUC = 0.477)—age shows a low predictive power for the outcome in this dataset, indicating that it is not a strong predictor. (B) Calcium score (AUC = 0.643)—calcium score demonstrates moderate predictive ability for the outcome, with an optimal threshold yielding an AUC of 0.643. (C) Oversizing (AUC = 0.697)—oversizing is a fairly good predictor of the outcome, as shown by the AUC of 0.697. (D) Calcium volume (AUC = 0.634)—calcium volume provides moderate predictability, with an AUC of 0.634. Abbreviation: AUC, area under the curve.
In addition to these standard variables, the analysis was extended to include Maximum Stretch, a key factor in assessing the risk of aortic root rupture. The AUC for Maximum Stretch was calculated as 0.81 for the threshold of 1.6 obtained from the derivation cohort, indicating a strong predictive capability for identifying patients at heightened risk of aortic root rupture, although the optimal threshold for the Blinded Validation Cohort was determined to be 1.69 (Figure 9). These results demonstrate the combined value of both conventional clinical metrics and novel biomechanical factors in enhancing the accuracy of preprocedural risk assessments.
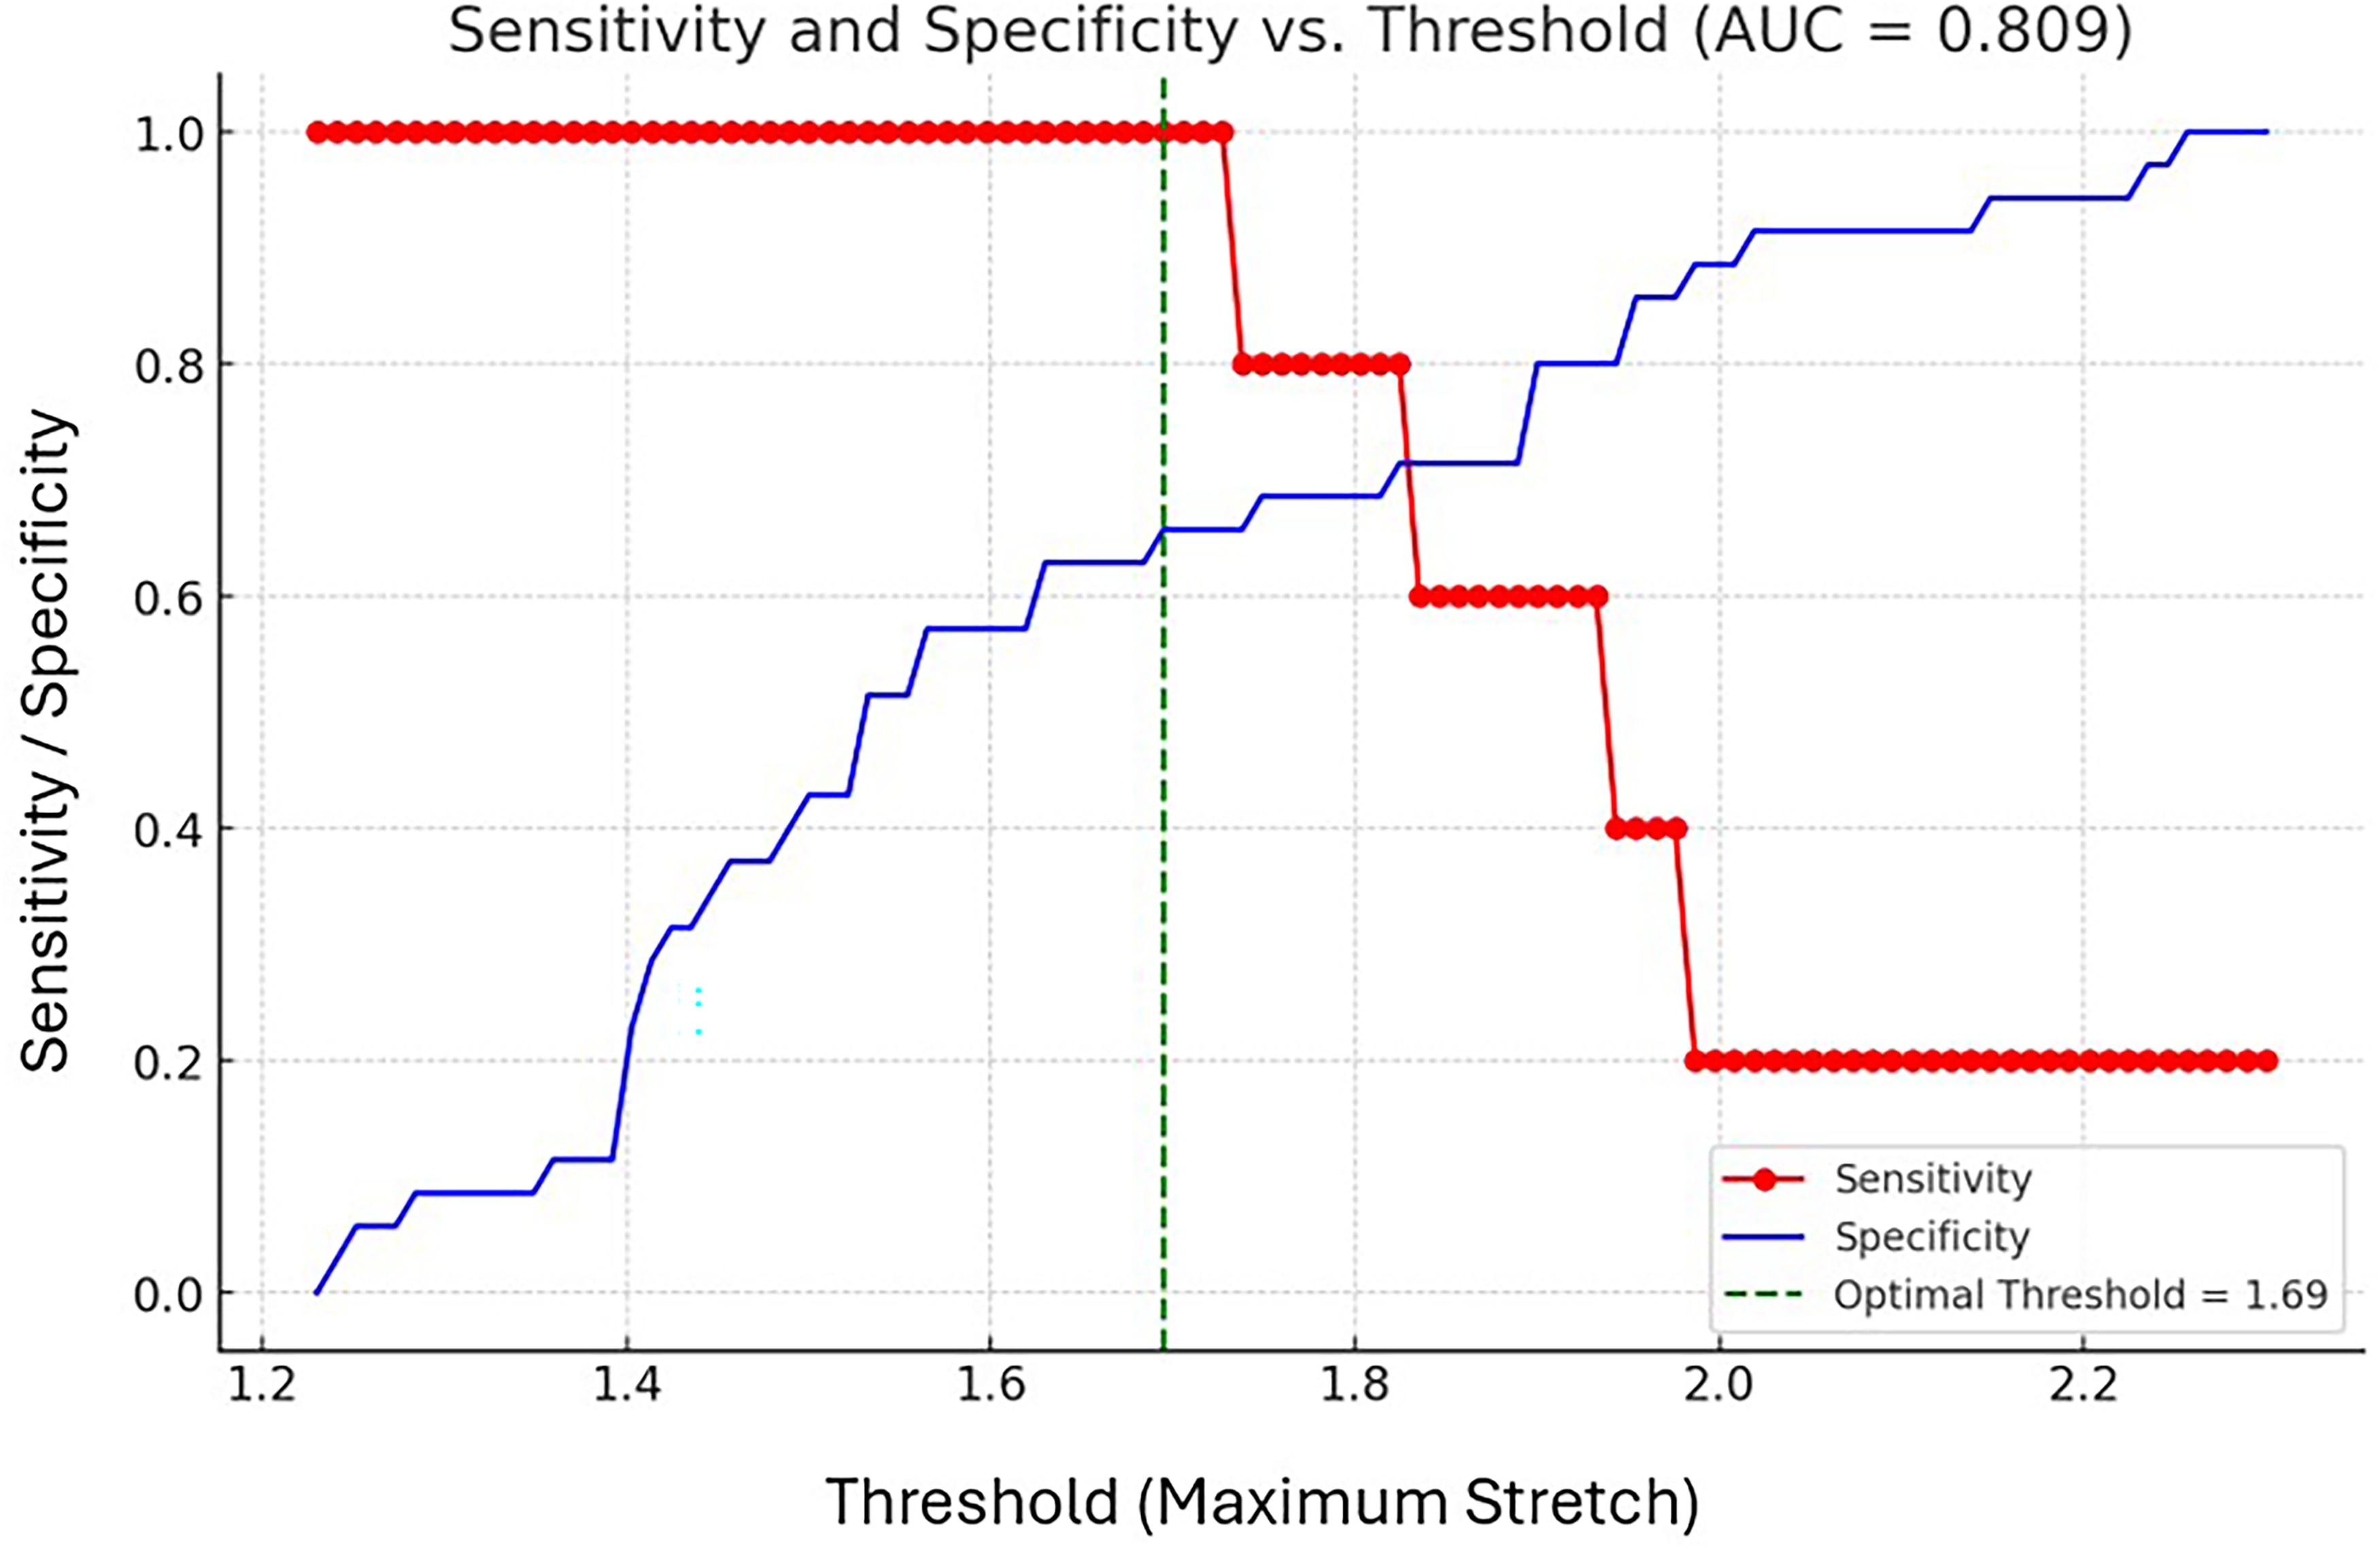
Sensitivity and specificity versus threshold for max stretch. This graph illustrates the relationship between the threshold values for Max Stretch and the sensitivity (red line with circles) and specificity (blue line with crosses) of predicting the outcome. The green dashed vertical line indicates the optimal threshold, which maximizes the combined sensitivity and specificity. The calculated AUC is 0.809, suggesting moderate predictive performance of the Max Stretch threshold for the given dataset. Abbreviation: AUC, area under the curve.
Discussion
This study aimed to evaluate the predictive potential of peak areal stretch for identifying patients at high risk of aortic root rupture during TAVR. A 2-phase approach was employed, starting with a derivation cohort of 26 patients to establish a peak stretch threshold of 1.6, which was then validated in a blinded cohort of 40 patients. Computational modeling was used to simulate BE valve deployment and quantify tissue deformation, with peak areal stretch calculated as a key factor. Results from the BV cohort demonstrated that peak stretch had a strong predictive capability for aortic root rupture, outperforming traditional risk factors such as calcium score, valve sizing, and age. This suggests that incorporating biomechanical factors like peak areal stretch could significantly improve preprocedural risk assessments and enhance patient selection for TAVR procedures.
The results of this study demonstrate that while conventional risk factors such as age, calcium score, valve oversizing, and calcium volume exhibit some predictive value in assessing patient outcomes, their performance is generally limited. The AUCs for these traditional metrics, 0.477 for age, 0.643 for calcium score, 0.697 for valve oversizing, and 0.634 for calcium volume, highlight the need for improved risk stratification methods. Although these variables have been widely used in clinical practice, they fail to provide the predictive power needed for more accurate patient-specific risk assessments, particularly in the context of aortic root rupture.
In contrast, Maximum Stretch emerged as a potentially more robust predictor (or discriminator) of aortic root rupture risk, with an AUC of 0.81 in the blinded dataset already deemed risky for rupture as per traditional factors by the heart team. Our study suggests that Maximum Stretch has improved predictive performance compared to the traditional clinical metrics currently in use. This suggests that biomechanical factors such as stretch, which capture the complex interplay between device deployment and patient anatomy, may play a critical role in improving risk assessment models. Although Maximum Stretch alone does not achieve an AUC of 1, it represents an improvement over conventional methods and warrants further investigation as part of an enhanced preprocedural planning strategy. Additionally, the threshold of 1.6 offers 100% sensitivity, ensuring that all cases of aortic root rupture are detected by the computational model, serving as a possible good negative predictor for stretch less than 1.6. This conservative cutoff provides clinicians with a “gray zone” of risk, where the model will predict potentially catastrophic rupture events. While this approach may lead to occasional false positives, the tradeoff is deemed acceptable given the life-threatening nature of aortic root rupture. The priority is to err on the side of caution, minimizing the risk of missing a rupture, even if it means predicting some cases that may not lead to complications. It should be noted that there was a difference in the optimal threshold between the Derivation Cohort (1.6) and the Blinded Validation Cohort (1.69). Although a threshold of 1.6 is clinically reasonable based on the discussion above, the difference in the 2 cohorts could be due to the small sample size present in each cohort, and the natural variability in aortic root morphologies. A larger verification and validation cohort would be needed to determine a threshold with more confidence.
In an effort to further refine the model's predictive capabilities, 2 machine learning models were also explored. A Random Forest algorithm was selected due to its ability to handle complex interactions between variables, its robustness to overfitting, and its effectiveness in managing both categorical and continuous data.13,14 However, despite these strengths, the model's performance was limited by significant class imbalance in the dataset, where one class (likely the negative outcome, class 0) dominated over the positive outcome (class 1). This makes logical sense as there were 35 negative aortic root rupture cases in the cohort and only 5 positive aortic root rupture cases. In imbalanced datasets, Random Forest models tend to favor the majority class, resulting in biased predictions, which diminishes their ability to capture minority class events such as aortic root rupture. Similarly, a logistic regression model was also tested, but both suffered the same issues due to class imbalance, leading to unreliable predictions for the minority class (class 1).
One particular challenge with logistic regression was its assumption of linearity between the input variables and the outcome, which is likely too simplistic given the complex nature of the relationships between features like “Maximum Stretch” and aortic root rupture clinical outcomes. Additionally, the use of a manually selected threshold (eg, 0.60) further exacerbated the problem by not optimizing the balance between precision and recall for minority class predictions. Furthermore, the small number of features used (age, sex, max stretch, and sizing) limited the model's overall predictive capacity, particularly since logistic regression does not naturally capture interactions or nonlinear relationships.
To address the class imbalance in the future, several techniques could be employed. Resampling methods, such as Synthetic Minority Oversampling Technique (SMOTE), could generate synthetic examples for the minority class, balancing the dataset, and reducing bias. 15 Alternatively, sampling the majority class could also help mitigate the imbalance, although it risks losing potentially valuable data from the majority class. Class weighting could be applied, where the model is penalized more heavily for misclassifying the minority class, helping to prioritize correctly identifying the underrepresented outcomes. 16 However, many of these advanced machine learning techniques require substantially more data to work effectively, which presents a challenge given the current dataset of only N = 40.
Despite these challenges, the strong predictive performance of Maximum Stretch suggests that it could be a valuable component in future risk models. Future work should focus on integrating biomechanical metrics such as Maximum Stretch with traditional clinical factors to develop a more sophisticated model that can handle nonlinear relationships and class imbalance effectively. By doing so, it may be possible to create a predictive model with greater accuracy than either traditional metrics or biomechanical factors alone, ultimately leading to better patient outcomes.
Additionally, the total time required to perform the simulation and extract the Maximum Stretch metric was less than 2 h per patient, reflecting the computational efficiency of the modeling framework. This short processing time allows simulation results to be generated and reviewed during the preprocedural planning phase of a patient's TAVR procedure, supporting potential clinical integration of the method.
Interestingly, Figure 7 demonstrates that Maximum Stretch in the LCS was significantly higher in cases of aortic root rupture compared with nonrupture cases, whereas no statistically significant differences were observed in the right coronary sinus (RCS) or noncoronary sinus. These findings suggest that the tolerance to stretch may differ between sinuses, with the LCS potentially being more sensitive to excessive deformation. This observation is clinically relevant given the catastrophic consequences of aortic root rupture in the LCS, where disruption of the aortic wall may lead to rapid blood accumulation within the pericardial space and acute cardiac tamponade.
Limitations
The small sample size is a limitation, as aortic root rupture is a rare occurrence in TAVR (≈1%). The derivation cohort was constructed from cases collected across multiple institutions and included all available rupture events (n = 12), with nonrupture cases randomly selected from prospective cases contributed by multiple centers. While this strategy reduces systematic bias, it may not eliminate selection bias, particularly if site-level differences in imaging quality, procedural practice, or patient characteristics influenced case contribution. In addition, because the cohort was assembled retrospectively, uniformity of data collection and adjudication of rupture events may vary. These factors, combined with the limited number of rupture cases, mean that the dataset may not capture the full clinical heterogeneity of patients at risk and may limit the generalizability of our findings to broader populations. Furthermore, the rupture cases studied were limited to calcium-induced sinus stretch during BE THV deployment, and thus other mechanisms of rupture (eg, stent-frame injury, postdilation, LVOT calcium) were not represented. Larger, prospectively collected, and more balanced datasets will be necessary to validate these findings and further refine the framework toward location-specific thresholds, especially given the observed dependency on stretch values averaged by peak location. Nevertheless, the current cohort represents a pragmatic first step in using simulation tools to understand the biomechanics of rupture and predict them preprocedurally during the planning phase of TAVR.
Additionally, records of the exact rupture location were not consistently documented for each case. As such, precise localization of rupture events was not available across the cohort, limiting the ability to directly correlate sinus-specific stretch thresholds with observed rupture locations.
IRB Statement
The Institutional Review Board of the Piedmont Heart Institute approved the study protocol and publication of data; approval number 1962255-2, approved on October 1, 2024. Patient written consent for the publication of the study data was waived by the Institutional Review Board because the study involved only retrospective cases.
Footnotes
Funding
The authors received no financial support for the research, authorship, and/or publication of this article.
Declaration of Conflicting Interests
The authors declared the following potential conflicts of interest with respect to the research, authorship, and/or publication of this article: Dr Becker reports having patents filed on computational modeling for structural heart procedures and reports a relationship with DASI Simulations that includes: consulting or advisory fees. Additionally, Dr Becker also has patents filed and issues on 3-dimensional computational modeling for structural heart procedures. Dr Dasi reports having patents filed on 3-dimensional computational modeling for structural heart procedures. Dr Dasi is the CTO of DASI Simulations, LLC. Dr Szerlip is a consultant and speaker for Edwards Life Sciences, Medtronic, Abbott, and Boston Scientific. Dr Thourani is on the advisory board or in research for Edwards Lifesciences, Artivion, Abbott Vascular, AtriCure, JenaValve, Medtronic, Dasi Simulations, Trisol, Excision Medical, Tricares, and Pi-Cardia. Dr Pradeep Yadav reports a relationship with Edwards Lifesciences that includes: consulting or advisory and speaking and lecture fees; with Abbott Vascular that includes: consulting or advisory and speaking and lecture fees; with Boston Scientific that includes: consulting or advisory; with DASI Simulations that includes: equity or stocks; with Edwards Lifesciences that includes: funding grants; with Abbott Vascular that includes: funding grants; with Boston Scientific that includes: funding grants; with Medtronic that includes: funding grants; with JenaValve Technology that includes: funding grants; with Trisol Medical that includes: funding grants; with HighLife that includes: funding grants; with Innovalve that includes: funding grants; and with CroiValve that includes: funding grants. Dr Venkateshwar Polsani reports a relationship with DASI Simulations that includes: board membership. Dr Al-Azizi: proctor/consultant Edwards Lifesciences, consultant/Advisory Board Medtronic, consultant Boston Scientific, and Speaker Bureau Philips.
Declaration of Generative AI and AI-Assisted Technologies in the Writing Process
During the preparation of this work the authors used ChatGPT in order to check for grammatical errors. After using this tool/service, the authors reviewed and edited the content as needed and take full responsibility for the content of the publication.