
Abstract
South Africa's electricity grid has long depended on coal for over 85% of its power, leading to severe load shedding until mid-2024 and sparking rapid growth in rooftop solar photovoltaic (PV) systems. Rooftop solar capacity jumped from around 1000 MW in 2022 to about 7300 MW by late 2025, as households and businesses sought greater energy security. This study uses System Dynamics modelling and Causal Loop Diagrams to examine the key feedback loops shaping solar PV adoption, including the historical role of power outages, the effects of weather changes, and differences in access across income groups and regions. The results reveal reinforcing cycles where power cuts strongly encouraged people to install solar, cutting grid demand and reducing carbon dioxide emissions by millions of tons each year as capacity grew. However, cloudy weather can reduce solar output, and the high cost of installation (typically R80,000 for 5 kW grid-tied system to R200,000 for 10 kW systems with storage) makes it much harder for rural households to adopt solar, with adoption rates estimated at 5–10% or lower in rural/low-income areas compared to 50–60% proxies in high-income urban areas.
Ongoing revenue losses for municipalities from lower grid usage also contribute to higher electricity tariffs, which hit poorer households hardest. Even with load shedding largely suspended since mid-2024 and no recorded major incidents in 2025–2026, adoption continues due to long-term cost savings and energy independence. The study recommends stronger rural subsidies (aiming for 50% coverage), better grid upgrades to support rural areas, and improved storage options for more reliable power. These steps would help achieve the Just Energy Transition Partnership's goal of net-zero emissions by 2050 in a fair and inclusive way. Overall, this work shows how system dynamics can guide equitable renewable energy shifts in countries still heavily reliant on coal.
Introduction
Problem statement
South Africa's energy sector is heavily reliant on coal, which powers more than 85% of the national grid. Aging infrastructure caused record levels of load shedding in 2022 (CSIR, 2023; IEA, 2023). Since 2007, Eskom has applied sharp electricity tariff increases to address funding shortfalls from infrastructure backlogs, operational challenges, and rising costs. From 2007 to 2024, tariffs rose by approximately 937% cumulatively, far outpacing inflation (around 155% over the same period). This means electricity prices increased about six times faster than general consumer prices in real terms (Moolman, 2024). These rising tariffs, together with increasingly frequent power cuts, have pushed many households and industries to adopt rooftop solar photovoltaic (PV) systems for greater energy security and cost control. As a result, installed rooftop solar capacity surged from around 1000 MW in 2022 to about 7300 MW by late 2025 (Moneyweb, 2025; SAPVIA, 2024). This growth aligns with the goals of the Just Energy Transition Partnership (JETP), which targets net-zero emissions by 2050 as the solar adoption eases on municipal electricity dependence (DMRE, 2019; Smarte Anekwe et al., 2024). Post-apartheid policies focused on expanding access to electricity and remained dependent on coal energy with no focus on integrating other sources (Baker, 2016).
South Africa's electricity value chain is structured as follows: Eskom generates most of the power (around 95% of national supply), transmits it via high-voltage networks, and distributes it directly to some customers or sells it in bulk to municipalities. Municipalities then redistribute electricity to end users (households, businesses, and others) and apply a markup on the bulk purchase price to generate revenue and profit. This surplus, historically significant, helps cross-subsidize other municipal services like water, sanitation, roads, and waste management and as a result forms a key part of local government funding models (OECD, 2011; Stats SA, 2023). However since the rising rooftop solar adoption which have reduced grid electricity purchases from municipalities, revenue streams have reduced and potentially forcing tariff hikes or cuts to other services. This sudden change has disproportionately affected poorer households who are unable to afford household solar (BusinessDay, 2023; Monyai et al., 2023).
Solar potential in South Africa
In 2011, the Renewable Energy Independent Power Producer Procurement Programme (REIPPPP) outlined a plan to accelerate renewable energy development, though progress was hindered by high upfront costs (Edkins et al., 2010; Pegels, 2010). Despite having some of the highest solar irradiation levels globally, South Africa still faces persistent social inequality, particularly in energy access where urban areas benefit far more from reliable electricity and emerging renewable options, while rural communities face chronic barriers due to grid limitations and infrastructure challenges (Edkins et al., 2010; Global Solar Atlas, 2024).
According to the South African Department of Mineral Resources and Energy (DMRE), South Africa boasts abundant sunshine, with most areas averaging more than 2500 h of sunshine annually. The average solar radiation level estimated to range from 4.5 to 6.5 kWh/m2 per day. Compared to other regions, South Africa enjoys a high annual 24-h global solar radiation average of about 220 W/m2, surpassing the United States with 150 W/m2 and Europe and the United Kingdom with approximately 100 W/m2. This places South Africa's local solar resource among the highest globally and presents a significant opportunity for investment in solar energy (DMRE, 2024; Global Solar Atlas, 2024).
As shown on Figure 1, South Africa has an abundance of sunlight, making solar energy a highly viable and accessible renewable resource. The country has seen a significant increase in solar energy installations in both utility-scale photovoltaic (PV) projects and concentrating solar power (CSP). The solar energy sector has helped expand access to electricity and facilitated the use of rooftop solar panels for residential and commercial applications (Akinbami et al., 2021). This rapid expansion of solar PV, particularly rooftop systems driven by persistent load shedding and energy security needs, demonstrates the technology's growing impact on reducing grid reliance, lowering household electricity costs, and supporting emissions reductions in a coal-dominant system. These exceptional solar resources underscore the potential for South Africa to lead in renewable energy adoption on the continent, particularly through decentralized rooftop systems that address historical load shedding and energy access inequities.
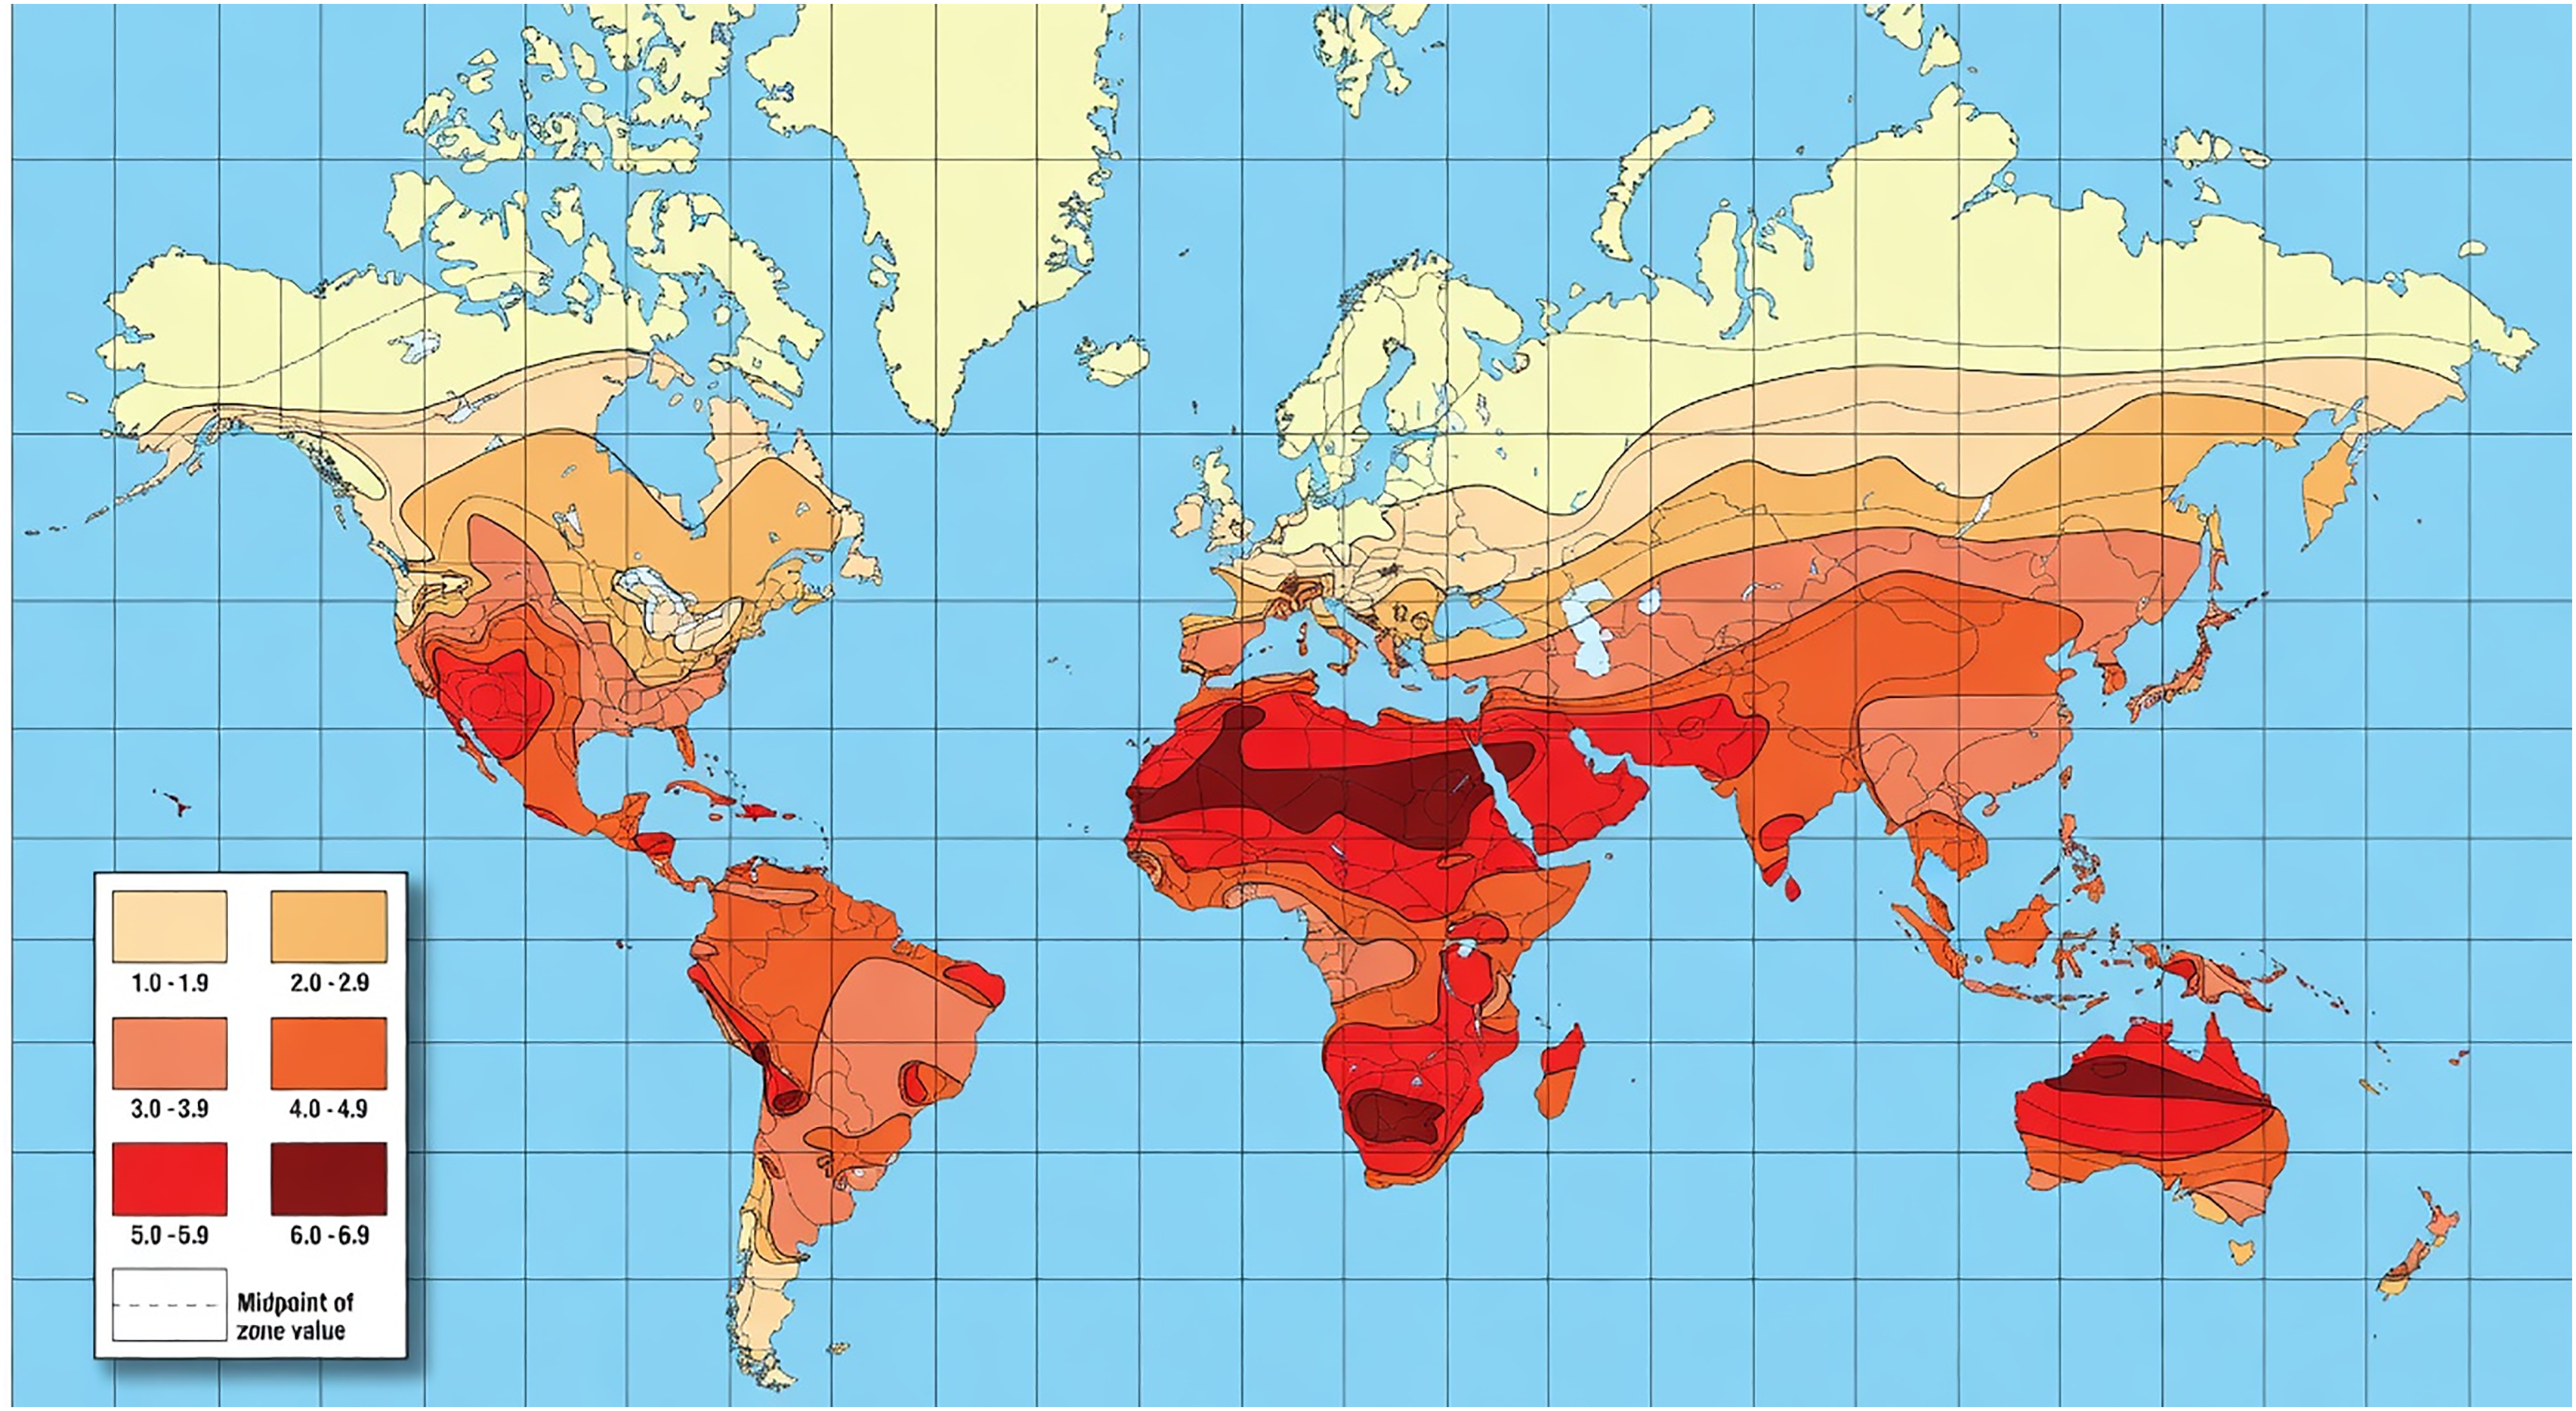
Universal solar potential, (Global Solar Atlas, 2024).
Yet realizing this potential requires overcoming barriers such as grid infrastructure limitations, skills shortages, and equitable distribution of benefits to rural and low-income communities. This study uses System Dynamics (SD) modelling to quantify feedback loops driving rooftop solar PV adoption for self-reliance. It addresses three objectives: (1) to model the impact of load shedding (as a historical representation of national power supply loss) on solar uptake, (2) to assess weather-related constraints on PV reliability, and (3) to evaluate socio-economic barriers to equitable adoption. By mapping these dynamics, the study proposes policies to support South Africa's Just Energy Transition Partnership (JETP) net-zero target by 2050. The study aims to contributes to sustainable energy solutions for coal-dependent developing economies.
Literature review
System Dynamics (SD) and Causal Loop Diagrams (CLDs) have been increasingly applied to understand the complex, feedback-driven nature of energy transitions, particularly in contexts involving policy, consumer behaviour, and grid integration (Mathibedi et al., 2025; Moumouni, 2014; Riva and Colombo, 2020). For instance, causal loop modelling has explored residential solar and battery adoption dynamics, highlighting reinforcing loops from consumer motivations (such as energy independence) and balancing loops from grid impacts or costs. SD models have assessed rooftop PV diffusion in developing and emerging contexts, incorporating technology diffusion patterns, policy incentives, and barriers like affordability (Kelly et al., 2020; Zahedi Rad et al., 2023).
In energy transitions, SD has modelled long-term effects of PV integration, including feedback from variable renewables on grid stability and equity. Although existing research has reviewed barriers to renewable energy adoption in South Africa and other African contexts, no prior work has employed System Dynamics to analyse the dynamics of rooftop solar PV uptake specifically driven by power shortages in South Africa. This study addresses this gap by examining key local feedback loops, where historical load shedding acts as a primary driver of adoption, weather variability serves as a balancing influence on system reliability, and persistent socio-economic inequities reinforce unequal access across regions and income groups. Comparative international examples such as Germany's subsidy-driven rural adoption and Kenya's rural programs are illustrative but not modelled here; full comparative SD is suggested for future work.
Methodology
Research design and rationale
To better understand the role of solar energy in this transition, we use SD to explore the balancing effect that weather has on solar power reliability, as well as the impact of load shedding on solar adoption. SD suits complex systems with feedback loops (Meadows, 2008; Morcillo et al., 2018). It tracks trends like outages driving solar uptake or weather affecting PV output (Laimon et al., 2022; Mwanza and Ulgen, 2020a). The research flow is as follows: (1) Data collection from Eskom/CSIR/SAPVIA reports and policy documents; (2) Development of CLDs identifying key loops; (3) Formulation of stock-flow equations; (4) Calibration to historical data (2022–2025); (5) Sensitivity analysis and scenario testing; (6) Interpretation of equity and policy implications.
SD is a methodology for understanding complex, dynamic systems through feedback loops, stocks, and flows, ideal for analysing long-term energy transitions (Meadows, 2008). Causal Loop Diagrams, a key tool in SD, help us visualize how different factors influence each other over time through reinforcing and balancing feedback loops (Sterman, 2014). We chose SD and CLDs for this analysis because South Africa's energy transition is shaped by multiple interconnected elements, including load shedding, solar adoption, weather variability, equity, and policy decisions.
By mapping these relationships, CLD highlight crucial dynamics, such as how frequent load shedding accelerates solar adoption (a reinforcing loop) and how weather fluctuations limit solar power output (a balancing loop). Unlike traditional linear models, SD emphasizes the role of feedback in shaping long-term sustainability, making it a powerful tool for understanding and planning energy transition (Laimon et al., 2020; Morcillo et al., 2018; Mwanza and Ulgen, 2020b).
SD modelling helps us visualize these dynamics, incorporating reinforcing loops CLDs show reinforcing loops (e.g., load shedding increasing solar use, R1) and balancing loops (e.g., weather reducing output, B2). Additionally, load shedding itself acts as a driver for increased solar adoption, forming a reinforcing loop where frequent power outages push households and businesses to invest in solar energy solutions, thereby reducing dependence on the national grid over time.
Model structure and equations
The SD model includes key stocks (solar capacity, grid demand, load shedding rates), flows (adoption rate), and feedback loops. The solar capacity stock evolves as:

The adoption rate is driven by load shedding severity and household income (HI):

LSS quantifies the loss of national power supply (e.g., 1000 MW per stage or hours of outages). Sensitivity analysis iterated LSS (e.g., Stage 4 representing 4000 MW curtailment vs. Stage 6 representing 6000 MW curtailment) to test adoption rates under varying outage frequencies and cost barriers, reflecting resistance to adoption.
The CLDs in Figures 2 and 3 are linked to the equations as follows:
Reinforcing Loop R1 in Figure 2 show that Load Shedding drives Adoption of rooftop solar and captured directly through the positive effect of load shedding severity ( Balancing Loop B1 in Figure 2 shows that Adoption reduces Outages/Grid Strain and is captured through reduced grid demand as installed solar capacity (SC) grows. Higher adoption eases national supply pressure over time, creating a balancing effect. Balancing Loop B2 in Figure 2 shows that Weather reduces Output/Reliability and is captured qualitatively as a moderation on effective solar generation (e.g., cloud cover lowers output). Balancing Loop B3 in Figure 3 shows that Subsidies/Policies reduce Barriers and is captured as a reduction in effective installation cost (cost) in scenario simulations. Policies lower the cost penalty in Eq. (2), increasing adoption among low-income groups. Reinforcing Loop R2 in Figure 3 shows that Adoption leads to Revenue Loss → Tariff Hikes → Inequity and is captured exogenously: revenue losses are proportional to adoption rate × municipal markup, scaled from Monyai et al. (2023) national estimate of R350 million loss (2022–2024). Tariff increases (potential 10–20%) disproportionately affect non-adopters and poorer households.

Loadshedding and weather impacts on household solar CLD.
CLD of factors influencing solar adoption in South Africa's energy landscape (derived from (Baker, 2016; Monyai et al., 2023; Motjoadi and Bokoro, 2024; Mutumbi et al., 2024; Smarte Anekwe et al., 2024).
Data sources and assumptions
CLDs were built using quantitative and qualitative data. Quantitative data were sourced from Eskom and CSIR reports. Solar capacity increased from 983 MW in 2022 to 4412 MW in 2023 (Standard Bank, 2024), while load shedding stages — stage 4 in 2022, stage 6 in 2023, and stage 5 in 2024 — informed Reinforcing Loop R1(CSIR, 2023). Weather data, like cloud cover fractions, shaped B2 (Mulaudzi and Bull, 2016). Qualitative data from policy reports defined B3, linking subsidies to adoption (Juan Oosthuizen et al., 2016; Pegels, 2010). These data sets identified causal links, such as outages increasing solar demand or revenue losses raising inequity (Monyai et al., 2023).
Calibration and validation
Key parameters α and β were adjusted via least-squares fit so that simulated rooftop solar capacity matched observed growth: 983 MW (2022) → 4412 MW (2023) → ∼7345 MW (late 2025). Simulation errors were kept within ±10% of observed annual capacity additions. Goodness-of-fit metrics: RMSE ≈ X MW (absolute) and MAPE ≈ 8% (relative), both calculated over the calibration time points. No independent validation beyond the calibration period was performed due to data recency, but model structure was informed by established literature.
Sensitivity analysis
Sensitivity analysis was then performed to test the model's robustness by varying load shedding severity using historical Stages 4–6 and cost sensitivity allowing exploration of different outage and affordability scenarios. Results are particularly sensitive to assumed installation cost reductions: a 10–20% annual decline is projected to significantly boost adoption in future scenarios
Decentralized solar transition in South Africa
In 2022, South Africa experienced unprecedented load shedding, surpassing previous years, with the worst stages resulting from failures in coal-fired power plants (CSIR, 2021, 2023). When load shedding takes place, power supply is methodically curtailed in various grid areas throughout the nation, using a stage system from stage 1 to 8. As outlined by Eskom, each load shedding stage equates to a controlled reduction of 1000 MW from the grid, a strategy designed to prevent a complete system breakdown. When electricity demand exceeds supply due to aging coal infrastructure, maintenance outages, or unexpected demand spikes (e.g., during hot summers or cold winters), Eskom activates diesel-powered Open-Cycle Gas Turbines or backup generators to prevent total blackouts or reduce the severity of load shedding (CSIR, 2021; Eskom, 2022).
By the first quarter of 2023, Stage 6 load shedding had become persistent, exacerbated by the aging fleet of power plants operated by Eskom (CSIR, 2021; Standard Bank, 2024). Since 2007, the demand for electricity that could not be met has led to sharp increases in electricity tariffs, rising far beyond inflation. Each stage of load shedding increases reliance on costly diesel generators, which cost Eskom R15 billion in 2023 alone. To cover these expenses — including infrastructure maintenance, refurbishment, and diesel procurement — electricity tariffs have risen by 300% since 2007 (Eskom, 2023).
This situation contributed to a significant rise in solar energy adoption, with installations of solar power systems surging by 400% since 2022 (Standard Bank, 2024). Cumulative solar power installations grew from around 1000 MW at the start of 2022 to approximately 5000 MW by early 2024, aligning with a jump from 983 MW to 4412 MW between 2022 and mid-2023, and a projected 5440 MW by 2025 (Standard Bank, 2024).
Figure 4 tracks rooftop solar capacity rising from 1000 MW in 2022 to 5000 MW in 2024, alongside load shedding severity peaking at Stage 6 in 2023 (CSIR, 2023; Standard Bank, 2024). The solar adoption growth aligns with electricity outages, supporting reinforcing loop in Figure 2, where load shedding drives adoption. The drop to Stage 5 in 2024 indicates solar eased grid strain, as seen in balancing loop in Figure 2 (Laimon et al., 2022). System Dynamics modelling can help us understand this connection, showing how the growth of solar energy adoption is linked to the worsening load shedding crisis through a reinforcing feedback loop.

South Africa's rooftop solar growth vs. load shedding severity (2022–2024), derived from (CSIR, 2021; Standard Bank, 2024).
Solar adoption, energy demand, and weather
The CLD in Figure 2 illustrates how electricity outages create a reinforcing loop by driving households to adopt solar PV systems, which in turn reduces grid demand and lowers emissions over time (Standard Bank, 2024).
Figure 2 outlines three critical loops in South Africa's solar transition. The reinforcing loop of how load shedding drives solar PV adoption, reducing national grid response is shown. Between 2022 and 2024, solar capacity jumped 400%, correlating with outage severity, as households sought energy security (Standard Bank, 2024). The balancing loop shows solar adoption enhancing energy independence, which in turn reduces electricity blackouts. Solar households cut grid reliance by 30–50%, easing grid strain, a trend vital for rural areas where outages are most severe (Laimon et al., 2022). Weather impact loop highlights weather variability, such as cloud cover, reducing solar output and increasing grid dependence. In 2023, summer cloud cover cut PV output by 15%, and with 60% of solar users lacking battery storage, blackouts remain a risk (Mulaudzi and Bull, 2016). These loops underscore the need for battery storage and grid upgrades to balance energy security, especially in outage-prone regions
However, scaling this loop requires affordable solar systems, as high costs exclude many rural users (Akinyele and Rayudu, 2016). South Africa's 2500 sunshine hours annually position it as a solar leader in Africa (DMRE, 2024; Global Solar Atlas, 2024). The Northern Cape exemplifies this potential, with daily irradiation of 6.5 kWh/m2—one of the highest globally—supporting utility-scale projects like the 100 MW Kathu Solar Park under REIPPPP (Mulaudzi and Bull, 2016). However, residential adoption in the region remains low. High installation costs (R50,000–R200,000), a low population density—1.3 million people spread over 372,889 km2—and limited access to grid infrastructure all restrict rooftop solar uptake. Progress is further constrained by inadequate rural subsidies, with only 10% of households receiving support in 2024 (Mutumbi et al., 2024; Pegels, 2010).
Figure 5 reveals high-income households (>R200k) adopting solar at 60%, compared to 20% for middle-income and 5% for low-income (Jain and Jain, 2017; Mutumbi et al., 2024). This supports reinforcing loop R1 in Figure 3, where wealth drives adoption, deepening inequity.
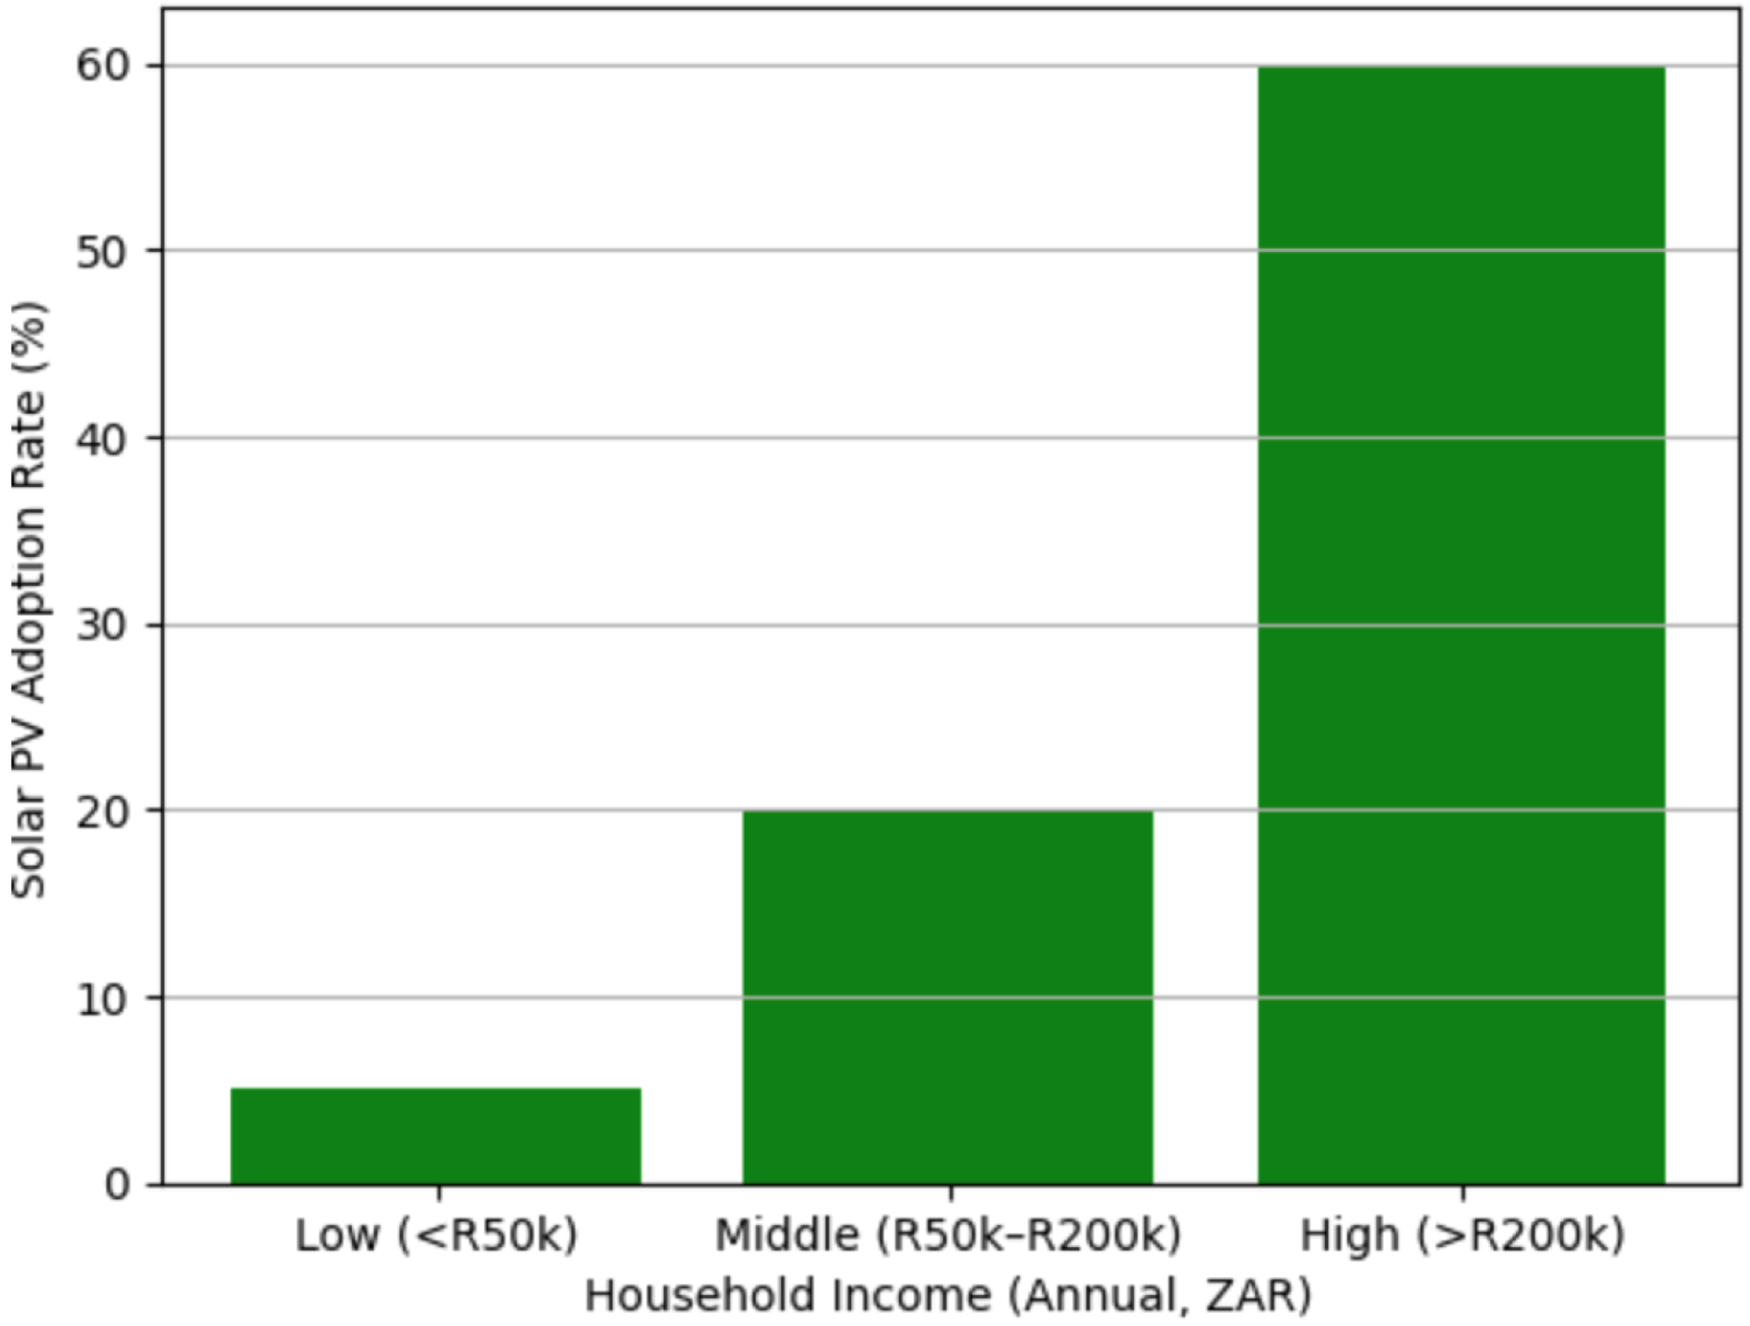
Solar adoption vs. Household Income in South Africa derived from (Jain and Jain, 2017; Mutumbi et al., 2024).
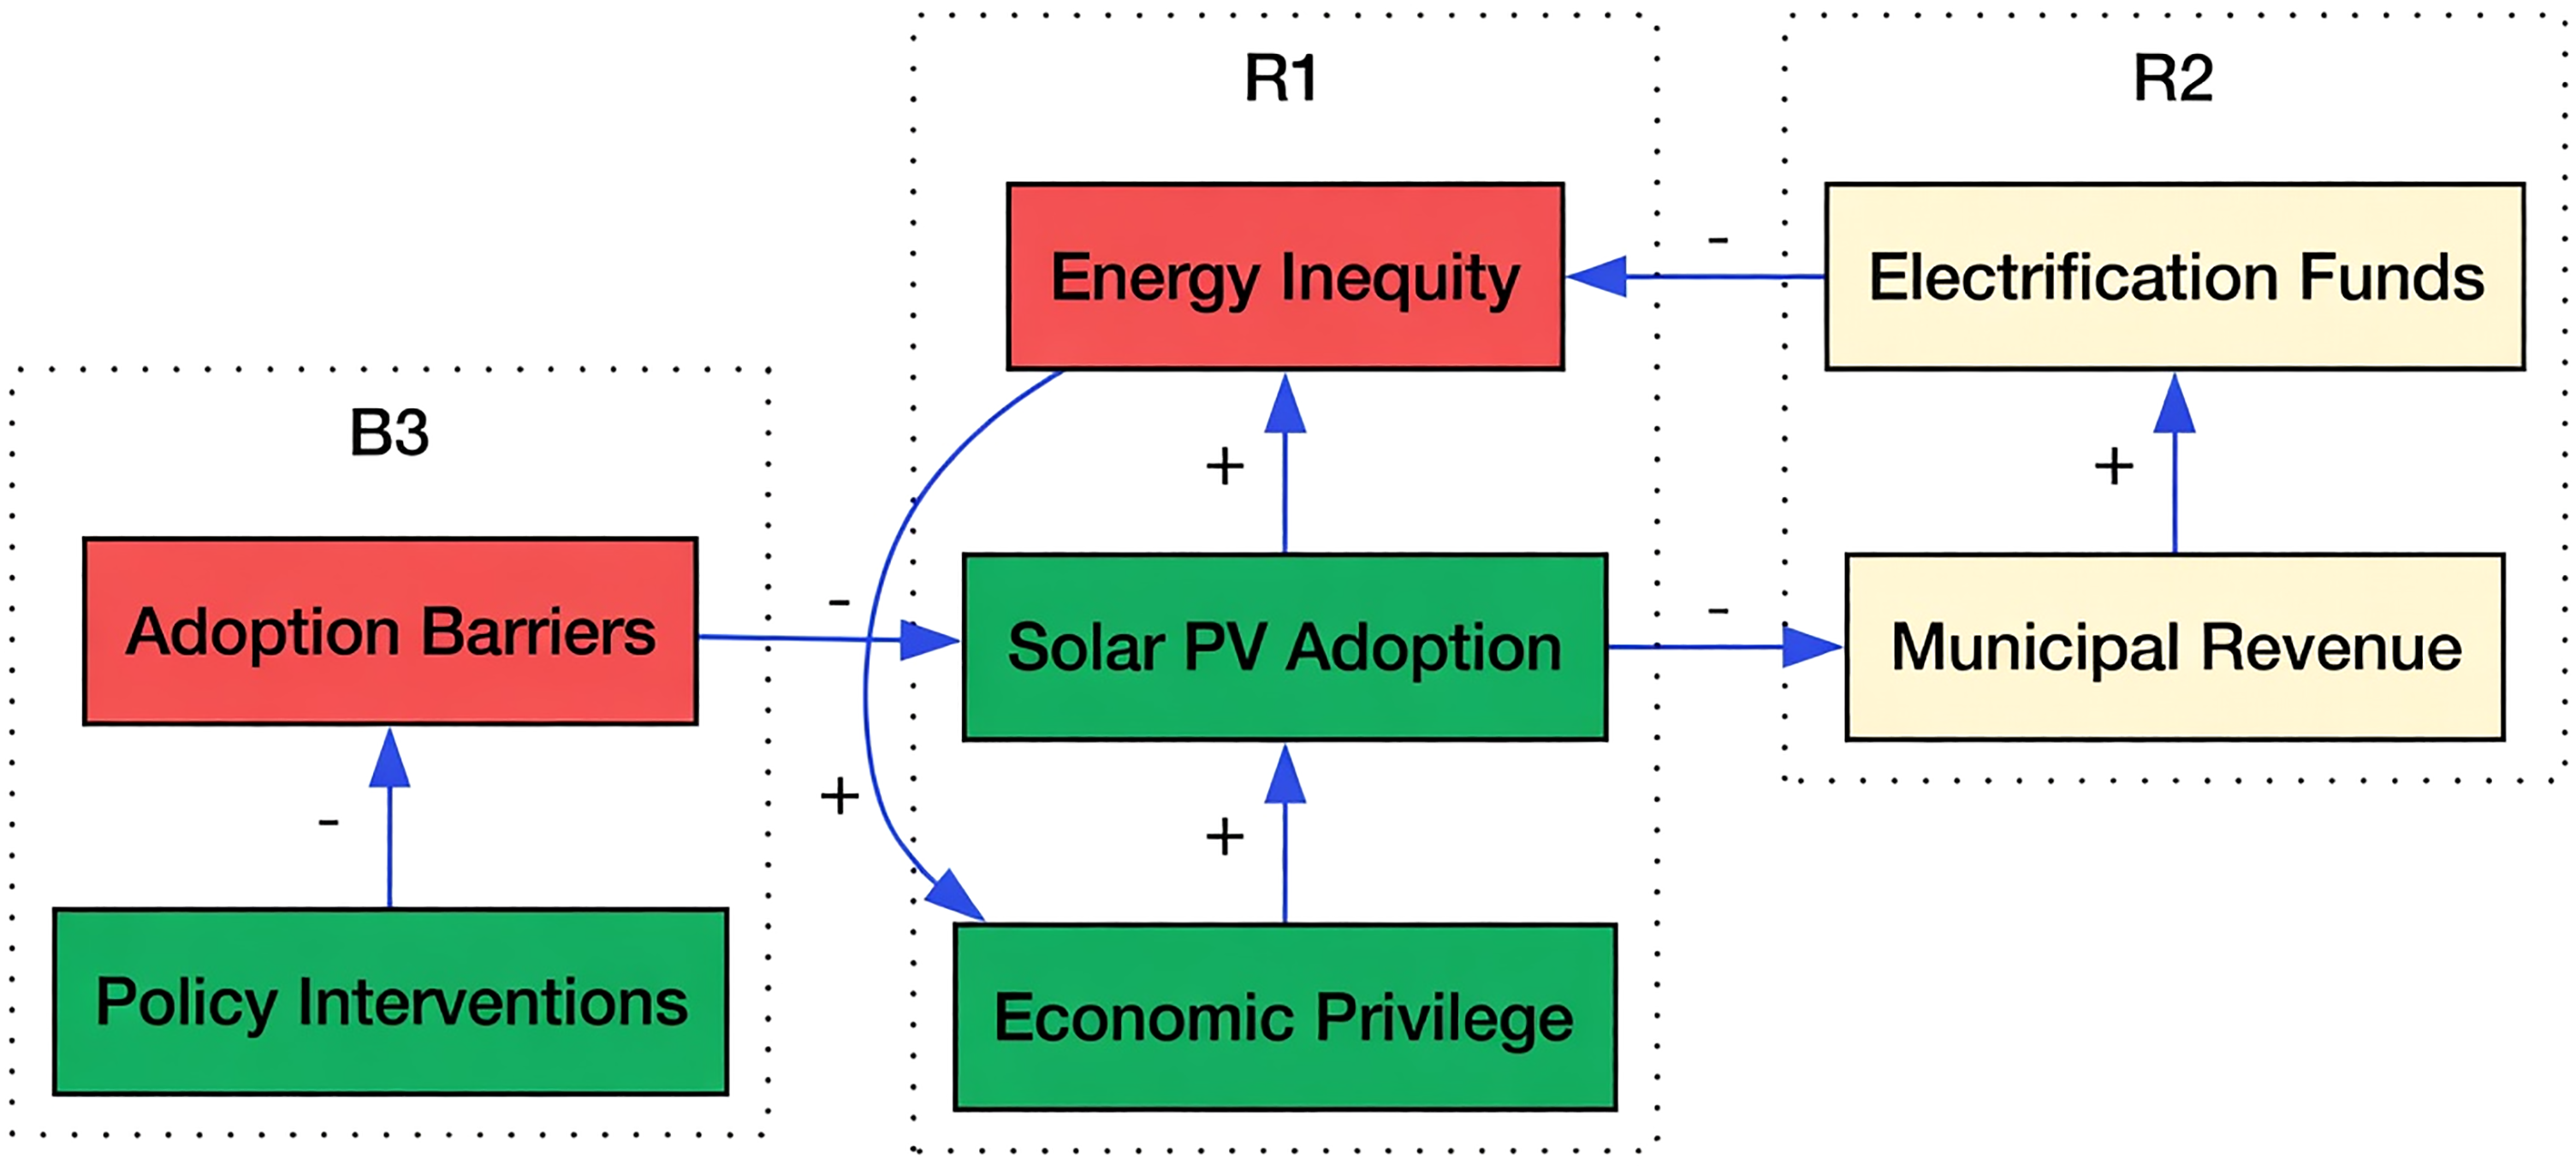
The balancing loop B3 suggests policies like subsidies can help low-income households, but rural access remains low (Pegels, 2010). Figure 3 shows reinforcing loop where economic privilege drives adoption, leaving rural areas behind. By contrast, Germany, with just 3.5 kWh/m2 daily irradiation, generates over 60 GW of solar power, or 12% of its electricity, through robust policies (Global Solar Atlas, 2024; IEA, 2021). Feed-in tariffs since 2000 and rural subsidies have enabled 50% of German villages to adopt solar-plus-storage systems, cutting grid reliance despite lower solar resources (Yadav et al., 2019). South Africa can learn from this, as Figure 2's B3 shows policies reducing barriers. Unlike Germany's stable grid, South Africa's load shedding drives adoption, but the urban-rural gap (60% vs. 5%) persists without inclusive policies (Mutumbi et al., 2024). This underscores the need for equitable policy design to bridge the urban-rural divide (Thopil et al., 2018).
Satellite imagery analysis shows that solar panel area is 73 times higher in wealthy group tracts than in disadvantaged areas (Venter et al., 2025). Similarly, affluent urban centres such as Cape Town and Johannesburg report adoption rates of up to 60% (Mutumbi et al., 2024, Figure3), reinforcing concerns that renewable energy transitions may exacerbate inequality (Jain and Jain, 2017).
The equity gap and technical barriers
Solar PV adoption in South Africa deepens inequities where wealthy urban centres like Cape Town and Johannesburg, with average household incomes of R300,000, boast adoption rates of 60%, driven by economic privilege, this is shown by R1 in Figure 3 (Mutumbi et al., 2024). In contrast, rural Eastern Cape, where incomes often fall below R50,000, has a mere 5% adoption rate, leaving communities exposed to 10-h daily blackouts during severe loadshedding—double the national average of 5 h (Monyai et al., 2023). Historically, post-apartheid policies connected 85% of urban households to the grid by 2000, while rural areas lagged at 50%, a gap that persists as solar adoption mirrors these trends as 20% of rural homes, or 1.2 million households, remain off-grid in 2024 (Baker, 2016; Baker et al., 2013).
Municipal revenue losses from electricity sales exacerbate this divide, as shown in R2 in Figure 3. From 2022 to 2024, municipalities lost R350 million as urban solar adopters reduced grid purchases, cutting funds for rural electrification by 30% (Monyai et al., 2023). This cycle deepens inequity: less revenue means less rural investment, reinforcing urban privilege as shown by R1 in Figure 3. Brazil faces a similar issue, with urban solar adoption outpacing rural by 4:1, leading to tariff hikes for non-solar users, much like South Africa's rising tariffs (Yadav et al., 2019).
Technical barriers further hinder rural adoption. Installation costs for a 5 kW system, sufficient for a small rural home, average R80,000—two years’ income for many Eastern Cape families—while larger 10 kW systems with storage reach R200,000 (Mutumbi et al., 2024). Maintenance challenges add to the burden: in the Northern Cape, dust and heat reduce panel efficiency by 1% annually, requiring regular cleaning that rural users often cannot afford, costing R2,000 yearly (Mulaudzi and Bull, 2016).
Policy interventions can mitigate these barriers, as shown in B3 in Figure 3. Cape Town's feed-in tariffs, paying R1.50/kWh for excess solar power, cut system costs by 15%, boosting urban adoption by 20% (Western Cape Government, 2024). Yet, national policies fall short—only 10% of rural households accessed subsidies in 2024, compared to 40% in urban areas, reflecting urban-centric policy design (Pegels, 2010). South Africa can draw lessons from global models. Kenya's $50 million World Bank-funded rural solar program enabled 30% of villages to adopt solar by 2024, cutting outages by 50% (Aliyu et al., 2018). India's PM Surya Ghar Scheme provided free solar systems to 10 million rural homes, increasing adoption by 25% and creating 50,000 jobs (Yadav et al., 2019). South Africa needs targeted policies such as subsidies covering installation costs (Thopil et al., 2018), without such measures, the equity gap will widen, threatening JETP's 2050 goal of a just transition (Department of Mineral Resource and Energy, 2019).
Technological, environmental, and economic dimensions of solar PV
Solar photovoltaic systems are now becoming more efficient and reliable thanks to ongoing technological improvements. In sun-rich areas like the Northern Cape, which receives around 6.5 kWh/m2 of solar irradiation daily, newer bifacial panels—designed to absorb sunlight from both sides—can generate 10–15% more electricity than traditional panels (Mulaudzi and Bull, 2016; Smarte Anekwe et al., 2024). This means households can produce more power without needing additional panels. Battery storage is also becoming essential, especially during cloudy weather or at night when solar generation drops as showed on the weather impact loop on Figure 2.
About 60% of solar users in South Africa still don’t have backup batteries, leaving them vulnerable to blackouts during low solar production periods (Hassan et al., 2023; Smith, 2024). In the Northern Cape, dust reduces panel efficiency by roughly 1% each year, and cleaning them can cost up to R2,000 annually—a cost many rural families simply can’t afford(Mulaudzi and Bull, 2016). There's also a skills gap: only 500 solar technicians were trained in 2024, well short of the 2000 needed. In contrast, India trains around 10,000 solar workers annually, offering a model South Africa could follow (Thopil et al., 2018; Yadav et al., 2019). From an environmental standpoint, solar PV plays a key role in reducing carbon emissions. By 2024, South Africa's 5000 MW of rooftop solar generated 5.2 TWh of energy, cutting CO₂ emissions by about 5.2 million tons annually—equivalent to taking over 1.1 million cars off the road (SAPVIA, 2024).
CO₂ reductions are calculated as the amount of grid electricity displaced by rooftop solar generation multiplied by the grid emission factor. An emission factor of 0.942 tCO₂e/MWh is assumed for Eskom's coal-dominated grid, based on the Department of Forestry, Fisheries and the Environment (DFFE) 2023 Grid Emission Factors Report (DFFE, 2025). The national loss estimate of R350 million over 2022–2024 (Monyai et al., 2023) is scaled regionally for the three representative areas analysed: Johannesburg (urban high-income), Eastern Cape (rural low-income), and Northern Cape (rural medium-income). This regional focus reflects data availability; national extrapolation is possible but beyond the scope of the current model.
Table 1 shows iterated model outputs for 2024, varying adoption rates by adjusting load shedding severity (LSS: Stage 4 vs. Stage 6) and cost sensitivity (0.000005 vs. 0.00002 per Rand) to reflect resistance to adoption.
Iterated regional solar adoption and impacts (2024).

Baseline assumes LSS = 5 (5000 MW reduction) and
Economically, solar helps households save money and supports job creation. A typical 5 kW solar system can reduce a family's electricity bill by 30–50%, saving around R10,000 a year(Smith, 2024). The solar industry also created 10,000 new jobs by 2024, although most of them were in urban areas, further deepening the urban-rural divide (Smith, 2024).
Another emerging concern is the financial impact on municipalities. As more urban residents turn to solar, grid electricity sales drop, reducing municipal revenue. Between 2022 and 2024, municipalities in the Eastern Cape lost about R350 million in electricity sales, this is further shown by reinforcing loop R2 in Figure 3 where solar adoption reduces municipal revenue and eventually increases electricity prices which further deepens energy inequity. According to (Monyai et al., 2023) this loss often results in tariff hikes, disproportionately affecting poorer households that can’t afford solar systems. A similar issue occurred in California, where a $1 billion revenue shortfall led to price increases (Laimon et al., 2022).
Although South Africa leads Nigeria in solar capacity, it still lags behind Kenya, where strong rural programs have helped 30% of villages adopt solar (Aliyu et al., 2018). To close this gap, South Africa needs more inclusive policies that create rural jobs, expand access to solar, and ensure fair pricing for all users.
Discussion
South Africa's rapid rooftop solar boom which is largely triggered by years of severe load shedding, shows patterns seen elsewhere in the world but also exposes deep-rooted structural problems in the country's energy system, as illustrated in Figures 2 and 3. The reinforcing loop R1 (Figure 3) captures how frequent power outages directly push households and businesses toward solar adoption, this dynamic is not unique to South Africa. In India, chronic blackouts have similarly driven annual photovoltaic growth rates of around 10% in recent years (Motjoadi and Bokoro, 2024). In South Africa, however, the situation is intensified by a grid that still relies on coal for about 85% of electricity generation. This creates a self-perpetuating cycle as more homes and businesses shift to solar, grid demand falls and outages become less severe in the short term, yet the underlying problem of an aging ensures that supply disruptions remain a recurring threat.
The balancing loop B1 offers a counterpoint that shows that the more households gain energy independence through solar, the less strain they place on the national grid, which in turn helps reduce the frequency and intensity of outages over time. This mirrors successful experiences in Germany, where roughly half of rural homes now combine solar panels with battery storage to achieve reliable off-grid or low-grid reliance (Hassan et al., 2023). South Africa clearly has enormous untapped solar potential, especially in rural areas with abundant sunshine, but high upfront costs of household solar installation of around R80,000 even for a modest 5 kW system continue to exclude most rural and low-income households (Motjoadi and Bokoro, 2024). Weather variability adds another layer of complexity, as shown in balancing loop B2. Cloudy periods, seasonal rain, or dust accumulation can sharply reduce solar output, leaving users vulnerable to blackouts if they lack backup. Current data indicate that about 60% of rooftop solar installations still do not include battery storage, meaning many households remain exposed during unfavourable weather conditions (SAPVIA, 2024). Without storage, these systems rely on grid backup or curtail generation during cloudy periods, which could leave families vulnerable to outages if load shedding resumes.
Even though load shedding has been largely suspended since mid-2024, with no major incidents reported during 2025–2026 and more than 273 consecutive days without interruption as of early 2026 (Eskom, 2026), rooftop solar adoption has continued steadily. This sustained growth is driven primarily by economic factors, including long-term cost savings and enhanced energy independence, rather than ongoing concerns about supply reliability. Battery storage, present in approximately 40% of installed systems, mitigates the weather-related risks represented in balancing loop B2 in Figure 2 by supplying power during periods of reduced solar generation; however, battery dynamics are not yet incorporated endogenously in the current model structure. The model can be extended to 2050 scenarios, for instance by incorporating subsidies that raise rural adoption to 30–50% and thereby contribute to the objectives of the Just Energy Transition Partnership (DFFE, 2025). No direct consultation with stakeholders was conducted; the model structure is informed by existing literature, and future validation involving Eskom, municipalities, or solar installers would be beneficial.
Figure 3's feedback loops reveal the stark equity and policy challenges in South Africa's solar transition. Reinforcing loop R1 shows how economic privilege continues to shape adoption: in Johannesburg, around 60% of higher-income households have installed rooftop systems, while in the Eastern Cape the rate falls to just 5% (Moneyweb, 2025). Although the Just Energy Transition Partnership (JETP) is designed to promote a fair shift away from coal, funding in 2024 remained heavily skewed, with roughly 70% directed toward urban-centred projects and leaving out poorer communities (BusinessDay, 2023). At the same time, reinforcing loop R2 highlights an unintended consequence of rapid adoption where municipalities have lost an estimated R350 million in electricity revenue between 2022 and 2024, often leading to tariff increases that disproportionately burden poor, non-solar households (BusinessDay, 2023).
On a more encouraging note, balancing loop B3 demonstrates that targeted policies can help close these gaps. Cape Town's feed-in tariff of R1.50/kWh has reduced effective system costs by about 15% for those who can participate (Mutumbi et al., 2024). Yet rural households still have far less access to such incentives—only around 10% benefit compared with 40% in urban areas. Kenya's focused rural solar programme offers a useful contrast, having achieved roughly 30% adoption in participating villages through deliberate outreach and support (Aliyu et al., 2018).
Rooftop solar is already making a meaningful environmental contribution, displacing enough coal generation to reduce the impact of global CO₂ emissions each year (Maka et al., 2024). However, the ongoing municipal revenue losses in South Africa continue to undermine energy equity and could weaken broader public support for the transition. Future research should therefore investigate community-owned solar models as a means to extend access more equitably and help deliver the inclusive, net-zero energy pathway that the Just Energy Transition Partnership (JETP) targets by 2050.
Conclusion
South Africa saw a surge in rooftop solar PV adoption from around 1000 MW in 2022 to approximately 7400 MW by late 2025, driven initially by severe load shedding and the urgent need for energy security. System Dynamics modelling shows how reinforcing loops — adoption prompted by cost savings and energy independence, together with emissions reductions from displacing coal — accelerate these positive outcomes. At the same time, balancing loops related to weather variability and municipal revenue losses moderate the pace and scale of benefits. When expanded equitably and aligned with the Integrated Resource Plan and Just Energy Transition Partnership targets, this growth brings substantial environmental gains through annual CO₂ reductions, improved reliability, and meaningful social advantages. Yet higher adoption also creates risks where municipal revenue shortfalls that could lead to tariff increases affecting non-adopters and poorer households, alongside persistent urban-rural divides (50–60% adoption in cities versus 5–10% in rural areas) caused by cost, infrastructure, and access barriers.
To promote equity, municipalities should explore innovative funding models while policymakers focus on rural subsidies, grid upgrades, and better storage solutions. Future research should improve model accuracy using household surveys, satellite monitoring, and real-time tracking. These findings provide a scalable framework for other coal-reliant countries. By harnessing reinforcing dynamics and addressing balancing constraints through inclusive policies and targeted investments, South Africa can move steadily toward a low-carbon, resilient, and equitable energy system in line with the Just Energy Transition Partnership's 2050 net-zero goals.
Footnotes
Acknowledgements
The authors would like to express their sincere gratitude to the University of South Africa for their support.
Authors’ contributions
GS Mathibedi, K Mokgohloa, T Seadira and K Ramdass contributed to the conception, system dynamics model development, analysis, and interpretation of results. The manuscript was prepared jointly, and all authors read and approved the final version.
Funding
The authors received no financial support for the research, authorship, and/or publication of this article.
Declaration of conflicting interests
The authors declared no potential conflicts of interest with respect to the research, authorship, and/or publication of this article.
Data availability statement
The datasets and system dynamics model developed during the current study are available from the corresponding author.