
Abstract
The study assessed the prospects of solar green generation in the context of modern trends in the development of renewable energy in the world, taking into account the forecast estimates of world energy agencies in the perspective of 2030–2060. Global and European aggregated data for three simulated scenarios of energy and climate policy (STEPS, APS, NZE) in terms of the use of solar photovoltaic technologies and technologies of solar energy concentration up to 2030–2050 were evaluated. It was determined that by 2060 for the European Union, according to the “EU Basic Scenario”, the following will be ensured: increase in energy production using solar photovoltaic technologies to the value of 876 PJ; almost four-fold increase in the volume of energy production using solar energy concentration technologies to a value of 566 PJ; it is planned to gradually increase the amount of electricity production, using solar photovoltaic technologies, to the value of 243 TWh; more than a fivefold increase in electricity production will be ensured using solar energy concentration technologies to a value of 58 TWh; it is planned to gradually increase the electrical capacity of installations based on solar photovoltaic technologies to the value of 195 GW; will provide more than a fourfold increase in the electrical capacity of installations based on solar energy concentration technologies to a value of 17 GW. The volumes of solar green generation will be approximately 30 to 50% of the total generation of energy from renewable sources in the foreseeable future, mainly due to the use of solar PV generation, which will lead to a significant reduction in CO2 emissions. Expansion of solar generation for Ukraine should be considered as a means of overcoming the energy crisis and increasing the environmental and energy security of the generating capacities of the Ukrainian energy industry.
Introduction
The global energy crisis provided an unprecedented impetus for the widespread adoption of technologies for the use of renewable energy sources. Problems in fossil fuel supply chains have revealed the advantages of domestic local generation of electricity from renewable sources and the positive impact on energy security. Because of these factors, a significant number of countries around the world have ensured the strengthening of regional policies to support renewable energy sources. In turn, the global increase in fossil fuel prices caused by the crisis ensured the increase in the competitiveness of solar photovoltaic and wind generation.
According to the REPowerEU Plan of the European Commission (“REPowerEU”, 2022) Europe's transition to clean energy should take place, ensuring energy security accelerates the implementation of renewable energy technologies, and also foresees an increase in the share of renewable energy sources in final energy consumption to 45% by 2030.
It is planned that the expansion of renewable electricity technologies in Europe will be doubled during the period 2022–2027, which is connected with solving the problems of energy security and fulfilling climate obligations. Renewable energy sources are expected to account for more than 90% of the global increase in electric power capacity during the forecast period 2027 (IEA, “Renewables 2022. Report”, 2022). It is planned that by the beginning of 2025, renewable energy sources will become the largest source of global electricity production, their share in the structure of electricity production will increase to 38% in 2027 (IEA, “Renewables 2022. Report”, 2022). It is predicted that wind and solar power generation will provide almost 20% of global power generation in 2027.
In order to achieve environmental security, which involves a 50% reduction in global carbon emissions by 2050, the development of renewable energy will require a significant increase in the world in order to reduce climate change. In particular, it should be noted that the use of transport and the generation of thermal and electrical energy in the industrial and residential sectors provides 73.2% of the volume of global greenhouse gas emissions. Therefore, the implementation of renewable energy technologies will be needed in these sectors as a matter of priority (IEA, “Renewables 2022. Report”, 2022).
In order to achieve the goals of climate neutrality by 2050, European countries will stimulate the introduction of renewable energy sources based on the state target program to support distributed generation from renewable energy sources (RES). The effect of this program will be a working critical infrastructure in the conditions of emergency shutdown schedules and decentralized electric generation, which is technically difficult and economically impractical to disable (“In Ukraine developed a concept program support for distributed green generation”, 2023; “In Ukraine plans to commission 500 MW of green generation capacity”, 2023).
Theoretical framework. Methodology
Energy Models. Methods and Criteria
The Secretariat of the UNFCCC (UN Climate Change) presented an analysis of the main energy models: IPAC, MARKAL, MESSAGE, NEMS, NIEIR Multipurpose model, POLES, PRIMES, SAFIRE (Strategic Assessment Framework for the Implementation of Rational Energy), VLEEM and World Energy Model (WEM) (UNFCCC (UN Climate Change), “Energy models”, 2024).
The WEM offered by the International Energy Agency (IEA) is the most accessible, multi-criteria, generalized and frequently updated. In our study, we use the results of research based on the WEM. The IEA provides medium- and long-term energy forecasts using the world's leading modeling tools. The WEM was developed, it is a large-scale simulation model for reproducing the functioning of energy markets. The IEA has also developed the “Energy Technology Perspectives (ETP)” model, which is used in parallel with the WEM. In 2021, the IEA applied a new approach to hybrid modeling, which made it possible to develop the IEA Global Energy and Climate model (GEC) (IEA, “Global Energy and Climate Model”, 2023).
The GEC model is used to study changes in energy systems. Based on the integrated simulation cycle of GEC, World Energy Outlook(WEO-2023) and ETP-2023, three climate and energy scenarios are investigated: a Net Zero Emissions Scenario by 2050 (NZE), this Scenario has been updated in 2023 (IEA, “Net Zero Roadmap. A Global Pathway to Keep the 1.5 °C Goal in Reach. 2023 Update”, 2023); the Stated Policies Scenario (STEPS) and the Announced Pledges Scenario (APS). The 2050 Net Zero Emissions scenario is normative, designed to achieve specific outcomes, and shows a path forward. The APS and Stated Policies Scenario are exploratory, defining a set of initial conditions and developing forecasts based on model representations of the development of energy systems. The GEC 2023 simulation does not include the Sustainable Development Scenario (SDS), which is another regulatory scenario. The results obtained under the APS scenario in some respects will be closer to the SDS results, but they are the product of a different modeling approach.
The GEC model is data intensive. The formal base year is 2021 for the 2023 projections, and data that are more recent have also been used to estimate energy production and demand for 2022 and 2023, based on updated Global Energy Review reports. Investment estimates include the year 2022 based on the IEA World Energy Investment 2023 report. Historical data on gross power generation capacity are taken into account based on the S&P Global Market Intelligence World Electric Power Plants Database and the database PRIS of the International Atomic Energy Agency. The GEC model is implemented using a wide range of Vensim and TIMES software tools.
The set of key inputs for the GEC model provides inputs for three simulated scenarios (STEPS, APS, NZE), namely: macro factors (population, economic development and prices) and techno-economic factors (e.g., fossil fuel resources or the cost of technologies).
The IEA's GEC model also interacts with other internationally recognized models, including: the Model for the Assessment of Greenhouse Gas Induced Climate Change (MAGICC); model of interaction and synergy of greenhouse gases and air pollution (GAINS); Global Biosphere Management model (GLOBIOM), Global Integrated Monetary And Financial model (GIMF) of the International Monetary Fund (IMF); open source spatial electrification tool (OnSSET), a GIS-based optimization tool (IEA, “About the Global Energy and Climate Model”, 2023).
The STEPS scenario explores the development of the energy system without significant additional control. Universal access to modern energy by 2030 is considered under the NZE scenario, and all national energy access targets are met under the APS scenario. The NZE scenario is the IEA's normative scenario that shows the way for the global energy sector to achieve net zero CO2 emissions by 2050. As the energy sector is responsible for approximately three-quarters of global greenhouse gas emissions, the achievement of net zero CO2 emissions related to energy and industrial processes, by 2050 under the NZE scenario only addresses the energy sector. The APS, presented in 2021, shows the alignment of the declared ambitions and goals with the actual emission reductions necessary to achieve net zero emissions by 2050 (IEA, “Global Energy and Climate Model. Understanding GEC Model Scenarios”, 2023).
The GEC model also integrates innovative technologies and designs not yet available on the market. The simulated scenarios are based on a technology tracking process, the scenarios predict different rates of progress as support and degree of international cooperation for clean energy innovation increases with decarbonisation ambitions (IEA, “Global Energy and Climate Model. Techno-economic-Inputs”, 2023).
The aim of this study is to assess the perspective of solar green generation in the context of current trends in the development of renewable energy in the world, taking into account the forecast estimates of world energy agencies in the perspective of 2050 and 2060, the assessment of global and European aggregated data for three simulated energy and climate scenarios policies (STEPS, APS, NZE) regarding the use of solar photovoltaic technologies (solar PV) and concentrated solar power technologies (solar CSP) until 2030, 2040 and 2050. This approach will make it possible to define the prospects and the need for increasing the volume of solar green generation for Ukraine in the context of modern trends in the development of renewable energy in the world, taking into account the forecast estimates of world energy agencies in the foreseeable future until 2060, which should be considered as a means of overcoming the energy crisis in the country and increasing the environmental and energy security of the generating capacities of the Ukrainian energy industry. An accurate assessment will become possible after the cessation of hostilities in Ukraine, given the current uncertainty of information in the country's energy sector.
The study is based on an assessment of the perspective of solar green generation in the context of modern trends in the development of renewable energy in the perspective of 2050 and 2060 using the methodological foundations and scientific results of a number of previous studies by various authors (Aguilar-Jiménez et al., 2020; Barbato et al., 2021; Havrysh et al., 2022; Hernández-Callejo et al., 2019; Kosharska et al., 2023; Koval et al., 2023; Kulpa et al., 2022; Olczak et al., 2020, 2022; Ostapenko et al., 2022; Ostapenko et al., 2023; Pecunia et al., 2023; Rybalchenko et al., 2021; Sotnyk et al., 2021; Sribna et al., 2023; Verkhoglyadova et al., 2022) and also using databases data of leading world energy agencies (IEA, “Energy End-uses and Efficiency Indicators Highlights”, 2023; “Energy security. Reliable, affordable access to all fuels and energy sources”, 2023; “Energy Technology Perspectives 2023”, 2023; “Global Energy and Climate Model 2023 key input data”, 2023; “Global Energy Review: CO2 emissions in 2021”, 2023; “Government Energy Spending Tracker”, 2023; “Greenhouse gas emissions from Energy Highlights”, 2023; “Net Zero by 2050”, 2021; “Net Zero by 2050 Scenario”, 2021; “Net Zero Roadmap. A Global Pathway to Keep the 1.5 °C Goal in Reach. 2023 Update”, 2023; “Renewable Energy Market. Update - May 2022”, 2022; “Renewables”, 2022; “Renewables Data Explorer. Explore electricity, heat and transport data from Renewables 2022 and previous years”, 2023; “Renewables 2022”, 2023; “SDG7 Database”, 2023; “Total renewable electricity capacity additions, 2001–2027”, 2022; “World Energy Balance Highlights”, 2023; “World Energy Investment 2023”, 2023; “World Energy Investment 2023 Datafile”, 2023; “World Energy Outlook 2023 – October 2023”, 2023) for effective application and assessment of the potential of renewable energy sources (Aguilar-Jiménez et al., 2020; Barbato et al., 2021; Havrysh et al., 2022; Hernández-Callejo et al., 2019; Kosharska et al., 2023; Koval et al., 2023; Kulpa et al., 2022; Olczak et al., 2020; Olczak et al., 2022; Ostapenko et al., 2022; Ostapenko et al., 2023; Pecunia et al., 2023; Rybalchenko et al., 2021; Sotnyk et al., 2021; Sribna et al., 2023; Verkhoglyadova et al., 2022).
Systemic, structural, statistical, factorial and comparative analyzes were used in the study. The research is conducted on the basis of methodological and statistical data from the databases of the IEA, which uses the databases of the International Renewable Energy Agency (IRENA), the World Bank, the United Nations Statistical Department (UNSD) and others (“Tracking SDG7 “, “Rise”, “Esmap”). In particular, the following databases were used: IEA: “World Energy Balance Highlights” (the IEA database of energy balances for more than 185 countries and regions); “Energy End-uses and Efficiency Indicators Highlights” (database of energy efficiency indicators); “World Energy Outlook 2023” (data from the analysis of energy development in the context of energy and environmental security); “World Energy Investment 2023 Datafile” (contains global and regional data on investment in supply and end-use; regional data on investment in fossil fuels, renewable energy sources, grids and energy efficiency, renewable energy sources); “Global Energy Review: CO2 Emissions in 2021” (contains global CO2 emissions indexes and is based on detailed IEA analysis by region and fuel type based on official, national and publicly available energy, economic and weather data); “Greenhouse Gas Emissions from Energy Highlights” (annual IEA data on greenhouse gas emissions in the energy sector); “SDG7 Database” (contains data on access to electricity and clean cooking (SDG 7.1) and progress on SDGs on renewable energy (SDG 7.2) and energy efficiency (SDG 7.3)) (last updated September -November 2023).
This dataset has been updated by the IEA to track progress towards Sustainable Development Goal 7; “2050 Net Zero Emissions Scenario” and “Net Zero Roadmap. A Global Pathway to Keep the 1.5 °C Goal in Reach. 2023 Update” (contains data together with global projections for the 2050 Net Zero Emissions scenario) and includes global projections for the 2050 NZE scenario based on detailed energy sector modeling.
Results
Despite the increase in investment costs due to the increase in prices for raw materials, solar photovoltaic installations for general use are the least expensive option for new electricity production in the vast majority of countries around the world. Distributed solar power stations, such as solar panels on building roofs, will also grow faster due to higher retail electricity prices and increasing policy support.
The extraordinary growth in the deployment of photovoltaic systems in recent years will need to be continued and expanded to meet the Net-Zero Emissions scenario by 2050, which requires an ongoing ambitious policy (IEA, “Renewables 2022. Report”, 2022).
From Figure 1 shows that by 2060, a gradual increase in the use of solar energy using solar photovoltaic technologies (solar PV) will be ensured and the production of heat and electricity with using solar photovoltaic technologies will be increased to 876 PJ, according to the forecast data of “EU Basic Scenario” for the period until 2060.
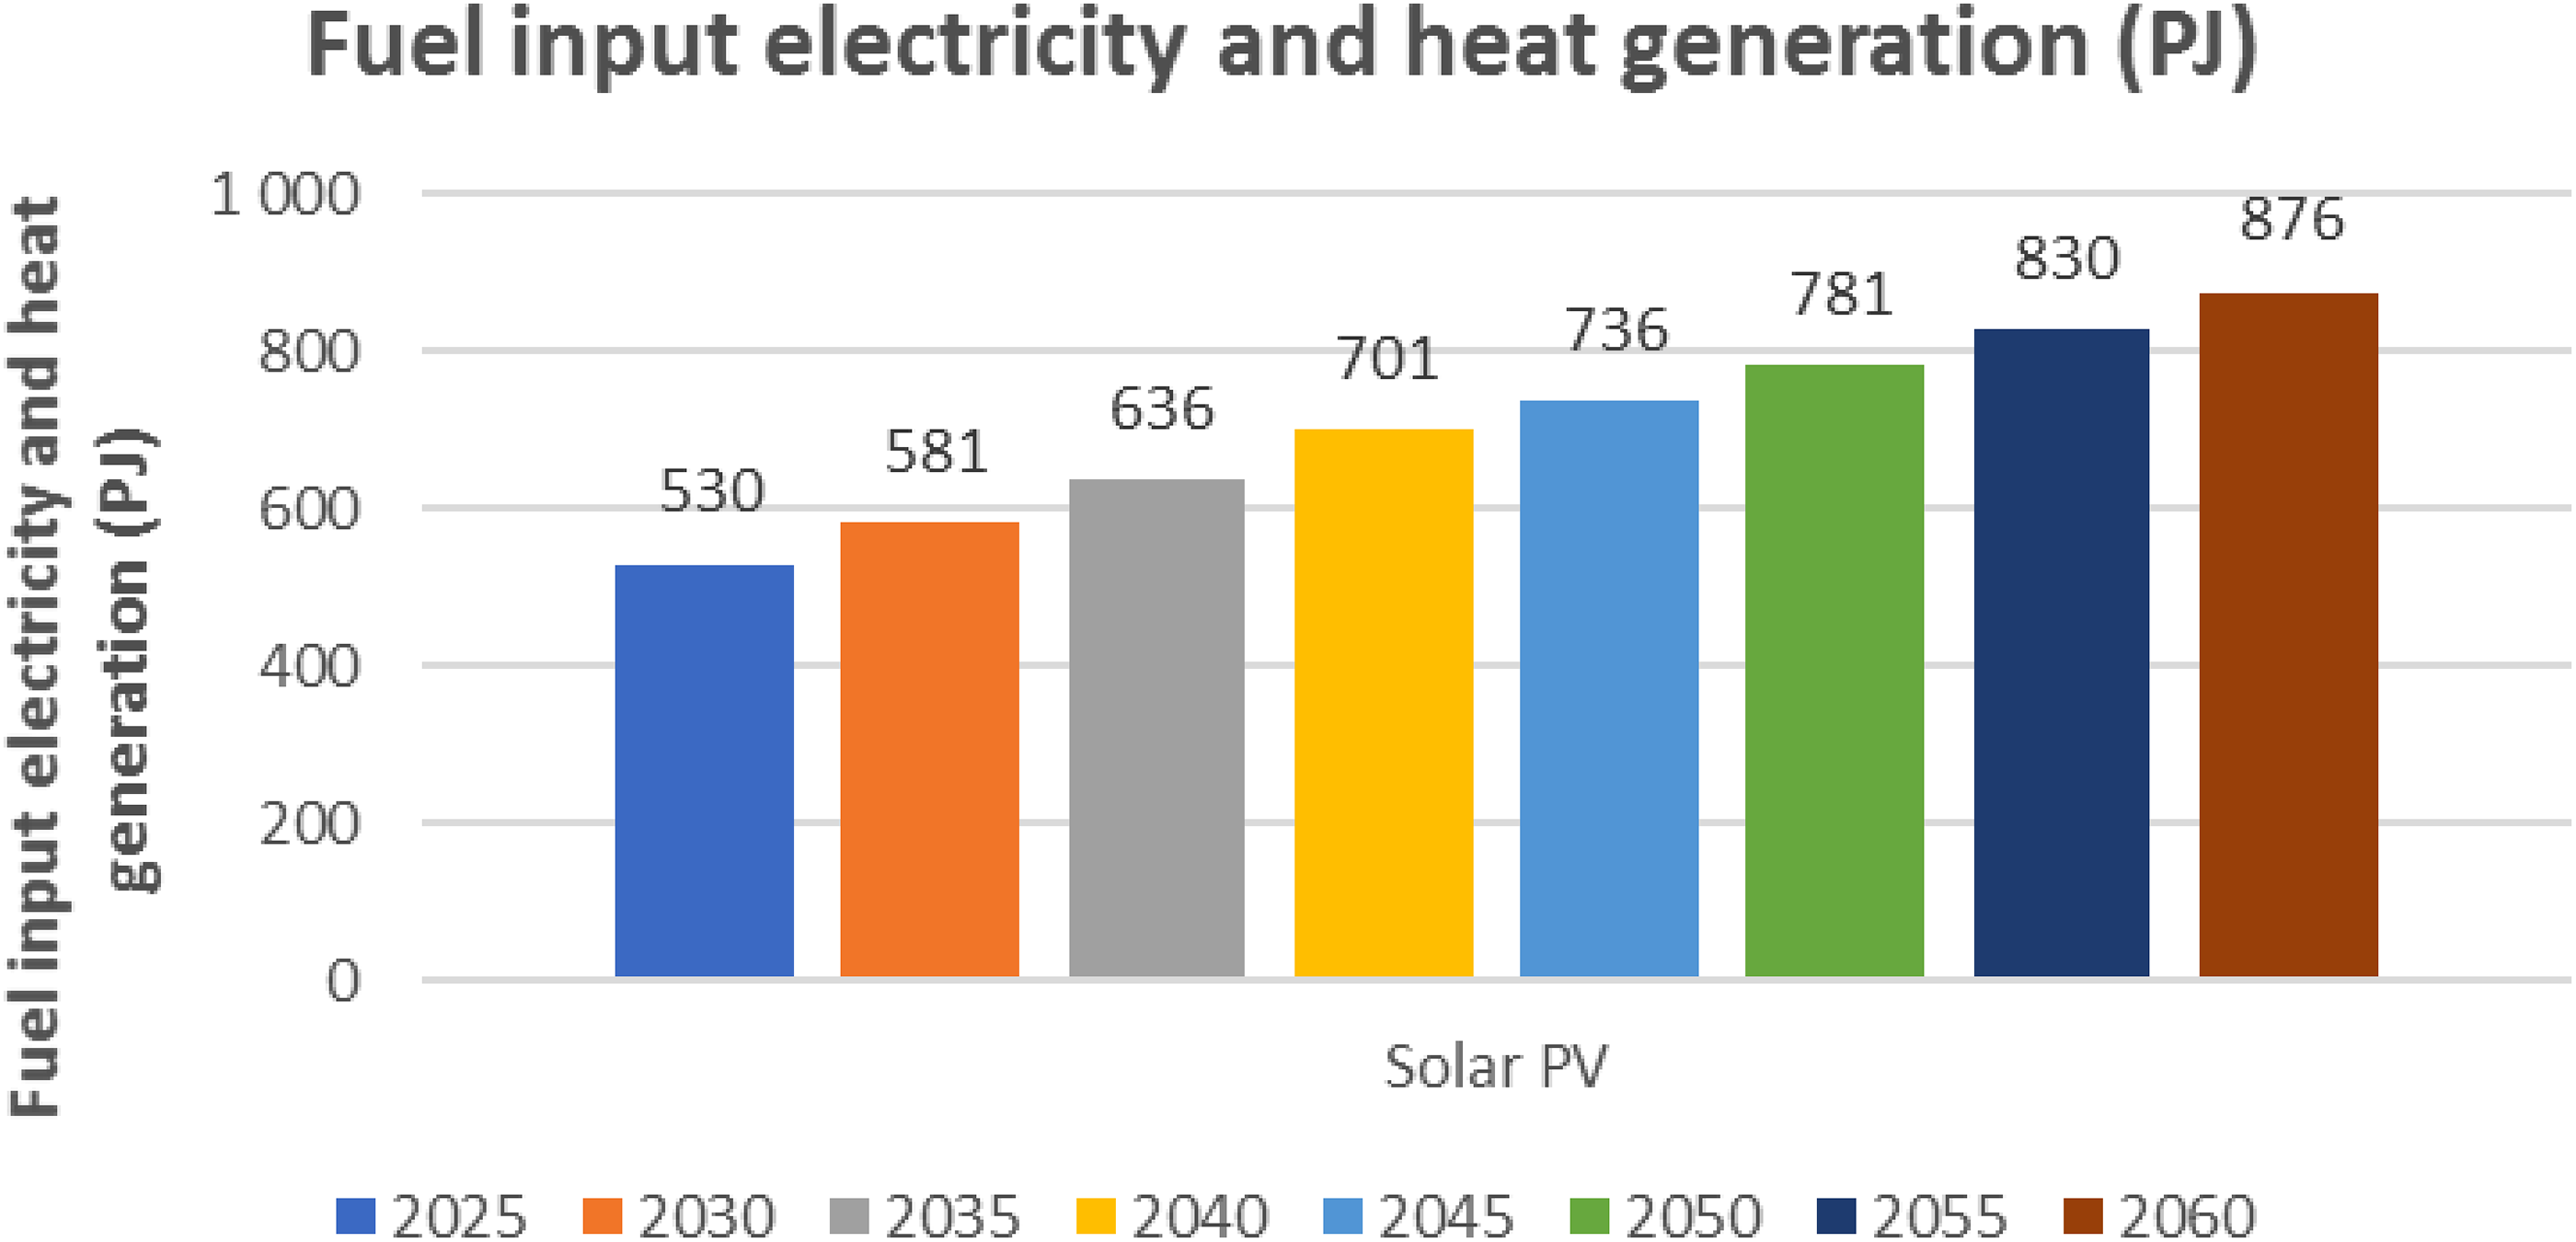
Forecast data of fuel input electricity and heat generation from solar PV for the European Union, according to the “EU Basic Scenario”, for the period up to 2060 year. Source. data obtained by the authors based on IEA databases (IEA, “Energy End-uses and Efficiency Indicators Highlights – November 2023”, 2023; “Energy Technology Perspectives 2023”, 2023; “Global Energy and Climate Model Documentation 2023, IEA, Paris”, 2023; “Global Energy and Climate Model 2023 key input data”, 2023; “Renewable Energy Market. Update - May 2022”, 2022; “Renewables”, 2022; “Renewables Data Explorer. Explore electricity, heat and transport data from Renewables 2022 and previous years”, 2023; “Renewables 2022”, 2023; “SDG7 Database”, 2023; “Total renewable electricity capacity additions, 2001–2027”, 2022; “World Energy Balance Highlights”, 2023; “World Energy Investment 2023”, 2023; “World Energy Investment 2023 Datafile”, 2023; “World Energy Outlook 2023 – October 2023”, 2023).
From Figure 2, it can be seen that by 2060, a significant increase in the use of solar energy will be ensured with using of concentrated solar power (solar CSP) technologies and an almost fourfold increase in the amount of energy production using concentrated solar power technologies to 566 PJ, according to the forecast data of the “EU Basic Scenario” for the period until 2060.

Forecast data of fuel input electricity and heat generation from solar CSP for the European Union, according to the “EU Basic Scenario”, for the period up to 2060 year. Source. data obtained by the authors based on IEA databases (IEA, “Energy End-uses and Efficiency Indicators Highlights – November 2023”, 2023; “Energy Technology Perspectives 2023”, 2023; “Global Energy and Climate Model Documentation 2023, IEA, Paris”, 2023; “Global Energy and Climate Model 2023 key input data”, 2023; “Renewable Energy Market. Update - May 2022”, 2022; “Renewables”, 2022; “Renewables Data Explorer. Explore electricity, heat and transport data from Renewables 2022 and previous years”, 2023; “Renewables 2022”, 2023; “SDG7 Database”, 2023; “Total renewable electricity capacity additions, 2001–2027”, 2022; “World Energy Balance Highlights”, 2023; “World Energy Investment 2023”, 2023; “World Energy Investment 2023 Datafile”, 2023; “World Energy Outlook 2023 – October 2023”, 2023).
From Figure 3 shows that by 2060, a gradual increase in electricity production will be ensured using solar PV technologies. It should be noted that by 2060, according to forecast data of the “EU Basic Scenario”, a gradual increase in the amount of electricity production in the European Union using solar PV technologies is planned to the value of 243 TWh.

Forecast data of gross electricity generation from solar PV for the European Union, according to the “EU Basic Scenario”, for the period up to 2060. Source. data obtained by the authors based on IEA databases (IEA, “Energy End-uses and Efficiency Indicators Highlights – November 2023”, 2023; “Energy Technology Perspectives 2023”, 2023; “Global Energy and Climate Model Documentation 2023, IEA, Paris”, 2023; “Global Energy and Climate Model 2023 key input data”, 2023; “Renewable Energy Market. Update - May 2022”, 2022; “Renewables”, 2022; “Renewables Data Explorer. Explore electricity, heat and transport data from Renewables 2022 and previous years”, 2023; “Renewables 2022”, 2023; “SDG7 Database”, 2023; “Total renewable electricity capacity additions, 2001–2027”, 2022; “World Energy Balance Highlights”, 2023; “World Energy Investment 2023”, 2023; “World Energy Investment 2023 Datafile”, 2023; “World Energy Outlook 2023 – October 2023”, 2023).
From Figure 4, it can be seen that by 2060, a more than fivefold increase in electricity production will be ensured with the use of solar CSP technologies. It should be noted that by 2060, according to forecast data of the “EU Basic Scenario”, a gradual increase the amount of electricity production in the European Union using solar CSP technologies is planned to a value of 58 TWh.

Forecast data of gross electricity generation from solar CSP for the European Union, according to the “EU Basic Scenario”, for the period up to 2060. Source. data obtained by the authors based on IEA databases (IEA, “Energy End-uses and Efficiency Indicators Highlights – November 2023”, 2023; “Energy Technology Perspectives 2023”, 2023; “Global Energy and Climate Model Documentation 2023, IEA, Paris”, 2023; “Global Energy and Climate Model 2023 key input data”, 2023; “Renewable Energy Market. Update - May 2022”, 2022; “Renewables”, 2022; “Renewables Data Explorer. Explore electricity, heat and transport data from Renewables 2022 and previous years”, 2023; “Renewables 2022”, 2023; “SDG7 Database”, 2023; “Total renewable electricity capacity additions, 2001–2027”, 2022; “World Energy Balance Highlights”, 2023; “World Energy Investment 2023”, 2023; “World Energy Investment 2023 Datafile”, 2023; “World Energy Outlook 2023 – October 2023”, 2023).
From Figure 5 shows that by 2060, a gradual increase in the electrical capacity of installations based on solar PV technologies will be ensured. It should be noted that by 2060, according to forecast data of the “EU Basic Scenario”, it is planned to gradually increase the electrical capacity of installations based on solar PV technologies for the European Union to a value of 195 GW.

Forecast data of gross electricity capacity from solar PV for the European Union, according to the “EU Basic Scenario”, for the period up to 2060. Source. data obtained by the authors based on IEA databases (IEA, “Energy End-uses and Efficiency Indicators Highlights – November 2023”, 2023; “Energy Technology Perspectives 2023”, 2023; “Global Energy and Climate Model Documentation 2023, IEA, Paris”, 2023; “Global Energy and Climate Model 2023 key input data”, 2023; “Renewable Energy Market. Update - May 2022”, 2022; “Renewables”, 2022; “Renewables Data Explorer. Explore electricity, heat and transport data from Renewables 2022 and previous years”, 2023; “Renewables 2022”, 2023; “SDG7 Database”, 2023; “Total renewable electricity capacity additions, 2001–2027”, 2022; “World Energy Balance Highlights”, 2023; “World Energy Investment 2023”, 2023; “World Energy Investment 2023 Datafile”, 2023; “World Energy Outlook 2023 – October 2023”, 2023).
From Figure 6, it can be seen that by 2060, a more than four-fold in-crease in the electrical capacity of installations based on solar CSP technologies will be ensured. It should be noted that by 2060, according to forecast data of the “EU Basic Scenario”, a significant increase in the electrical capacity of installations based on solar CSP technologies is planned for the European Union to the value of 17 GW.
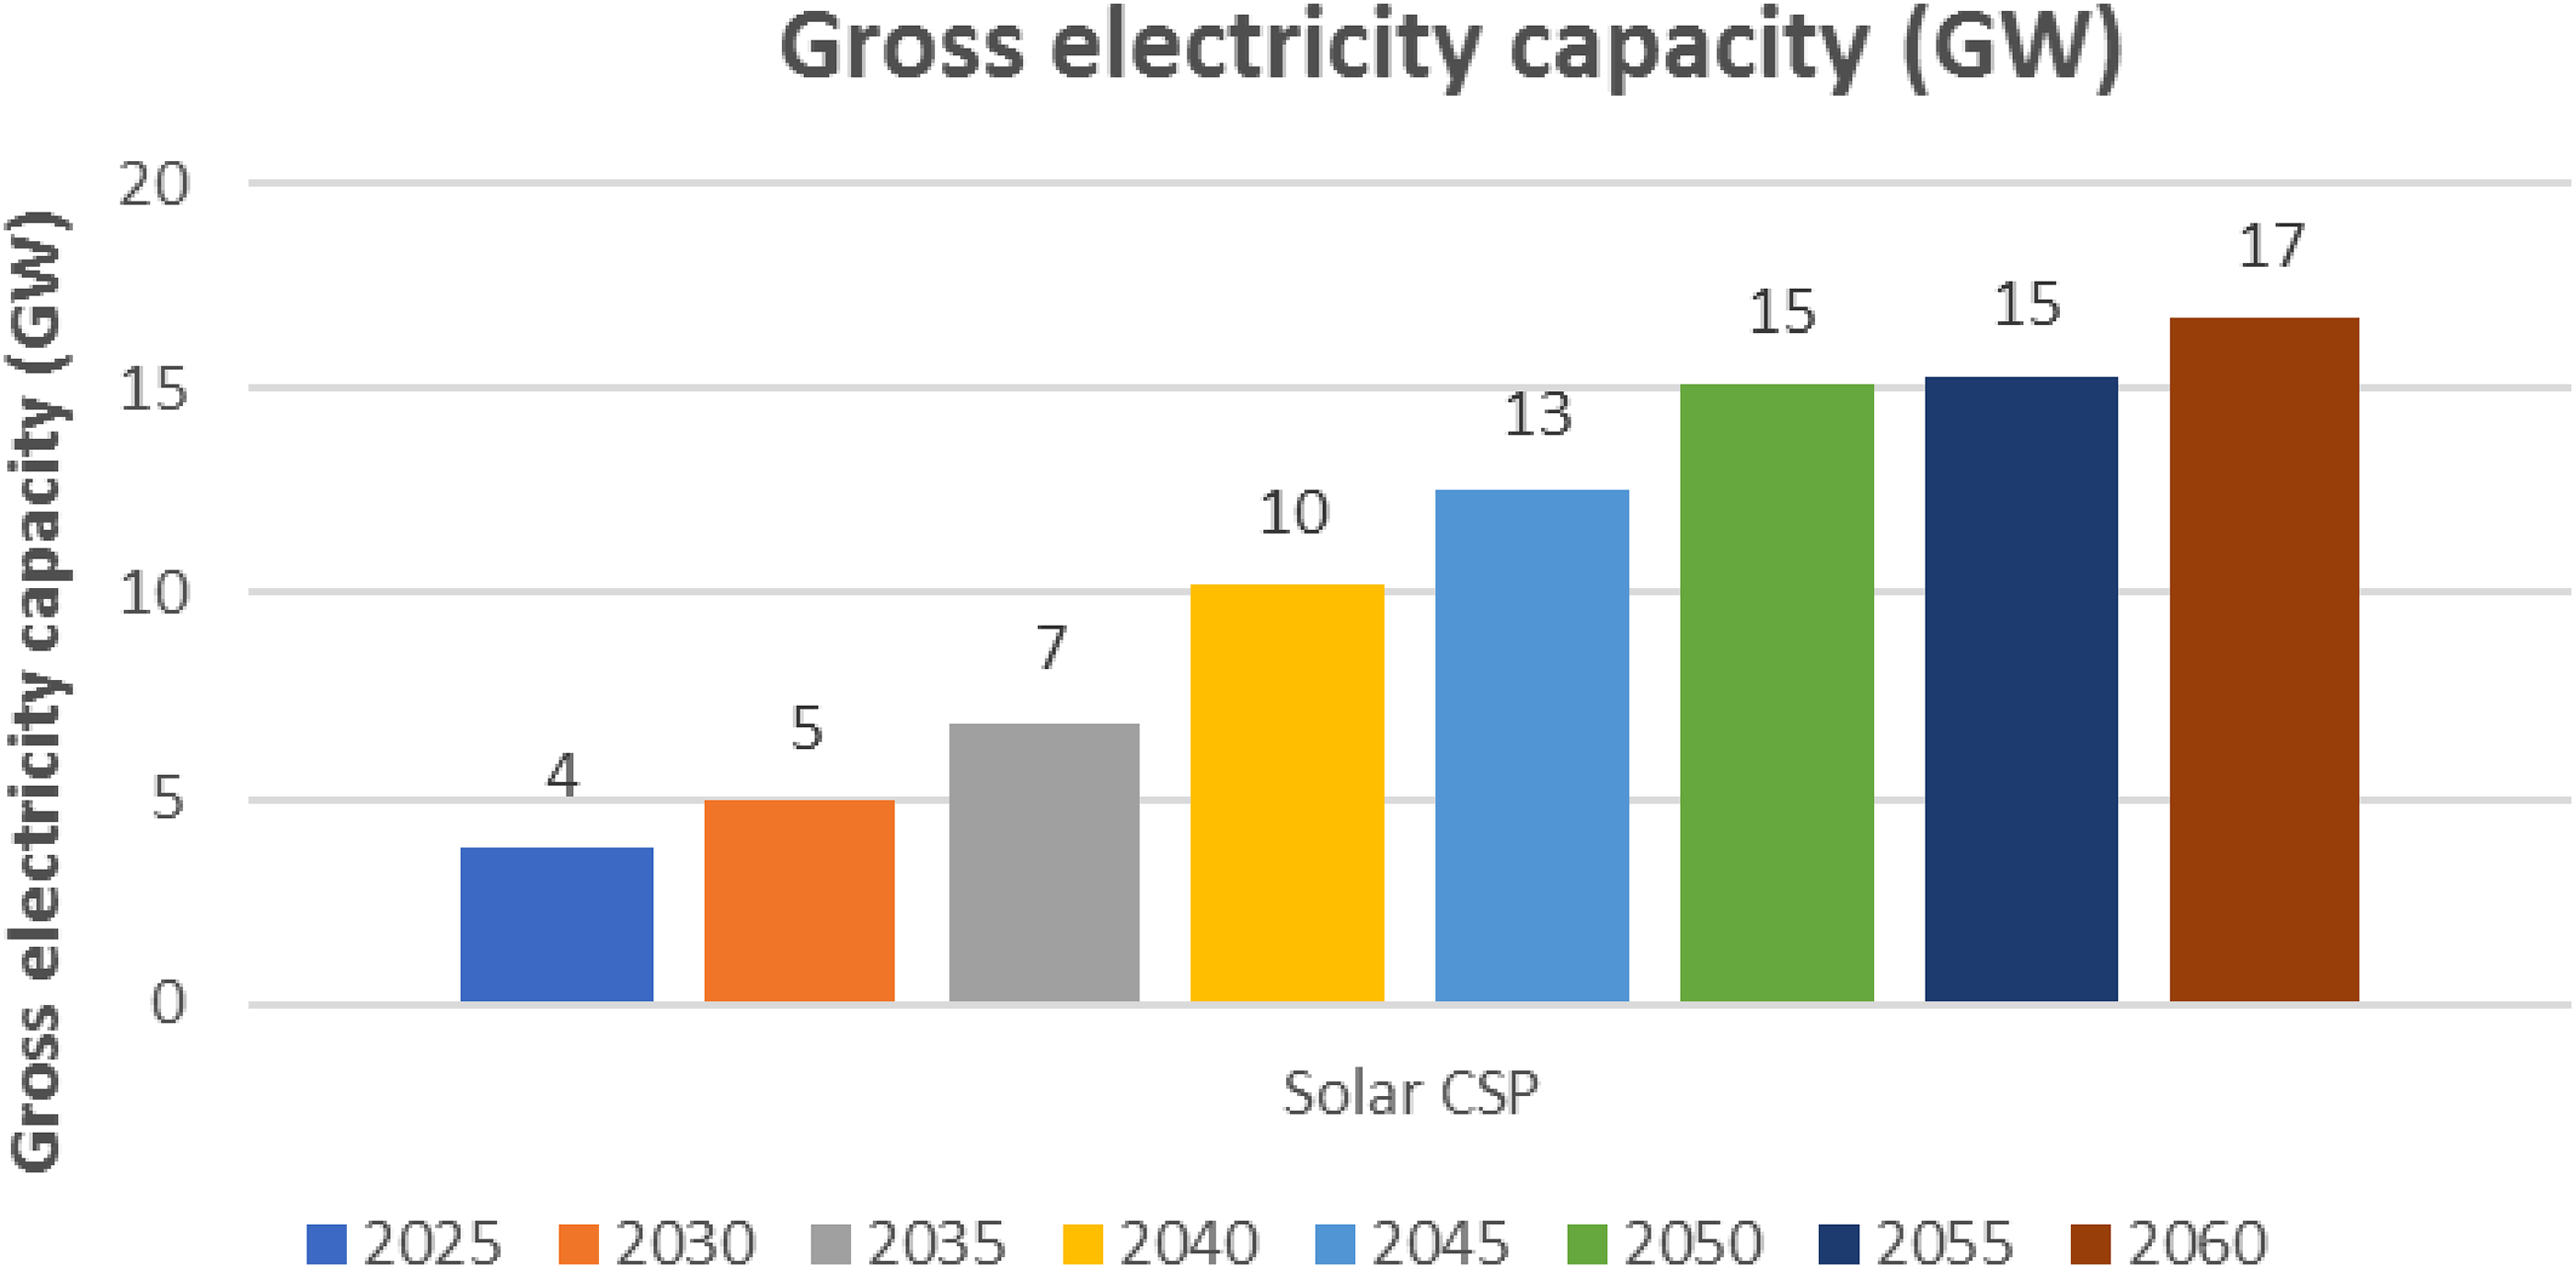
Forecast data of gross electricity capacity from solar CSP for the European Union, according to the “EU Basic Scenario”, for the period up to 2060. Source. data obtained by the authors based on IEA databases (IEA, “Energy End-uses and Efficiency Indicators Highlights – November 2023”, 2023; “Energy Technology Perspectives 2023”, 2023; “Global Energy and Climate Model Documentation 2023, IEA, Paris”, 2023; “Global Energy and Climate Model 2023 key input data”, 2023; “Renewable Energy Market. Update - May 2022”, 2022; “Renewables”, 2022; “Renewables Data Explorer. Explore electricity, heat and transport data from Renewables 2022 and previous years”, 2023; “Renewables 2022”, 2023; “SDG7 Database”, 2023; “Total renewable electricity capacity additions, 2001–2027”, 2022; “World Energy Balance Highlights”, 2023; “World Energy Investment 2023”, 2023; “World Energy Investment 2023 Datafile”, 2023; “World Energy Outlook 2023 – October 2023”, 2023).
According to the data in Table 1, significant growth in solar PV and CSP generation should be expected in the foreseeable future, according to the “Stated Policies Scenario”, for the period up to 2030, 2040 and 2050 years. The compounded average annual growth rate (CAAGR) shown in Table 1 is not a true rate of profit, but rather a representative index. Essentially, it is a number that describes the rate at which an investment would grow if it grew at the same rate every year and the profits were reinvested at the end of each year (“Compounded Average Annual Growth Rate (CAAGR). Formula and Calculation”, 2023).
Forecast data of total generation, renewables generation, solar PV and CSP generation in terawatt-hours (TWh), shares and CAAGR indexes, according to the “Stated Policies Scenario”, for the period up to 2030, 2040 and 2050.

Source. data obtained by the authors based on IEA databases (IEA, “Energy End-uses and Efficiency Indicators Highlights – November 2023”, 2023; “Global Energy and Climate Model Documentation 2023, IEA, Paris”, 2023;“World Energy Balance Highlights”, 2023; “World Energy Investment 2023”, 2023; “World Energy Investment 2023 Datafile”, 2023; “World Energy Outlook 2023 – October 2023”, 2023).
According to the data in Table 2, a significant increase in solar PV and CSP generation capacities should be expected in the foreseeable future, according to the “Stated Policies Scenario”, for the period up to 2030, 2040 and 2050.
Forecast data of total capacity, renewables capacity, solar PV and CSP capacity in GW, shares and CAAGR indexes, according to the “Stated Policies Scenario”, for the period up to 2030, 2040 and 2050.

Source. data obtained by the authors based on IEA databases (IEA, “Energy End-uses and Efficiency Indicators Highlights – November 2023”, 2023; “Global Energy and Climate Model Documentation 2023, IEA, Paris”, 2023;“World Energy Balance Highlights”, 2023; “World Energy Investment 2023”, 2023; “World Energy Investment 2023 Datafile”, 2023; “World Energy Outlook 2023 – October 2023”, 2023).
As can be seen from the data in Table 3, the forecast data of total CO2 emissions will not change significantly during the forecast period; however, CO2 emissions in the electricity and heat generation sectors, according to the “Stated Policies Scenario”, for the period up to 2030, 2040 and 2050, will be significantly reduced.
Forecast data of total CO2 emissions, electricity and heat sectors CO2 emissions, final consumption in million tonnes of CO2 emissions (Mt CO2) and CAAGR index, according to the “Stated Policies Scenario”, for the period up to 2030, 2040 and 2050.

*Includes emissions from industrial processes and flaring.
**Includes emissions from industrial processes.
Source. data obtained by the authors based on IEA databases (IEA, “Energy End-uses and Efficiency Indicators Highlights – November 2023”, 2023; “Global Energy and Climate Model Documentation 2023, IEA, Paris”, 2023;“World Energy Balance Highlights”, 2023; “World Energy Investment 2023”, 2023; “World Energy Investment 2023 Datafile”, 2023; “World Energy Outlook 2023 – October 2023”, 2023).
Table 4 shows the projected data of total generation, generation from renewable energy sources, solar PV and CSP generation in terawatt-hours (TWh), shares and CAAGR indices, under the “Announced Pledges Scenario”, for the period up to 2030, 2040 and 2050 years. According to the data in this table, significant growth in solar PV and CSP generation should be expected in the foreseeable future, mainly due to the use of solar PV generation. It should be noted that the amount of solar green generation will be approximately one-third to one-half of the total amount of energy generation from non-traditional sources.
Forecast data of total generation, renewables generation, solar PV and CSP generation in terawatt-hours (TWh), shares and CAAGR indexes, according to the “Announced Pledges Scenario”, for the period up to 2030, 2040 and 2050.

Source. data obtained by the authors based on IEA databases (IEA, “Energy End-uses and Efficiency Indicators Highlights – November 2023”, 2023; “Global Energy and Climate Model Documentation 2023, IEA, Paris”, 2023;“World Energy Balance Highlights”, 2023; “World Energy Investment 2023”, 2023; “World Energy Investment 2023 Datafile”, 2023; “World Energy Outlook 2023 – October 2023”, 2023).
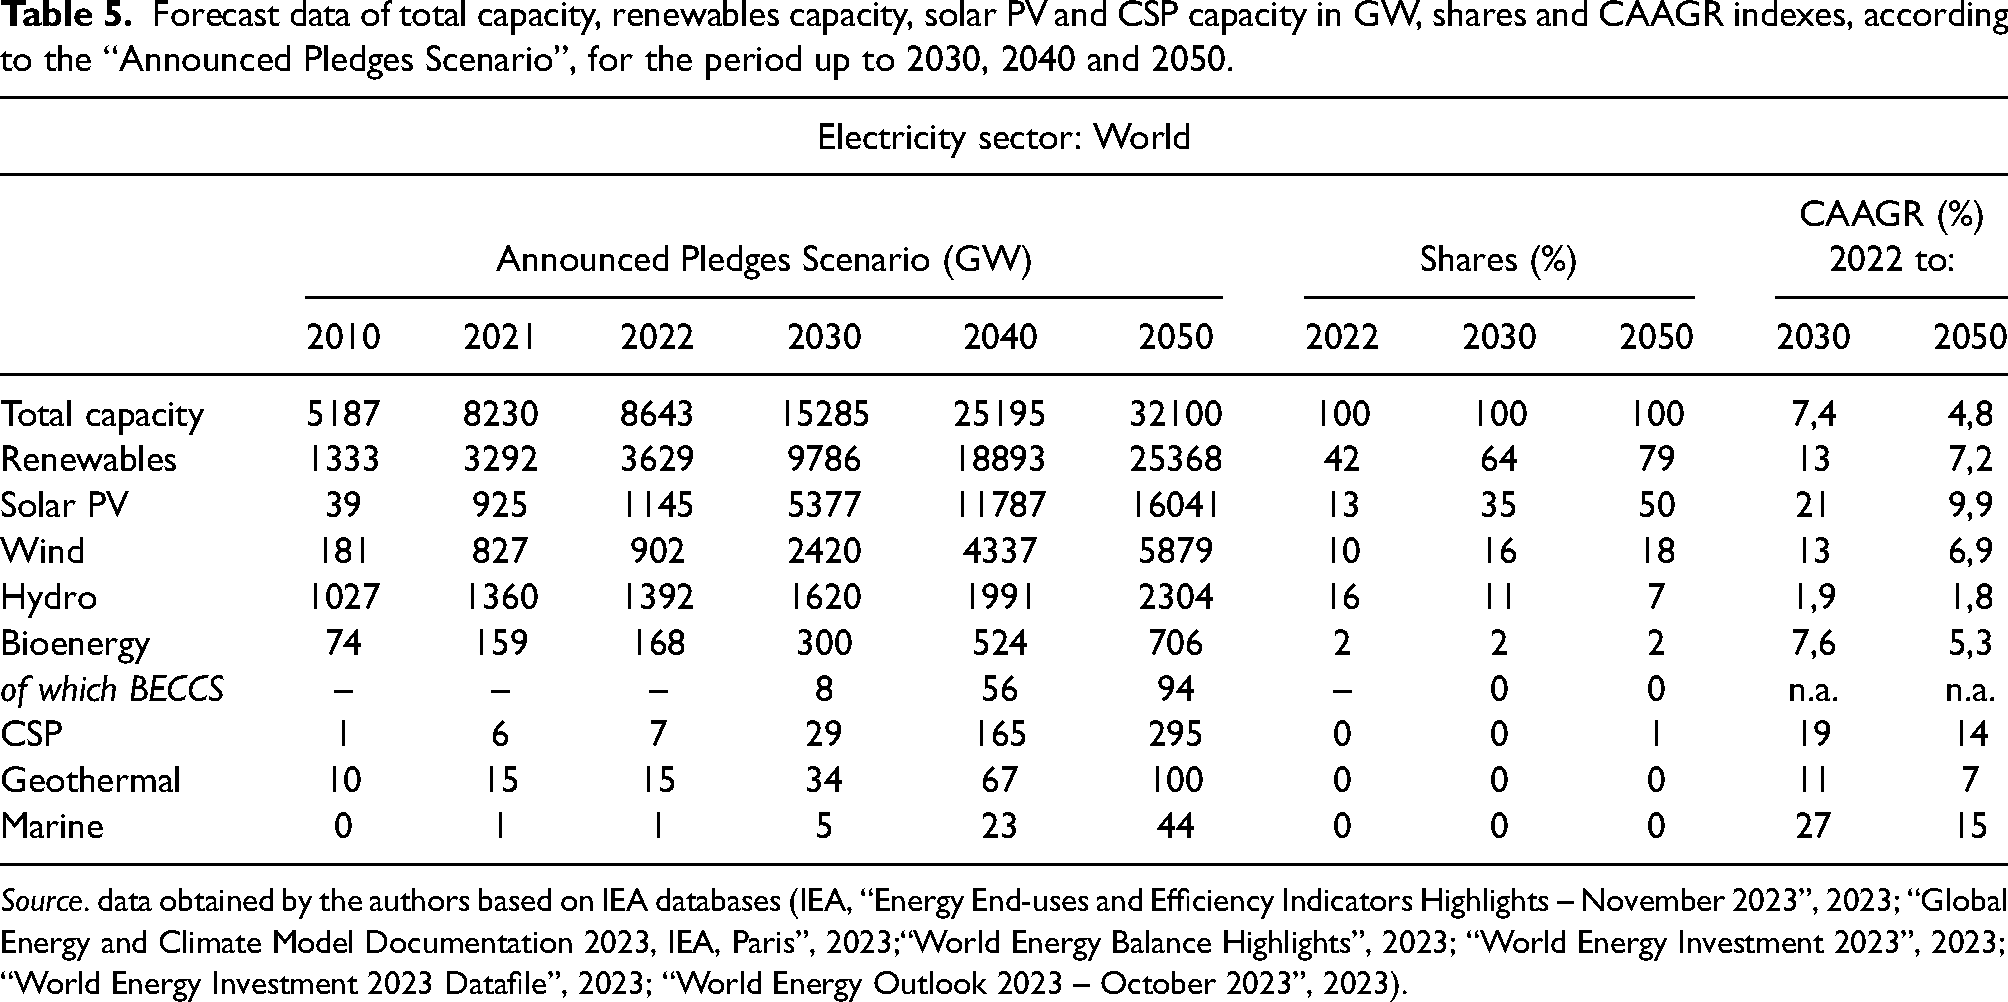
Table 5 shows the projected data of total capacity, renewable capacity, solar PV and CSP generation capacity in GW, shares and CAAGR indices, according to the “Announced Pledges Scenario”, for the period up to 2030, 2040 and 2050. According to the data in this table, a significant increase in the capacity of solar PV and CSP generation should be expected in the foreseeable future, mainly due to the use of solar PV generation. It should be noted that the volume of installed capacity for solar green generation will be approximately from a third to a half of the total volume of energy generation from non-traditional renewable sources.
Forecast data of total capacity, renewables capacity, solar PV and CSP capacity in GW, shares and CAAGR indexes, according to the “Announced Pledges Scenario”, for the period up to 2030, 2040 and 2050.
Source. data obtained by the authors based on IEA databases (IEA, “Energy End-uses and Efficiency Indicators Highlights – November 2023”, 2023; “Global Energy and Climate Model Documentation 2023, IEA, Paris”, 2023;“World Energy Balance Highlights”, 2023; “World Energy Investment 2023”, 2023; “World Energy Investment 2023 Datafile”, 2023; “World Energy Outlook 2023 – October 2023”, 2023).
As can be seen from the data in Table 6, the projected data of total CO2 emissions will decrease more significantly during the forecast period than the data of the “Stated Policies Scenario” (see Table 3); the volumes of CO2 emissions in the electricity and heat generation sectors, according to the “Announced Pledges Scenario”, for the period up to 2030, 2040 and 2050, will also decrease more significantly than under the STEPS scenario (see Table 3).
Forecast data of total CO2 emissions, electricity and heat sectors CO2 emissions, final consumption in million tonnes of CO2 emissions (Mt CO2) and CAAGR index, according to the APS Scenario, for the period up to 2030, 2040 and 2050.

*Includes emissions from industrial processes and flaring.
**Includes emissions from industrial processes.
Source. data obtained by the authors based on IEA databases (IEA, “Energy End-uses and Efficiency Indicators Highlights – November 2023”, 2023; “Global Energy and Climate Model Documentation 2023, IEA, Paris”, 2023;“World Energy Balance Highlights”, 2023; “World Energy Investment 2023”, 2023; “World Energy Investment 2023 Datafile”, 2023; “World Energy Outlook 2023 – October 2023”, 2023).
Table 7 shows the projected data of total generation, generation from renewable energy sources, solar PV and CSP generation in terawatt-hours (TWh), shares and CAAGR indices, according to the “Net Zero Emissions by 2050” Scenario, for the period up to 2030, 2040 and 2050. According to the data in this table, significant growth in solar PV and CSP generation should be expected in the foreseeable future, mainly due to the use of solar PV generation. It should be noted that the amount of solar green generation will be approximately one-third to one-half of the total amount of energy generation from non-traditional sources.
Forecast data of total generation, renewables generation, solar PV and CSP generation in terawatt-hours (TWh), shares and CAAGR indexes, according to the “Net Zero Emissions by 2050 Scenario”, for the period up to 2030, 2040 and 2050.

Source. data obtained by the authors based on IEA databases (IEA, “Energy End-uses and Efficiency Indicators Highlights – November 2023”, 2023; “Global Energy and Climate Model Documentation 2023, IEA, Paris”, 2023;“World Energy Balance Highlights”, 2023; “World Energy Investment 2023”, 2023; “World Energy Investment 2023 Datafile”, 2023; “World Energy Outlook 2023 – October 2023”, 2023).
Table 8 shows the projected data of the total capacity, the capacity of renewable energy sources, the capacity of solar photovoltaic and CSP generation in GW, shares and CAAGR indices, according to the “Net Zero Emissions by 2050” Scenario, for the period until 2030, 2040 and 2050 years.
Forecast data of total capacity, renewables capacity, solar PV and CSP capacity in GW, shares and CAAGR indexes, according to the “Net Zero Emissions by 2050” Scenario, for the period up to 2030, 2040 and 2050.

Source. data obtained by the authors based on IEA databases (IEA, “Energy End-uses and Efficiency Indicators Highlights – November 2023”, 2023; “Global Energy and Climate Model Documentation 2023, IEA, Paris”, 2023;“World Energy Balance Highlights”, 2023; “World Energy Investment 2023”, 2023; “World Energy Investment 2023 Datafile”, 2023; “World Energy Outlook 2023 – October 2023”, 2023).
According to the data in Table 8, a significant increase in the capacities of solar PV and CSP generation should be expected in the foreseeable future, mainly due to the use of solar PV generation. It should be noted that the amount of installed capacity for solar green generation will be approximately from a third to a half of the amount of total energy generation from non-traditional renewable sources.
Table 9 shows the projected data of total CO2 emissions, CO2 emissions in the electricity and heat generation sectors, final consumption in million tons of CO2 emissions (Mt CO2) and the CAAGR index, according to the “Net Zero Emissions by 2050” Scenario, for the period up to 2030, 2040 and 2050.
Forecast data of total CO2 emissions, electricity and heat sectors CO2 emissions, final consumption in million tonnes of CO2 emissions (Mt CO2) and CAAGR index, according to the “Net Zero Emissions by 2050 Scenario”, for the period up to 2030, 2040 and 2050.

*Includes emissions from industrial processes and flaring.
**Includes emissions from industrial processes.
Source. data obtained by the authors based on IEA databases (IEA, “Energy End-uses and Efficiency Indicators Highlights – November 2023”, 2023; “Global Energy and Climate Model Documentation 2023, IEA, Paris”, 2023;“World Energy Balance Highlights”, 2023; “World Energy Investment 2023”, 2023; “World Energy Investment 2023 Datafile”, 2023; “World Energy Outlook 2023 – October 2023”, 2023).
As can be seen from the data in Table 9, the projected data of total CO2 emissions during the forecast period, according to the “Net Zero Emissions by 2050” Scenario, will decrease more significantly than the data of the “Stated Policies Scenario” (see Table 3) and “Announced Pledges Scenario” (see Table 6); volumes of CO2 emissions in the electricity and heat generation sectors, according to the “Net Zero Emissions by 2050” Scenario, for the period until 2030, 2040 and 2050, will also decrease more significantly than under the STEPS scenarios (see Table. 3) and APS (see Table 6).
According to the data shown in Figure 7, one should expect a decrease in the volume of general energy supply in Europe and the European Union in the foreseeable future, according to the STEPS and APS scenarios for the period up to 2030 and 2050.

Historical and forecast data of total energy supply in exajoules (EJ), according to the STEPS and APS for the period up to 2030 and 2050. Source. data obtained by the authors based on IEA databases (IEA, “Energy End-uses and Efficiency Indicators Highlights – November 2023”, 2023; “Global Energy and Climate Model Documentation 2023, IEA, Paris”, 2023;“World Energy Balance Highlights”, 2023; “World Energy Investment 2023”, 2023; “World Energy Investment 2023 Datafile”, 2023; “World Energy Outlook 2023 – October 2023”, 2023).
According to the data shown in Figure 8, we should expect a significant increase in the volume of energy generation from renewable sources in the foreseeable future in the world, Europe and the European Union, according to the STEPS and APS scenarios for the period up to 2030 and 2050.
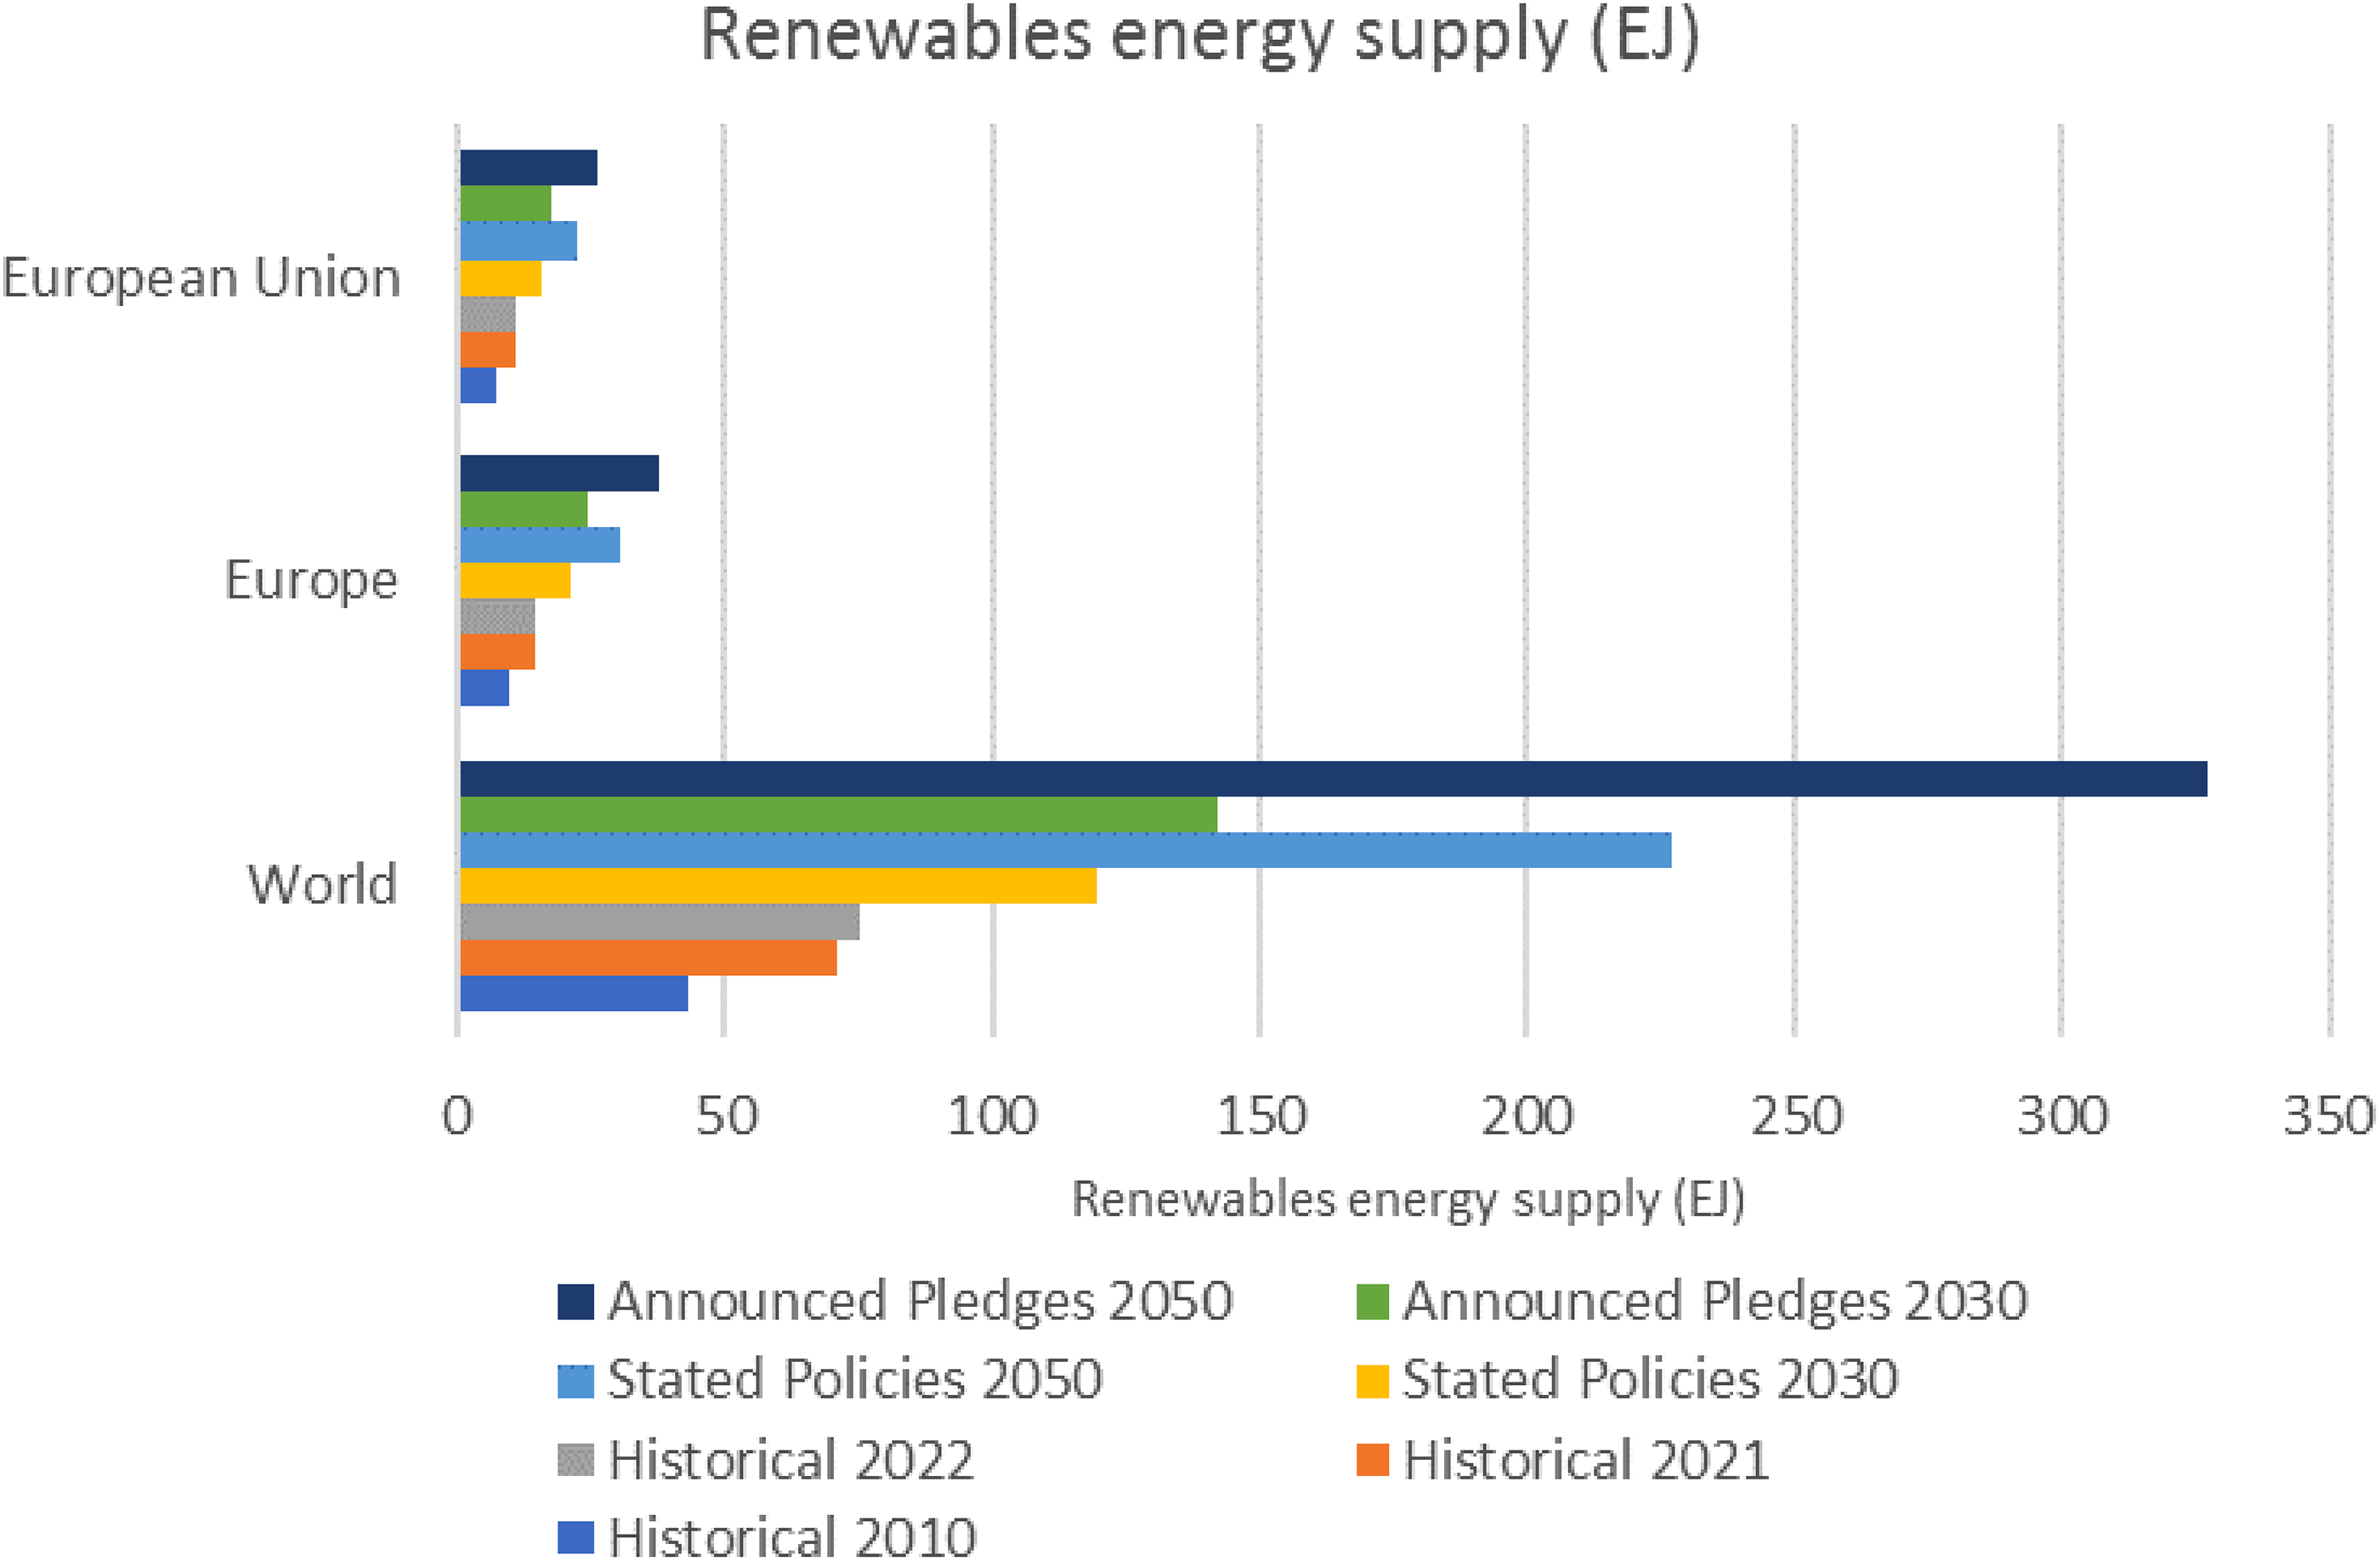
Historical and forecast data of renewables energy supply in exajoules (EJ), according to the STEPS and APS for the period up to 2030 and 2050. Source. data obtained by the authors based on IEA databases (IEA, “Energy End-uses and Efficiency Indicators Highlights – November 2023”, 2023; “Global Energy and Climate Model Documentation 2023, IEA, Paris”, 2023;“World Energy Balance Highlights”, 2023; “World Energy Investment 2023”, 2023; “World Energy Investment 2023 Datafile”, 2023; “World Energy Outlook 2023 – October 2023”, 2023).
Figure 9 shows the historical and forecast data of electricity production in terawatt-hours (TWh) in the world, Europe and the European Union, according to the STEPS and APS scenarios for the period up to 2030 and 2050. According to the data shown in Figure 9, we should expect an increase in the volume of electricity production in the foreseeable future, which will require the widespread use of environmentally friendly and cheap technologies for generating electricity.

Historical and forecast data of electricity generation in terawatt-hours (TWh), according to the STEPS and APS for the period up to 2030 and 2050. Source. data obtained by the authors based on IEA databases (IEA, “Energy End-uses and Efficiency Indicators Highlights – November 2023”, 2023; “Global Energy and Climate Model Documentation 2023, IEA, Paris”, 2023;“World Energy Balance Highlights”, 2023; “World Energy Investment 2023”, 2023; “World Energy Investment 2023 Datafile”, 2023; “World Energy Outlook 2023 – October 2023”, 2023).
Figure 10 shows the historical and forecast data of electricity production from renewable sources in terawatt hours (TWh) in the world, Europe and the European Union, according to the STEPS and APS scenarios for the period up to 2030 and 2050. According to the data shown in Figure 10, we should expect a significant increase in the volume of electricity production from renewable sources in the foreseeable future, which will require the widespread use of environmentally friendly and cheap technologies for generating electricity. A significant increase in the volume of electricity production from renewable sources will be ensured mainly due to the use of solar PV generation. It should be noted that the amount of solar green generation will be approximately one-third to one-half of the total amount of energy generation from non-traditional sources, as mentioned earlier.
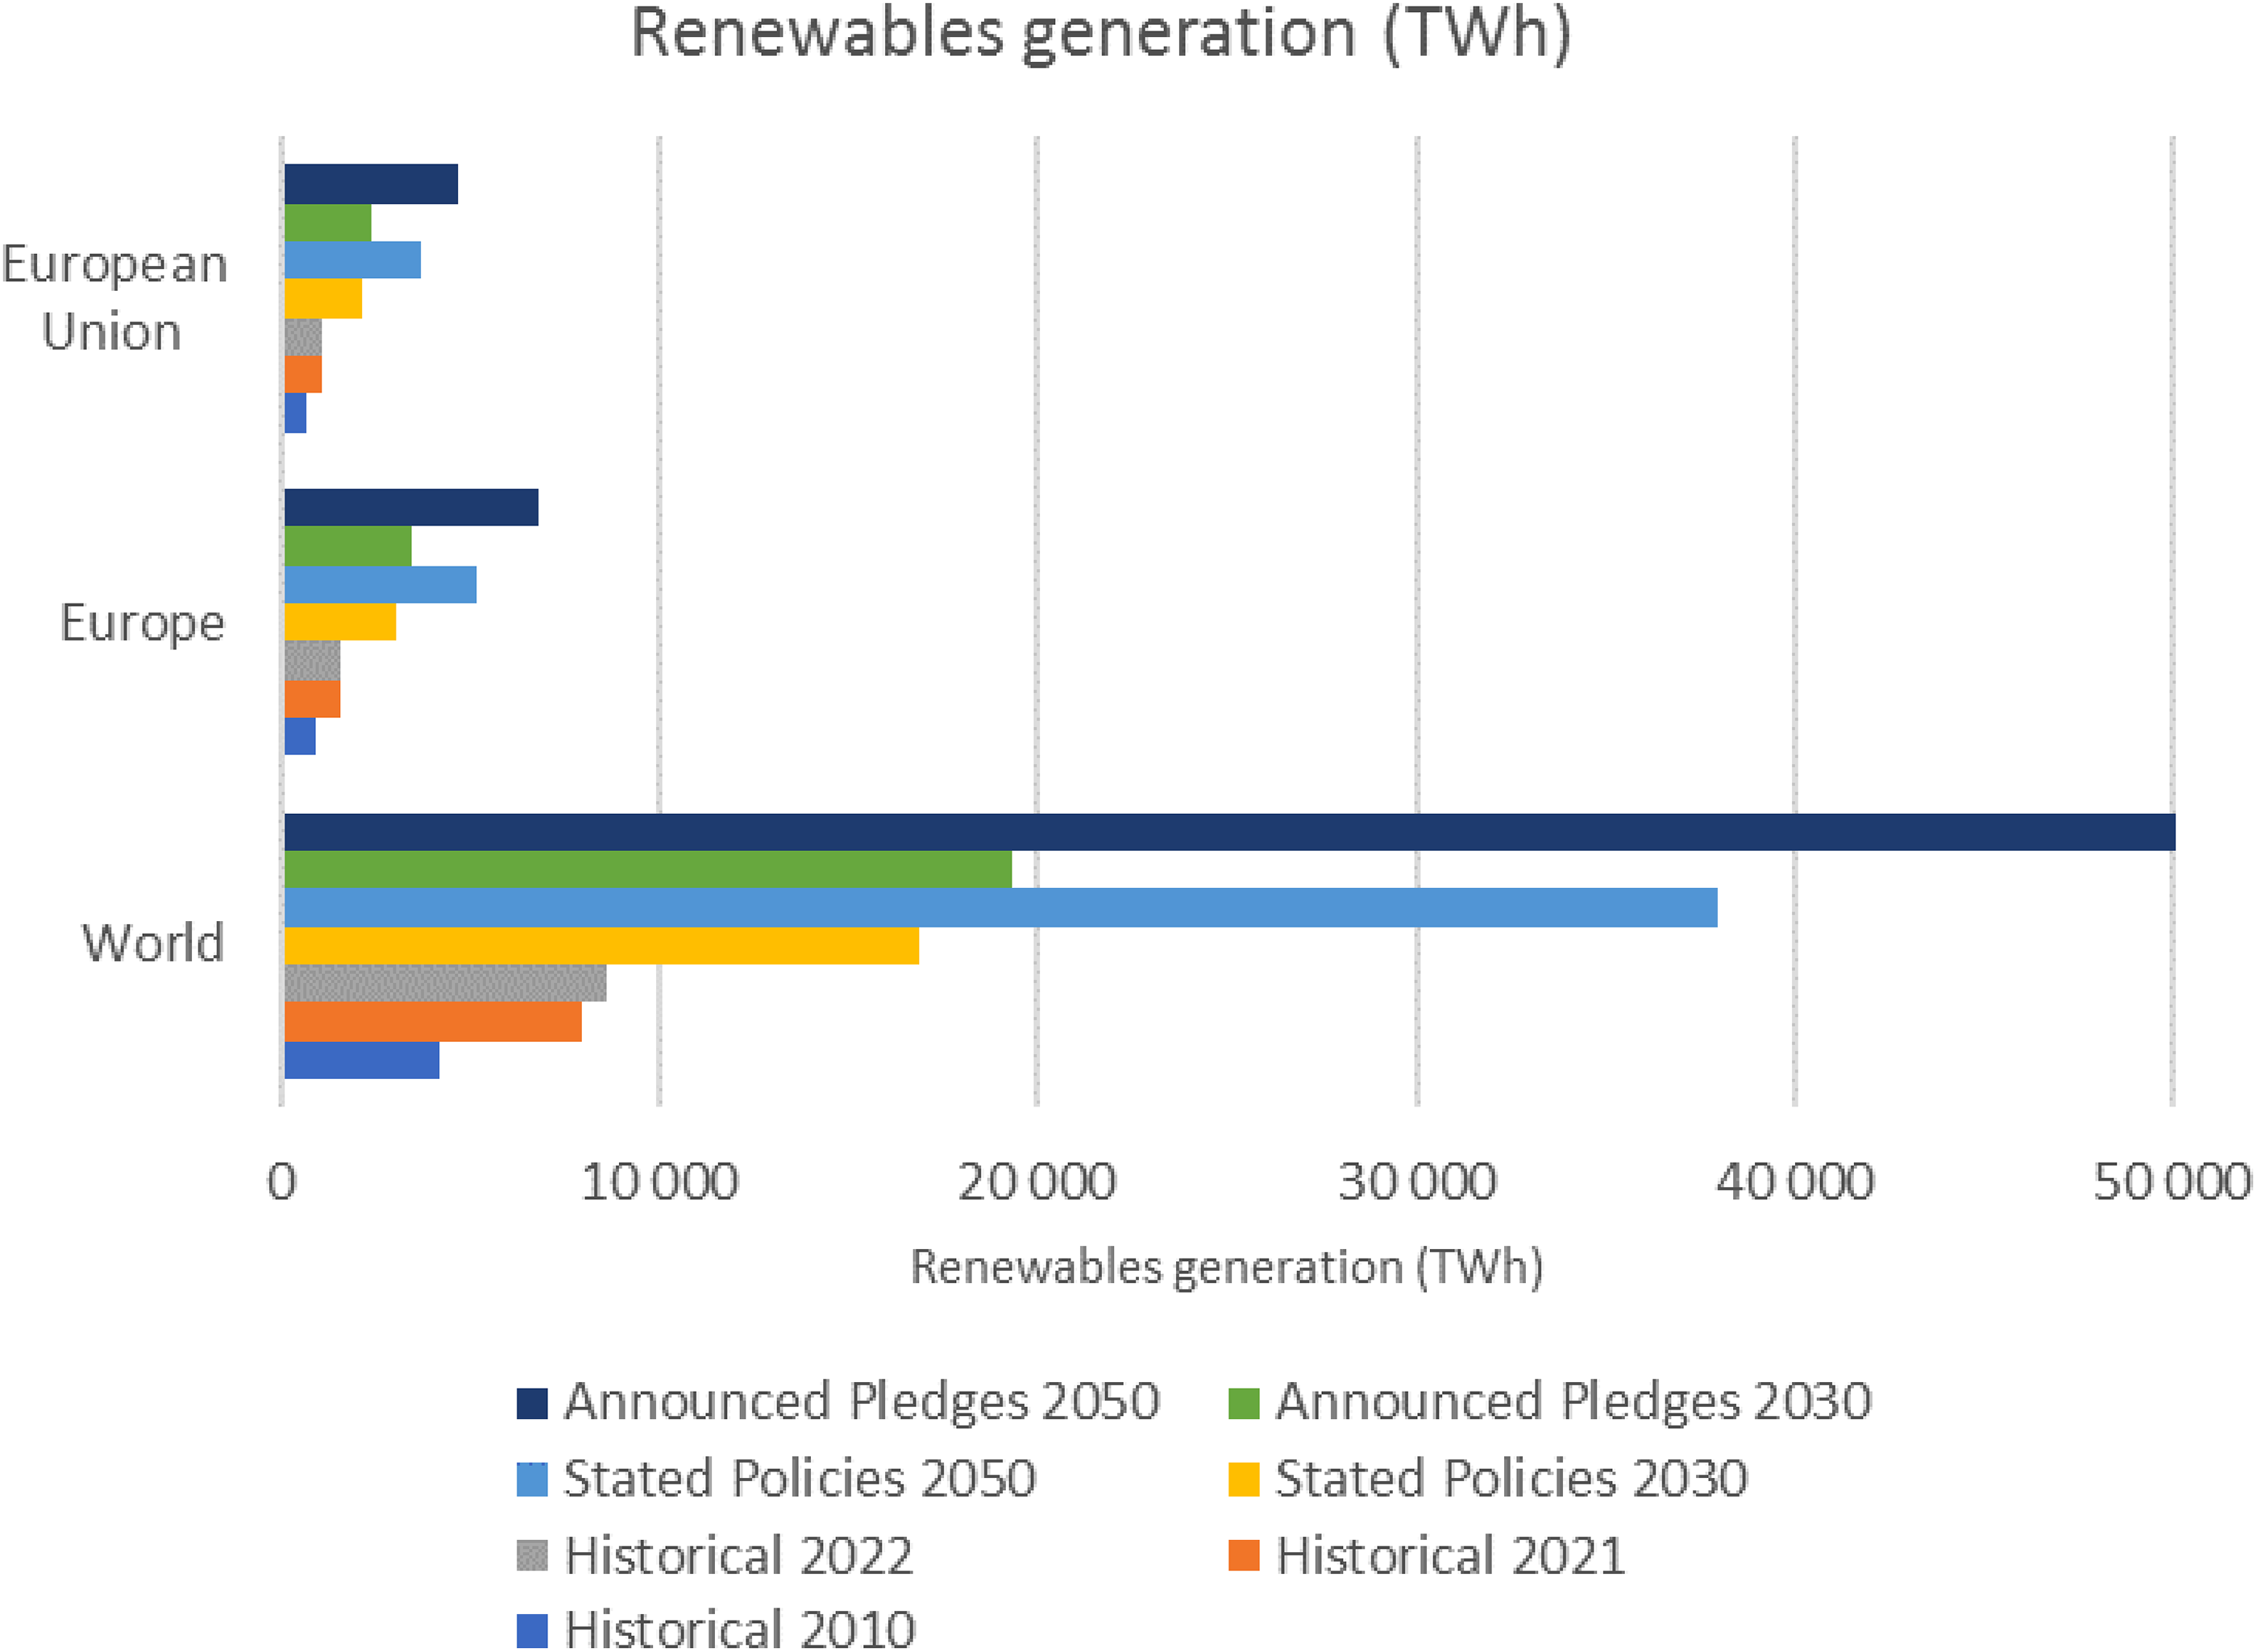
Historical and forecast data of renewables generation in terawatt-hours (TWh), according to the STEPS and APS for the period up to 2030 and 2050. Source. data obtained by the authors based on IEA databases (IEA, “Energy End-uses and Efficiency Indicators Highlights – November 2023”, 2023; “Global Energy and Climate Model Documentation 2023, IEA, Paris”, 2023;“World Energy Balance Highlights”, 2023; “World Energy Investment 2023”, 2023; “World Energy Investment 2023 Datafile”, 2023; “World Energy Outlook 2023 – October 2023”, 2023).
Figure 11 shows the historical and forecast data of electricity production in terawatt-hours (TWh) using solar PV generation technologies in the world, Europe and the European Union, according to the STEPS and APS scenarios for the period up to 2030 and 2050. According to the forecast data from Figure 11, we should expect a significant increase in the volume of electricity production using solar PV generation technologies in the foreseeable future. It should be noted that the amount of solar green generation will be approximately one-third to one-half of the total amount of energy generation from non-traditional renewable sources, as mentioned earlier.

Historical and forecast data of solar PV generation in terawatt-hours (TWh), according to the STEPS and APS for the period up to 2030 and 2050. Source. data obtained by the authors based on IEA databases (IEA, “Energy End-uses and Efficiency Indicators Highlights – November 2023”, 2023; “Global Energy and Climate Model Documentation 2023, IEA, Paris”, 2023;“World Energy Balance Highlights”, 2023; “World Energy Investment 2023”, 2023; “World Energy Investment 2023 Datafile”, 2023; “World Energy Outlook 2023 – October 2023”, 2023).
Figure 12 shows historical and projected total CO2 emissions (including emissions from industrial processes and combustion) (Mt CO2) in the world, Europe and the European Union, according to the STEPS and APS scenarios for the period up to 2030 and 2050. According to the forecast data from Figure 12, we should expect a decrease in total CO2 emissions in the foreseeable future. This can be ensured by increasing the amount of solar green electricity generation, which will lead to a significant reduction in emissions.
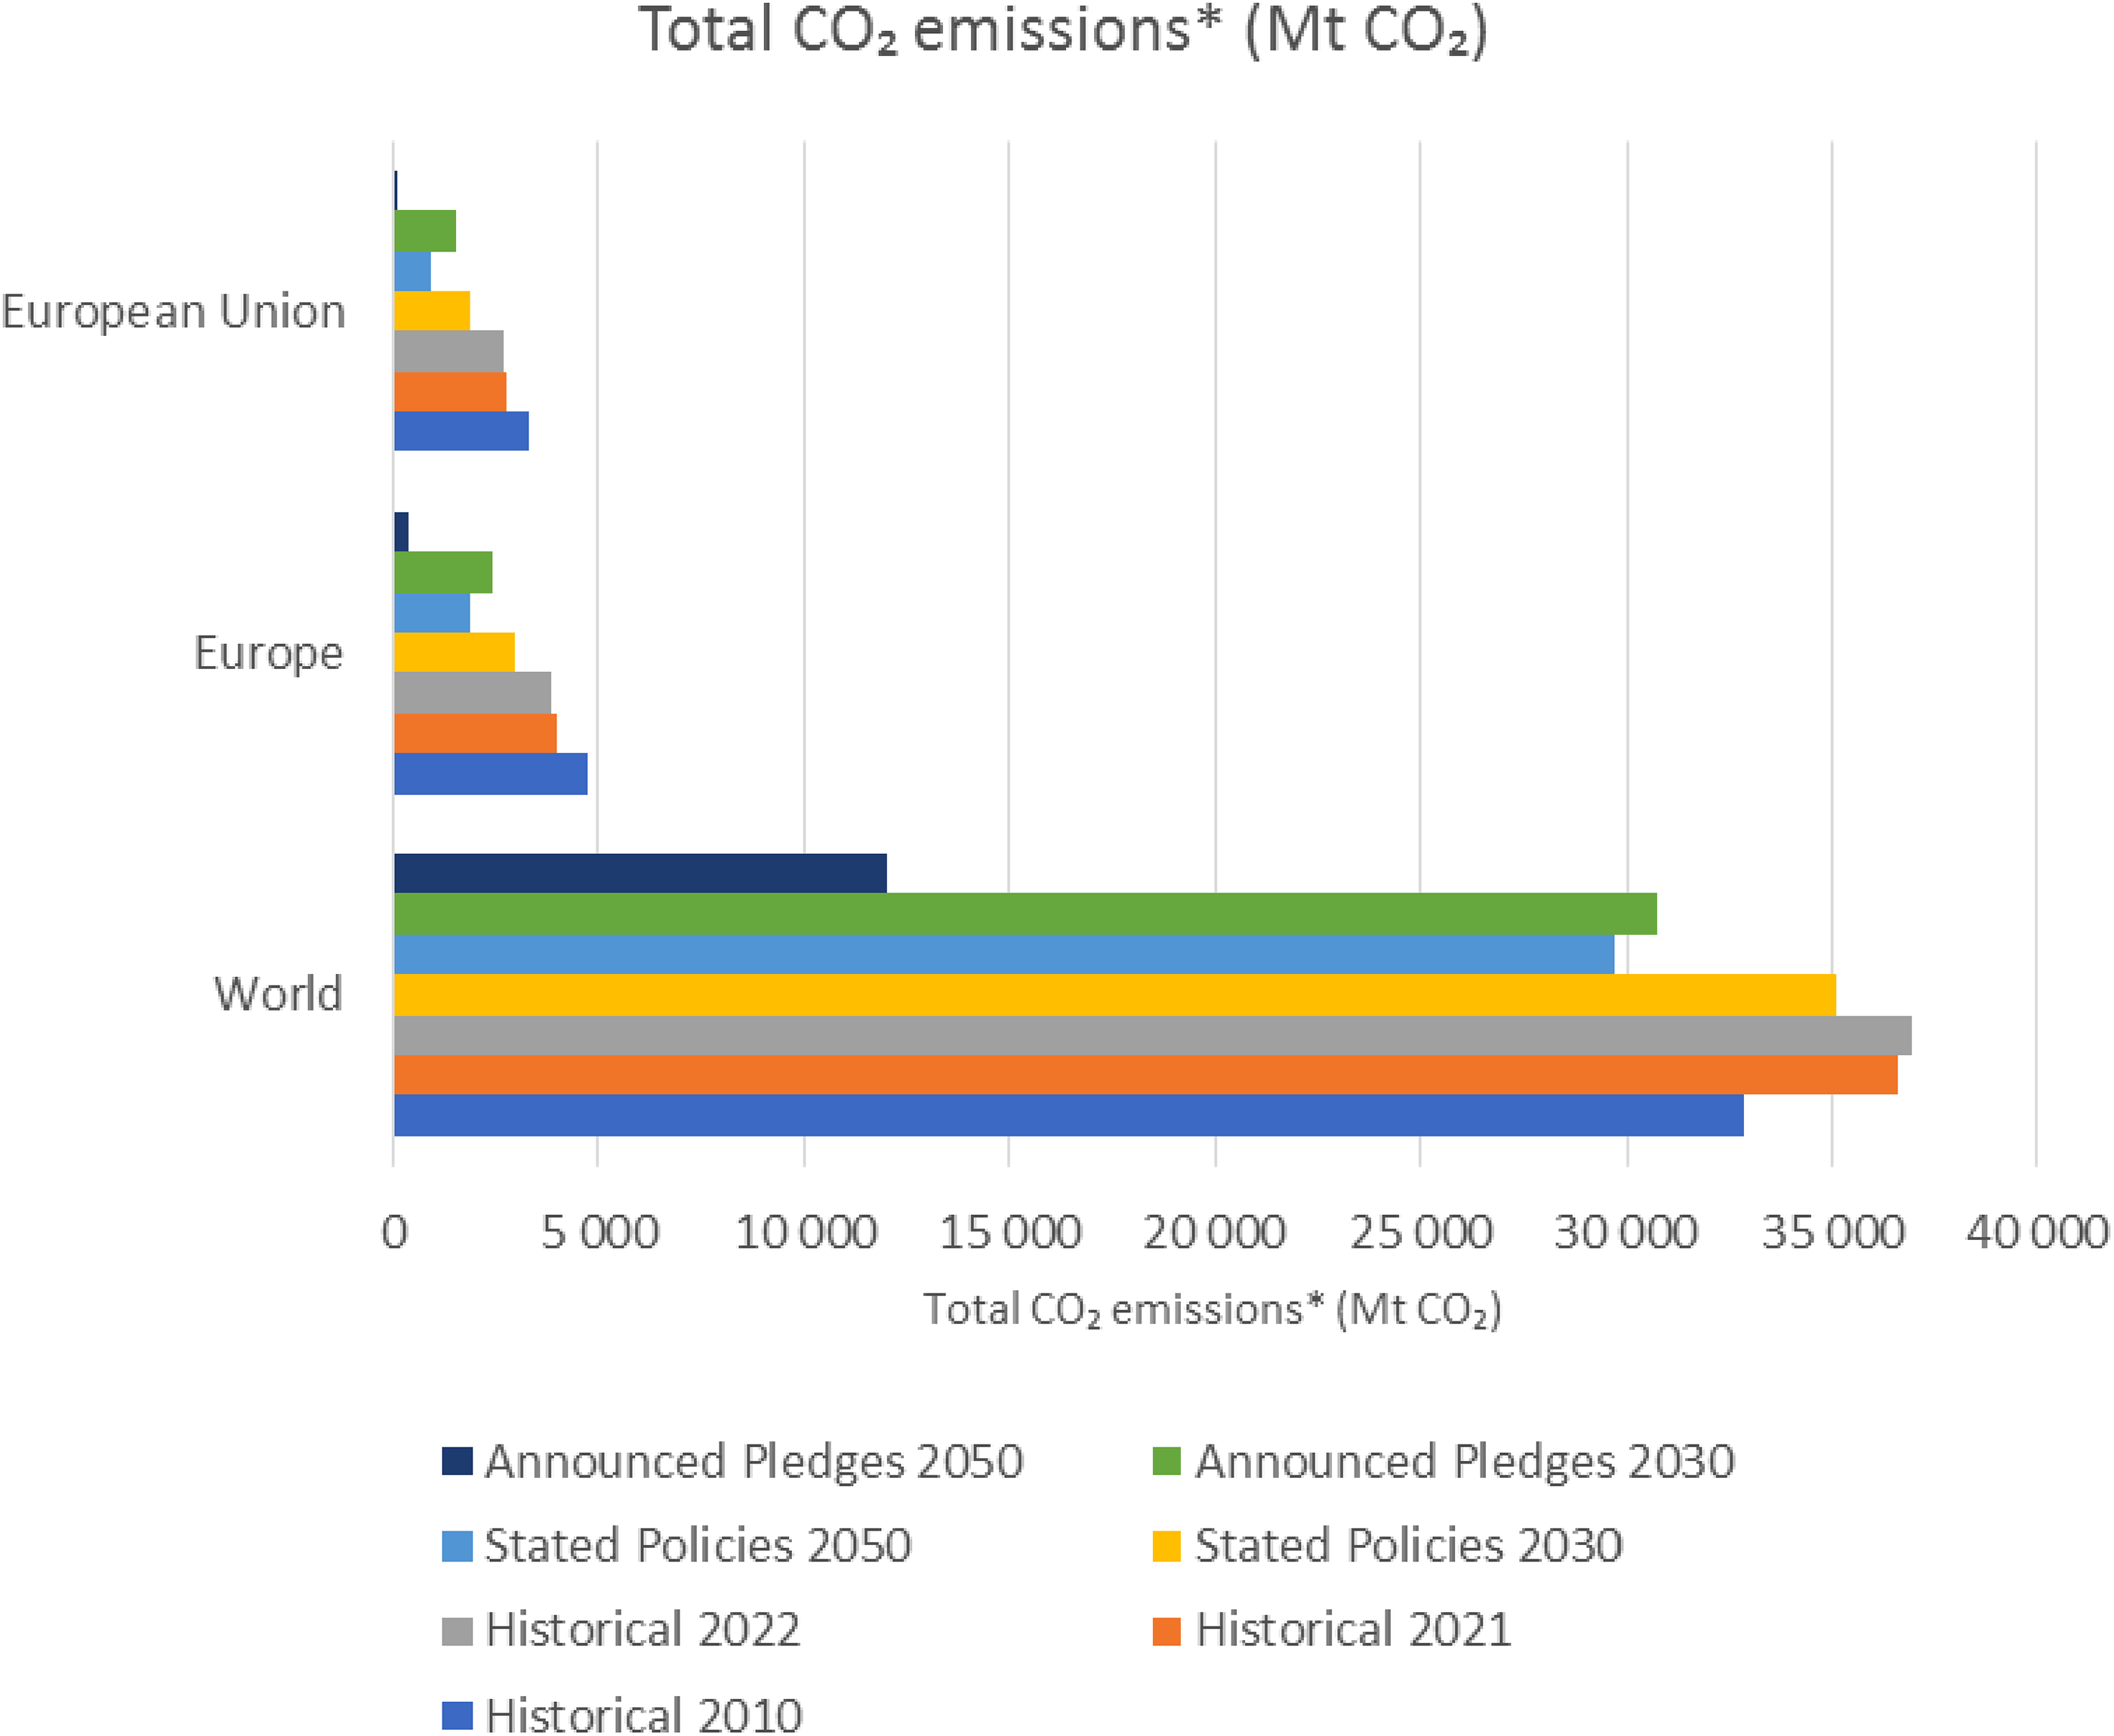
Historical and forecast data of total CO2 emissions (Mt CO2) according to the STEPS and APS for the period up to 2030 and 2050. *Includes emissions from industrial processes and flaring. Source. data obtained by the authors based on IEA databases (IEA, “Energy End-uses and Efficiency Indicators Highlights – November 2023”, 2023; “Global Energy and Climate Model Documentation 2023, IEA, Paris”, 2023;“World Energy Balance Highlights”, 2023; “World Energy Investment 2023”, 2023; “World Energy Investment 2023 Datafile”, 2023; “World Energy Outlook 2023 – October 2023”, 2023).
Figure 13 shows historical and forecast data on CO2 emissions for the electricity and heat sectors (Mt CO2) in the world, Europe and the European Union, according to the STEPS and APS scenarios for the period up to 2030 and 2050. According to the data from Figure 13, we should expect a significant reduction in CO2 emissions for the electricity and heat industries in the world, Europe and the European Union in the foreseeable future. This can be ensured by increasing the volumes of solar green generation of electricity and thermal energy, which will lead to a significant reduction of emissions in these industries.
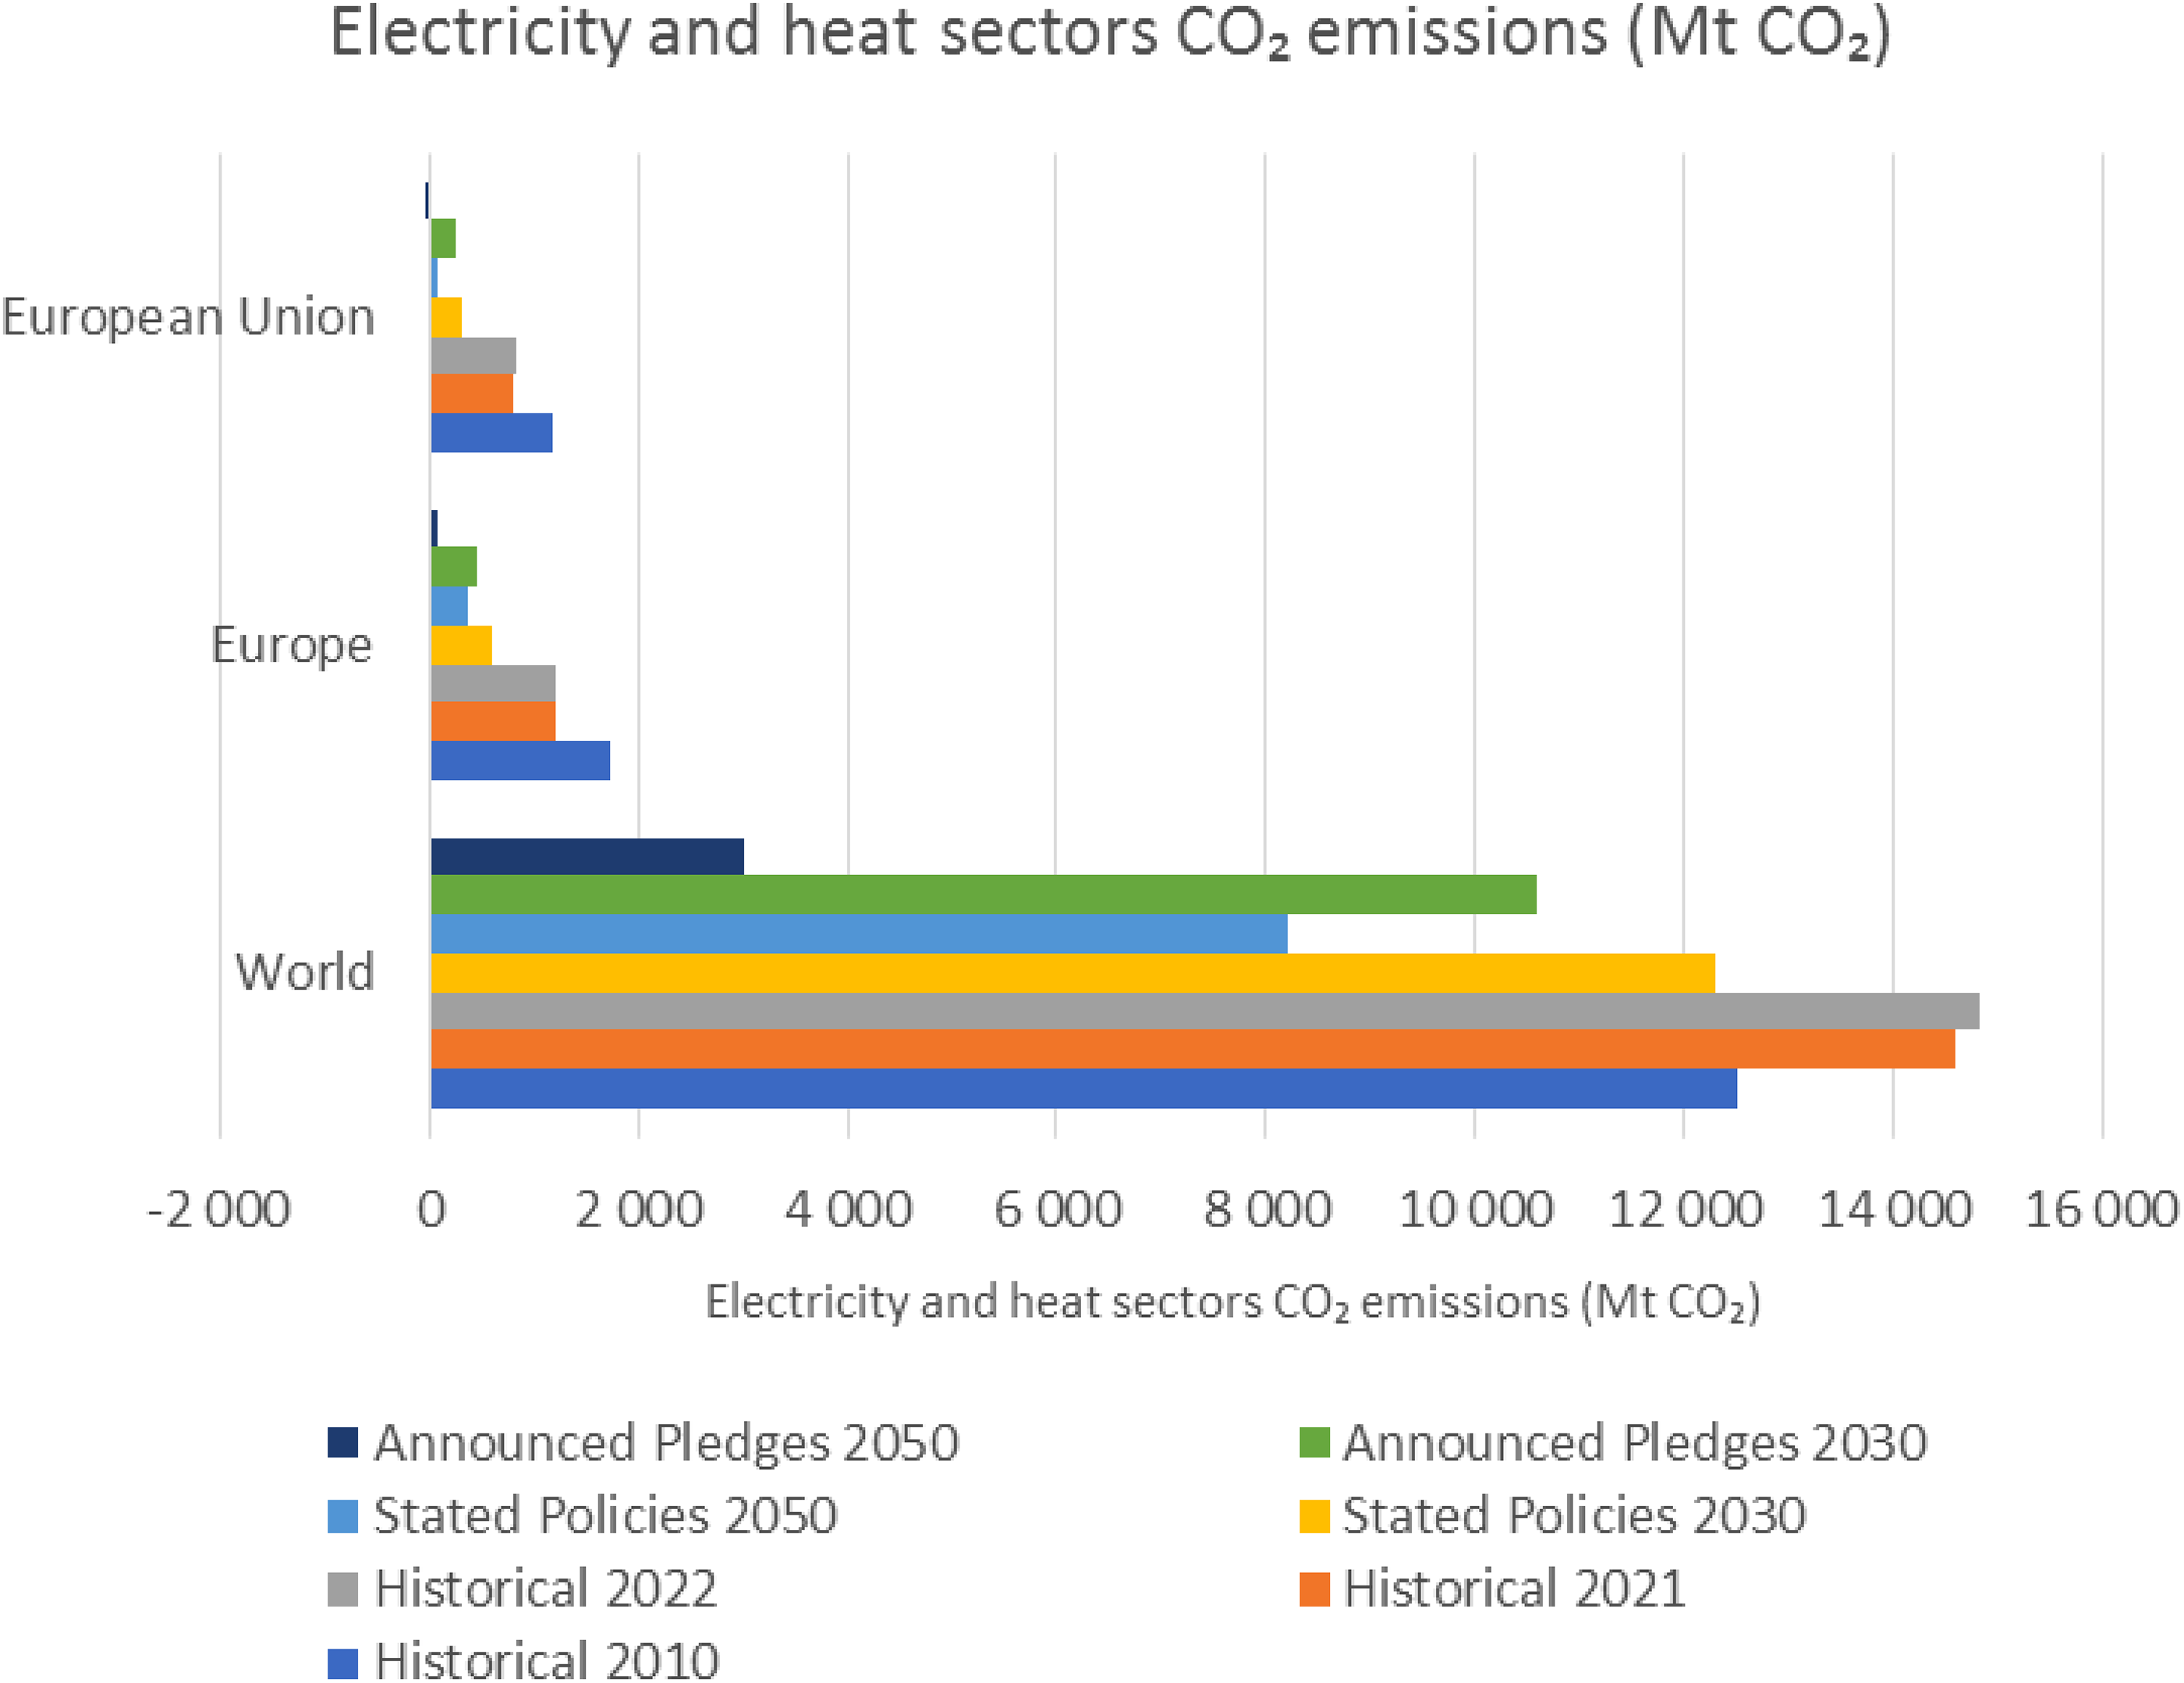
Historical and forecast data of electricity and heat sectors CO2 emissions (Mt CO2) according to the STEPS and APS for the period up to 2030 and 2050. Source. data obtained by the authors based on IEA databases (IEA, “Energy End-uses and Efficiency Indicators Highlights – November 2023”, 2023; “Global Energy and Climate Model Documentation 2023, IEA, Paris”, 2023;“World Energy Balance Highlights”, 2023; “World Energy Investment 2023”, 2023; “World Energy Investment 2023 Datafile”, 2023; “World Energy Outlook 2023 – October 2023”, 2023).
Figure 14 shows historical and forecast data on CO2 emissions (Mt CO2) from final consumption (including emissions from industrial processes and combustion) in the world, Europe and the European Union, according to the STEPS and APS scenarios for the period up to 2030 and 2050.

Historical and forecast data of final consumption CO2 emissions (Mt CO2), according to the STEPS and APS for the period up to 2030 and 2050. *Includes emissions from industrial processes and flaring. Source. data obtained by the authors based on IEA databases (IEA, “Energy End-uses and Efficiency Indicators Highlights – November 2023”, 2023; “Global Energy and Climate Model Documentation 2023, IEA, Paris”, 2023;“World Energy Balance Highlights”, 2023; “World Energy Investment 2023”, 2023; “World Energy Investment 2023 Datafile”, 2023; “World Energy Outlook 2023 – October 2023”, 2023).
According to the forecast data from Figure 14, we should expect a decrease in CO2 emissions from final consumption in the foreseeable future. This can be ensured by increasing the amount of solar green generation of electricity and thermal energy using PV and CSP technologies, which will lead to a significant reduction of CO2 emissions from final consumption in the foreseeable future until 2050.
The study assessed the prospects of solar green generation in the context of modern trends in the development of renewable energy in the world, taking into account the forecast estimates of world energy agencies in the perspective of 2030–2060. It is determined that a decrease in the volume of total energy supply in Europe and the European Union should be expected in the foreseeable future, a significant increase in the volume of energy generation from renewable sources should be expected in the foreseeable future in the world, Europe and the European Union. According to the data presented in the study, a significant increase in the volume of electricity production from renewable sources should be expected in the foreseeable future, which will require the widespread use of ecologically clean and cheap electricity generation technologies. A significant increase in the volume of electricity production from renewable sources will be ensured mainly due to the use of solar PV generation.
It was determined that by 2060 for the European Union, according to the “EU Basic Scenario”, the following will be ensured: increase in energy production with the use of solar photovoltaic technologies to the value of 876 PJ; almost four-fold increase in the amount of energy production using solar energy concentration technologies to the value of 566 PJ. In addition, it is planned to gradually increase the amount of electricity production using solar photoelectric technologies to a value of 243 TWh, and more than a fivefold increase in electricity production using solar energy concentration technologies to a value of 58 TWh will be provided. The specified measures will contribute to the gradual increase of the electric power of installations based on solar photovoltaic technologies to the value of 195 GW and will ensure a more than four-fold increase in the electric power of installations based on solar energy concentration technologies to the value of 17 GW.
The study found that the amount of solar green generation should be approximately 30 to 50% of the total energy generation from renewable sources in the foreseeable future, mainly due to the use of solar PV generation, which will lead to a significant reduction in CO2 emissions.
Global and European aggregated data for three simulated scenarios of energy and climate policy (STEPS, APS, NZE) in terms of the use of solar photovoltaic technologies and technologies of solar energy concentration up to 2030–2050 were evaluated. Based on the analysis of forecast data on total CO2 emissions (including emissions from industrial processes and combustion) in the world, Europe and the European Union, according to the STEPS and APS scenarios for the period up to 2030 and 2050, it was determined that a decrease of volumes of total CO2 emissions should be expected in the foreseeable future. This can be ensured by increasing the amount of solar green electricity generation, which will lead to a significant reduction of emissions.
Based on the analysis of forecast data on CO2 emissions for the electricity and heat industries in the world, Europe and the European Union, according to the STEPS and APS scenarios for the period up to 2030 and 2050, it was determined that a significant reduction in CO2 emissions should be expected for the electricity and heat energy industry in the world, Europe and the European Union in the foreseeable future. This can be ensured by increasing the amount of solar green generation of electricity and thermal energy, which will lead to a significant reduction of emissions in these industries.
Projected data on the amount of total CO2 emissions during the forecast period until 2050, according to the “Announced Pledges Scenario”, will decrease more significantly than the data of the “Stated Policies Scenario” indicate; CO2 emissions in the electricity and heat generation sectors, according to the “Announced Pledges Scenario”, for the period up to 2030, 2040 and 2050, will also decrease more significantly than under the STEPS scenario.
Projected data of total CO2 emissions over the forecast period under the “Net Zero Emissions by 2050” Scenario will decrease more significantly than the “Stated Policies Scenario” and the “Announced Pledges Scenario”; CO2 emissions in the electricity and heat generation sectors, according to the “Net Zero Emissions by 2050” Scenario, for the period up to 2030, 2040 and 2050, will also decrease more significantly than under the STEPS and APS scenarios.
Based on the analysis of forecast data, a decrease in CO2 emissions from final consumption should be expected in the foreseeable future. This can be ensured by increasing the amount of solar green generation of electricity and thermal energy with using PV and CSP technologies, which will lead to a significant reduction of CO2 emissions from final consumption in the foreseeable future until 2050.
Taking into account the results obtained in the study, increasing the amount of solar green generation for Ukraine, in the context of modern trends in the development of renewable energy in the world, should be considered as a means of overcoming the energy crisis in the country and increasing the environmental and energy security of the generating capacities of the Ukrainian energy industry. An accurate assessment will become possible after the cessation of hostilities in Ukraine, given the current uncertainty of information in the country's energy sector.
Footnotes
Declaration of Conflicting Interests
The author declared no potential conflicts of interest with respect to the research, authorship, and/or publication of this article.
Funding
The author received no financial support for the research, authorship, and/or publication of this article.
Author Biography