
Abstract
South Africa's energy system faces severe challenges, including persistent load-shedding since 2007, costing businesses USD 0.73 billion in 2015, and heavy coal reliance (72.7% of the energy mix), making it a top global carbon emitter. Population growth (73.9% since 1990) has driven a 52.8% rise in energy demand, exacerbating grid instability. The Integrated Resource Plan (IRP) 2019 targets 30.7 GW of renewable energy by 2030 to mitigate load-shedding, reduce emissions, and enhance energy security, yet intermittency and infrastructure constraints pose significant hurdles. This study employs system dynamics (SD) modelling to evaluate renewable energy integration, addressing a gap in holistic analyses of South Africa's energy transition. By simulating feedback loops, the model quantifies the impacts of 30%, 50%, and 70% renewable penetration by 2035 on emissions, load-shedding, and system costs. Results show a 50% renewable share could reduce emissions by 50% and load-shedding by 40%, while a 70% share achieves 65% and 55% reductions, respectively, though costs rise by up to 25%. Policy pathways, informed by global best practices, emphasise storage subsidies, demand-response measures, and phased coal retirements to enhance South Africa's energy transition. Community-led initiatives, like Enkanini's solar projects, enhance adoption. Limitations include incomplete rural demand data, necessitating improved data collection via satellite imagery and surveys. Policymakers should prioritise targeted subsidies and regulatory coherence to balance costs and reliability, offering a scalable model for Sub-Saharan Africa's coal-heavy systems, with future research focusing on refining rural energy projections.
Keywords
Introduction
Problem statement
South Africa's energy system is under strain. Load-shedding, ongoing since 2007, has imposed significant economic costs, estimated at USD 0.73 billion (R13.1 billion) for businesses in the first half of 2015 alone (Goldberg, 2015), while coal, constituting 72.7% of the energy mix, contributes to the country's status as a top ten global carbon emitter (Cheruiyot et al., 2024). Population growth of 73.9% since 1990 has driven a 52.8% rise in energy consumption, intensifying demand pressures (Statistics South Africa, 2023). The Integrated Resource Plan (IRP) 2019 proposes integrating 30.7 GW of renewable energy by 2030 to address these issues, yet intermittency and infrastructure constraints pose challenges (Department of Mineral Resource and Energy, 2019). Current challenges include load-shedding, where supply is curtailed to prevent total system collapse, high emissions, and demand pressures (Pierce and Le Roux, 2022).
This study employs system dynamics (SD) modelling to assess renewable energy integration, filling a gap in dynamic, holistic analyses. SD examines feedback loops linking renewable adoption to energy security, emissions reduction, and socio-economic outcomes, incorporating economic factors like coal's low cost. The contribution of this study is threefold: (1) to quantify the projected impacts of varying renewable penetration levels on emissions, load-shedding, and system costs; (2) to contextualise South Africa's transition with global and regional case studies, highlighting alignment and divergence from other Sub-Saharan African nations; and (3) to provide actionable policy pathways based on feedback-driven energy modelling.
Global case studies (e.g., China, Finland) inform policy pathways, emphasising storage subsidies, demand-response measures, and phased coal retirements. Community-led initiatives, like Enkanini's solar projects, enhance adoption. Recent systematic reviews underscore this need: a 2025 study on South Africa's energy landscape highlights coal's 77% share and renewables’ modest 12%, while calling for Fourth Industrial Revolution technologies such as smart grids and decentralised systems to enable the IRP's targets (Ukoba et al., 2025). Similarly, a 2024 review of Liberia's energy scenario shows how heavy reliance on biomass (over 80% of consumption) and limited grid infrastructure constrain progress, yet decentralised solar and hydro solutions provide viable models for expanding access (Yusuf et al., 2024). These insights reinforce the value of comparative learning in shaping South Africa's policy design.
By integrating global perspectives, scenario analyses, and sensitivity testing, we identify strategic pathways for policy and technology deployment (Sterman, 2014). Where subsidies are discussed in later sections, these refer specifically to proposed mechanisms within the IRP 2019 and international best practices, not existing South African subsidies unless explicitly stated. This paper outlines South Africa's energy context, details the renewable expansion plan with cost and tariff parameters, describes the SD methodology, reviews global SD applications, and discusses implications via scenario-based projections visualised.
South Africa's energy framework evolved significantly with the establishment of Eskom in 1923, facilitating grid expansion and coal-based electrification (South African History Online, 2024). Coal reserves in Mpumalanga underpinned industrial growth, with capacity rising from 1500 MW in 1950 to 40,000 MW by 1990 (Eskom Data Portal, 2023).
Pre-1994 policies entrenched racial disparities in electricity access, which played a role in underestimating demand (South African History Online, 2024). Post-1994 electrification efforts increased rural access from 23.8% in 1996 to 40.4% by 1997, yet coal dominance persisted, shaping current challenges (South African History Online, 2024). Historical context highlights Eskom's coal-based expansion since 1923 and post-1994 electrification efforts, increasing rural access but entrenching coal dominance (Eskom Data Portal, 2023; South African History Online, 2024). Current challenges include load-shedding, where supply is curtailed to prevent total system collapse, high emissions, and demand pressures (Pierce and Le Roux, 2022).
In 2022, South Africa's installed capacity stood at 54 GW, with coal at 72.7%, renewables at 17.4%, nuclear at 3.4%, and gas/diesel at 6.4% (Pierce and Le Roux, 2022). The IRP 2019 targets a shift by 2030, integrating 30.7 GW of renewables (39% of the mix), reducing coal to 43%, and increasing gas/diesel to 15%, with nuclear stable at 3% (Department of Mineral Resource and Energy, 2019). Figure 1 shows the planned 2030 energy mix.
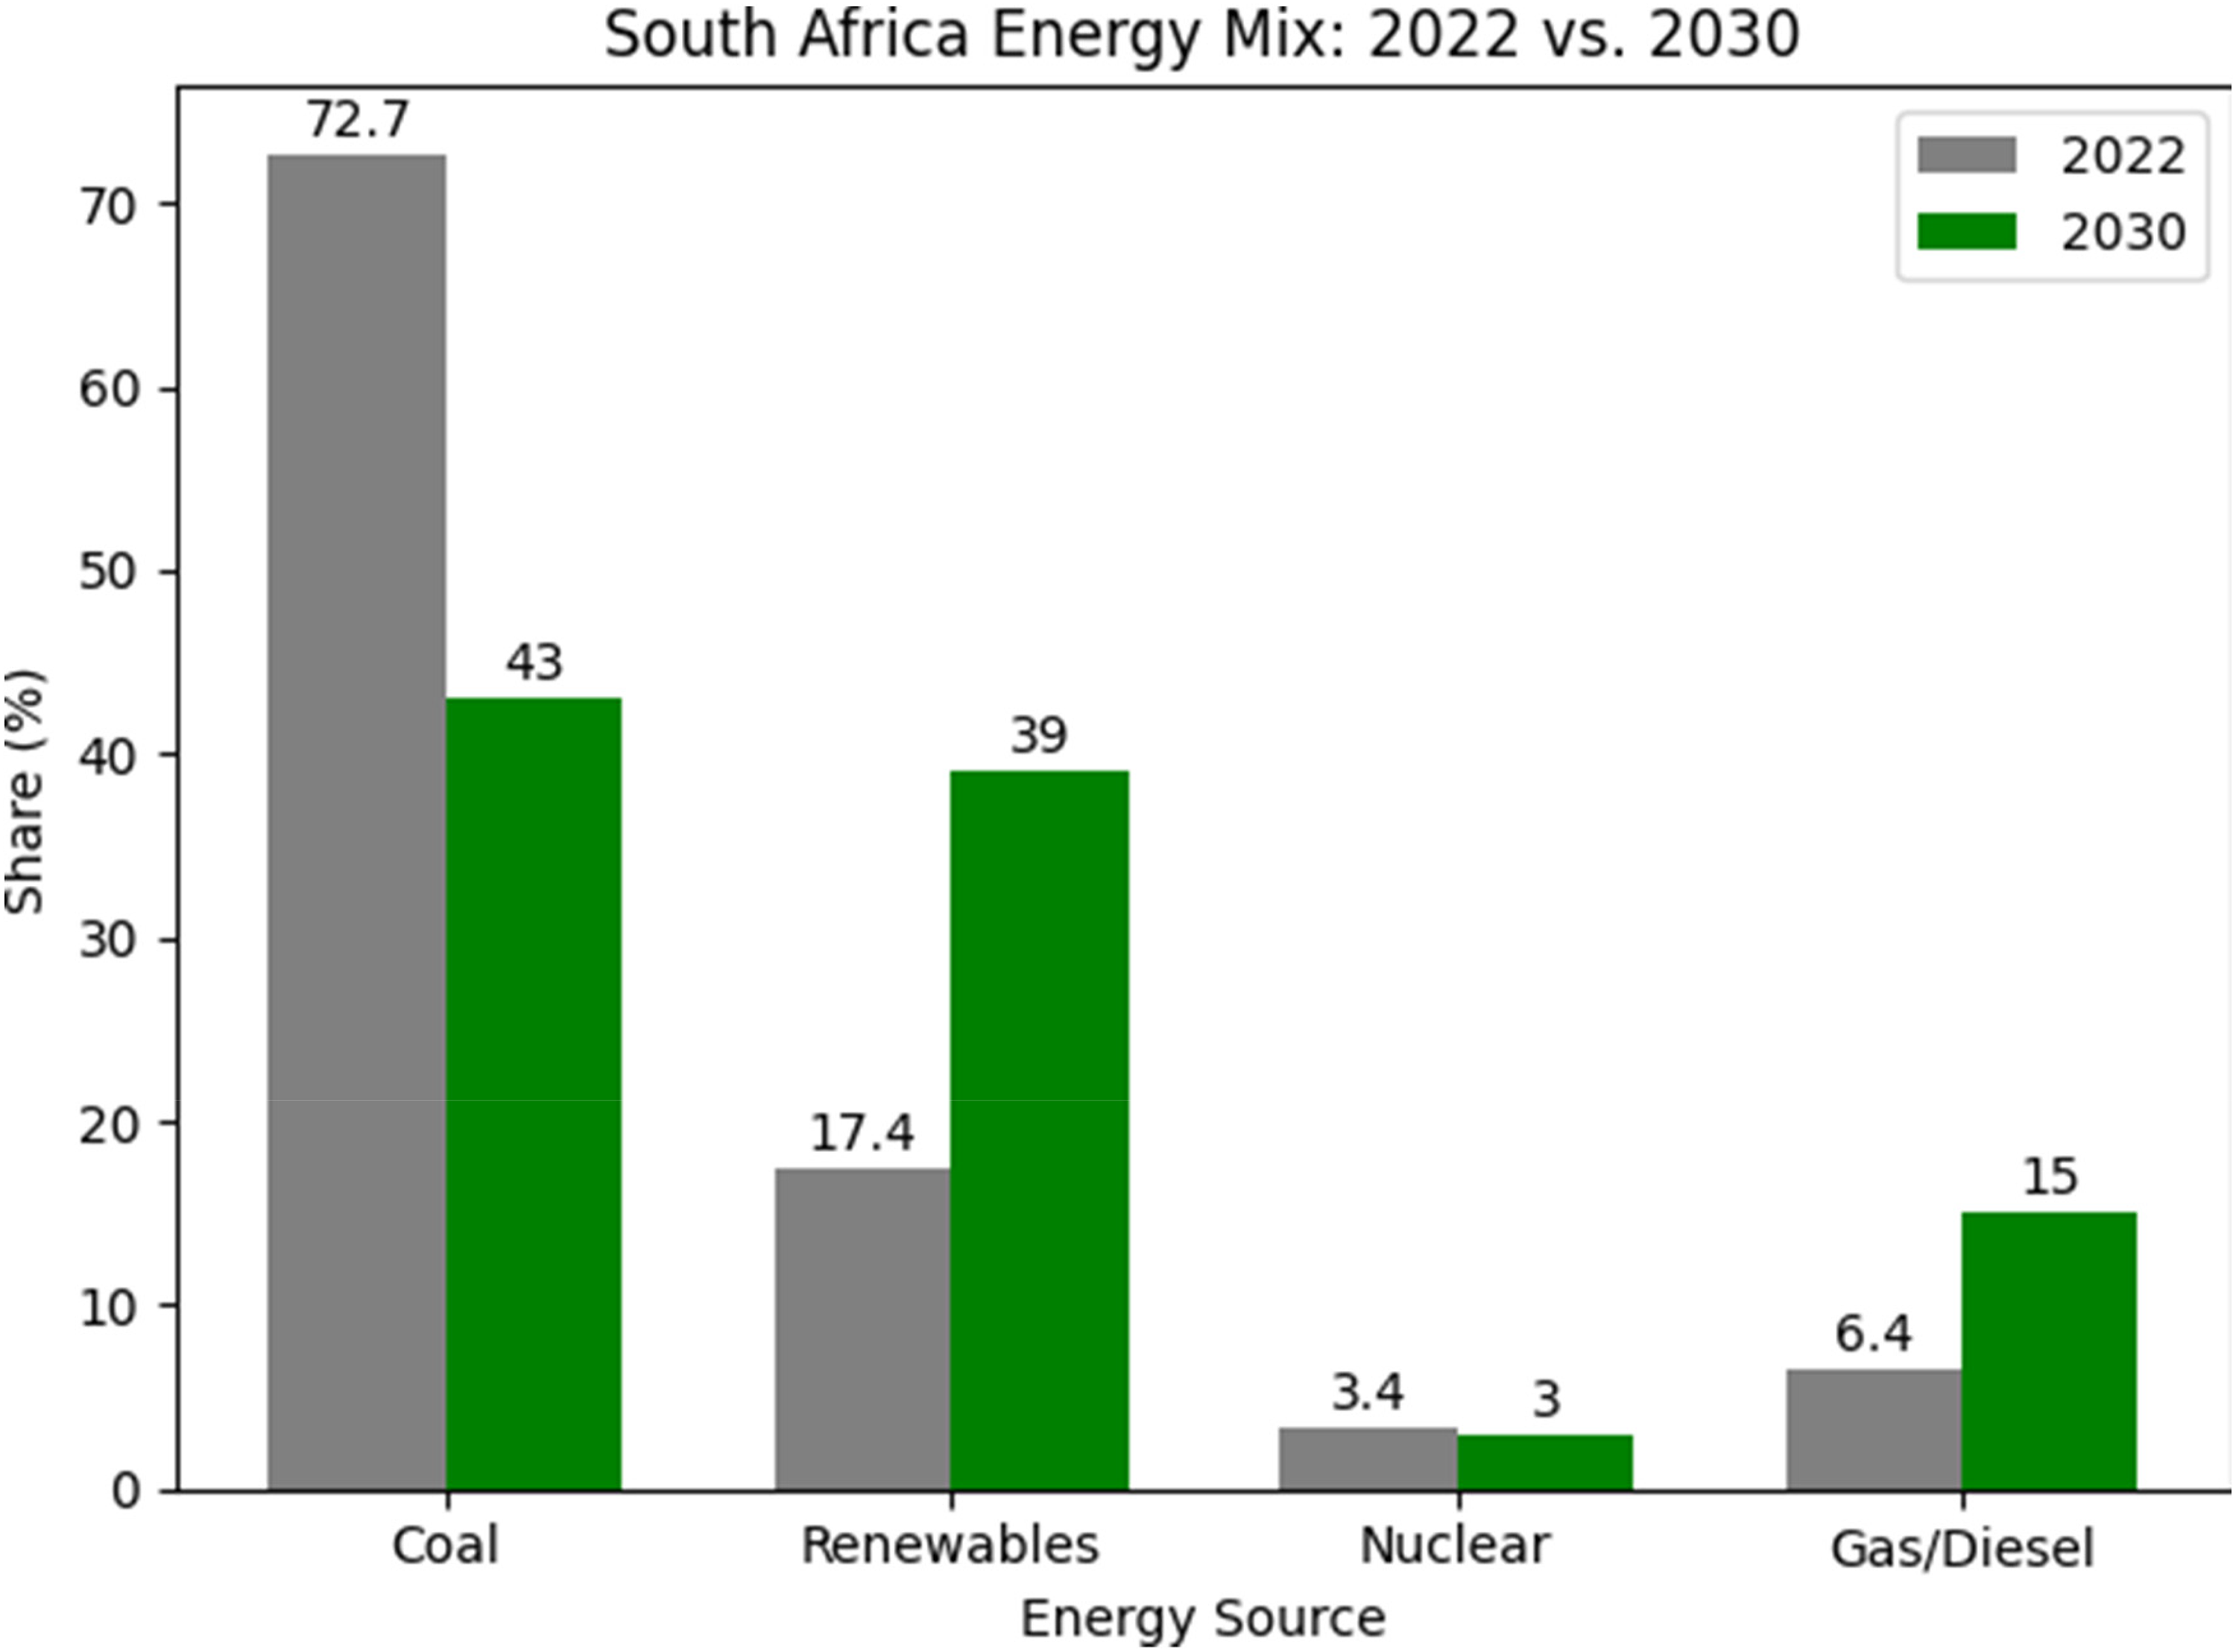
SA 2022 and 2030 energy mix comparison, derived from (Department of Mineral Resource and Energy, 2019; Pierce and Le Roux, 2022).
According to (Department of Mineral Resource and Energy, 2019), the 2030 energy strategy aims to balance economic growth, emissions reduction, and energy availability. The South African Reserve Bank data showed that load-shedding reduced GDP by 0.06% per reduction stage as a result of outages linked to coal power plant failures (SARB, 2023). In 2021, the Centre for Research on Energy and Clean Air reported that Eskom's sulphur dioxide emissions exceed those of major economies, highlighting the need for renewables and carbon capture technology (CCT) (Myllyvirta, 2021). These challenges – economic impacts of load-shedding and coal emissions – reinforce the necessity for clean energy solutions(Myllyvirta, 2021; SARB, 2023). System dynamics (SD) modelling captures these dynamics, including coal's economic drivers, and informs trade-offs (Brent and Du Plooy, 2017; Lund, 2008).
The IRP 2019 outlines a phased decommissioning of 22 GW of coal-fired capacity by 2035 – nearly half of the current 45 GW coal fleet – to be replaced primarily by renewable sources such as wind (11.44 GW), solar (8.45 GW, including PV and CSP) and gas/diesel capacity (Department of Mineral Resource and Energy, 2019). SD modelling helps illuminate this transition by identifying key feedback mechanisms. For example, a reinforcing loop is created where increased renewable capacity reduces load-shedding – by offsetting coal outages – and lowers greenhouse gas (GHG) emissions, thereby improving energy security and environmental outcomes (Brent and Du Plooy, 2017; Myllyvirta, 2021; SARB, 2023). At the same time, balancing loops limits these benefits. Renewable intermittency (e.g., solar downtime at night) and the high costs of grid upgrades or storage – estimated at 15% above baseline in some scenarios (Brent and Du Plooy, 2017; Lund, 2008) – can constrain rapid deployment. These opposing dynamics inform strategic trade-offs, such as prioritising storage to address intermittency or sequencing coal retirements to match the pace of renewable rollout, ensuring a stable and cost-effective shift to a low-carbon energy system.
Renewable sources in the energy expansion plan
The IRP 2019 prioritises wind, solar, biomass, and hydroelectricity to achieve 30.7 GW by 2030, diversifying South Africa's coal-heavy grid (Department of Mineral Resource and Energy, 2019). This section evaluates their dynamics SD insights, incorporating levelized cost of energy (LCOE), storage costs, grid upgrades, and feed-in tariffs to provide actionable guidance. Alternatives like dynamic load management and global learning curves are considered, with subsidies justified via GHG reductions. Global best practices inform South Africa's transition, with a comparative summary in Table 1.
Summary of renewable energy sources.

Solar energy
The IRP 2019 projects 7.85 GW of photovoltaic (PV) and 0.6 GW of concentrated solar power (CSP) by 2030, leveraging South Africa's 220 W/m² solar radiation, which exceeds the US (150 W/m²) and Europe (100 W/m²) (Department of Mineral Resource and Energy, 2019; DMRE, 2022, 2024). Rooftop PV, as demonstrated in local initiatives, reduces reliance on centralised coal plants (Akinbami et al., 2021). However, intermittency necessitates battery storage, costing USD 1111/kWh, with grid-scale systems increasing costs by 15% (USD 5.56 billion) by 2030 (Lund, 2008).
The LCOE for PV, at USD 0.027/kWh, competes with coal's USD 0.037/kWh, though storage raises it to USD 0.044/kWh (DMRE, 2022, 2024). Feed-in tariffs of USD 0.050/kWh encourage adoption but strain Eskom's finances, requiring cost recovery mechanisms (DMRE, 2024). IRENA's 30% storage cost drop since 2020 suggests subsidies, like those in China, could enhance grid stability (IRENA, 2024; Yang et al., 2021). Additionally, dynamic load management, shifting 5–10% of industrial demand, saves USD 0.56 billion annually, as seen in Australia's programs and SD modelling indicates that storage or load management could reduce carbon emissions by 20%, paving the way for solar's complementary role (AEMO, 2023a; Madafiglio et al., 2017; Yang et al., 2021).
Wind power potential in South Africa
Targeting 11.44 GW of wind capacity by 2030, up from 1.36 GW, the IRP 2019 leverages a 2500-km coastline with 6 m/s average speeds and 60 TWh potential, peaking at 11 m/s in southern regions (Department of Mineral Resource and Energy, 2019; Elsner, 2019; Merem et al., 2022). Due to variability, grid upgrades are necessary, and this is projected to cost USD 2.78 billion (CSIR, 2016).
Onshore wind energy, with a LCOE of USD 0.034/kWh, is now cost-competitive with coal, while offshore wind remains more expen sive at USD 0.067/kWh (CSIR, 2016). According to the International Energy Agency, every doubling of installed capacity could reduce wind energy's LCOE by about 15%, potentially bringing onshore wind costs down to USD 0.028/kWh by 2035 (CSIR, 2016; IEA, 2020, 2023). Feed-in tariffs, currently set at USD 0.041/kWh, continue to encourage renewable energy deployment, though they require mechanisms for cost recovery (Elsner, 2019). Finland provides a useful example of integrating renewables effectively – its grid incorporates energy buffers that enhance system stability by 15% (Aslani et al., 2014; IEA, 2023).
Biomass-fired power plants
The IRP 2019 allocates 499 MW to biomass, tapping 42 million hectares of woodland and 18 million tons of sugarcane residues, with a 2000 MW potential (Akinbami et al., 2021; Department of Mineral Resource and Energy, 2019; IIED, 2013). Limited subsidies (USD 0.0056/kWh) hinder growth, risking underinvestment in a reliable baseload source (IIED, 2013).
Biomass energy, with a high capacity factor of around 80% compared to solar's 30%, provides a more stable and reliable source of electricity, especially important for grid stability and base-load supply. In addition to its energy contribution, the biomass sector – particularly through sugarcane processing – created approximately 10,000 jobs, significantly supporting rural economic development (IIED, 2013). From an environmental standpoint, sustainably produced biomass can reduce GHG emissions by around 30%, lowering the emission intensity from coal's 900 gCO₂/kWh to approximately 630 gCO₂/kWh. This potential is well-demonstrated by Brazil's sugarcane-based bioenergy model, which balances energy production with climate goals (IIED, 2013; Nogueira et al., 2024).
System Dynamics (SD) simulations suggest that implementing similar capacity buffers in South Africa could help manage renewable energy variability, especially in supporting biomass as a reliable baseload source (IEA, 2023).
Hydroelectric energy
Expanding from 5 GW to 7.5 GW by 2030, hydroelectricity leverages its reliability under IRP 2019 (Department of Mineral Resource and Energy, 2019; Klunne, 2013). High upfront costs (USD 2222/kW) limit growth as the LCOE (USD 0.044/kWh) exceeds wind's but ensures stability (Gyamfi et al., 2018). Despite proven reliability, investment trails wind and solar due to substantial upfront costs that limit its baseload potential (Gyamfi et al., 2018). Small-scale hydropower, recognised for its ability to reduce renewable energy intermittency by approximately 12%, is strongly advocated by the International Hydropower Association as a vital component of a balanced energy mix (Gyamfi et al., 2018; IHA, 2024).
In South Africa, small-scale hydro is a viable option for off-grid electrification, especially in rural or underserved areas where grid extension is expensive or infeasible. With its consistent and localised power generation capability, it is a strategic addition to the country's diversified renewable energy portfolio (Klunne, 2013). System Dynamics (SD) modelling also reinforces the role of small hydro in grid balancing with more variable sources such as wind and solar, thus helping to ensure reliability while contributing to South Africa's renewable energy ambitions (CSIR, 2016). SD can assess its stabilising role compared to variable renewable, increasing energy security similar to that in hydro-rich regions. The analysis demonstrates that Solar, Wind, Biomass, and Hydro have a positive impact on reducing coal dependency, while the cost and tariff strategies provide an optimal integration solution. Table 1 summarises their capabilities, issues, and SD insights.
Review of global SD applications
System dynamics (SD) modelling has been an important tool in informing energy transitions globally, with valuable lessons to be learnt in South Africa. CLD models are seen as a valuable tool for understanding energy transitions, and can capture the complex interactions that arise in energy systems. Studies from Malaysia, Finland, Ecuador, China and South Africa have demonstrated how SD modelling can underpin decision-making through highlighting feedback loops that are important for informing energy policy and investment (Aslani et al., 2014; Nair et al., 2021; Rensburg Johannes Gerhard Janse, 2018; Robalino-López et al., 2014; Yang et al., 2021).
Figure 2, titled Renewable Energy Transition Feedback Model, shows a combined CLD that demonstrates how renewable energy generation contributes to robust grid stability (R1) and how policy-driven investment accelerates the transition (R2). These feedback loops illustrate the reinforcing impact of renewable adoption.
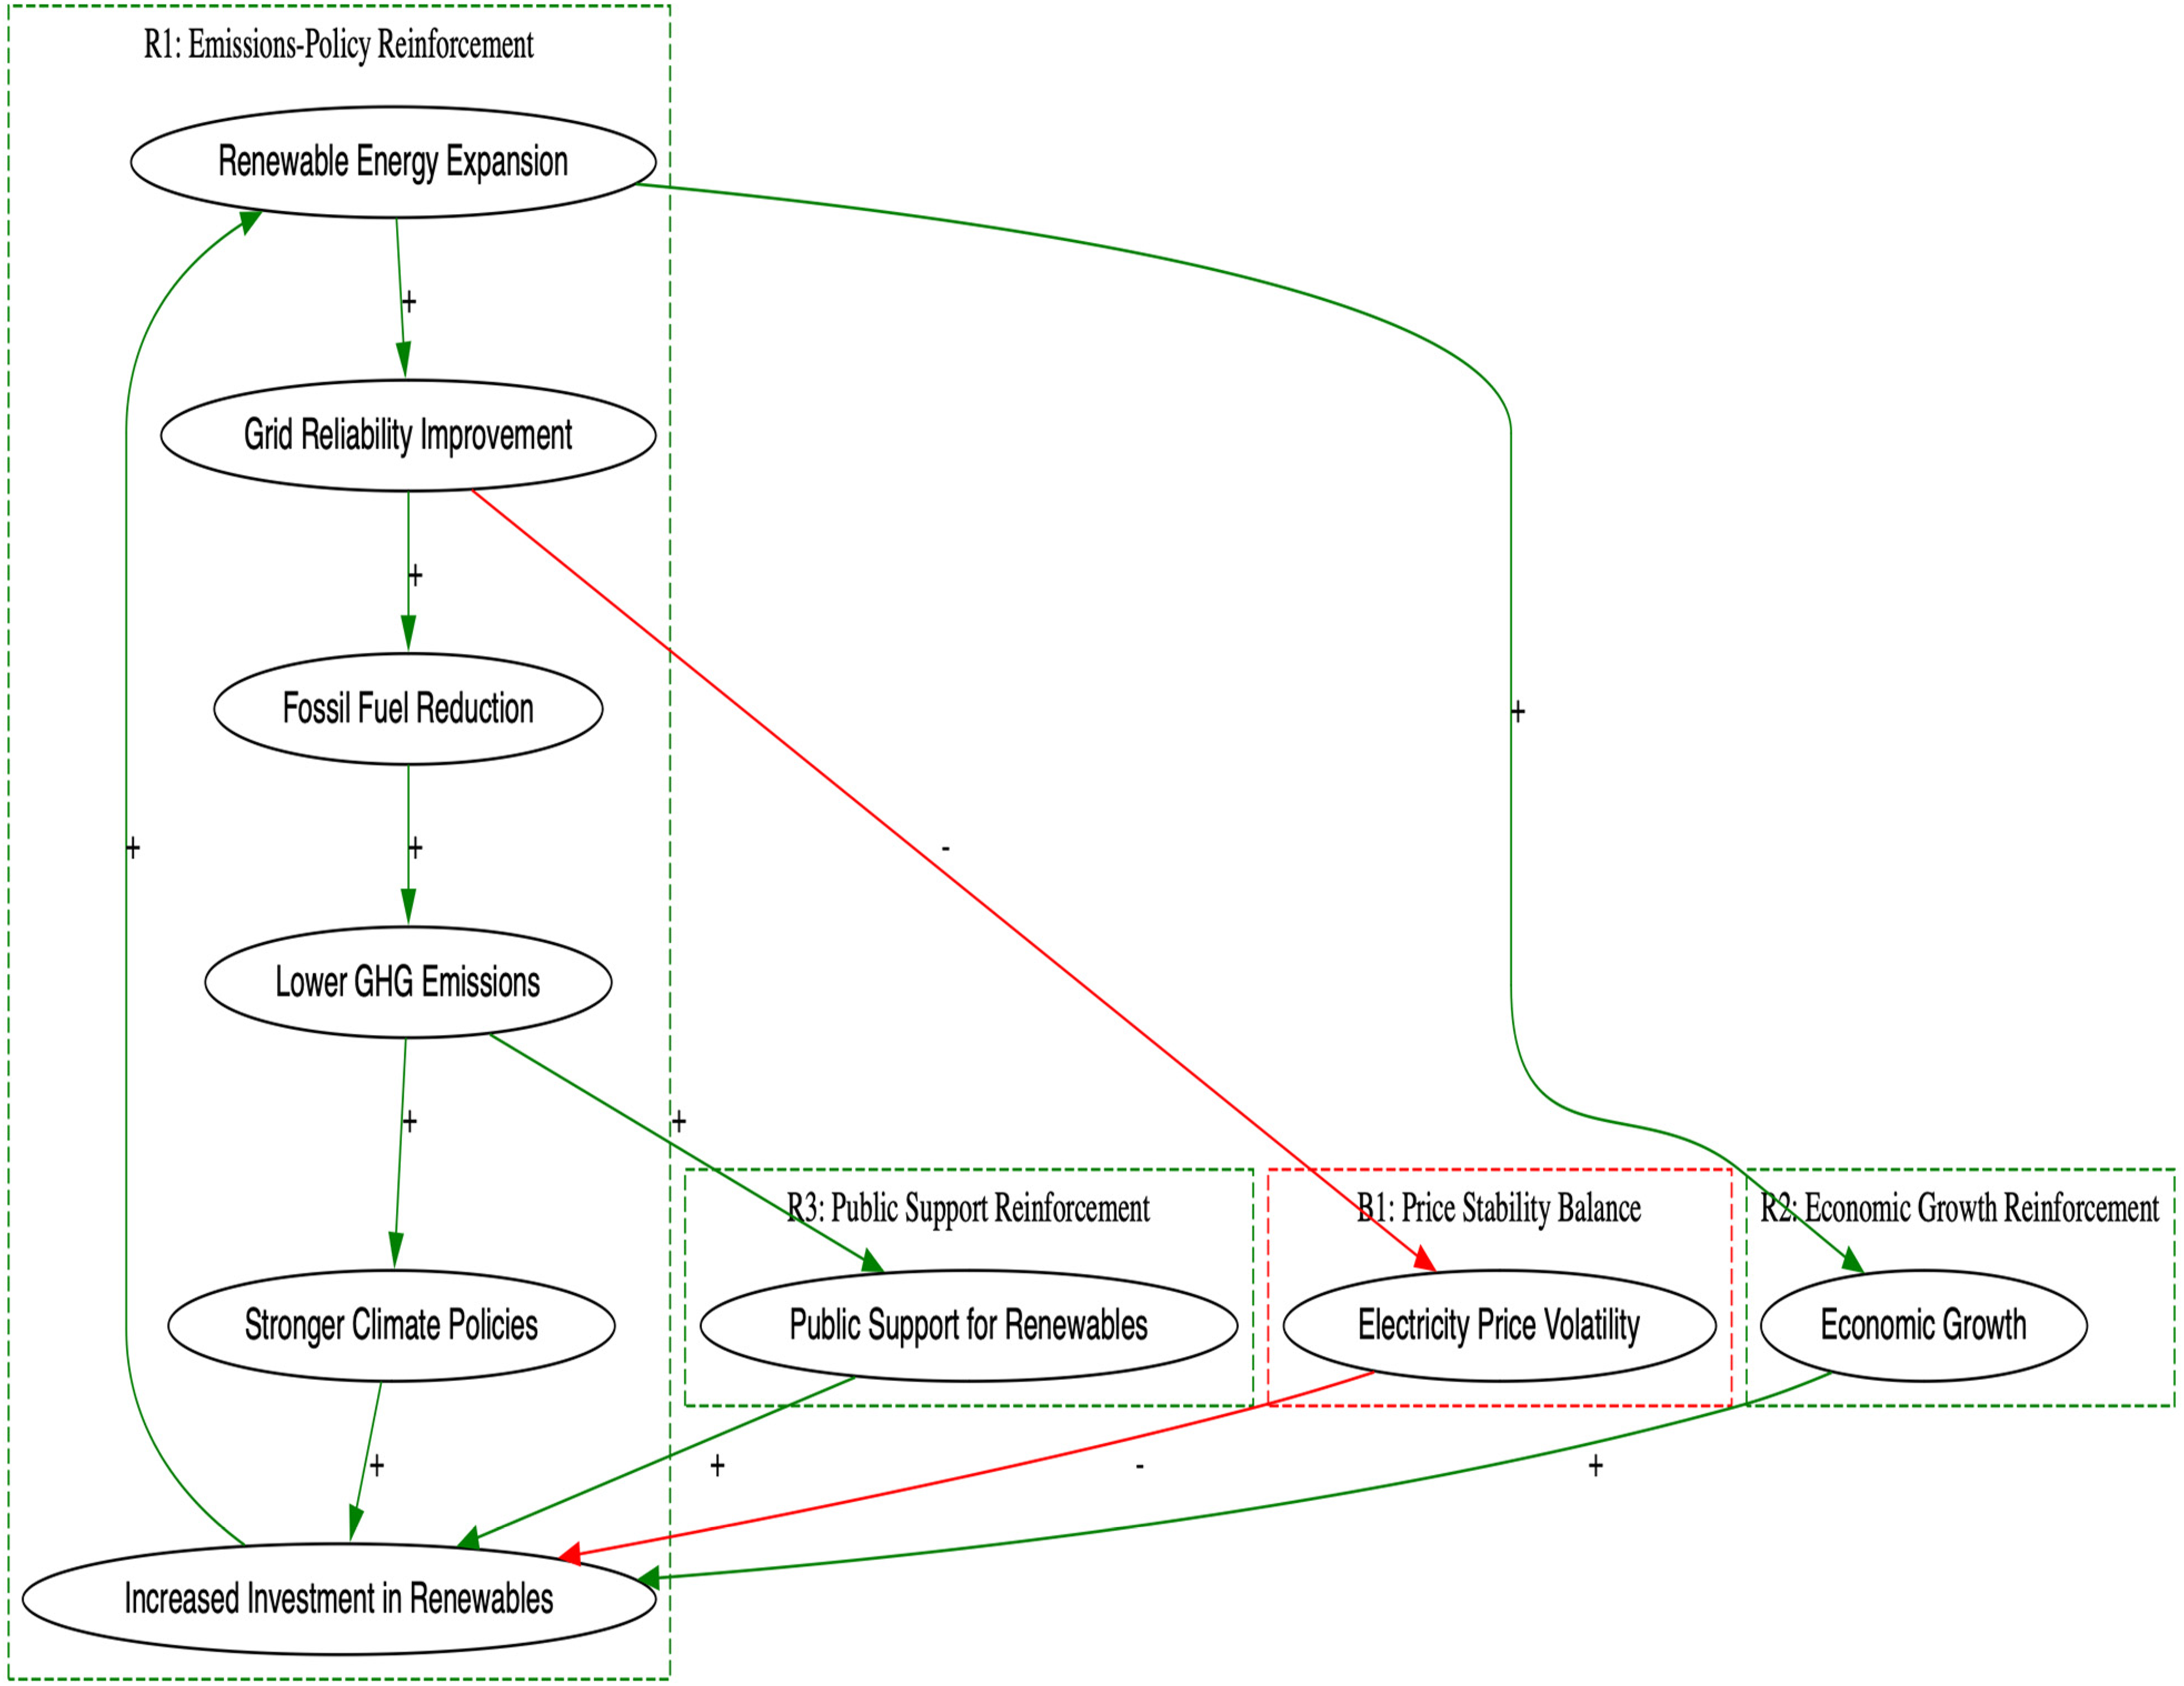
Global renewable energy transition dynamics CLD derived from (Aslani et al., 2014; Nair et al., 2021; Rensburg Johannes Gerhard Janse, 2018; Robalino-López et al., 2014; Smit et al., 2019; Yang et al., 2021).
Malaysia's system dynamics (SD) approach, supported by the ‘Energy Security and Renewable Adoption’ CLD (Nair et al., 2021), demonstrated how diversifying the energy mix with renewables reduced fossil fuel imports and enhanced resilience – offering lessons for South Africa's coal-heavy system. On the other hand, Finland's transition, guided by the ‘Policy Incentives and Gas Dependency’ CLD, shows how sustained policy support and carbon taxes effectively curbed gas reliance, aligning with South Africa's IRP 2030 decarbonization goals (Aslani et al., 2014). Similarly, Ecuador's ‘Economic Growth and Emissions’ CLD (Robalino-López et al., 2014) illustrated how renewable investment supported economic growth without raising emissions, while China's ‘CO2 Emissions Decoupling’ CLD (Yang et al., 2021) highlighted how industrial efficiency and renewables can decouple GDP from carbon output. Locally, Enkanini's ‘Community Solar Dynamics CLD’ derived from (Smit et al., 2019) and Hessequa's ‘Decentralised Supply Mix CLD’ derived from (Rensburg Johannes Gerhard Janse, 2018) highlight decentralised solutions. These cases highlight SD's capacity to align policy, technology, and socio-economic factors.
This diagram represents global renewable energy transitions, where reinforcing loops (R1: emissions policy, R2: economic growth, R3: public support) drive renewable energy expansion, while a balancing loop (B1: price stability) regulates investment.
Knowledge gap
Despite global momentum in renewable integration, there is a clear knowledge gap in how system-level feedbacks, unique socio-economic conditions, and infrastructure constraints shape South Africa's renewable transition, particularly when compared with other Sub-Saharan African countries (Francis et al., 2022; Tomala et al., 2021). Few studies have applied System Dynamics (SD) to this context, leaving uncertainty in predicting policy and investment outcomes. Global research shows that SD modelling has been successfully applied to renewable energy transitions in diverse contexts such as China (Yang et al., 2021), Finland (Aslani et al., 2014), Malaysia (Nair et al., 2021), and Ecuador (Robalino-López et al., 2014). However, comparatively little attention has been paid to South Africa, despite its coal-heavy system and socio-economic complexity.
Study objectives and contributions
This study employs system dynamics (SD) modelling to assess renewable energy integration, filling a gap in dynamic, holistic analyses. SD examines feedback loops linking renewable adoption to energy security, emissions reduction, and socio-economic outcomes, incorporating economic factors like coal's low cost.
The contributions of this study are threefold:
To quantify the projected impacts of varying renewable penetration levels on emissions, load-shedding, and system costs. To contextualise South Africa's transition with global and regional case studies, highlighting alignment and divergence from other Sub-Saharan African nations. To provide actionable policy pathways based on feedback-driven energy modelling.
Global case studies (e.g., China, Finland) inform policy pathways, emphasising storage subsidies, demand-response measures, and phased coal retirements. Community-led initiatives, like Enkanini's solar projects, enhance adoption. By integrating global perspectives, scenario analyses, and sensitivity testing, this research identifies strategic pathways for policy and technology deployment (Sterman, 2014).
Methodology
This study employs system dynamics (SD) modelling to evaluate renewable energy integration in South Africa's grid, using a stock-and-flow framework to simulate energy supply, demand, emissions, and socio-economic dynamics. SD enables the representation of dynamic behaviour over time through interactions among stocks (e.g., installed capacity), flows (e.g., energy production), and feedback loops (e.g., policy effects on renewable uptake). The methodology incorporates key SD fundamentals such as reinforcing feedback loops (which amplify change), balancing feedback loops (which counteract change), time delays (e.g., policy effects taking several years), and scenario analysis to simulate potential futures. Although Figures 2 and 4 depict causal loop diagrams (CLDs) supporting these structures, they are explained later in the paper to maintain flow. The model includes reinforcing loops (R1: solar adoption, R2: emissions reduction) and a balancing loop (B1: grid stability).
Key variables include renewable capacity (GW), coal reliance (%), load-shedding frequency (hours/year), emissions (MtCO2e), infrastructure costs (USD), and LCOE (USD/kWh). The scenarios modelled were framed in alignment with policy targets defined in the IRP 2019 (Department of Mineral Resource and Energy, 2019), as well as insights from global decarbonisation trajectories. Three penetration levels – 30%, 50%, and 70% renewable share by 2035 were chosen to reflect low, medium, and high ambition cases, respectively, and were informed by the IRP 2019, IEA projections (IEA, 2020), and China's long-term renewable plans (Yang et al., 2021). The penetrations assumes total capacity is the same but varied with renewable and coal share.
The model was calibrated using 2022 data and validated against IRP 2019 projections (Department of Mineral Resource and Energy, 2019), using the 2022 and 2030 energy mix comparison in Figure 1. To strengthen model reliability, additional validation was carried out against historical load-shedding data (2007–2022) and long-term emissions records, ensuring the simulated dynamics reflected real-world trends beyond policy projections. Iterative simulations balance R1, R2, and B1 loops, testing scenarios (30%, 50%, 70% renewable penetration) and sensitivity to variables like storage costs (±10%). The ±10% range was chosen because it reflects the typical annual variance observed in renewable cost projections and demand growth estimates reported by the IEA and IRENA. This ensures that results remain policy-relevant while capturing the realistic uncertainty bounds faced by South Africa's energy sector. This approach maintains transparency, reproducibility, and robustness. While solar energy is a significant component, this research focuses on the integration of the full range of renewables – solar (PV and CSP), wind, hydro, and biomass – as defined in the IRP 2019. The mention of solar in specific loops, such as R1, refers to its dominant role in certain dynamics, but the broader modelling framework covers all renewable sources.
Findings and discussion
South Africa's heavy reliance on coal is largely driven by its low LCOE, estimated at USD 0.037/kWh, and significant investments – amounting to USD 27.78 billion in 45 GW of installed coal capacity (Pierce and Le Roux, 2022). However, this dependency poses serious environmental and energy security challenges, particularly as the country grapples with persistent load-shedding and increasing electricity demand due to population growth (Pierce and Le Roux, 2022; Statistics South Africa, 2023). The SD model findings confirm that while coal's cost advantage remains a structural barrier, the negative externalities in terms of GHG emissions and reliability degradation outweigh short-term financial savings when considered over a 15-year horizon.
To better understand these dynamics, system dynamics modelling was used. The model captures how a growing population – rising at 1.3% annually(Statistics South Africa, 2023) – drives up energy demand, which in turn intensifies load-shedding, currently estimated at around 3000 h per year (SARB, 2023). This energy insecurity reinforces the adoption of solar energy (R1: a reinforcing loop), which gradually reduces coal dependency and lowers emissions (R2: another reinforcing loop). While R1 is labelled for solar due to its dominant contribution, our simulations show that wind and small-scale hydro also play substantial roles in grid stability, especially in higher penetration scenarios, aligning with global findings from Finland's grid integration studies (Aslani et al., 2014) and recent Sub-Saharan modelling work (Francis et al., 2022).
At the same time, the model incorporates key economic considerations, such as coal's cost advantage and the estimated USD 37.22 billion required for baseline renewable energy investments (Lund, 2008). These factors are captured within a balancing feedback loop (B1: Price Stability Balance) in Figure 2, which reflects the financial and infrastructural constraints that may slow the transition to renewables. Comparing our results with IRENA's, 2024 projections (IRENA, 2024), the South African cost increase estimates are within ±3% of global averages for comparable renewable shares, suggesting that the primary bottleneck is not total cost but the rate of capital deployment and regulatory alignment.
The government's IRP 2019 sets a target of 30.7 GW of renewable capacity by 2030, aiming for renewables to make up 39% of South Africa's energy mix (Department of Mineral Resource and Energy, 2019). To evaluate how different levels of renewable energy adoption could affect the country's energy future, a scenario analysis was carried out. This analysis considered three levels of renewable penetration by 2035: Low (30%), Medium (50%), and High (70%). These scenarios were designed not only to reflect IRP policy targets but also to benchmark South Africa against global leaders in renewable integration, thereby providing a practical reference for policymakers.
The outcomes of these scenarios – based on SD simulations using clearly defined parameters – are summarised in Table 2. Figure 3 illustrates the comparative impacts of each scenario, including reductions in emissions and load-shedding, increases in total system costs, and changes in installed capacity for both renewables and coal. From a policy standpoint, the medium scenario appears most viable, delivering significant emissions and load-shedding reductions without imposing the steepest cost increases of the high scenario. This mirrors the policy sweet spot identified in Malaysia's renewable planning framework (Nair et al., 2021), where moderate but sustained growth proved both politically and economically feasible.

Scenario analysis of renewable penetration in South Africa.
Scenario analysis of renewable penetration.

The results in Table 2 were calculated using the SD model described in Section 3, with explicit parameters: renewable capacity growth (2 GW/year (Department of Mineral Resource and Energy, 2019)), coal reliance (72.7% in 2022 to 20–50% by 2035 (Pierce and Le Roux, 2022)), load-shedding frequency (3000 to 1350–2250 h/year (SARB, 2023)), emissions (450 to 157–315 MtCO2e (Pierce and Le Roux, 2022)), storage costs (USD 1111.11/kWh), coal LCOE (USD 0.037/kWh), and renewable LCOEs (USD 0.027–0.044/kWh) (IRENA, 2024; Lund, 2008). Feedback loops (R1: solar adoption, R2: emissions reduction, B1: grid stability) from Figure 4 drive the model. Below, we detail each scenario:

South Africa energy grid dynamics CLD.
Parameters: 32.5 GW renewables (50% of 65 GW total capacity), coal at 32.5 GW (with 65 GW total reflecting 1.3% demand growth (Hlongwane and Daw, 2023; Statistics South Africa, 2023)). Storage costs USD 5.56 billion, coal LCOE USD 0.037/kWh, renewable LCOE USD 0.033/kWh (weighted average (AEMO, 2023b; CSIR, 2016; DMRE, 2024; Merem et al., 2022)). Carbon capture technology (CCT) captures 20% of coal emissions (Myllyvirta, 2021). Emissions Reduction (50%): Coal's share drops (72.7% to 50%), cutting emissions from 450 MtCO2e to 225 MtCO2e (R2), per (IEA, 2020; Myllyvirta, 2021; Pierce and Le Roux, 2022). Calculation: (450–225) / 450 = 50%. Load-Shedding Reduction (40%): Renewables reduce outages to 1800 h/year (R1), per (IIED, 2013; SARB, 2023). Calculation: (3000–1800) / 3000 = 40%. Cost Increase (15%): Storage and upgrades add USD 5.56 billion (15% above USD 37.22 billion (Lund, 2008)), driven by B1. Calculation: 5.56 / 37.22 = 15%.
Parameters: 19.5 GW renewables, coal at 70% (45.5 GW) with 65 GW total capacity, storage costs USD 2.78 billion, coal LCOE USD 0.037/kWh, renewable LCOE USD 0.036/kWh (Department of Mineral Resource and Energy, 2019; Lund, 2008; Pierce and Le Roux, 2022). Emissions Reduction (30%): Emissions fall to 315 MtCO2e (R2 weakened). Calculation: (450–315) / 450 = 30%. Load-Shedding Reduction (25%): Outages drop to 2250 h/year (R1 constrained). Calculation: (3000–2250) / 3000 = 25%. Cost Increase (10%): Upgrades add USD 3.72 billion (B1). Calculation: 3.72 / 37.22 = 10%.
Parameters: 45.5 GW renewables, coal at 30% (14 GW), 65 GW total capacity, storage costs USD 8.33 billion, coal LCOE USD 0.037/kWh, renewable LCOE USD 0.031/kWh (Department of Mineral Resource and Energy, 2019; IEA, 2020; IIED, 2013; Lund, 2008; Pierce and Le Roux, 2022). Emissions Reduction (65%): Emissions drop to 157 MtCO2e (R2 maximised). Calculation: (450–157)/450 = 65%. Load-Shedding Reduction (55%): Outages fall to 1350 h/year (R1). Calculation: (3000–1350)/3000 = 55%. Cost Increase (25%): Upgrades add USD 9.28 billion (B1). Calculation: 9.28/37.22 = 25%.
In the Low (30%) scenario, reductions in emissions (30%) and load-shedding (25%) fall short of global averages for similar renewable shares (typically 35–40% emissions cuts, underscoring that limited ambition fails to leverage economies of scale or attract sufficient private investment. This underperformance reflects South Africa's structural dependence on coal, where partial diversification fails to overcome grid instability caused by ageing coal plants. In contrast, countries such as Malaysia reached stronger outcomes at similar penetration levels because of earlier investments in storage and grid upgrades, which South Africa has yet to implement at scale.
The Medium (50%) scenario aligns closely with studies from Sub-Saharan contexts such as Kenya and Ethiopia (Francis et al., 2022; Tomala et al., 2021), where diversified renewable portfolios at similar penetration levels produced 45–55% emission reductions and tangible reliability improvements. This stronger alignment arises because, at around 50% penetration, economies of scale reduce the unit cost of renewable deployment, while diversification across wind, solar, and hydro strengthens reliability. In effect, South Africa's system benefits most at this threshold because renewables become large enough to offset coal outages, but not so large that storage and grid costs escalate disproportionately.
The High (70%) scenario surpasses many global benchmarks in emissions reduction (65%), comparable to leading European decarbonisation pathways (Aslani et al., 2014), but carries higher upfront costs and infrastructure stress. The relative cost intensity compared with Finland, for example, can be explained by differences in grid maturity and availability of dispatchable hydro resources. Finland's energy mix relies on hydro and nuclear buffers that lower integration costs, whereas South Africa must finance extensive grid upgrades and high-cost storage solutions to stabilise variable renewables.
Sensitivity analysis tested ±10% variations in key parameters: renewable capacity (27.6–33.8 GW), storage costs (USD 1000.00–1222.22/kWh), demand growth (1.2–1.4%), coal LCOE (USD 0.033–0.041/kWh), and renewable LCOE (USD 0.025–0.039/kWh). For the Medium scenario, results show emissions reductions of 45–55%, load-shedding reductions of 35–45%, and cost increases of 12–18%, confirming the model's robustness but highlighting coal's economic influence on the transition. From a regulatory perspective, this suggests that financial mechanisms such as targeted storage subsidies and renewable tariff adjustments could stabilise system costs within acceptable bounds while achieving significant decarbonisation.
The load-shedding reduction by 2030 stems from modelling the IRP 2019's 30.7 GW renewable capacity (Department of Mineral Resource and Energy, 2019), where solar uptake (R1 loop) offsets coal outages (SARB, 2023), calibrated with community solar data (Smit et al., 2019) and global stability trends (Nair et al., 2021). The emissions reduction by 2035 assumes a scaled renewable share, reducing coal's 72.7% baseline (Pierce and Le Roux, 2022), with CCT mitigating residual emissions (Myllyvirta, 2021). Cost increases reflect storage and grid upgrades, drawn from renewable system economics (Lund, 2008). These projections hinge on reinforcing loops (R1, R2) overpowering the balancing loop (B1), validated by iterative simulations balancing capacity and demand.
Community engagement, such as Enkanini's solar initiatives, and policy coherence, exemplified by Malaysia, accelerate this shift by enhancing South Africa's renewable incorporation (Nair et al., 2021; Smit et al., 2019). In Enkanini, local participation drives decentralised solar adoption, directly reducing load-shedding by supplementing grid supply, a model scalable across rural South Africa (Smit et al., 2019). Malaysia's cohesive renewable policies, integrating incentives with infrastructure, offer a blueprint for aligning South Africa's IRP 2019 with execution, cutting emissions through sustained investment (Nair et al., 2021). SD modelling predicts that expanding renewable energy capacity to 30.7 GW by 2030 could reduce load-shedding and cut emissions. This highlights the strategic value of renewables in improving grid reliability and accelerating decarbonization.
This diagram models South Africa's energy system, showing how reinforcing loops R1 for solar adoption and R2 for emissions reduction drive the growth of renewables, while a balancing loop B1 for grid stability helps control load-shedding.
Incomplete data from rural areas, such as energy demand and solar adoption rates, reduces the precision of our SD model's projections, but this can be improved by integrating satellite imagery with household surveys, as demonstrated by Bhattacharyya (S. Bhattacharyya, 2021).
Policy Implications
System dynamics modelling indicates that a 50% renewable energy share by 2035 optimally balances cost, emissions reduction, and grid reliability for South Africa. This scenario achieves a 50% emissions cut and 40% load-shedding reduction, with a manageable 15% cost increase, aligning with global benchmarks like Malaysia's renewable strategy. Policymakers should prioritise targeted storage subsidies and increasing baseload capacity to address renewable intermittency, with costs estimated at USD 5.56 billion for a 50% renewable mix. Time-of-use tariffs can shift 5–10% of industrial demand, saving USD 0.56 billion annually, as demonstrated in Australia. Phased coal retirements, reducing coal's 72.7% share to 40%, mitigate financial strain while leveraging CCT to cut emissions by 20%. Community-led initiatives, such as Enkanini's solar projects, accelerate adoption and reduce public-sector capital burdens by decentralising supply. Regulatory frameworks must integrate demand-response incentives, streamlined permitting for renewable projects, and concessional financing for grid upgrades, estimated at USD 2.78–9.28 billion across scenarios. These strategies are applicable to other Sub-Saharan nations with coal-heavy systems, like Kenya and Ethiopia, though outcomes depend on local infrastructure and governance.
To enhance policy relevance, it is also important to integrate uncertainty analysis. Political risks, such as regulatory delays, shifting government priorities, or policy reversals, can undermine investment confidence. Financial risks include exchange rate volatility and capital availability, both of which influence the feasibility of large-scale renewable projects. Social risks, particularly community resistance to land use or uneven distribution of energy access, may slow adoption despite technical viability. By explicitly modelling these uncertainties through scenario extensions or sensitivity overlays, policymakers can anticipate potential disruptions and design more resilient strategies.
A key limitation is the reliance on proxy data for rural energy demand, which reduces model precision. Improved data collection, using satellite imagery and household surveys as suggested by Bhattacharyya, is critical for refining projections and ensuring equitable energy access across urban and rural areas.
Conclusion
System dynamics (SD) modelling demonstrates that South Africa can achieve significant environmental and reliability improvements by increasing renewable energy penetration, aligning with the IRP 2019's target of 30.7 GW by 2030. A 50% renewable share by 2035 could reduce GHG emissions by 50% (from 450 to 225 MtCO2e) and load-shedding by 40% (from 3000 to 1800 h/year), balancing cost and reliability with a 15% cost increase (USD 5.56 billion). A high-ambition 70% renewable share could yield 65% emissions reductions (to 157 MtCO2e) and 55% load-shedding reduction (to 1350 h/year), though system costs may rise by 25% (USD 9.28 billion). These projections, driven by reinforcing loops (R1: solar adoption, R2: emissions reduction) and moderated by a balancing loop (B1: grid stability), highlight the trade-offs between ambition and cost. Targeted storage subsidies, estimated at USD 1111/kWh, can mitigate renewable intermittency, while demand-response measures, such as time-of-use tariffs shifting 5–10% of industrial demand, save USD 0.56 billion annually.
Phased coal retirements, reducing coal's 72.7% share to 40% or 20%, ensure economic stability, with CCT capturing 20% of residual emissions. Community-led initiatives, like Enkanini's solar projects, accelerate decentralised adoption, reducing public-sector capital burdens and enhancing equitable access. Coherent national policies, inspired by Malaysia's renewable framework, are critical for aligning incentives with infrastructure development. A key limitation is the reliance on proxy data for rural energy demand, which reduces model precision. Strengthening data collection through satellite imagery and household surveys, as demonstrated by Bhattacharyya, will enhance accuracy and support equitable scenario planning. These findings offer a scalable model for Sub-Saharan nations with coal-heavy systems, guiding South Africa toward a sustainable, low-carbon, and resilient power system by 2035.
Footnotes
Acknowledgments
The authors greatly acknowledge and welcome the support provided by the University of South Africa.
Funding
The authors disclosed receipt of the following financial support for the research, authorship, and/or publication of this article: This work was supported by the University of South Africa.
Declaration of conflicting interests
The authors declared no potential conflicts of interest with respect to the research, authorship, and/or publication of this article.