
Abstract
Resistance welding of high-performance thermoplastic composites is a promising joining technique for the structural assembly of aerospace components. Knowledge of the weld conductor resistance as a function of its dimensions, as well as external boundary conditions such as contact preparation and pressure, can be used to scale welding parameters. This paper presents a comprehensive review on the weld conductor contact preparation, length, width and contact pressure dependent resistance with respect to the Toray 5HS T300JB carbon woven prepreg 281 gsm fibre architecture. The study is based on a 4-wire resistance measurement of the carbon fibre fabric weld conductors and was conducted to provide a solid basis for defining the weld conductor’s resistance, considering the dependence on length, width and contact pressure. The experimentally determined resistance values were approximated using linear and non-linear regression functions and combined into a general formulation with respect to the investigated carbon fibre fabric architecture. The least squares fit of experimental versus model data confirmed a very high model confidence. Thus, the model allows a simplified transfer of electrical properties for process pre-design and scaling considering weld conductors with the same fibre architecture.
Keywords
Introduction
Welding technologies for the assembly of high-performance thermoplastic composites have gained significant attention in the aerospace industry due to their exceptional mechanical performance and, in particular, the ability to create a join between multiple composites without resorting to contamination-intensive machining processes.1–3
Resistance welding has emerged as a promising technique for joining thermoplastic composites, offering several advantages over traditional joining methods, due to the possibility to form an integral unity during the assembly from two or more differential parts.3–5
In resistance welding of thermoplastic composites, the heat of fusion is generated in the bondline due to Joule heating caused by a current flow through the weld conductor. Commonly used as weld conductors are stainless-steel meshes,6,7 carbon fibre woven fabrics or unidirectional carbon fibres,8,9 respectively. The physical architecture of the weld conductor determines its electrical and thermal properties such as power consumption, heat conversion and temperature uniformity.10,11
However, the characterisation of weld conductors for process design and the description of the scaling laws is largely based on extensive experimental work. 12
This paper focusses on the definition of a statistical (mathematical) model to determine the electrical properties of the weld conductor and its contact resistance analytically based on the of Toray 5HS T300JB carbon woven prepreg 281 gsm fibre architecture. Within the scope of this paper, the influence of two different contact preparation methods, the conductor length L, width w and contact pressure p are investigated in order to establish a general scaling law. In turn, this enables a simplified transfer of electrical properties to variations in those aforementioned conductor characteristics considering two possible methods for contact preparation (stitch perforation and ultrasonically) without further required experimental efforts. Moreover, it provides the foundation for process scaling towards a more resource-efficient process design and input for finite element modelling. This knowledge will contribute to the advancement of thermoplastic resistance welding within the projects “Hochkadenzfähige Thermoplast-Strukturen für Flächenanwendungen” (HoT StufF) and “Multifunctional Fuselage Demonstrator” (MFFD).
Experimental programme
Materials
Weld conductors were cut from pre-consolidated, five-harness satin (5HS) low-melt polyaryletherketone (CF/LM-PAEK) woven prepregs (Toray CETEX® TC1225, T300JB, 281 gsm). Five specimen were automatically cut in warp direction on a digital cutter (Zünd G3) to the length of 1560 mm for each weld conductor width configuration from (10–70) mm, respectively. After one measurement set, the respective weld conductor was trimmed in length manually to vary lengths from 1560 down to 160 mm. Thereby, cutting was performed on either side in order to remove pre-used contact surfaces and preventing errors due to a multiple use of individual contacts. Note that the later used conductor length was defined as the shortest distance between the contact preparation (here: L − 40 mm).
Since the electrically conductive filaments in the carbon fibre fabric prepreg are embedded and pre-consolidated in the insulating polymer matrix, two different contact preparation methods were applied to improve the current introduction and reduce the contact resistance.
Type I weld conductors were prepared using a Singer® HeavyDuty 4423 sewing machine in zig-zag mode to perforate the prepreg conductor in the contact region over the whole width in a distance of 20 mm from the edges on either side. The stitch perforation tears out bare carbon fibres on the back sides (Figure 1, top) which consecutively enhances the current introduction by reducing the contact resistance with the copper blocks. Type I specimen are hereafter denoted with the index ‘S’ for ‘stitch perforated’. Schematic Weld Conductor Type I with stitch perforation (top) and Type II with US preparation (bottom).
Type II weld conductors were modified by an ultrasound-based preparation method. A three-axis gantry system (ISEL Flatcom® M40) manipulating a BRANSON® ultrasonic sonotrode was used to automatically displace the matrix in the contact areas in a width of 12 mm.
Thereby, at first, the matrix gets molten by a combination of friction between sonotrode and conductor, as well as viscoelastic damping within the matrix, while following the continuous movement of the sonotrode on the conductors top-side, squeezing out the matrix and thus exposing the bare fibres in the contact region (Figure 1, bottom). Ultrasonically prepared specimen are hereafter denoted with the index ‘US’.
Measurement setup
In Figure 2, the schematic measurement setup is shown. Within this, the prepared weld conductors were placed symmetrically with respect to the copper blocks. A 3 mm thick silicone pad was used for homogenisation of the contact pressure distribution. The latter was applied by a FESTO® AEN-80-25-I-P-A pneumatic cylinder connected with a TwinCat controlled FESTO® VPPM pressure regulator to achieve reproducible pressure levels. Schematic 4-wire measurement setup.
The applied contact pressure acting on the contact area of the carbon fibre fabric conductor was calculated from the transmission ratio of the pneumatic cylinder area in relation to the silicone pad area. In addition, the retraction force by the spring of the FESTO® AEN cylinders and the lever aspect ratio of pair of forces given by test setup design were considered.
The residual weld conductor outside of the clamping was exposed to air within the laboratory environmental conditions (20°C, 25 % rel. humidity) and remained without external pressure application.
A 4-wire resistance measurement setup was chosen to eliminate wire and contact resistances in-between cables and measurement device leading to an increased accuracy. For this purpose, both contact blocks were connected with either two cables to an R&S® HMC8012 Digital Multimeter. Only the device’s test current of 1 mA was applied to avoid heating of the weld conductor and thereby thermally caused changes in resistance.
The multimeter’s accuracy in 4-wire resistance measurement setup is stated to be ± (0.050 % of reading +0.005 % of range) up to 400 Ω at a recording frequency of 5 Hz. 13
It is important to note, that the measured resistance still represents the total resistance of the electrical system (Figure 3), that is, weld conductor resistance plus contact resistances from copper blocks into the current-carrying fibres. The distinction between material and contact resistances will be derived in the section ‘Effect of Length’. Electrical measurement network.
Measurement series
Experimental programme overview.

RRelief pressure step for hysteresis investigation.
Contact pressure was stepped at first from 1 MPa to 2 MPa and finally to 3 MPa (except for widths above 45 mm). For each pressure step, a number of 100 data points were measured once the pressure remained constant and the mean resistance value of all recorded data points was stored. To investigate potential hysteresis effects, pressure was stepped back to 2 MPa and subsequently 1 MPa with respective resistance measurements.
Results and discussion
In total, about 1,600 measurements were performed during this experimental programme. Results for each investigated effect of influence parameters are presented in the following.
Effect of Length
The behaviour of the weld conductor resistance R with varying lengths is assumed to follow Ohm’s Law reading
Figure 4 shows the measured data points for stitch perforated and US-prepared weld conductors of 45 mm width, constant contact pressure of 2 MPa and varying lengths. In accordance with Ohm’s law, the linear dependency on length is clearly visible. Moreover, both preparation types do not show significant differences with respect to the resistance value. Total resistance of stitch perforated (S) and US-prepared weld conductors (45 mm width) over length (const. contact pressure 2 MPa).
Thereby, the slope of the curve corresponds to the specific resistance of the weld conductor which is purely dependent on the length whereas the y-intercept represents the contact resistance within the system since it is the only remaining term once the length and thus the material resistance approaches zero. In turn, the function of the total resistance in dependence of the weld conductor length L in Figure 4 can be written as

As expected, the length-specific resistance β L can be assumed to be constant due to the low variation within one specimen width (S: ±0.2 %, US: ±2.6 %).
Due to the free bearing of the weld conductor between the contact blocks without the presence of boundary conditions influencing the measurements (such as external pressure applied to the weld conductor), the marginally existing variations in the resistance value are attributed to measurement and preparation inaccuracies, as well as internal material imperfections (such as roving and filament positions).
By contrast, the contact resistance decreases significantly for increasing pressures. Further considerations on the effect of contact pressure will be made in the respective section ‘Effect of Contact Pressure’ below.
All coefficients of determination are very close to 1 which confirms a very good fit of the linear regression model with the measurements.
Effect of width
For the width-dependent behaviour of weld conductor resistance, the woven fabric can be seen as parallel circuit of n-identical
1
current-carrying rovings with a theoretical resistance R
Rov
. Following the rules for parallel electrical circuits, the material’s resistance reads
Equation (3) leads to a reduction of weld conductor’s resistance for larger widths (n ↑) and vice versa in exponential manner. Important to note is that this model concept purely regards the material behaviour and does not consider any effects of a varying contact resistance for different widths so far.
Figure 5 shows representatively the data points for stitch perforated and US-prepared weld conductors of 220 mm length, constant contact pressure of 2 MPa and varying widths. The exponential decay at increasing widths from theory can be clearly seen although the measured total resistance, that is, material’s resistivity plus contact resistance, is plotted. Total resistance of stitch perforated (S) and US-prepared weld conductor (220 mm length) over width (const. contact pressure 2 MPa).
As aforesaid, along with a change of width and thus resistance of the woven fabric, the contact resistance is expected to change with varying widths as well. However, both effects are superimposed within the measurement setup and cannot be distinguished.
Therefore, additional measurements were carried out for several width steps at different lengths to obtain the linear length-dependent curves (analogue to measurements in previous section). From that, the y-intercepts delivered the actual relation between weld conductor width and occurring contact resistance. An exemplary graph of stitch perforated weld conductors of different widths over length is shown in Figure 6. A more detailed elaboration of the width-dependence will be shown in the section ‘Statistical Modelling’ below. Total resistance of stitch perforated weld conductors over length for different widths (const. contact pressure 2 MPa).
Effect of contact pressure
Table 2 already indicated decreasing contact resistances for increasing contact pressures which is in accordance to other studies.8,14,15 This observation can be described by the idea that that an increasing contact pressure level decreases the relative distance of neighbouring filaments, leading to a reduction in dielectric strength and improved contact.
Those correlations are exemplified for length-dependent as well as width-dependent experimental data in Figures 7 and 8, respectively. Total resistance of stitch perforated weld conductors (45 mm width) over length for different contact pressures. Total resistance of stitch perforated weld conductors (220 mm length) over width for different contact pressures.

Therewith, the reduction in contact resistance relative to the pressure change of the first step from 1 MPa to 2 MPa (−14 %) is comparable to the reduction in the second step from 2 MPa to 3 MPa (−11 %), even though slightly smaller. This goes along with studies which found a plateau of nearly constant contact resistance after the initial drop before resistances increased again at higher contact pressures.8,14
Additionally, both weld conductor types exhibit a hysteresis effect in the total resistance regarding a cycle of contact pressure application and relief (Figure 9). In turn, the standard deviation of the weld conductor’s total resistance gets lowered in the same manner (Figure 10), whereby ultrasonically prepared specimen seem to benefit more from the pressure cycle. Total resistances of stitch perforated (S) and US-prepared weld conductors (30 mm width, 120 mm length) during pressure application and relief. Averaged standard deviation of stitch perforated (S) and US-prepared weld conductors during pressure application and relief.

The data leads to the assumption that during the higher pressure step, plastic deformation of the weld conductor occurs in the contact area. To evaluate the hypothesis of plastic deformation, topography measurements of the weld conductor preparation areas were made using a Keyence VHX-5000 digital microscope prior and post to a pressure application cycle.
Therefore, the surface profile parallel to the conductor width was recorded at each roving centre line and the average peak-to-peak height was determined. Exemplary surface profiles of new and pre-loaded contact areas with corresponding surface profiles of stitch perforated and US prepared conductors can be found in Figures 11 and 12, respectively. Microscopic image and corresponding surface profile of an stitch perforated conductor prior (top) and post (bottom) to pressure application. Microscopic image and corresponding surface profile of an US prepared conductor prior (top) and post (bottom) to pressure application.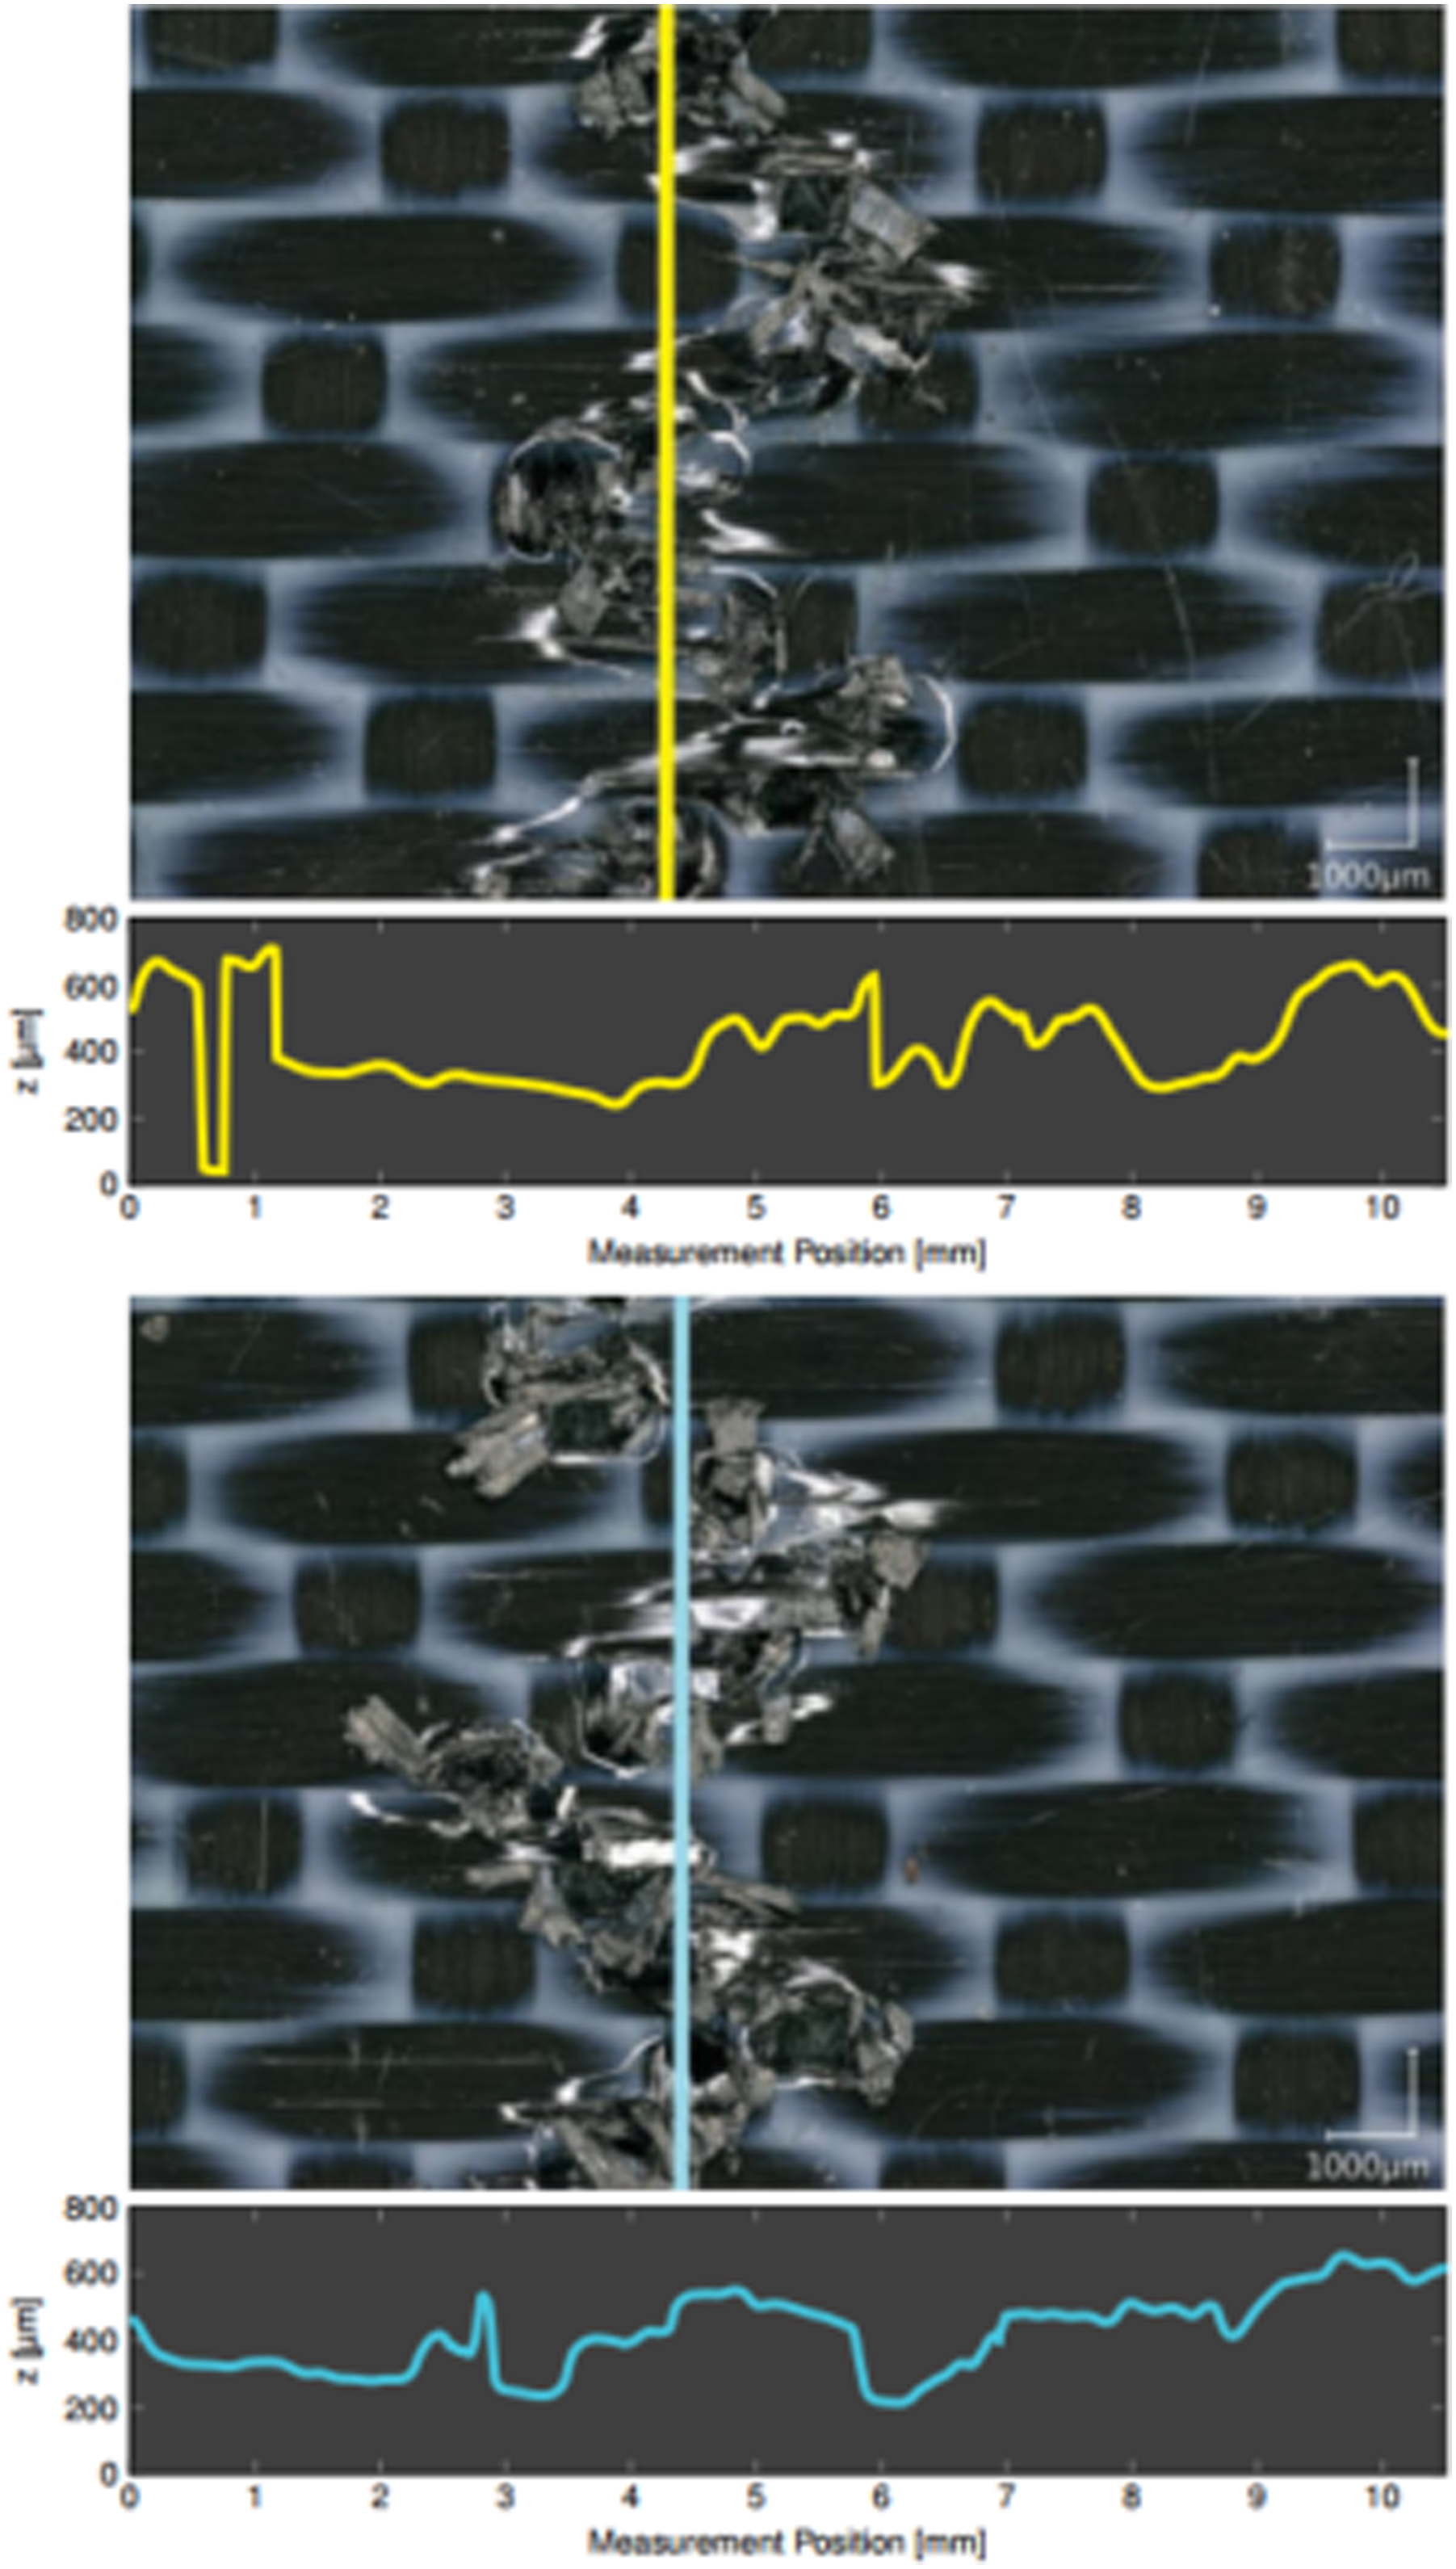
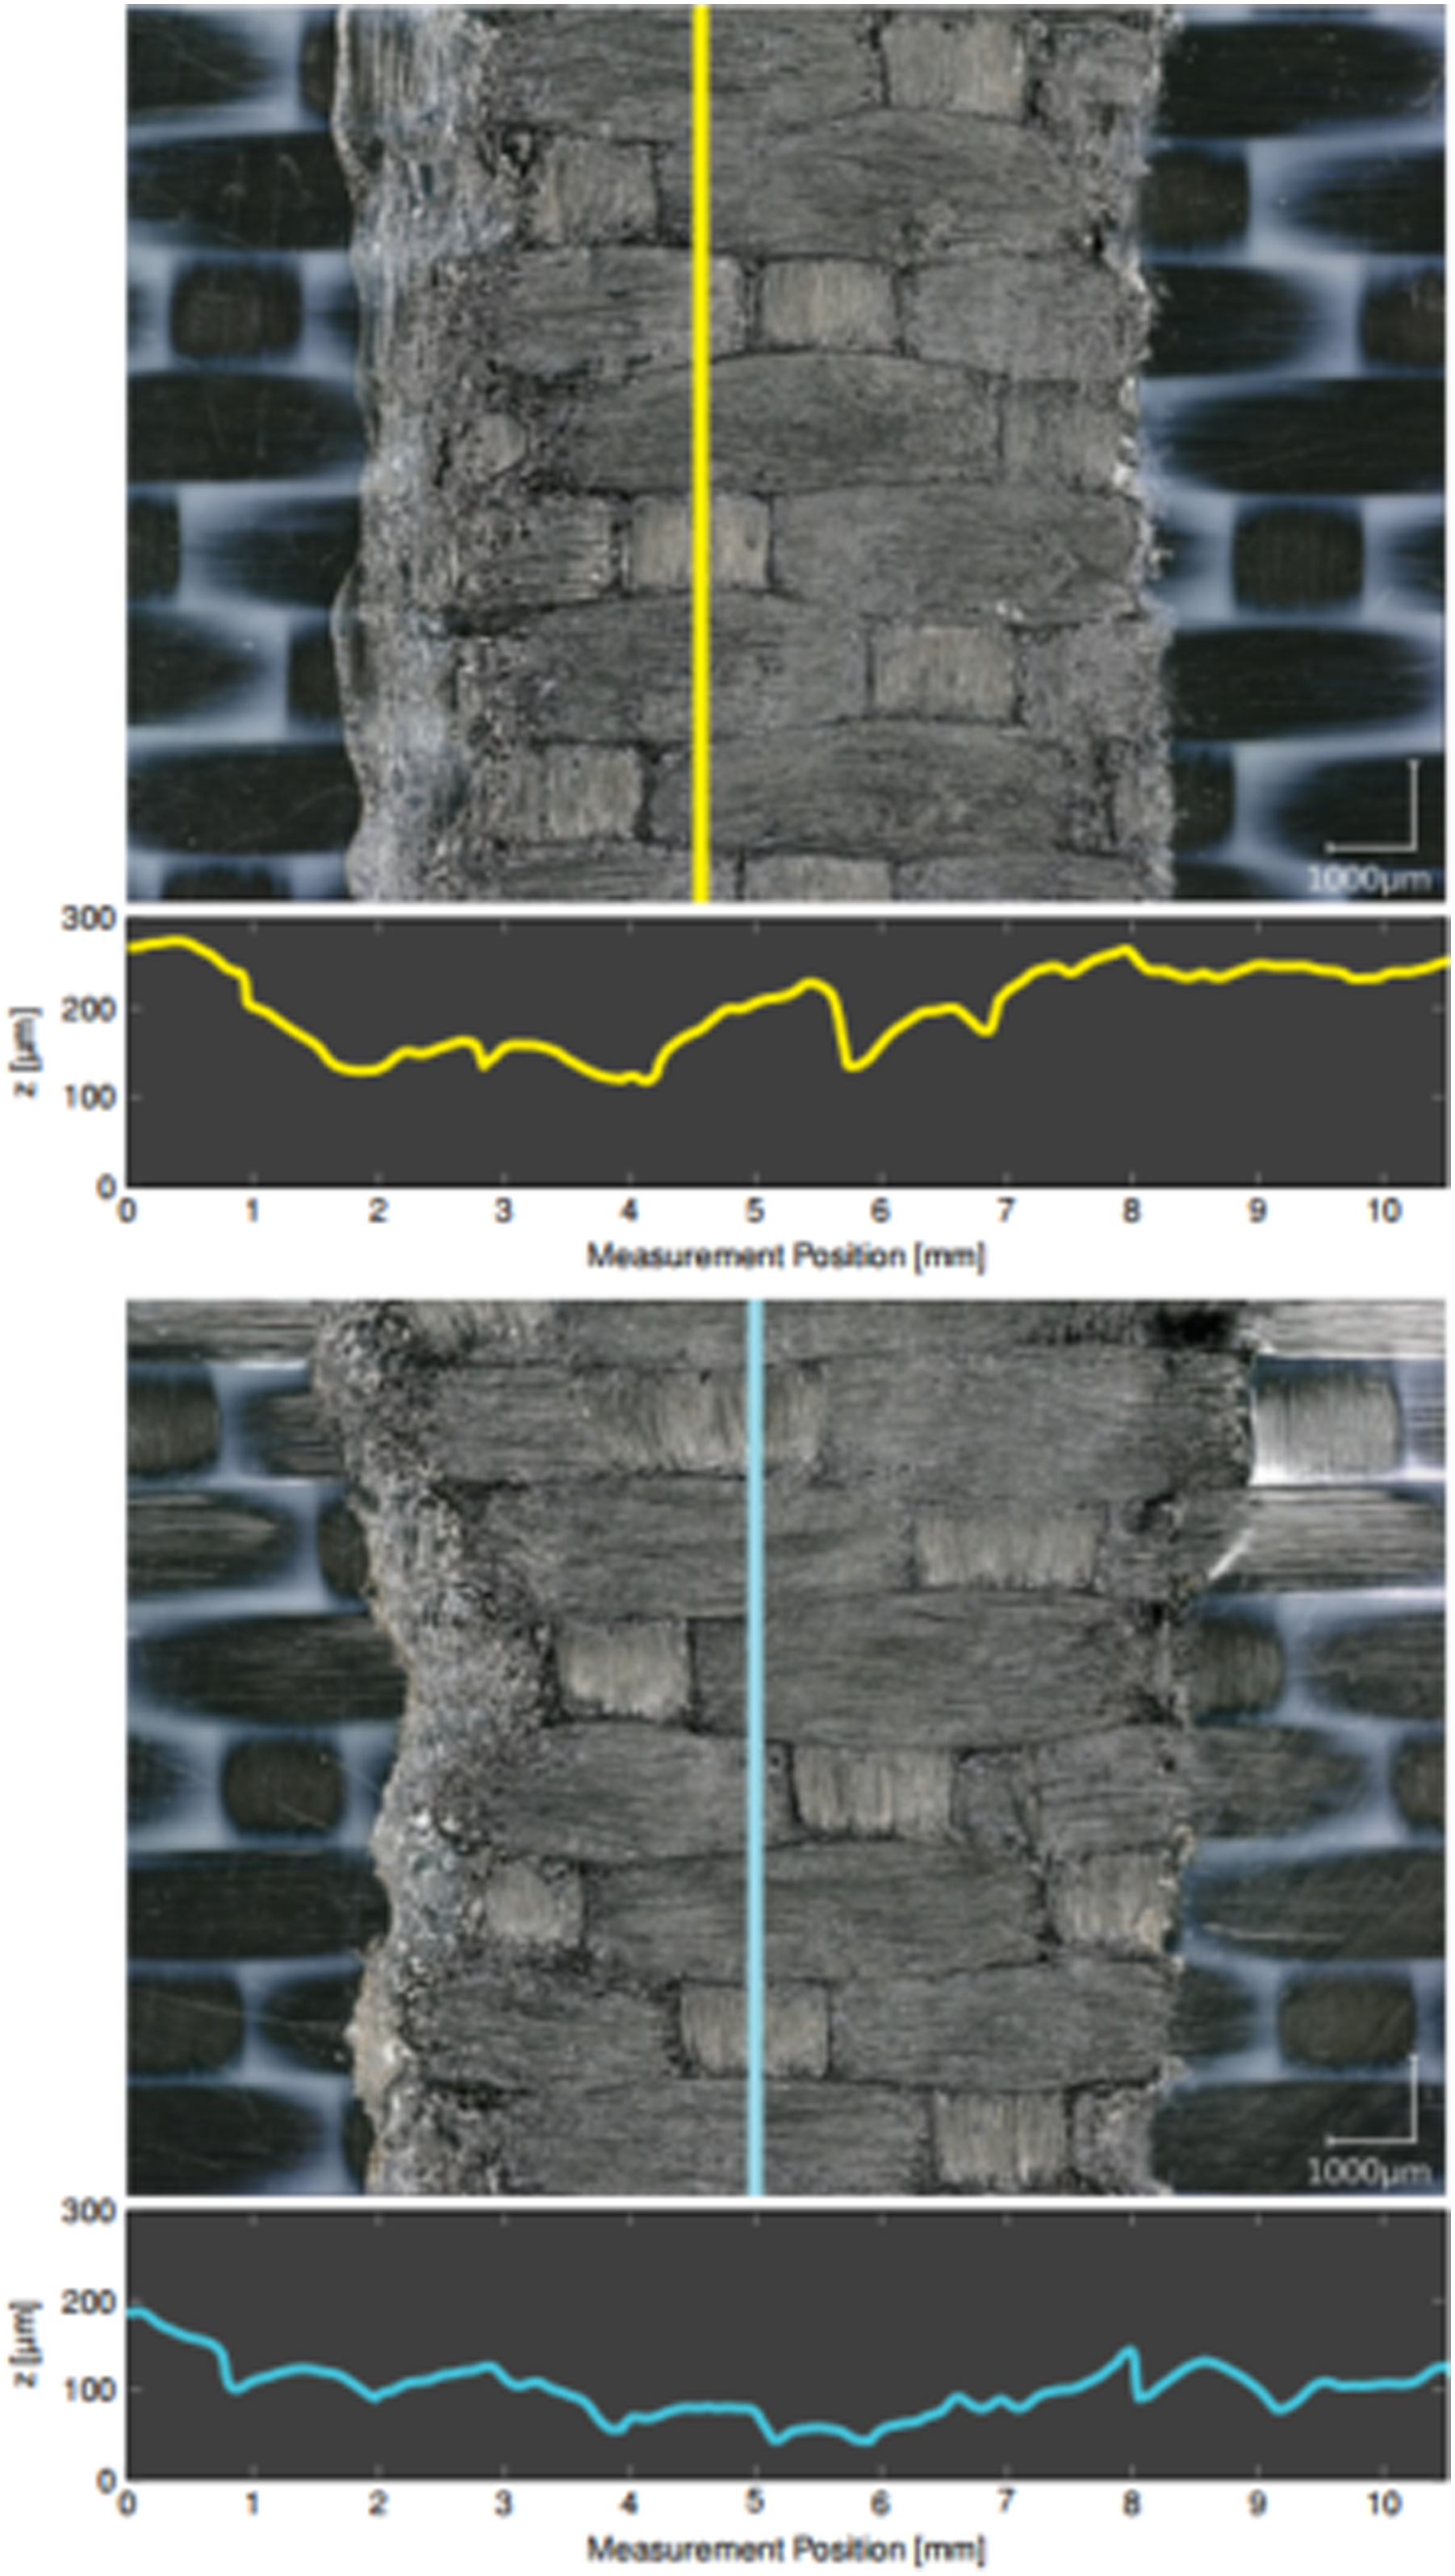
For both types, a reduction in peak-to-peak profile height can be found as expected. Stitch perforation height was reduced from averaged (404 ± 51) µm to (317 ± 37) µm (−22 %), while the initial height of new US prepared conductors with (239 ± 23) µm became after pressure application on average (196 ± 42) µm (−18 %).
On the one side, these results confirm the assumption of plastic deformation in the contact area after pressure loading which contributes to a remaining lowering effect on the contact resistance. On the other side, they back up the observation that US prepared weld conductors exhibit lower contact resistances due to smoother contact surfaces, that is, lower overall peak-to-peak profile heights.
The sustained reduction in contact resistance achieved by plastic deformation of the matrix is interesting, for example, with respect to the conduction of a further preparation step in order to additionally lower the contact resistance value.
Effect of preparation
Generally, stitch perforated weld conductors show higher contact resistances than the US-prepared counterparts (cf. Table 2) which can be attributed to the larger conductive contact area generated by the ultrasonic sonotrode compared to the single torn out fibres via stitch perforation as well as the smoother surface as shown in the previous section.
However, this difference seems to almost vanish for larger widths (cf. Figure 5). One reason is seen in the less difficult perforation of larger widths compared to narrow weld conductors. For the latter, catching all rovings with the needle at set feed settings is very difficult and this manual preparation step showed often inconsistent or error-prone results especially at the specimen edges which cannot be balanced as good as over a larger width.
Contrary to that, the ultrasonic preparation is a fully automated process executed on a computer-controlled 3-axis gantry system with a predefined programme. This in turn leads to more reproducible results which can also be seen by means of the occurred averaged standard deviation of measured total resistances (Figure 10), which are notably lower than for the manual needling preparation. In general, both preparation methods favour higher contact pressures to lower contact resistances as well as their deviations.
Statistical modelling
In the preceding sections, the effects of length, width and contact pressure were elaborated regarding experimental data. In the next step, these measured data points were used to develop a statistical model which incorporates all three influence parameter, namely, length L, width w and contact pressure p. This finally led to a mathematical formulation describing the total resistance in dependence of those parameters.
Theory
Basis of the following modelling are the standard definitions of linear, power and logarithmic regression analysis. 16
Thereby, the linear regression model function reads


The power regression model leads to the function


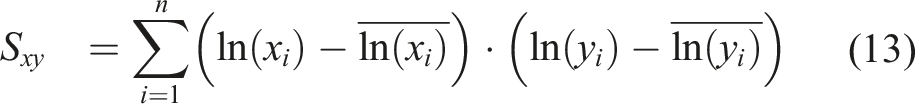
The logarithmic regression model uses the natural logarithm in the form


The corresponding coefficient of determination R2 for all regression types can be calculated according
Modelling


Averaged length-specific resistance
Using the power regression model from equation (9), the length-specific resistance β
L
can be expressed as function of width
The pure length-dependent equation (20) can be expanded by a width-dependent portion for the length term to
As next step, the first term in equation (22) representing the contact resistance R C was investigated for width dependency. For that purpose, R C was determined by means of linear regression (cf. Equations (4)–(8)) for different widths and contact pressures as shown in Table 2.
Once again, plotting this data gave the impression of a power function. The data set of stitch perforated weld conductors is shown in Figure 14. Contact resistance R
C
of stitch perforated weld conductors over width for different contact pressures.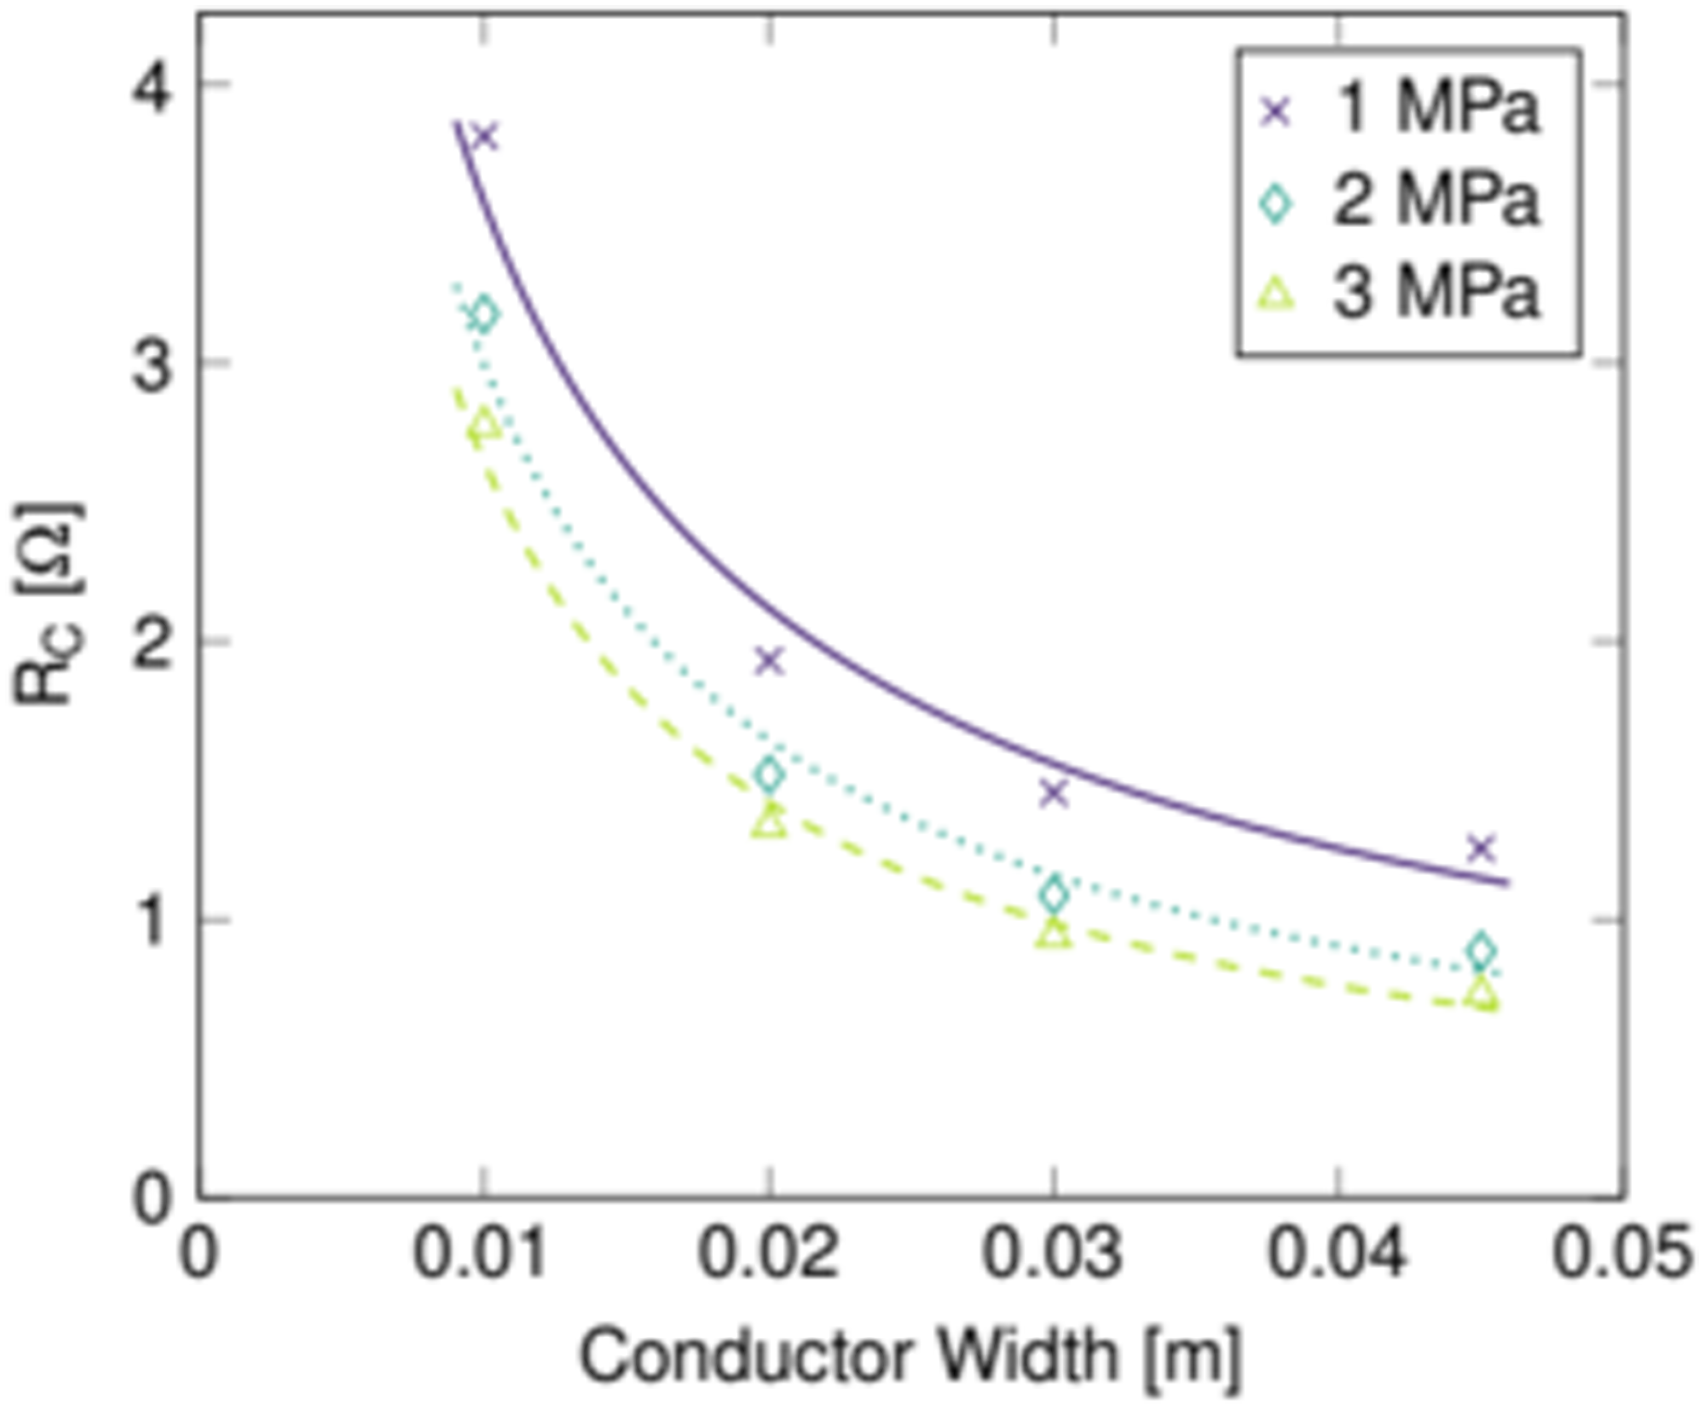
Using the power regression model from equation (9), the contact resistance R
C
can be modelled by the function

The only remaining unknown dependency was the behaviour for different pressures. Therefore, the determined coefficients of αC1 and αC2 were plotted again, this time over pressure.
For αC1, either power or logarithmic regression came into question regarding the function plot whereof the first showed a better fit to the experimental data considering the coefficient of determination (S: R2 = 0.993/US: R2 = 1.000) compared to the logarithmic approach (S: R2 = 0.968/US: R2 = 0.976; Figure 15). For αC2, only a logarithmic regression was possible due to the negative values. Nonetheless, very good approximation was achieved (S: R2 = 0.981/US: R2 = 1.000; Figure 16). Regression coefficient αC1 over contact pressure. Regression coefficient αC2 over contact pressure.
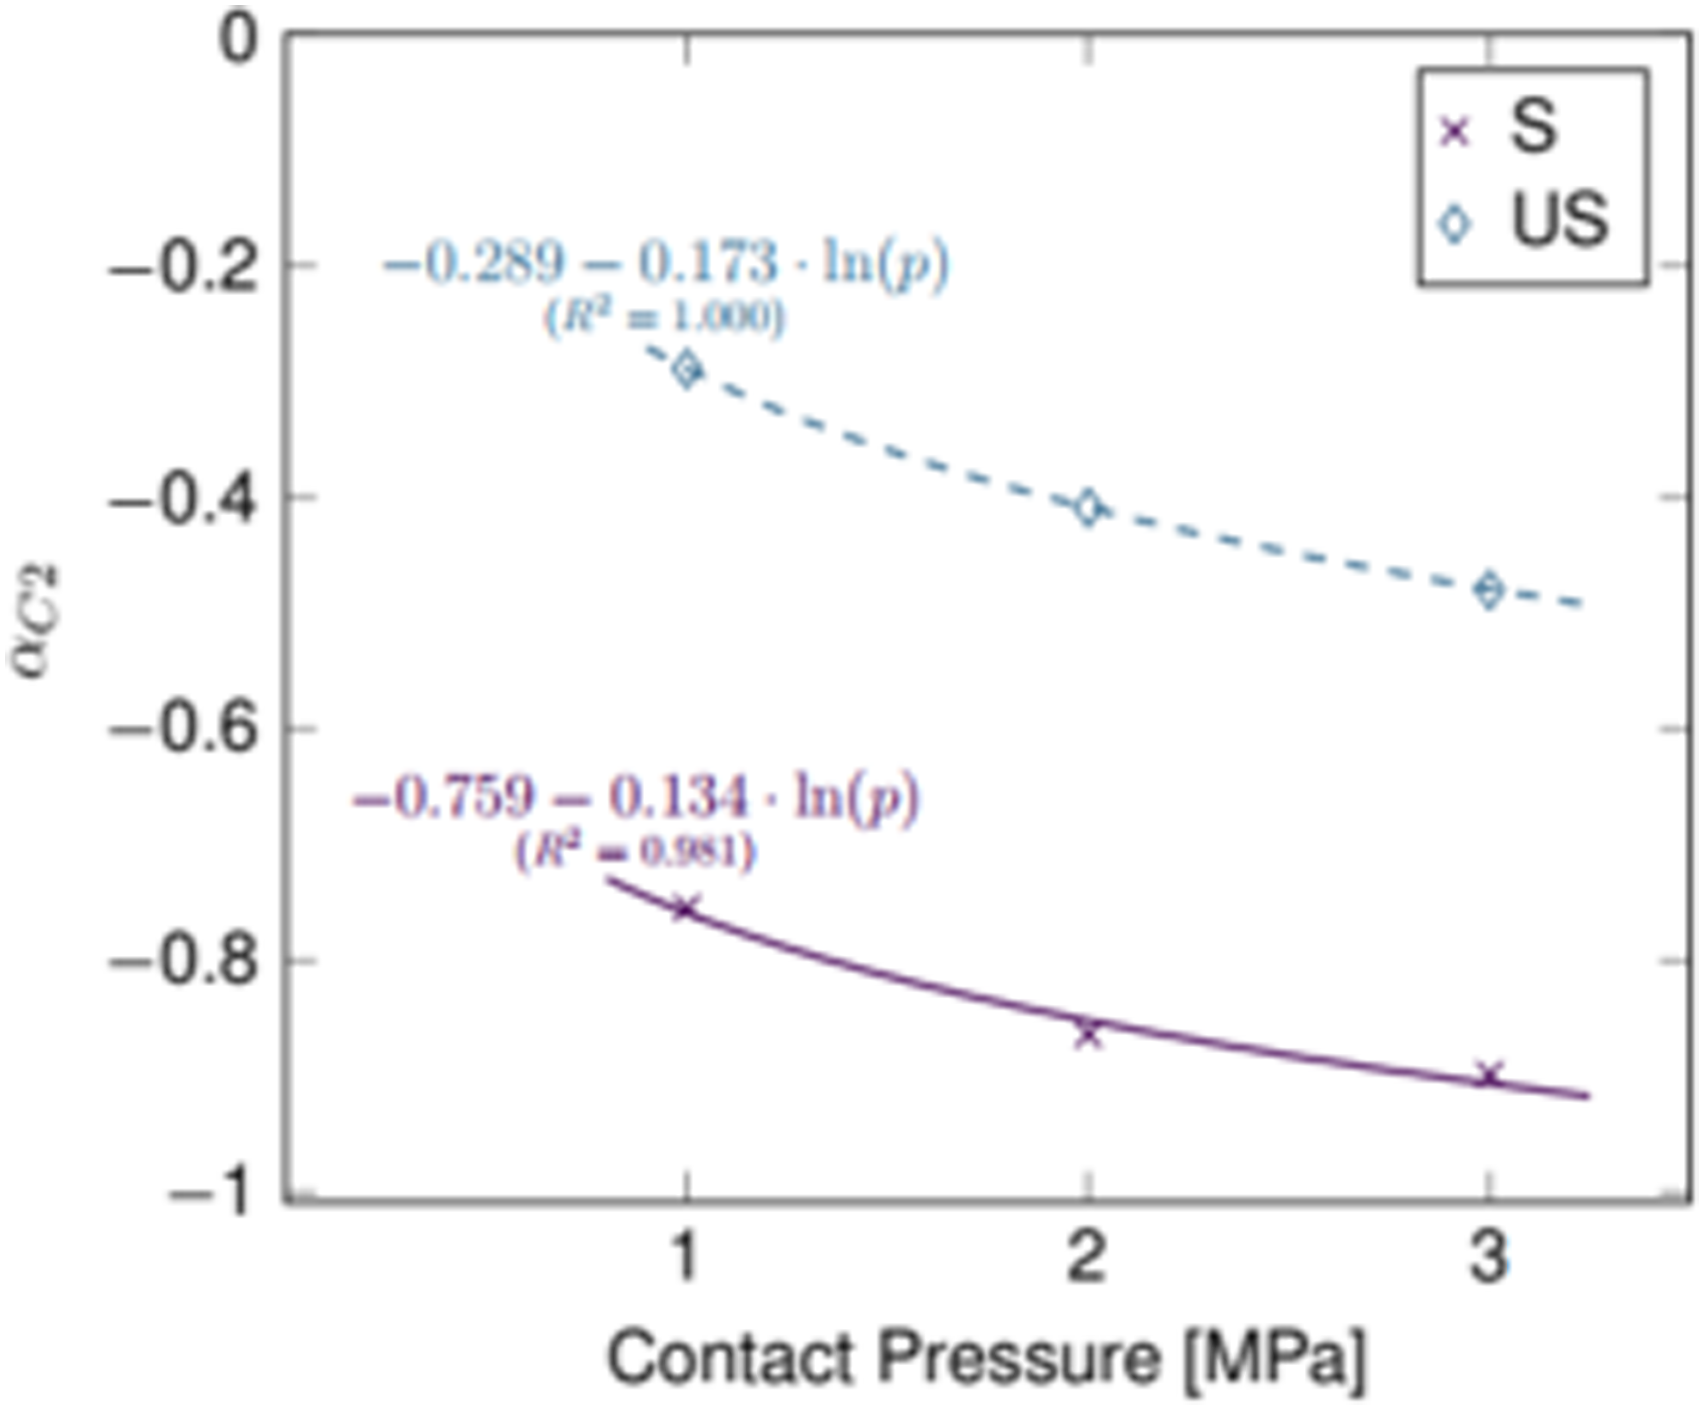
Hence, the pressure-dependent functions for αC1 and αC2 read, respectively,


Finally, bringing Equations (22) and (26) together yields the overall function for the total resistance in dependency of length, width and contact pressure as
Validation
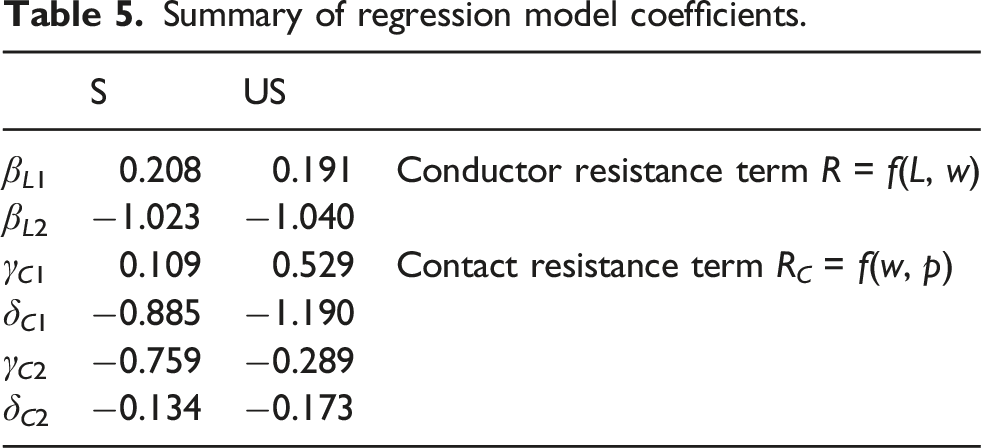
Figure 17 shows that the computed values from the prediction model are in very good agreement with the actual measured resistances. In particular, the averaged deviation between model-predicted and measured values is 0.448 %. Measured vs. model-predicted total resistance for all data points.
Conclusion
Within this paper, an experimental program for the definition of the weld conductor and contact resistance is presented, based on pre-consolidated Toray 5HS T300JB carbon woven prepreg 281 gsm fibre architecture. A full-factorial design for the contact preparation (stitch and ultrasonic preparation), conductor length (120 – 1520) mm, width (10 – 70) mm and contact pressure (1 – 3) MPa dependent definition of the conductor and contact resistance has been conducted in a 4-wire measurement setup. Values for contact and conductor resistance were separated analytically by means of a statistical modelling theory. The effects of length, width and contact pressure have been analysed with respect to the conductor resistance value and were compiled to a general length, width and contact pressure dependent resistance equation, valid for the described fibre architecture. A least squares analysis was performed in order to validate the model predicted resistance versus the measured total resistance, demonstrating a very good agreement between model and measurement data. Thus, the results of the scaling law builds a verified foundation for a simplified scaling of electrical properties for resistance welding in application with respect to the Toray 5HS T300JB weld conductors considering variations in the conductor length, width and contact pressure.
Footnotes
Acknowledgements
The authors would like to thank the German Ministry for Economic Affairs and Climate Action (BMWK), as well as the Clean Sky 2 Joint Undertaking (JU) for the funding of this work. In addition, the authors would like to thank Toray Advanced Composites for kindly providing the weld conductor material.
Declaration of conflicting interests
The author(s) declared no potential conflicts of interest with respect to the research, authorship, and/or publication of this article.
Funding
The author(s) disclosed receipt of the following financial support for the research, authorship, and/or publication of this article: This work was supported by the Bundesministerium für Wirtschaft und Technologie (BAnz AT 15.11.2019 B1) and Horizon 2020 Framework Programme (945583).
Disclaimer
The results, opinions, conclusions, etc. presented in this work are those of the author(s) only and do not necessarily represent the position of the JU; the JU is not responsible for any use made of the information contained herein.