
Abstract
This paper presents a parameter study into the thermoplastic-automated fibre placement process. The material used was carbon fibre-reinforced LM-PAEK unidirectional tape. The overall objective of this investigation was the derivation of regression models to describe and predict the consolidation quality of laminates in dependence on the main process parameters of the lay-up process. Furthermore, post-consolidation by stamp forming was investigated to analyse the impact of the initial quality of the blank on post-forming laminate quality. With the parameter study performed, prediction models for the degree of bonding and crystallinity could be derived. In addition, a more comprehensive understanding of the process parameter influences and the definition of parameter limits to distinguish between rapid and in situ lay-up processes was achieved. Furthermore, the potential of the process chain consisting of rapid lay-up and stamp forming for producing high-quality laminates was demonstrated for the investigated LM-PAEK tape.
Introduction
The automated cost-efficient manufacturing of composite parts is becoming increasingly important for the aerospace industry because of the need to reduce production costs and environmental impact. Currently, most composite parts for aircraft are made by thermoset composites. However, composites with a thermoplastic matrix offer several advantages compared to thermoset composites, such as the possibility for highly productive manufacturing processes or weldability for functional integration, assembly and repair, 1 as well as potential benefits in terms of recycling routes. One of these manufacturing processes is automated fibre placement (AFP). With thermoplastic AFP (T-AFP), pre-consolidated or fully consolidated preforms can be manufactured, depending on process setup and processing parameters. Furthermore, complex-shaped parts can be manufactured by robot-based lay-up, with the fibre angles precisely adjusted according to the load paths and local thickness variations implemented to reduce weight and material use.2,3 There have been several recent research projects on manufacturing thermoplastic composites for primary aircraft structures, in particular. 4 Process concepts established for thermoset AFP regarding lay-up path planning and avoidance of defects need to be adapted and optimised for thermoplastic AFP to enable the manufacture of high-quality structural parts.
Intimate contact and autohesion are the main mechanisms for thermoplastic AFP. Surface contact of the two welding partners is required so that interdiffusion and entanglement of the polymer chains can occur to enable bonding between interfaces of two thermoplastics. Gaps between the interfaces cannot be bridged by the polymer chains. 5 Due to the high viscosity of high-performance thermoplastics, even at elevated temperatures, deformation of the tape material by pressurisation is necessary to form intimate contact at the interface. 6 This deformation process is called ‘squeeze flow’. 7 Consequently, the development of intimate contact depends on the surface structure of the tape material 8 and on the process parameter pressure, temperature and contact time. 5 In the models of Dara and Loos, 5 Lee and Springer 6 and Yang and Pitchumani 9 for the development of an intimate contact, the ply surfaces are described by rectangular geometries. Yang and Pitchumani enhanced the Lee and Springer`s initial model describing the assumed rectangular geometry of the interface fractally. 9 Çelik et al. 10 introduced the concept of effective intimate contact. It was found that the degree of effective intimate contact not only depends on squeeze flow, as stated by the aforementioned models, but also on percolation flow. Based on the contact development models described, Mantell and Springer 11 outlined a model for the degree of bonding as the product of the degree of autohesion and the degree of contact. Ideally, the surfaces are unidentifiable after joining, and the bond strength of the interface equals the strength of the individual joining partners. 12 Taking the interdiffusion effect and the development of intimate contact for the bonding process into account, the main influencing parameters are the process temperature, pressure, contact time and the polymer`s molecular structure. 8
The main influencing factors in T-AFP are the lay-up speed, nip-point temperature, tooling temperature and compaction force as described by the models for the development of intimate contact and the degree of bonding. The nip-point describes the contact point between the material laid and the tooling or substrate. In a recent study of the influence of process parameters on blank quality, Raps et al. 13 showed that heated tooling is advantageous in terms of the degrees of bonding and crystallinity that can be achieved. Furthermore, it was shown that higher nip-point temperatures also increase bonding strength. This correlation between nip-point temperature and laminate quality was also shown by Di Francesco et al. 14 The effect of compaction force on bonding strength is less significant, as shown by Raps et al. and Risteska et al. 15 Di Francesco demonstrated that interply shear strength is not significantly affected by lay-up speed for a range of 200 to 400 mm/s, independent of nip-point temperatures ranging from 340°C to 400°C. A further increase in lay-up speed to 800 mm/s led to a 40% reduction in interlaminar shear strength. 14 In addition, Stokes-Griffin and Compston 16 found that lap shear strength is also not significantly affected by lay-up speed in the 100 to 333 mm/s range. 16 Schiel et al. 17 found that with unheated tooling and different nip-point temperatures, a doubling of lay-up speed from 125 to 250 mm/s did not significantly affect the shear strength of CF LM-PAEK laminates.
The overall manufacturing route of the composite part is essential in defining the process parameters in the T-AFP process. For in situ lay-up, complete consolidation is required so that demoulding and trimming are the only additional process steps needed. Partial consolidation in the lay-up process is sufficient for manufacturing routes involving a post-consolidation step. Here, differentiation between post-consolidation with and without forming is called for. Post-consolidation in an oven or autoclave is a typical example for post-consolidation without forming. For these manufacturing routes, lay-up needs to be conducted near net shape and three-dimensionally according to the part geometry. Lay-up can be performed two-dimensionally for process routes with an additional forming step. One typical example of post-consolidation with forming is the stamp-forming process. 18
The objective of this study is the definition of limits for distinction between rapid lay-up and in situ lay-up. A post-consolidation process is required for rapid lay-up. Stamp forming was chosen as the post-consolidation process due to its high potential for three-dimensional parts of complex shape. 1 The effect of initial blank quality on stamp forming is investigated and process limits are analysed. Prediction models are derived by performing an analysis of variance for the consolidation quality evaluation criteria.
Experimental work
Fibre placement system
A Coriolis C1 AFP system (Coriolis Composites SAS, France) was used in this study. The machine consists of a six-axis robot mounted on a linear axis and equipped with a laying head for the parallel processing of eight tows of ¼ inch (6.35 mm) width. The maximal feeding and cutting speed of the machine is limited to 400 mm/s. To process thermoplastic material, a near-infrared diode laser system (Laserline GmbH, Germany) is also mounted on the end effector. The laser type is the LDF 6000-100 VGP with a wavelength range of 900 to 1070 nm and a maximum power of 6 kW. The focal distance is 240 mm, and the rectangular laser field has dimensions of approximately 58 x 8 mm2. The laser field was adjusted about 60% to the substrate and 40% to the compaction roller. A deformable compaction roller with a shore hardness of 50A and a diameter of 70 mm was used for all tests.
Material
The tape material used in this research study is a carbon fibre-reinforced low-melt polyaryl ether ketone (LM-PAEK) tape. The fibre areal weight of the tape is 194 gsm with a theoretical consolidated ply thickness of 0.185 mm. The fibre used is a T700, and the reported resin content is given by the supplier with 34 wt%. A cross-section of the slit tape can be seen in Figure 1. The fibres are distributed very homogeneously within the tape. In addition, the impregnation quality is high as the degree of porosity across the tape is low, compared to other thermoplastic tapes based on experience gathered at Fraunhofer IGCV. Cross-section of initial tape quality perpendicular to fibre direction.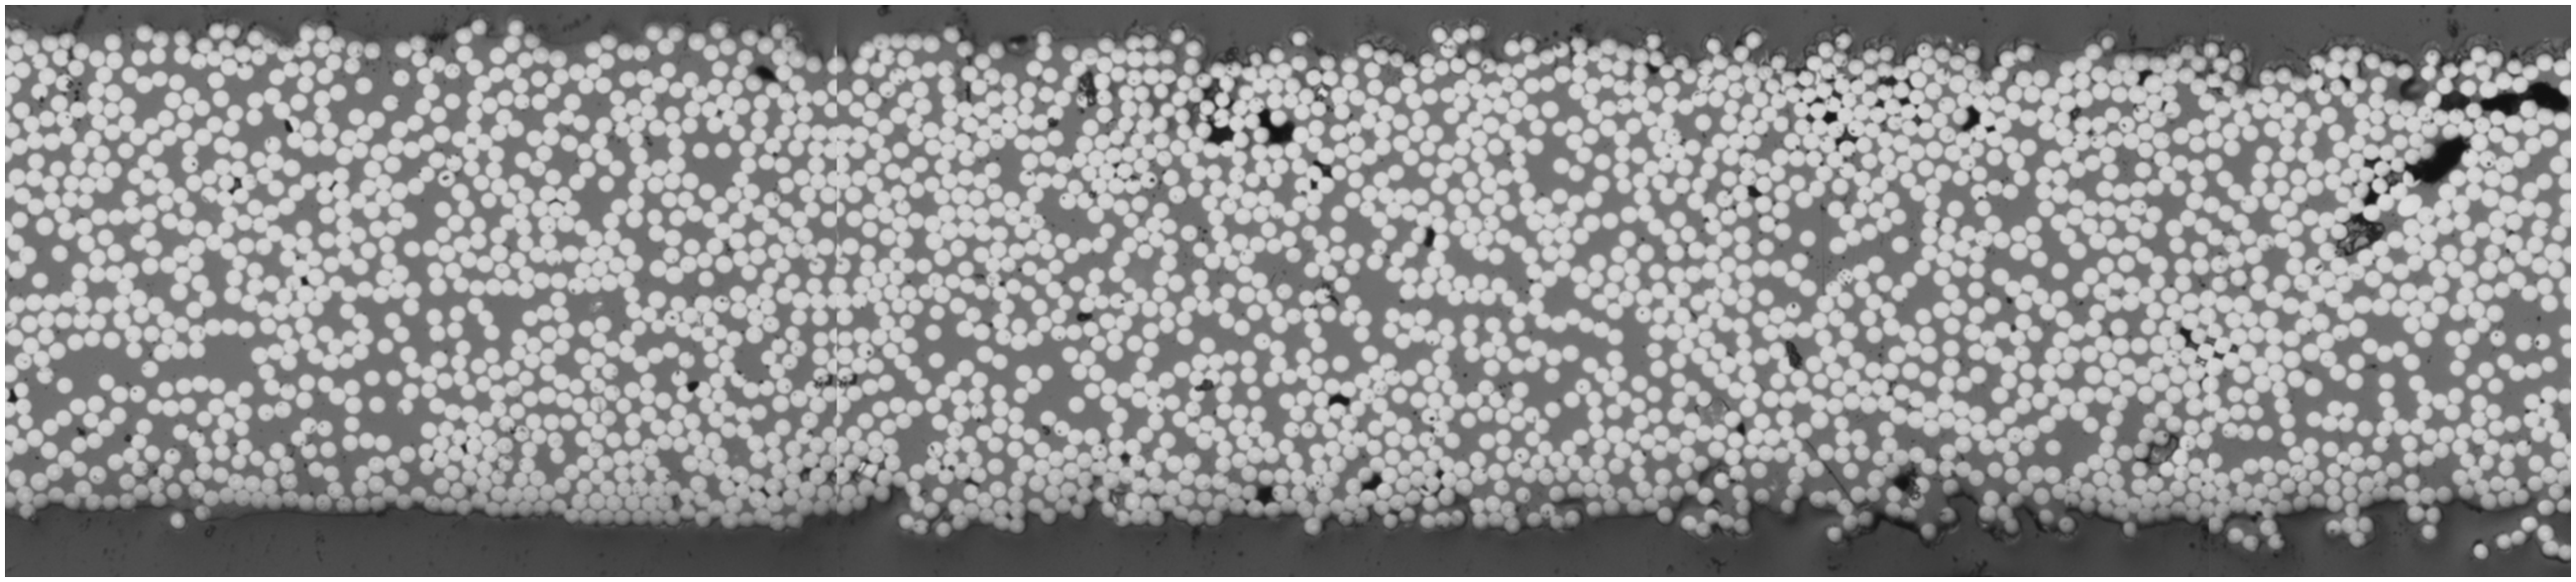
Process monitoring and evaluation of processing temperature
An FLIR A325sc thermal camera with 60 Hz and 320 x 240 pixel resolution was used for process monitoring and measurement of the derived nip-point temperature. The emissivity was determined as 0.98 for the material used with a static test setup in a high-temperature oven. The temperature was evaluated with the ThermaCAM Researcher Pro 2.10 software application.
19
The area defined for evaluation of the temperature in the software was set rectangular at the nip-point. The lay-up head configuration as well as an exemplary evaluation of the nip-point temperature in the software can be seen in Figure 2. Lay-up head configuration (left) and example evaluation of the nip-point temperature in ThermaCAM Researcher Pro 2.10
19
(right).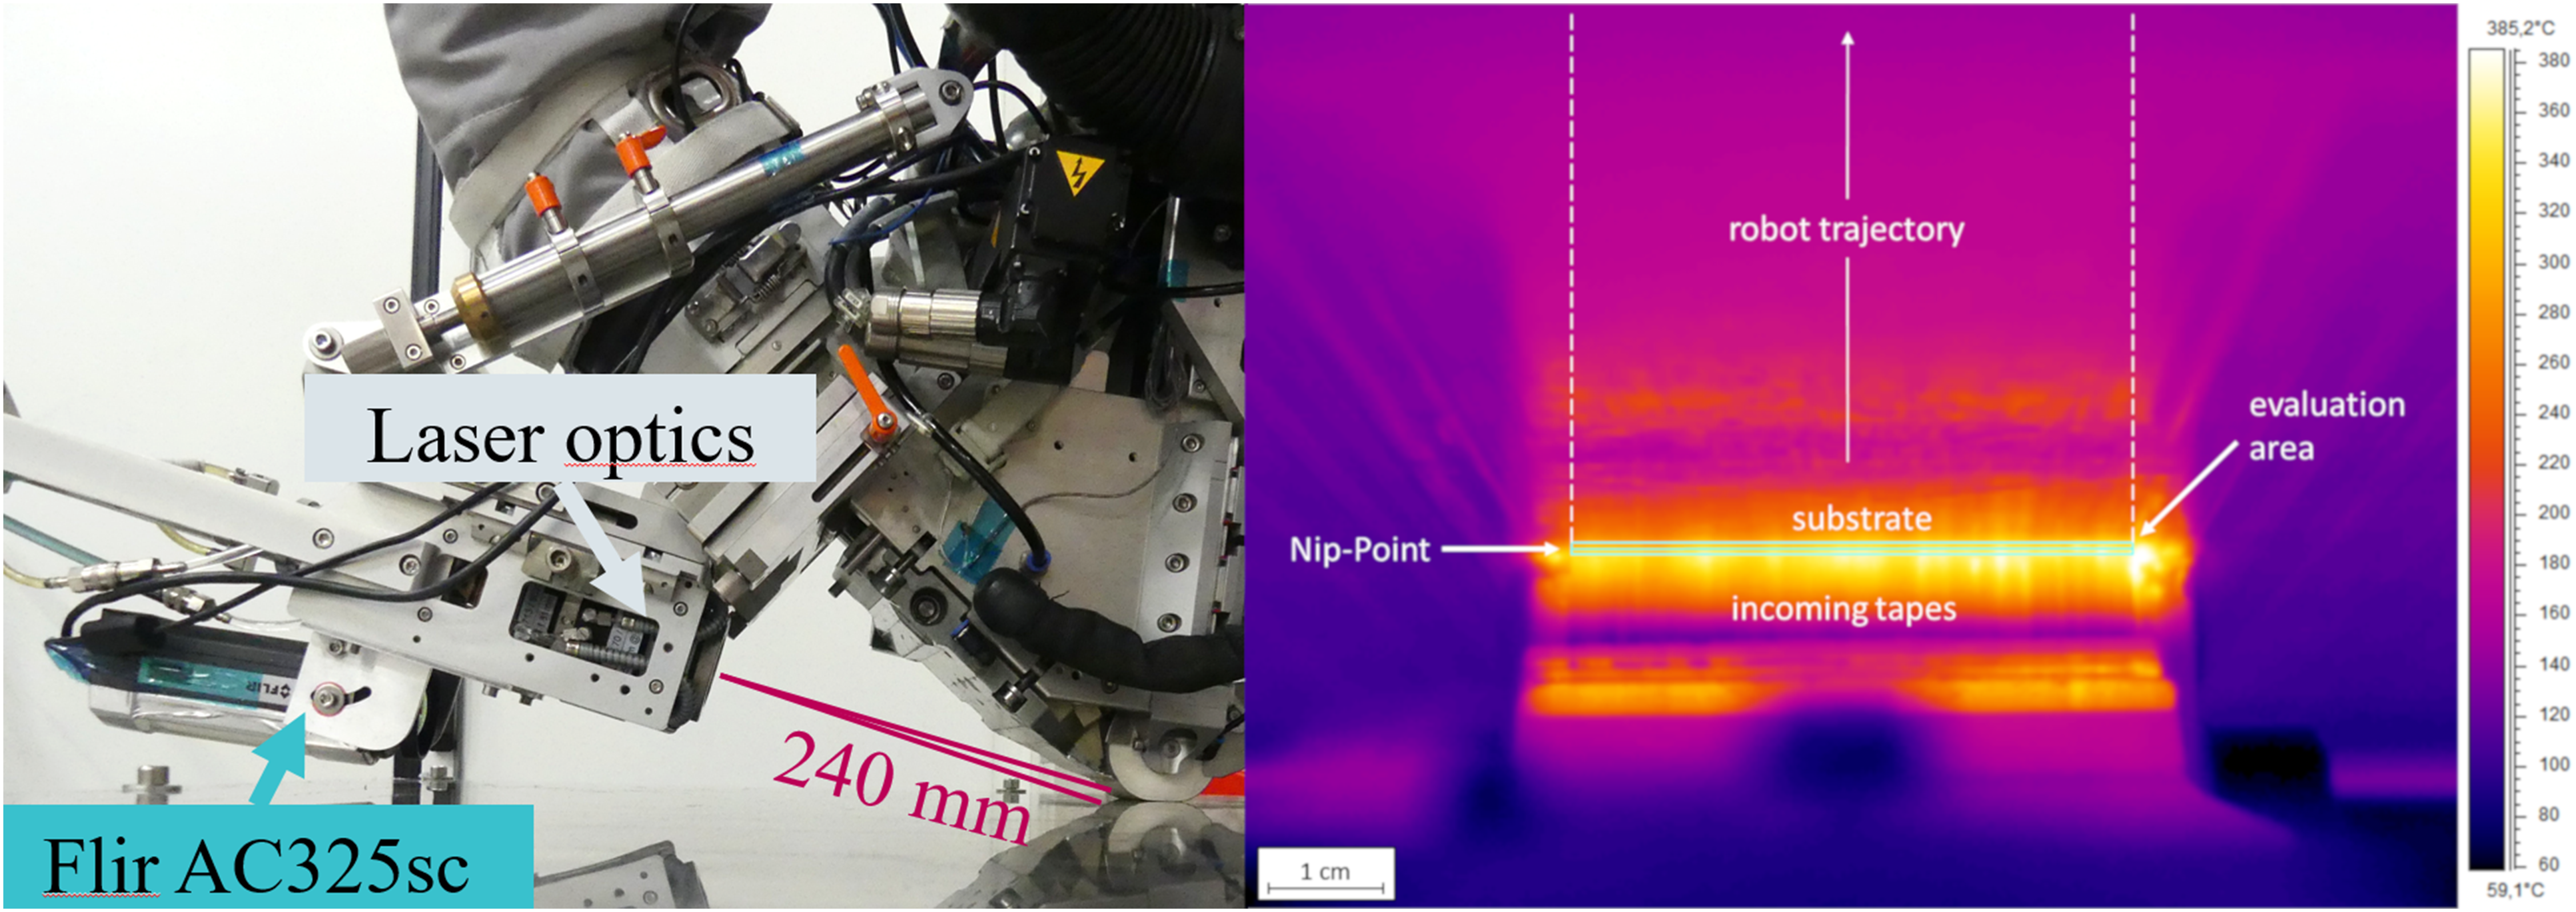
Specimen preparation and design of experiments
Factors of influence investigated with defined factor levels.
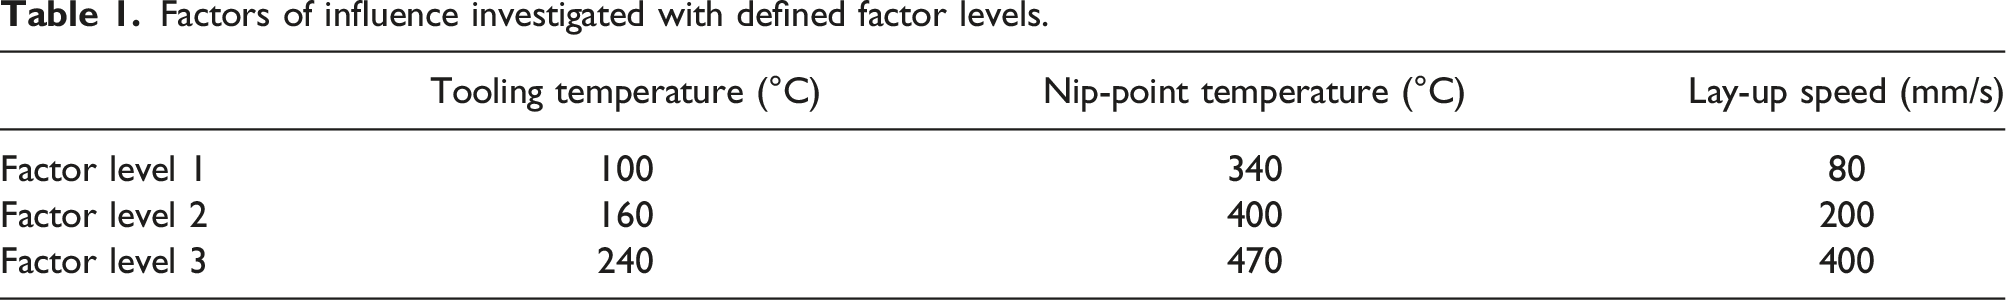
The factor levels for tooling temperature were defined considering the glass transition temperature (Tg) of the thermoplastic matrix, which is 147°C as specified by the supplier. The lowest tooling temperature is almost 40°C below Tg, the medium temperature slightly above Tg and the highest temperature near to crystallisation temperature of 263°C. 20 For the nip-point temperature, the factor levels were defined in accordance with the product data sheet provided by the tape supplier. The supplier recommends the use of a minimal processing temperature of 340°C. 20 A higher nip-point temperature of 470°C was defined for the in situ consolidation in the lay-up process. The lay-up speeds were defined based on existing expertise to cover the range from in situ quality after lay-up to higher lay-up speeds, for which post-consolidation is required to achieve a sufficient consolidation quality.
Coupon plates were manufactured with 10 layers and a stacking pattern of [0/45/90/-45/0]s to obtain a stack thickness of approximately 2 mm. The dimensions of the plates were defined as 470 x 340 mm2. The coupons were subsequently cut into two parts. The first part was directly characterised after the lay-up process. The second part was post-consolidated by stamp forming and characterised afterwards. The same characterisation methods were used for both coupon parts so that a direct comparability was given. A schematic illustration of the defined coupon geometry can be seen in Figure 3. Manufactured coupon plate with schematic visualisation of testing areas and positions for taking individual samples.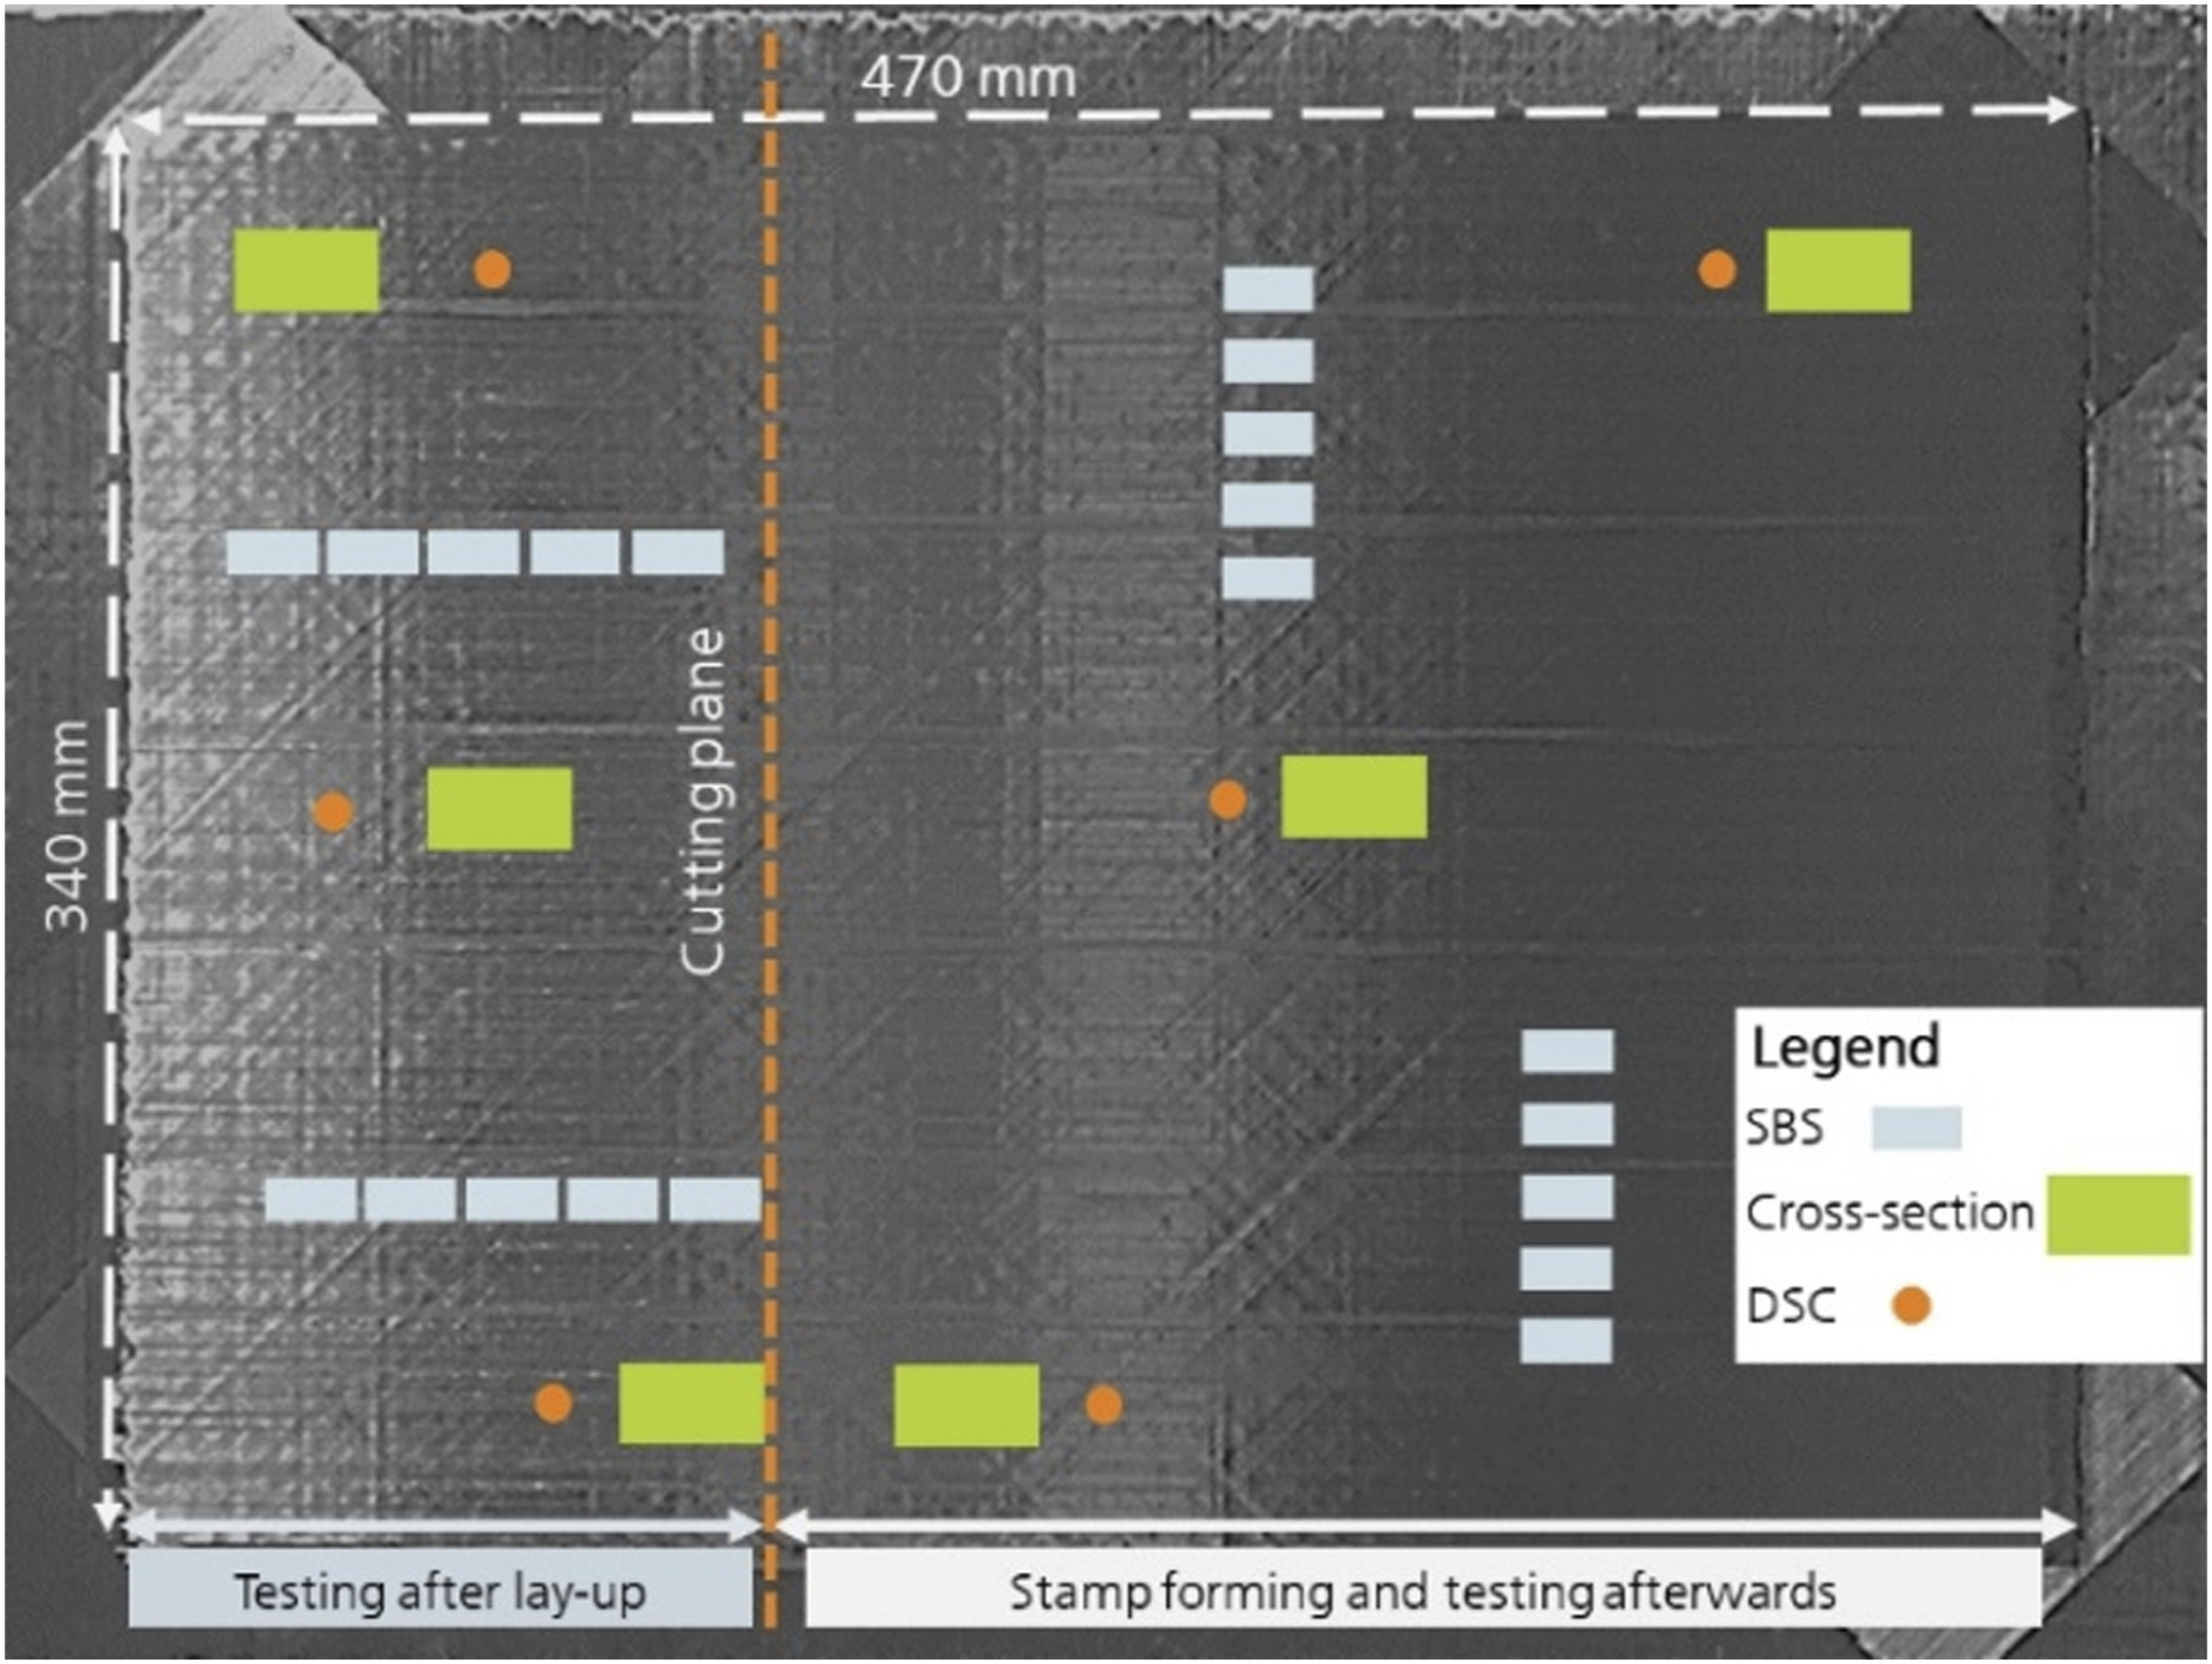
The coupon plates were laid onto a heated aluminium tool covered with polyimide film to ensure a high first-ply adhesion and to optimise the manufacturability of the coupons at low processing temperatures and with high lay-up speeds. The polyimide film is fixed to the tool by vacuum application. For a tooling temperature of 240°C, it was necessary to use polyimide adhesive tape instead of the aforementioned film because no robust vacuum fixation could be achieved for this temperature.
Post-consolidation of preforms
The stamp-forming process route was used for post-consolidation. Consequently, the preforms were fixed in a clamping frame and placed into an infrared heating field. The preform was heated to a temperature of 390°C, which was held for 3 min. After that, the fixed preform was manually transferred into the press via the clamping frame. The tooling had a constant temperature of 220°C. As the transfer was carried out manually, low required transfer time of less than 5 s could not be reached. The press was closed and a pressure of 88 bar was applied. This pressure was held for 3 min. Then, the press was opened and the stamp-formed coupon plate was demoulded without any additional cooling.
In addition, a reference plate was manufactured by press consolidation. The process parameters recommended by the tape supplier were used for this purpose and lightly adapted due to the limitations of the heating press. Consequently, the coupon plate was heated to 360°C at a heating rate of 10°C/min at a pressure of 4 bar. After reaching the consolidation temperature, the temperature and pressure were held for 10 min. Subsequently, the pressure was increased to 10 bar, held for 30 min and then cooled to below 100°C at a cooling rate of 10°C/min. This plate was manufactured to obtain reference values for the degrees of porosity, bonding and crystallinity for best possible consolidation.
Characterisation methods
Degree of porosity
The degree of porosity within the coupon plates was investigated and evaluated by image analysis of cross-sections. For this purpose, samples were taken from three positions on the coupon plate.
It must be considered that the cross-sections represent only a limited area of the plate. The porosity can vary considerably within the plate and within the individual cross-sections. Defined segment areas of the cross-sections were analysed and evaluated to compensate for these fluctuations. Subsequently, the measurements were averaged. The evaluation of the degree of porosity was performed with the ImageJ open-source image processing software application. The segmentation methods of ISO-50% method and various automatically generated threshold values were tested. However, due to the varying expression of the pore peaks in the histogram, the large sample size and the varying porosity values, no uniform segmentation method could be chosen without avoiding any manual corrections based on subjective assessment. The value of the area porosity (A-%) is derived from the measured pore area divided by the sample area. For statistical reasons, a sample area of at least 20 mm2 was evaluated for this purpose according to 1 Kiefel. 21
Degree of bonding
The degree of bonding can be evaluated by different testing methods. It can be qualitatively evaluated by the intimate contact of the plies, peel tests (Mode-I), interlaminar shear strength (Mode-II) or further mechanical tests. 18
Due to its ease of implementation as well as its frequent use in other studies,
22
the short beam strength (SBS) test was used to qualitatively evaluate the degree of bonding by the apparent interlaminar shear strength (ILSS). However, the viscoplastic behaviour of thermoplastics can lead to failure types that are unacceptable according to the DIN EN ISO 14130 standard used.
23
Therefore, the results can only be used as a qualitative indicator for the degree of bonding and compared within the performed trial campaign. Consequently, the results are only presented as ratios to the result of the reference plate ( Examples of mixed failure for the investigated SBS specimen. Top: Specimen with failure due shear and compression with visible plastic deformation. Bottom: Specimen with slightly no plastic deformation.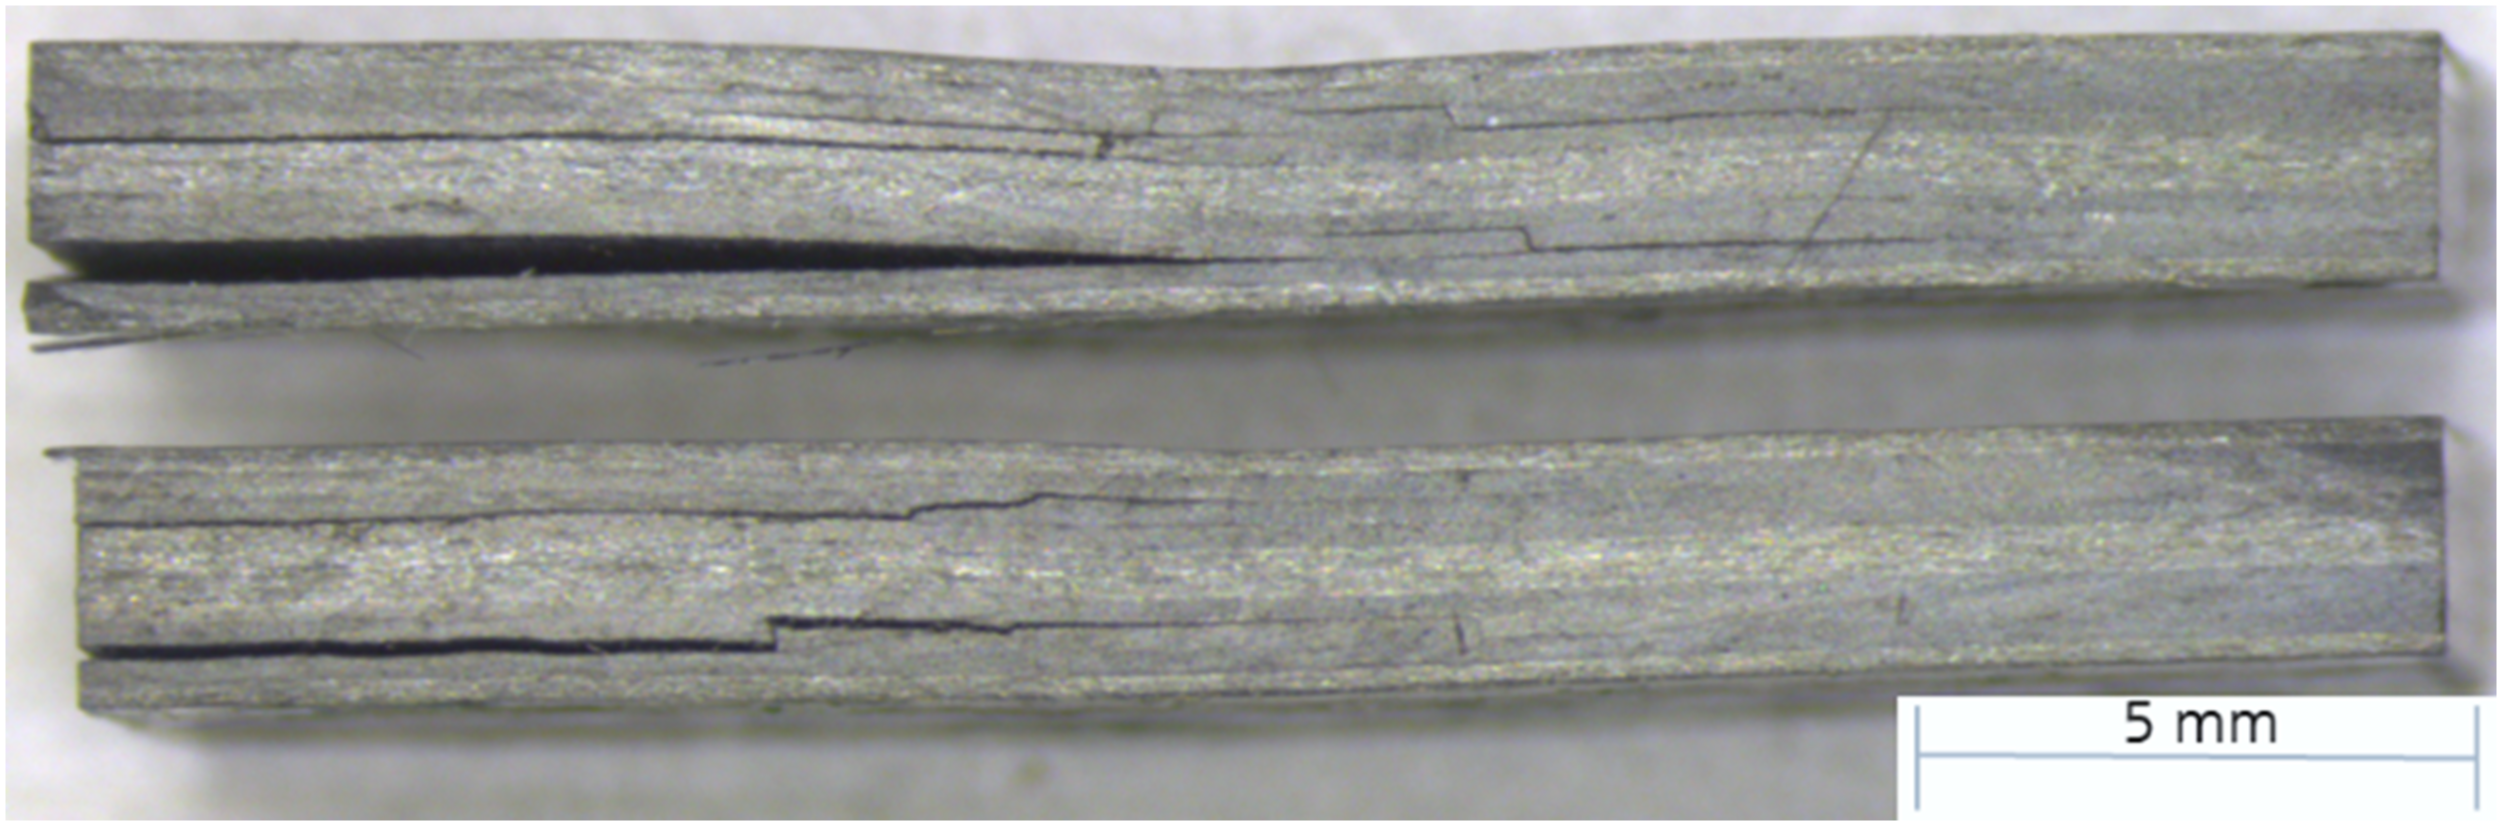
Degree of crystallinity
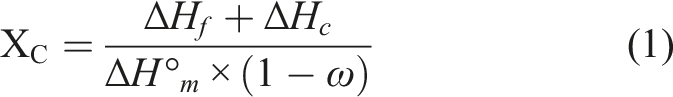
The degree of crystallinity was measured by differential scanning calorimetry (DSC). The measurements were carried out with a DSC 204 F1 Phoenix (NETZSCH-Gerätebau GmbH, Germany). The measurement evaluation was performed with the companyʼs own NETZSCH Proteus® software. The measurement method starts with simultaneously heating the DSC sample and the reference to a temperature of 340°C at a heating rate of 10°C/min. This temperature was held isothermally for 5 minutes. Subsequently, the DSC sample and reference were cooled at a rate of 10°C/min. Nitrogen was used as shielding gas. Using the heat flux difference curves recorded, the degree of crystallinity was calculated using the following formula:
24
Statistical analysis and the analysis of variance
The Visual-XSel 16.0 software application (CRGraph GbR, Germany) was used for the statistical analysis and variance analysis. A significance level of 5% was chosen to build the models for predicting consolidation quality. A separate model was built for each consolidation evaluation criterion. In addition, the following regression assumptions were tested to ensure the validity of the model: • Check for critical outliers. • Homoscedasticity. • Normal distribution and independence of residuals. • Multicollinearity.
The check for critical outliers was automatically performed by Visual-XSel. For homoscedasticity, the residuals were checked in a scatter plot in which the model values and the residuals were standardised and centred with the respective mean and standard deviation. The normal distribution and independency of the residuals are assumed to be because the manufacturing of the coupon plates, sampling and characterisation were carried out independently, and the order of the individual measured values has no effect on the model results. Furthermore, no multi-stage measurement methods were used. Multicollinearity occurs when at least two independent variables have a strong correlation and can be evaluated by a variance inflation factor (VIF). High multicollinearity reduces the accuracy of the coefficients. 25
Results and discussion
Nip-point temperature
Results of nip-point temperature evaluation (left).
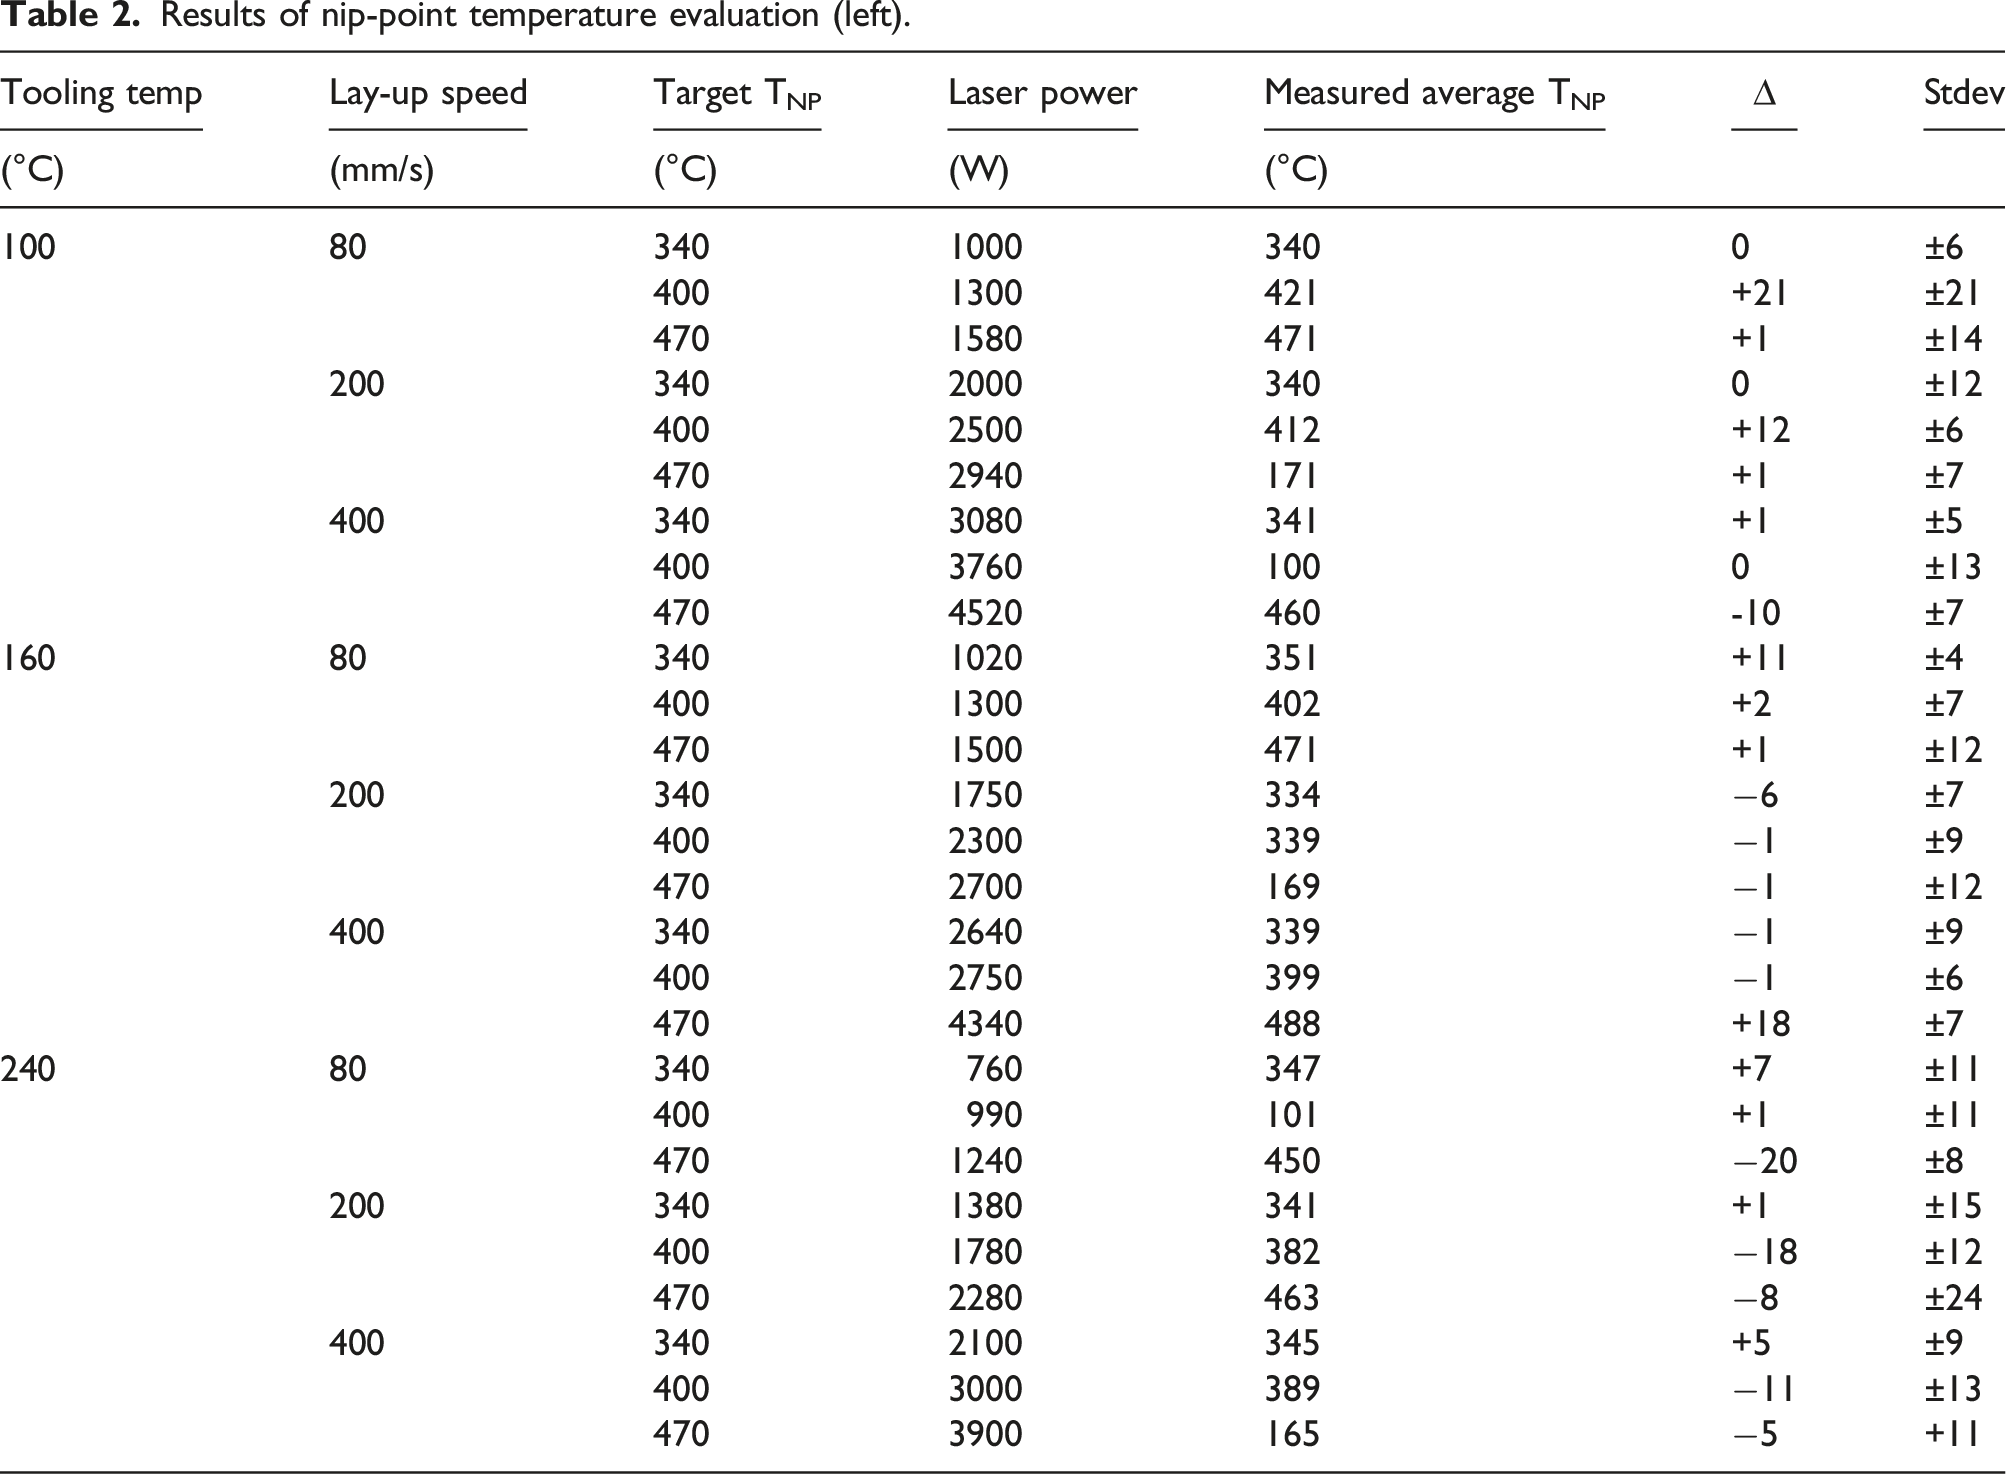
In summary, partially high deltas of up to 21°C could be seen. Furthermore, the standard deviations for over half of the coupon plates were above ±10°C. These deviations need to be considered in terms of the characterisation analysis. The possible reasons for the significant deviations are manifold. The tape quality and – especially – unimpregnated areas can lead to a significant increase in temperature. In Figure 5, the evaluation of the nip-point temperature in one tape trajectory for the individual tows is shown. Strong variations between the single tows can be seen with maximum temperatures above 540°C. These variations are assumed to be due to varying tape quality because only tow 6 shows a strongly increased temperature, and unimpregnated areas in the lay-up were seen afterwards. The TNP measured for the individual parameter combinations was used for the regression models. Evaluation of nip-point temperature in one robot trajectory. Right top picture: Evaluated average nip-point temperature compared to the temperature of tows 1 and 6. Right bottom picture: Evaluation of the nip-point temperature of the individual tows in ThermaCAM Researcher Pro 2.10 software application. Light blue rectangles show the defined evaluation areas.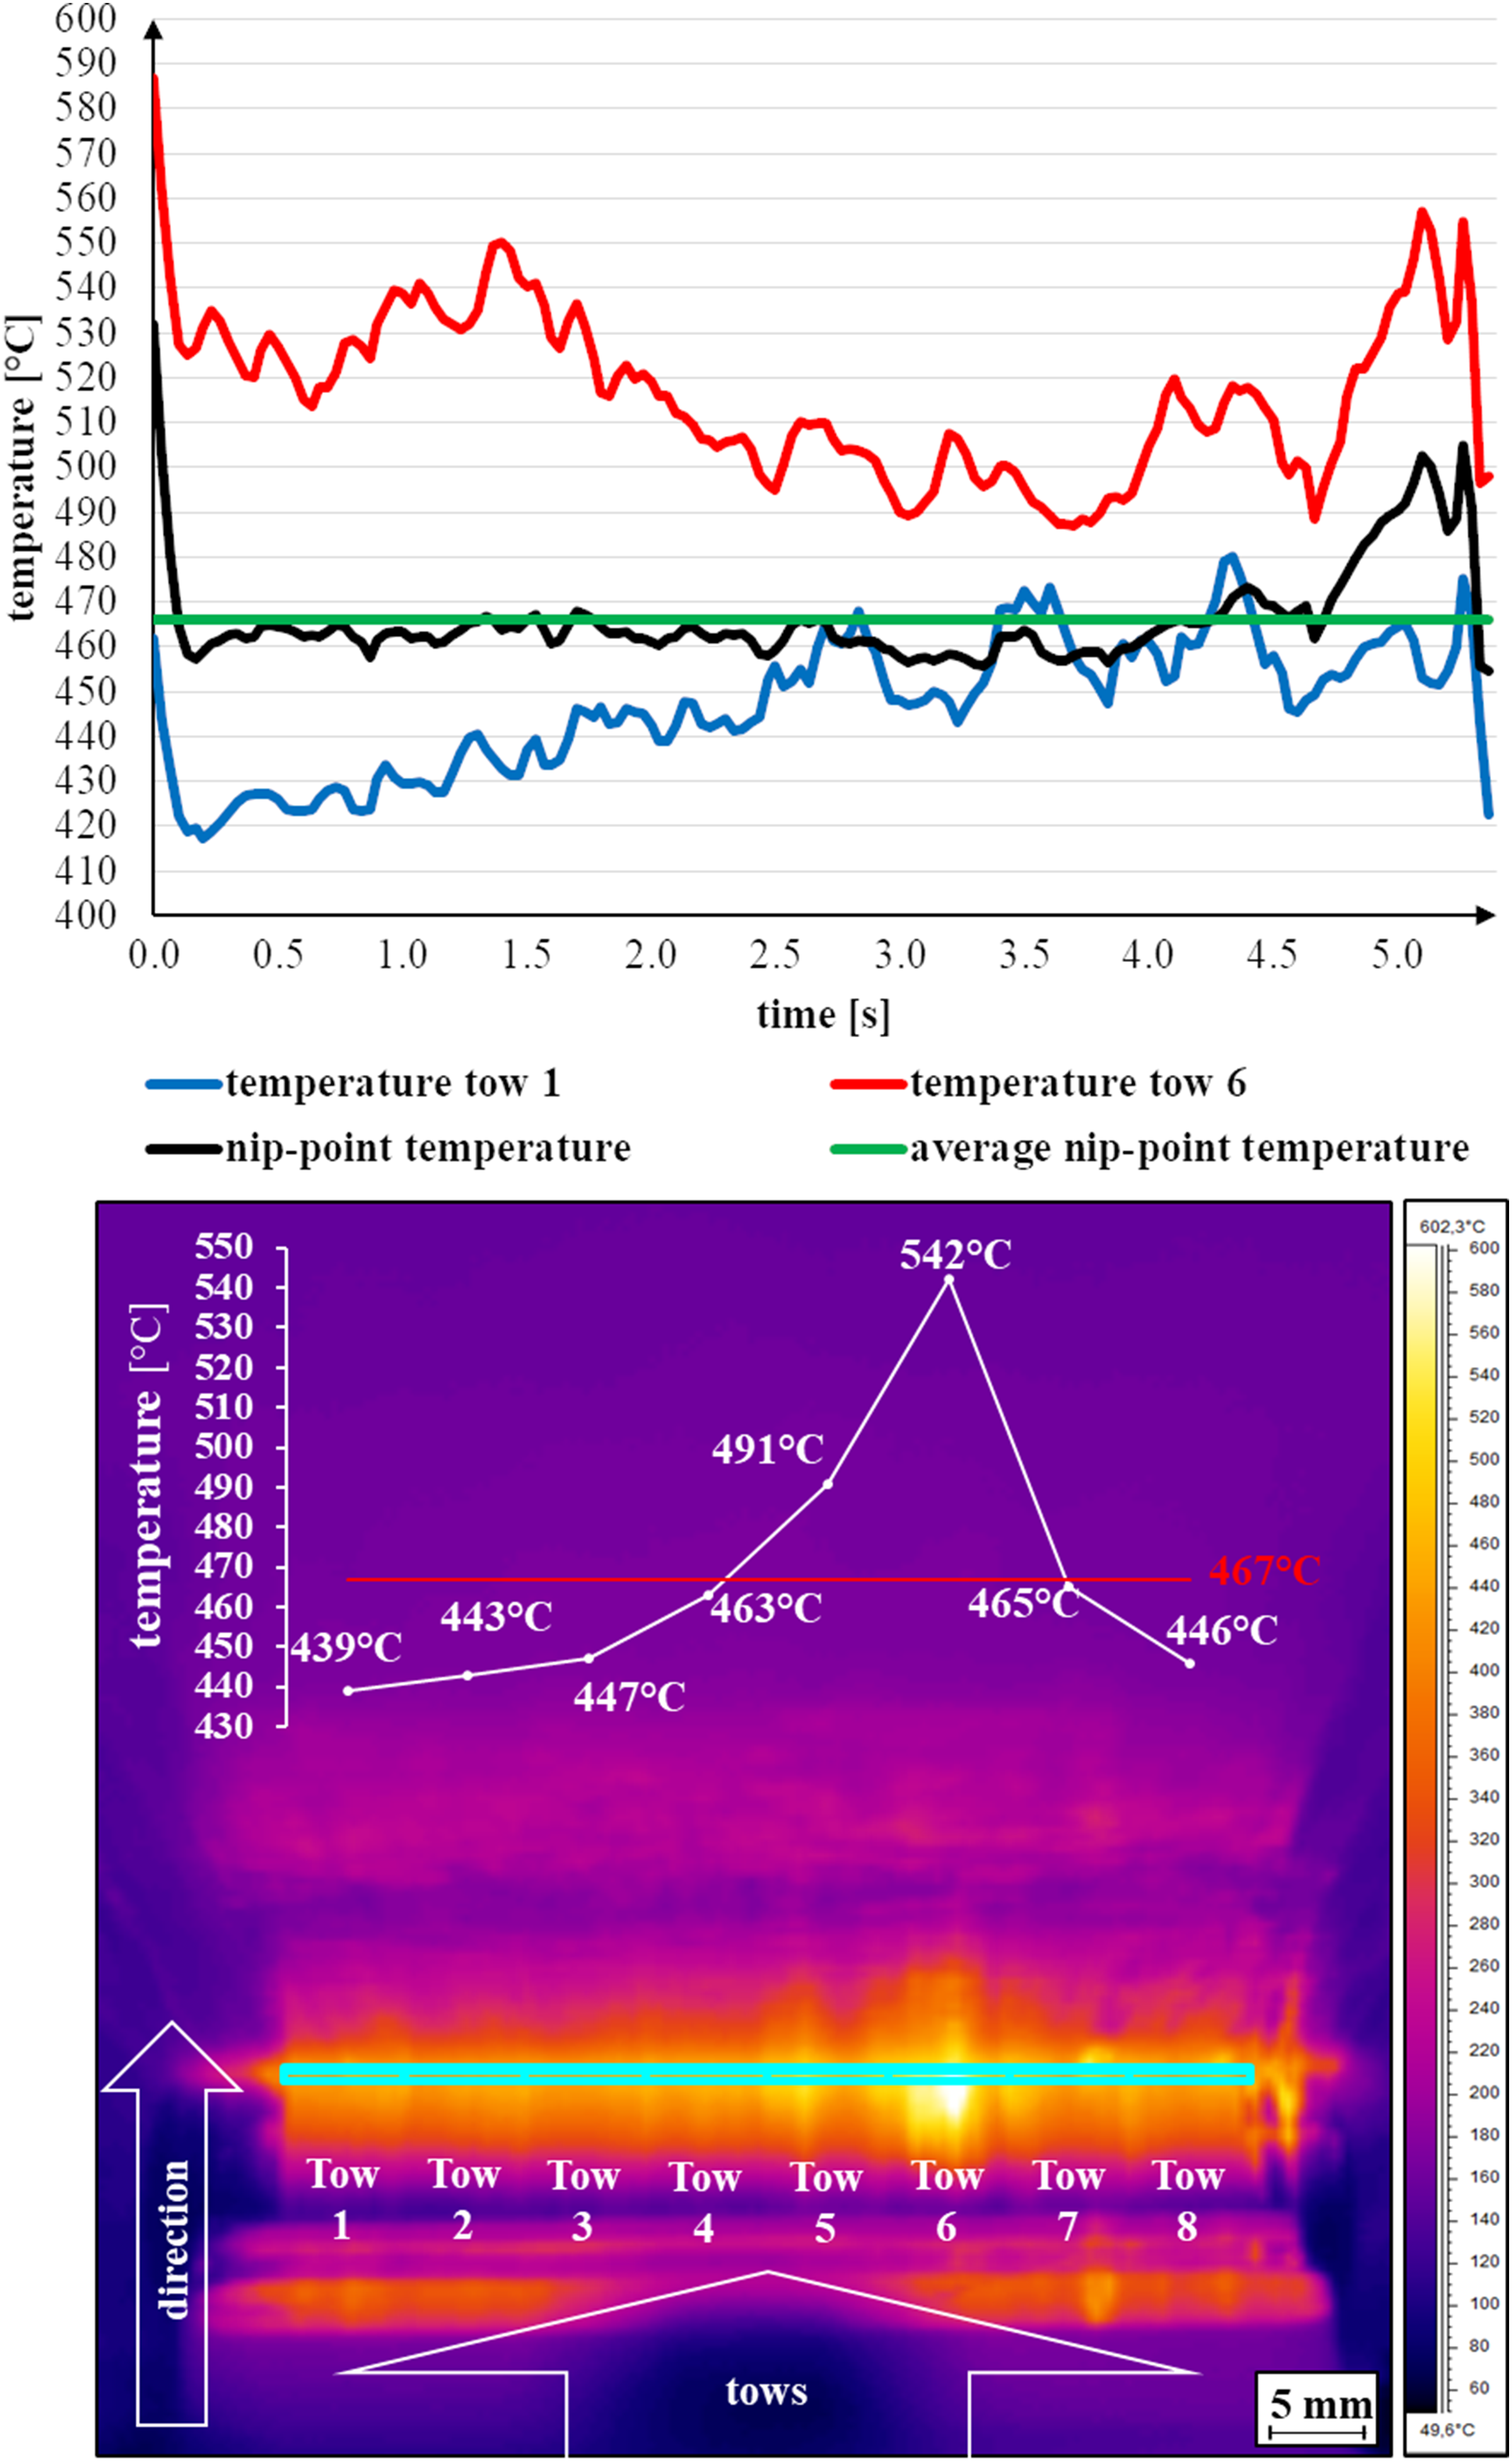
Consolidation quality after the placement process
Degree of porosity
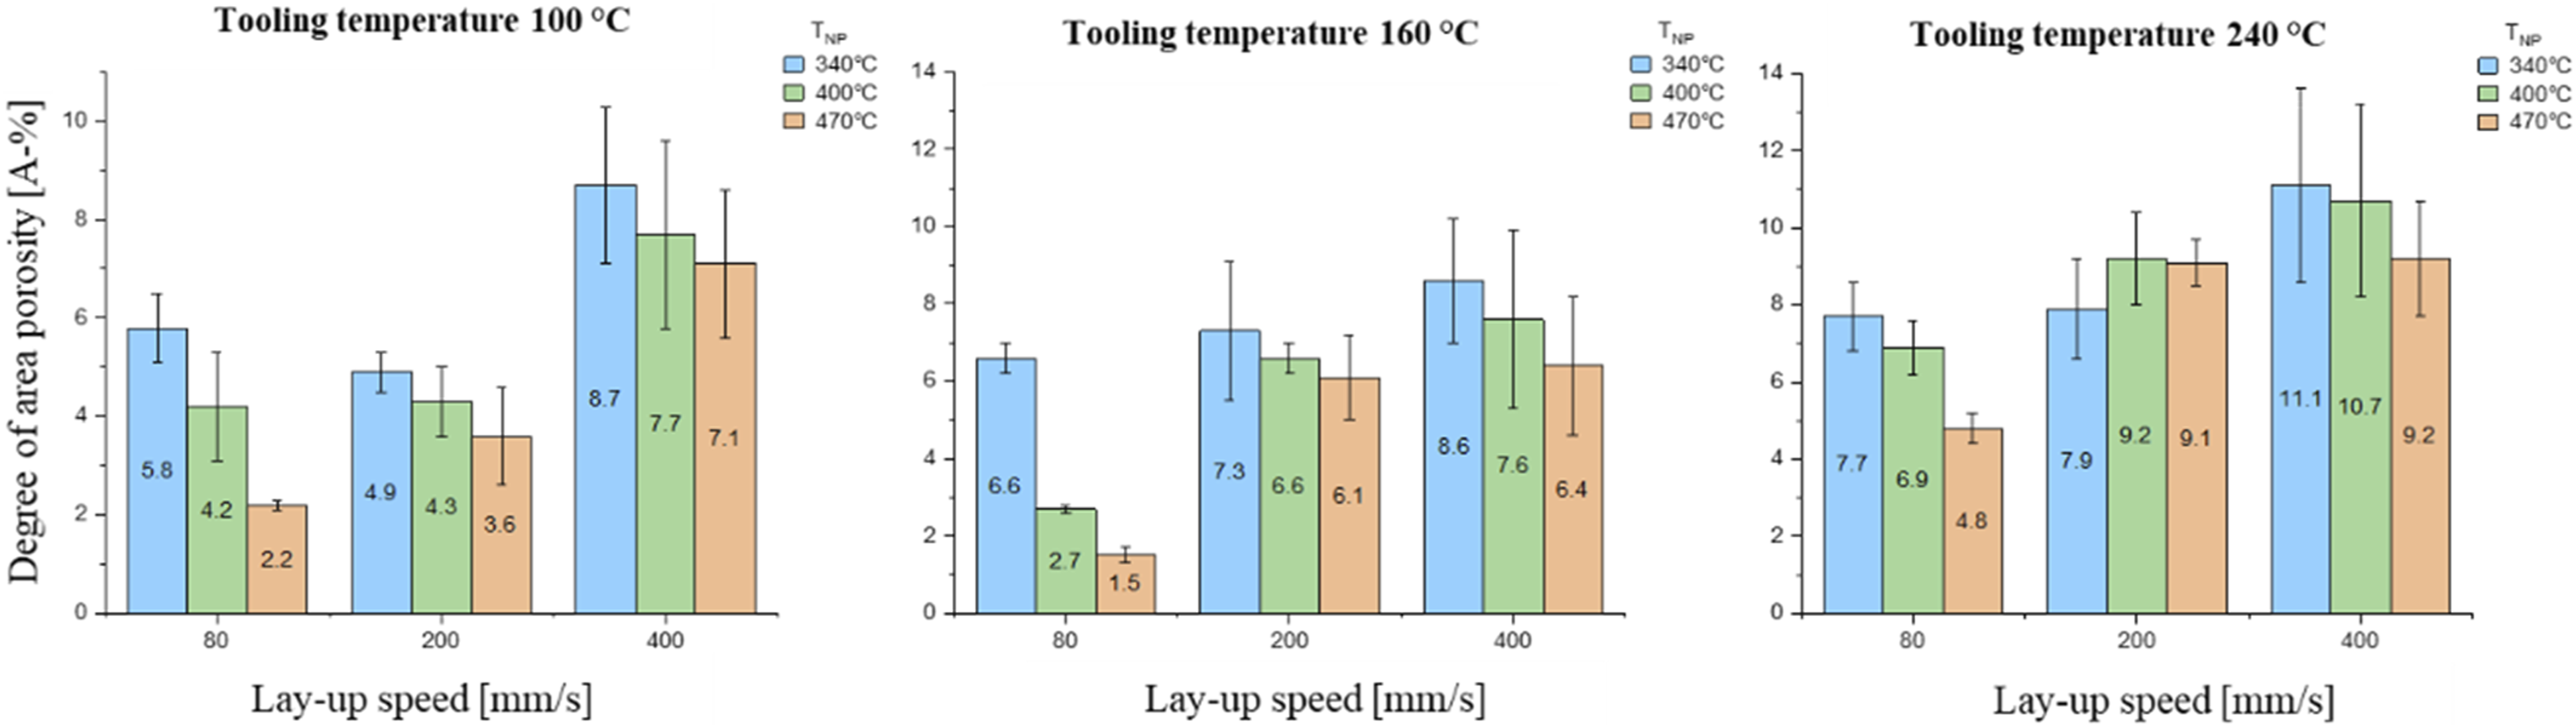
The cross-sections of the coupon plates manufactured can be seen in Figure 6. The cross-sections shown are representative of the corresponding parameter combination and correlate to the evaluated degree of porosity in Figure 7. Cross-sections of the manufactured coupon plates for tooling temperatures of 100 °C (top left), 160 °C (top right) and 240 °C (bottom). Results of the degree of area porosity evaluated for the different parameter combinations after lay-up.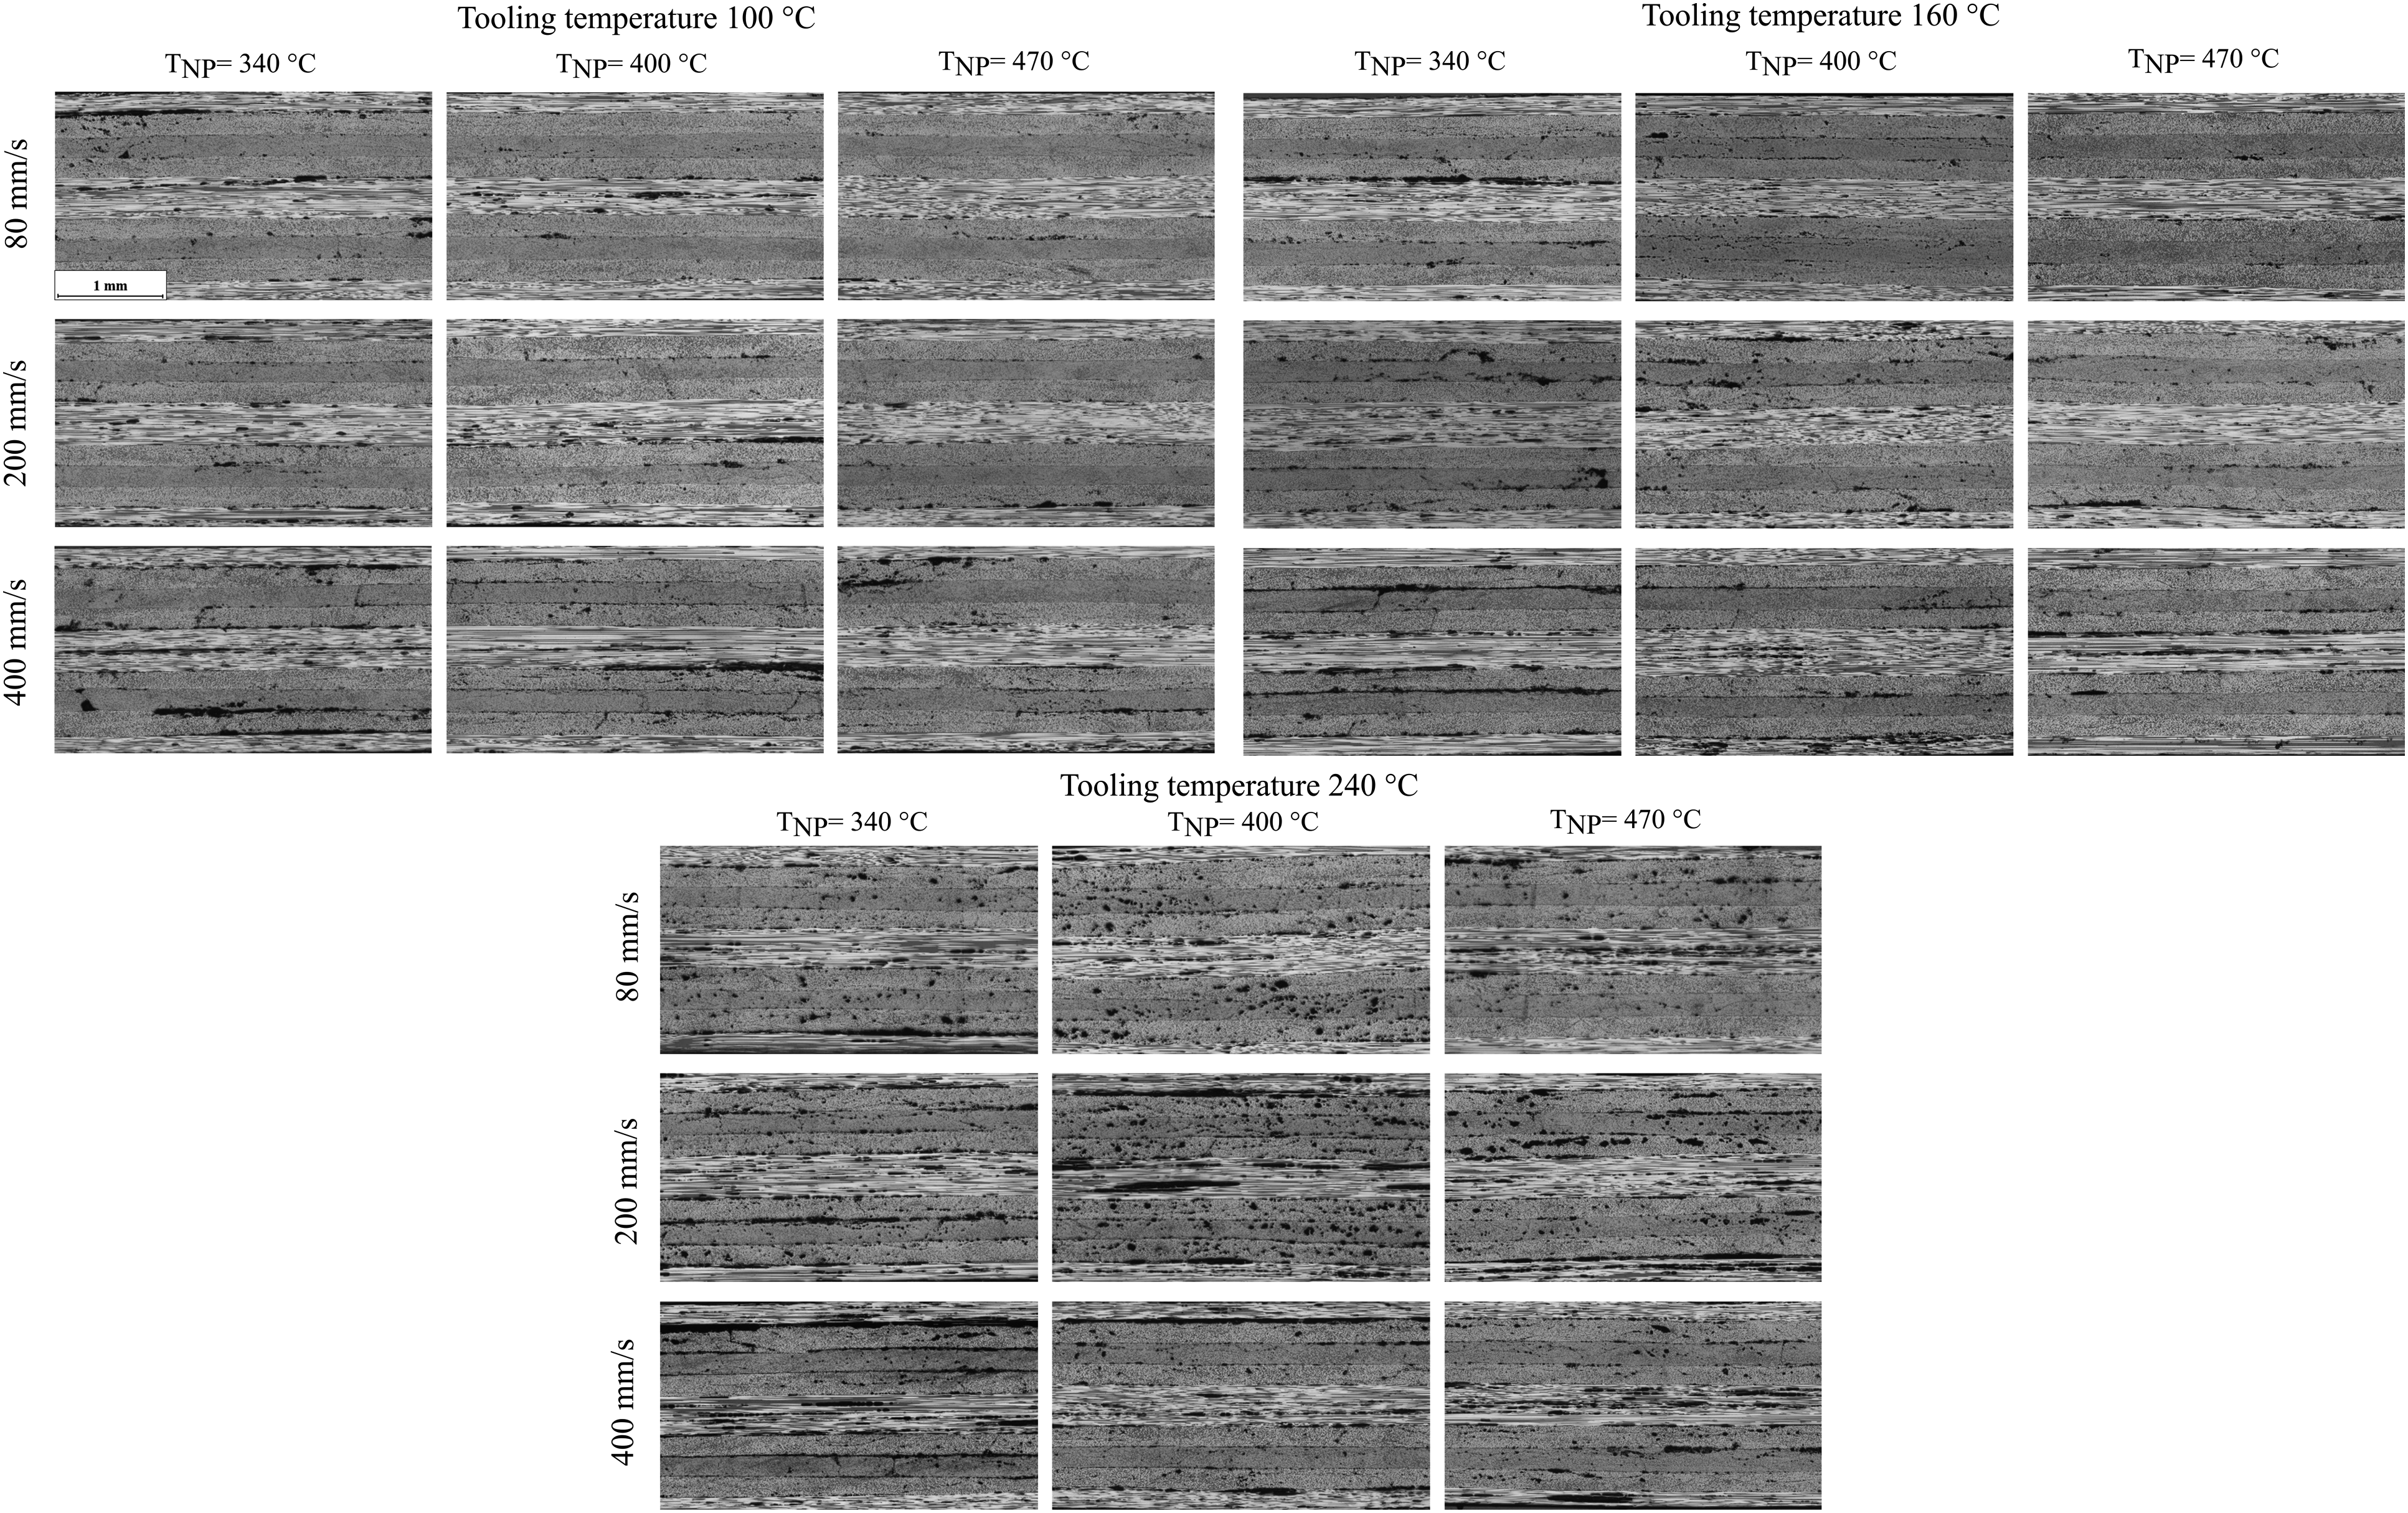
Strong fluctuations in the inner quality within and between the three cross-sections of each coupon plate were seen. Furthermore, areas with defects like gaps or overlaps were neglected as defect-induced pores were noticed.
With lay-up speeds of 400 mm/s, a significant higher degree of porosity can be seen than with lay-up speeds of 80 mm/s. The lowest degrees of porosity can be reached with lay-up speeds of 80 mm/s and a nip-point temperature of 470°C.
For tooling temperatures of 100°C and 160°C, no significant variations in the degree of porosity can be noticed, whereas the degree of porosity increases strongly with a tooling temperature of 240°C. The reason for this correlation cannot be clearly stated. However, it is assumed that pores can expand again more strongly after pressure being removed at such high temperatures due to the too low viscosity of the material. An increase in void content with higher tooling temperatures was also found by Khan et al. 26
As described in Chapter 2.6.1, a quantitative evaluation of the degree of porosity was performed by image analysis. The results can be seen in Figure 7.
Due to the high standard deviations of up to 37% and the strong differences between the standard deviations of individual plates, interpretation of the results is limited. An increase in porosity can be predominantly seen for increasing lay-up speeds consistent with the qualitative observation of the cross-sections. Furthermore, higher degrees of porosity for a tooling temperature of 240°C are also seen in the quantitative results. The reason for the high standard deviations can be attributed to temperature fluctuations, strong fluctuations of inner quality within the individual plates and the evaluation methodology. There is a specific variation in the results due to the individual determination of the threshold.
Degree of bonding
The relativised results from the short beam test are shown in Figure 8. Regardless of the tooling temperature, a decrease in strength at higher lay-up speeds is shown. For higher nip-point temperatures, the degree of bonding and, consequently, the apparent interlaminar shear strength increase instead. An increase in the consolidation quality is also seen when the surface temperature is increased from 100°C to 160°C. The average apparent interlaminar shear strength is increased at low nip-point temperatures and lay-up speeds of 80 mm/s and 200 mm/s in particular. The highest result was obtained for a tooling temperature of 160°C, a lay-up speed of 80 mm/s and a nip-point temperature of 470°C. A decrease in the results is seen with a further increase in the tooling temperature to 240°C for most of the parameter combinations. This could be correlated to the higher degree of porosity for this tooling temperature. Interlaminar pores and delamination have a powerful effect on the apparent interlaminar shear strength.
27
The standard deviations are within an acceptable range of up to 10% for most parameter combinations. Higher standard deviations of up to 25% are observed with lay-up speeds of 400 mm/s and nip-point temperatures of 340°C. Furthermore, a high standard deviation of nearly 17% was observed with the parameter combination of a tooling temperature of 240°C, a lay-up speed of 200 mm/s and a nip-point temperature of 470°C. This could be correlated to the large standard deviation of the nip-point temperature of ± 24°C. Degrees of relativised, apparent interlaminar shear strength evaluated for the different parameter combinations after lay-up.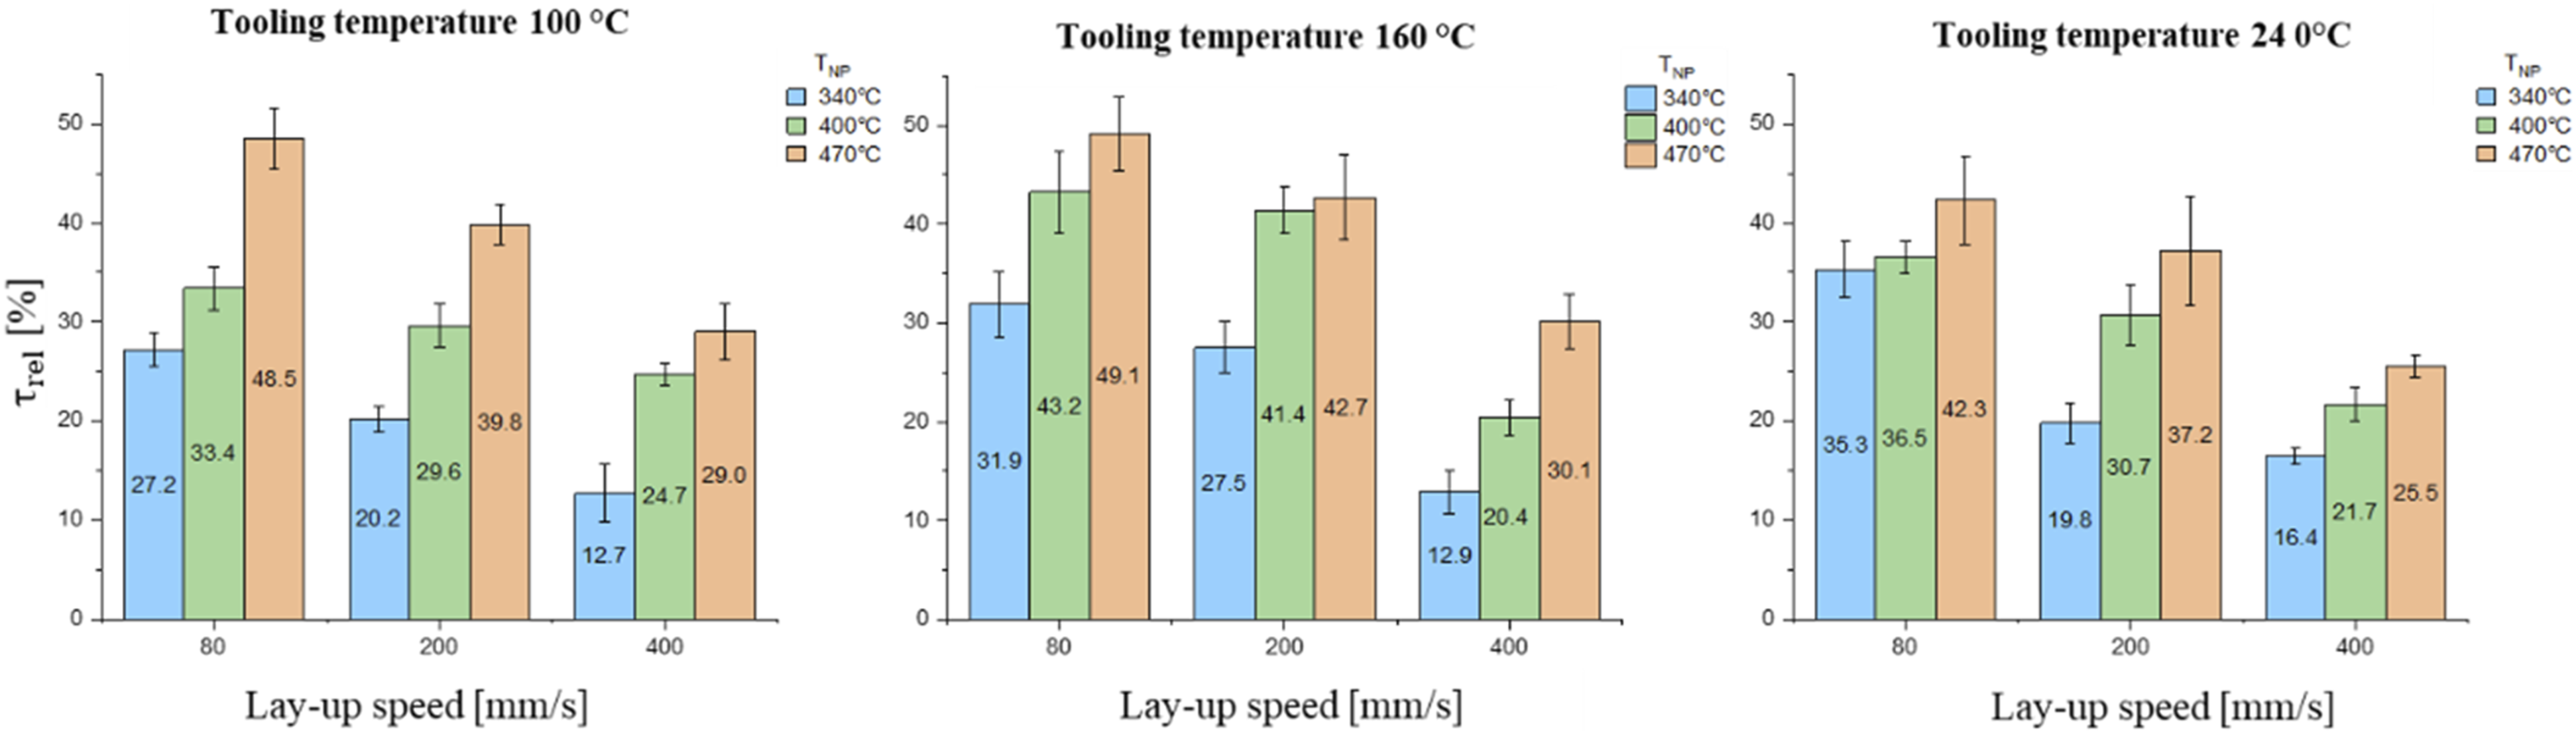
Degree of crystallinity
The degrees of crystallinity measured are shown in Figure 9. Degrees of crystallinity between 6.6% and 7.6% are reached in the mean with a tooling temperature of 100°C. Furthermore, no significant correlation could be seen for differing nip-point temperatures at the same lay-up speeds. Similarly, the crystallinity reduction achieved by increasing the lay-up speed is not significant. Significant higher degrees of crystallinity can be reached with a tooling surface temperature of 160°C. Moreover, a statistically significant decrease in crystallinity is seen when increasing the lay-up speed for nip-point temperatures of 340°C and 400°C. This correlation is no longer significant with nip-point temperature of 470°C. The highest average degree of crystallinity of 20% for this tooling temperature was reached with a lay-up speed of 80 mm/s and a nip-point temperature of 470°C. The highest average degrees of crystallinity were observed with a tooling temperature of 240°C. The reason for this could be that the tooling temperature is close to the crystal melting temperature, and constant post-crystallisation can take place during the lay-up process. The degrees of crystallinity are all above 25%, regardless of the lay-up speed and the nip-point temperature. Results of degree of crystallinity evaluated for the different parameter combinations after lay-up.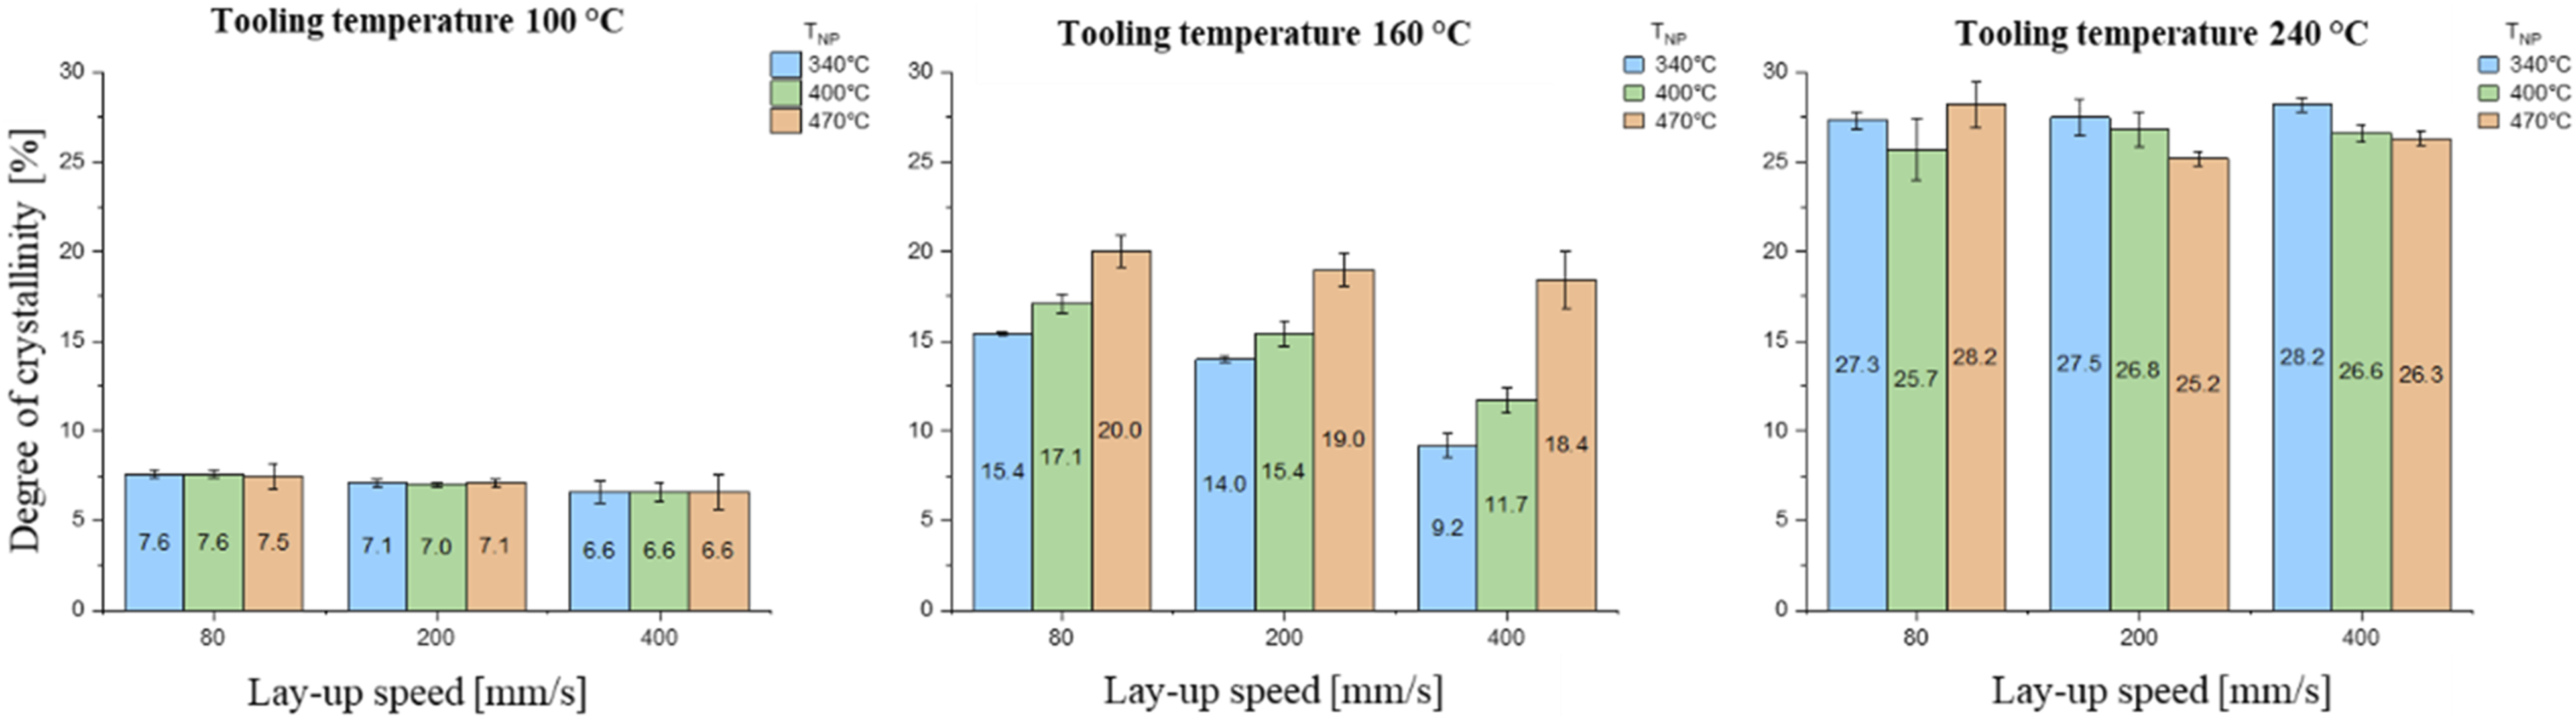
Statistical correlations between process parameters and consolidation quality
In the following sub-chapter, the results of the analysis of variance are shown and the correlations between process parameters and consolidation quality evaluation criteria are discussed in detail. For the regression analysis, the boundary conditions are discussed and the coefficient of determination R2, the adjusted coefficient of determination R2adj, the predictive measure Q2 and the repeatability W2 of the model are presented. These measures were calculated by Visual-XSel software application. A detailed presentation of the regression assumptions is omitted due to the scope.
Degree of porosity
A quadratic model was chosen for the regression analysis of the degree of porosity. In the Box-Cox transformation, the dependent variables are transformed in the form of a square root. Approx. 31% of the variance remains unexplained with an R2 of 69%. The R2adj is nearly identical to 67%, so that the regression model only describes the correlations to a limited extent. As the predictive measure Q2 is 59%, the model is unstable and will change significantly due to new measurement results. The high deviations of degree of porosity within and between the cross-sections investigated are the reason for the low quality of the model. This leads to high standard deviations and no model being able to predict the evaluation criterion. Therefore, the results of the model cannot be used independently for further discussions and must be considered in conjunction with the results from Chapter 3.2.
Effect of tooling temperature
The model describes growth in area porosity with increasing tooling surface temperature. However, this relationship is not uniformly correct. For tooling temperatures significantly below the crystallite melting temperature, no correlation to the area porosity can be observed, as shown in Chapter 3.2. However, a significant increase in area porosity is seen above a defined tooling temperature. It is assumed that for excessive tooling temperatures, the pores may expand again after the consolidation phase due to the material having a too low viscosity.
Effect of lay-up speed
To summarise, an increase in lay-up speed results in a rise in area porosity. The results of the regression also show this. The reasons for this lie in the duration of the consolidation phase and the heating times. With increasing lay-up speed, the duration of the consolidation phase and of heating the material decreases. 28 Insufficient melting of the material can result in an excessive matrix viscosity and suppress pore compaction. 12 Furthermore, less time is available to compensate for surface irregularities and to develop intimate contact. 10 If intimate contact is not formed sufficiently, gaps between the layers and interlaminar pores may occur.
Effect of nip-point temperature
The results of the regression model and Chapter 3.2 describe a reduced degree of porosity by increasing nip-point temperature. It is assumed that for higher nip-point temperatures, the viscosity of the material is reduced and the development of intimate contact promoted.
Degree of bonding
A quadratic model was also chosen for the regression analysis of the degree of bonding. In the Box-Cox transformation, the dependent variables are transformed in the form of a square root. With an R2 of 86%, about 14% of the variance remains unexplained. The rounded R2adj is identical to 86%, so the regression model only partially describes the correlations. As the predictive measure Q2 is 84%, the model is stable and will not change significantly due to new measurement results. Furthermore, Visual-XSel states that with a repeatability of 91%, the measurement error is high but not critical for the same parameter combinations. This can also be correlated to the seen standard deviations in Chapter 3.2 of mainly up to 10%.
Figure 10 shows the evaluated correlations between process parameters and relative apparent interlaminar shear strength. Again, the lay-up speed and the nip-point temperature are the significant factors that influence the degree of bonding and the resulting apparent interlaminar shear strength. Evaluated correlations between process parameters and relative apparent interlaminar shear strength
32
.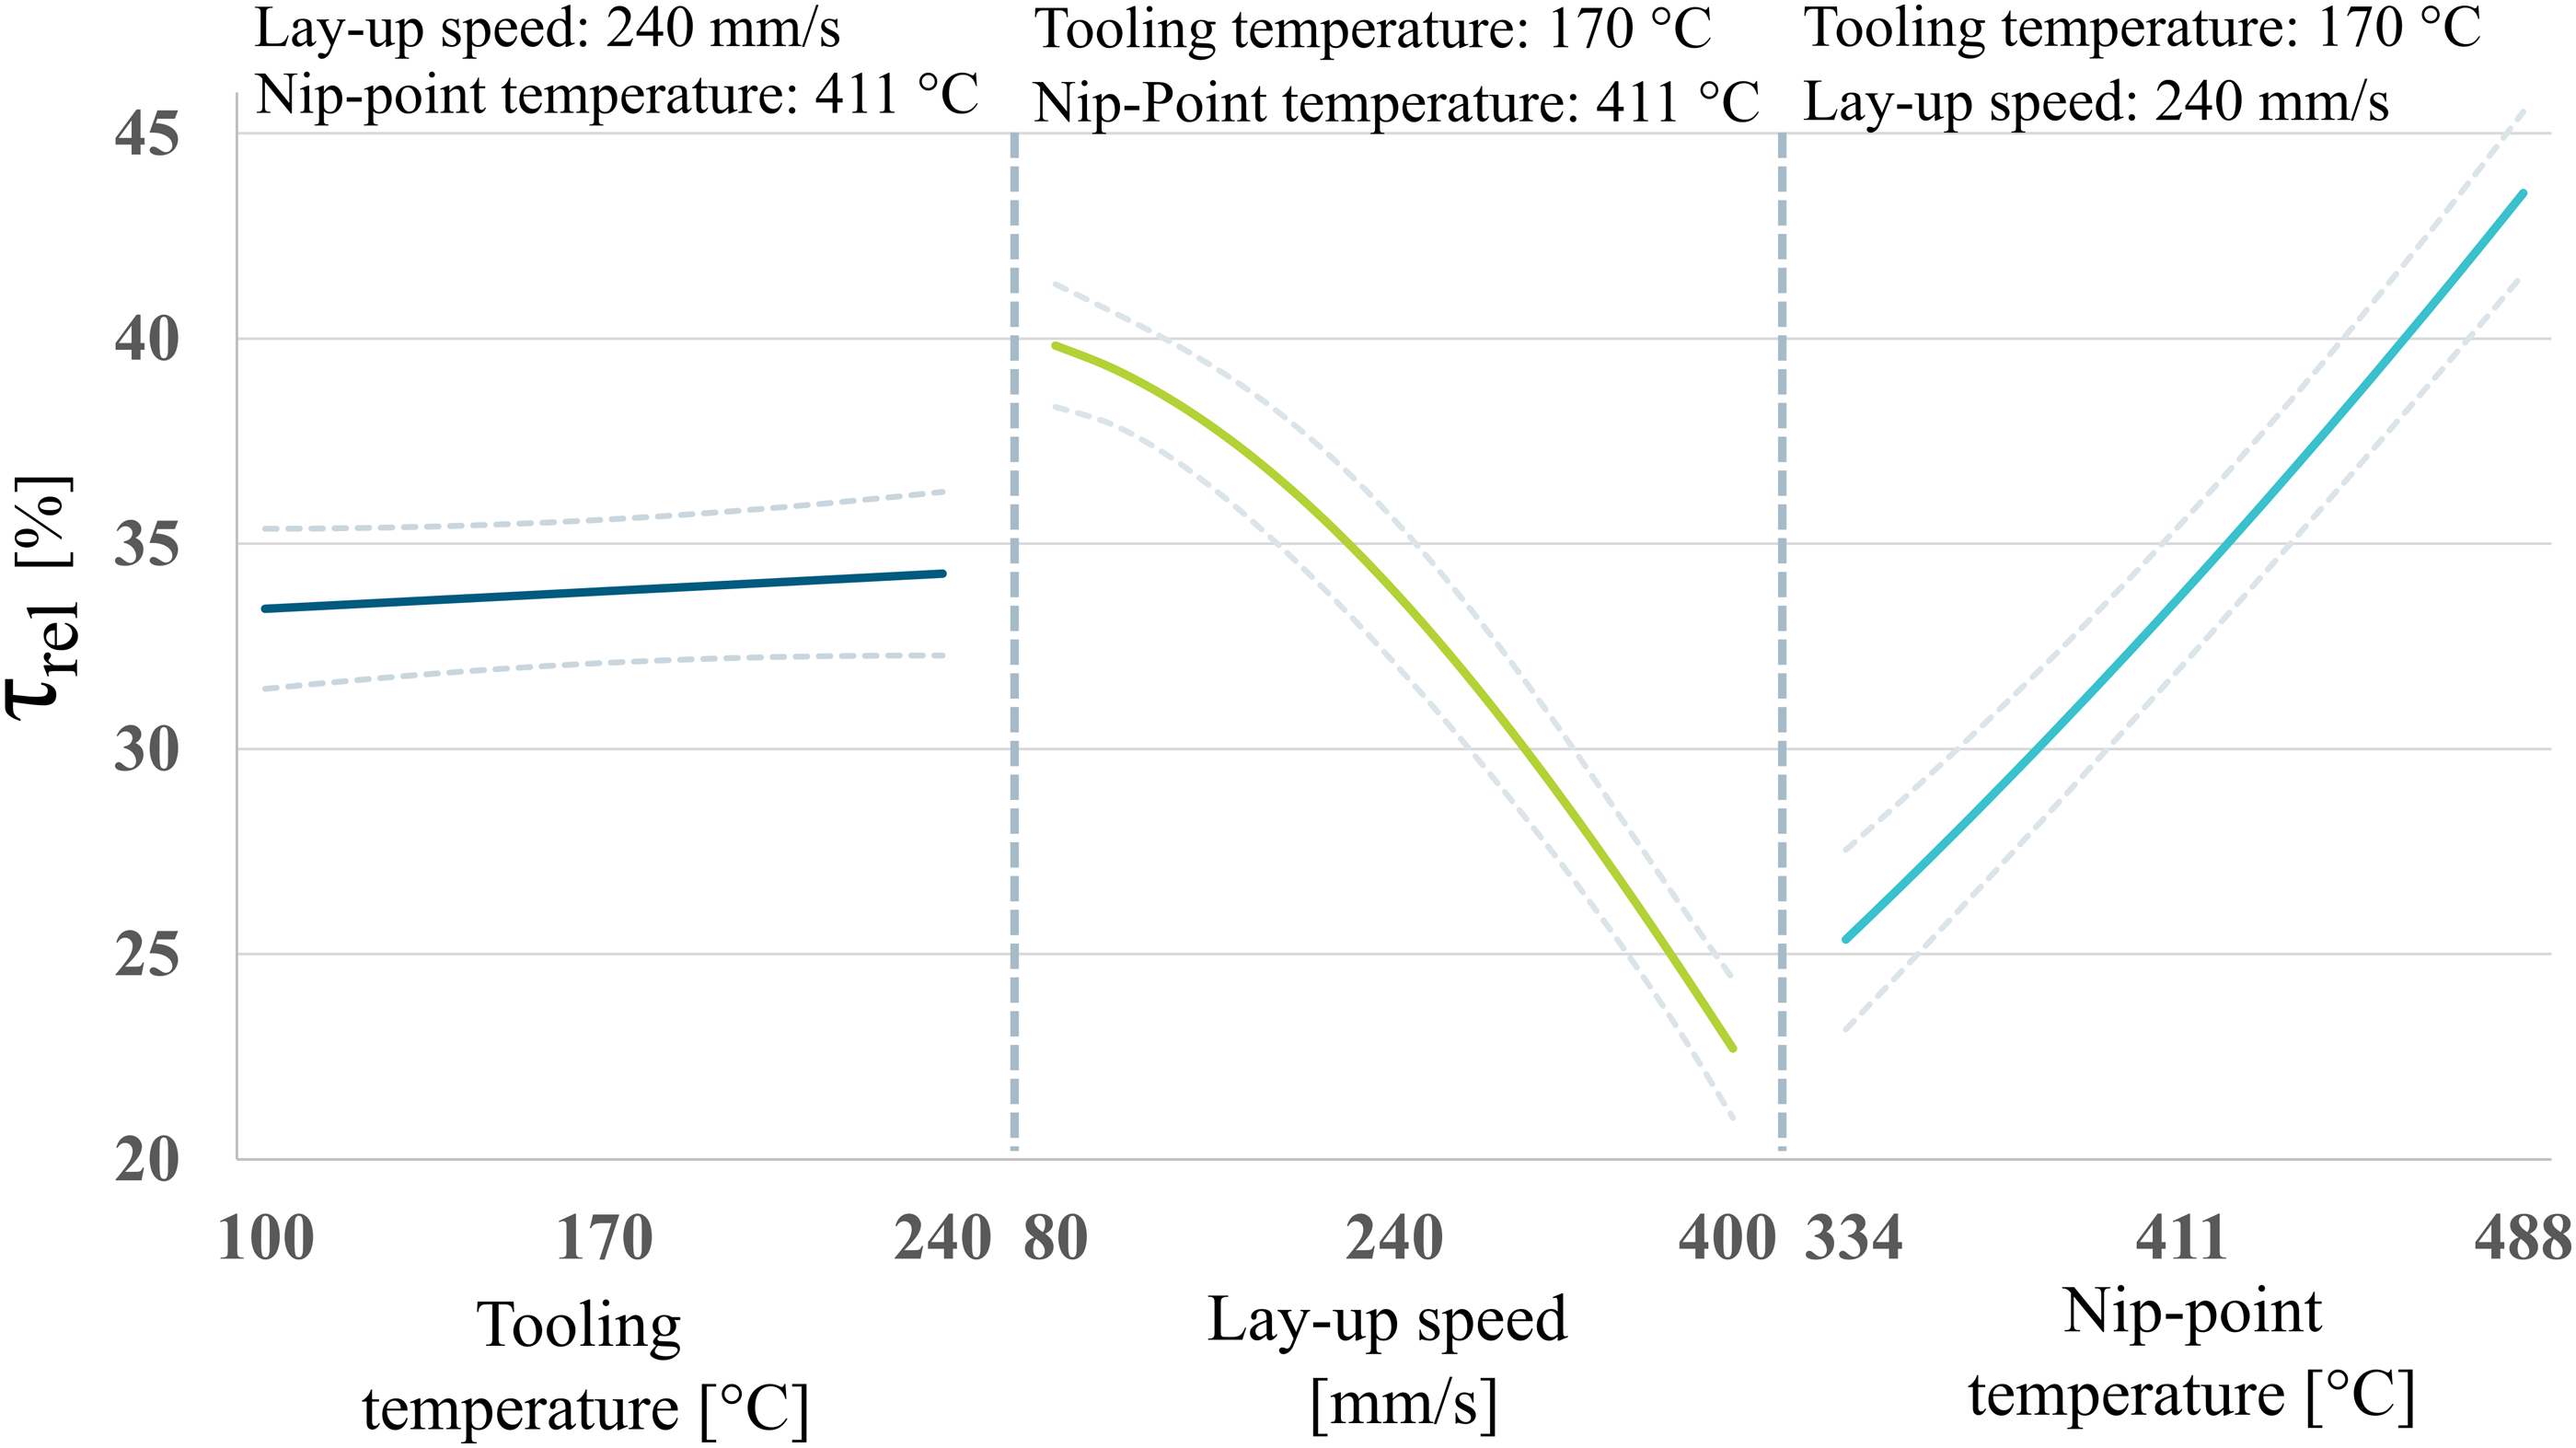
Effect of tooling temperature
As seen in Figure 10, the tooling temperature influences the degree of bonding only to a small extent. However, a negative effect on mechanical properties was observed, especially for tooling temperatures near the crystallite melting temperature. The reason for this could be the higher degree of porosity in the laminates. According to Patou et al., higher porosity negatively affects the mechanical properties. 27 However, higher tooling temperatures could lead to increased mobility of the polymer chains in the substrate, promoting autohesion. Furthermore, the lower viscosity of the substrate could favour the development of intimate contact. 8
Effect of lay-up speed
The lay-up speed is negatively correlated with bonding strength. In Figure 10, a quadratic decrease in mechanical consolidation can be seen for an increasing lay-up speed. Dreher et al. 29 built up a model based on single lap shear experiments to study the interlaminar strength in the thermoplastic AFP process. The investigated lay-up speed ranged from 16.7 to 166.7 mm/s. They also found an approximately quadratic decrease in shear strength. 29 On the other hand, Stokes-Griffin et al. 16 and Di Francesco et al. 14 found no significant effect of lay-up speed on the interlaminar shear strength in their research. However, the reduction of bonding strength with increasing lay-up speeds can be attributed to the shorter weld time. Consequently, less time is available to smooth out surface irregularities for developing a high degree of intimate contact and for the autohesion and entanglement of the polymer chains. Time and temperature are the key inputs in the model for the degree of bonding. 11 Thus, based on the model, a reduction in the bond strength and consequently in the mechanical consolidation quality can be assumed.
Effect of nip-point temperature
In contrast to the lay-up speed, the nip-point temperature has a significant positive correlation to the bonding strength. Increasing the nip-point temperature decreases the viscosity of the material and promotes the development of intimate contact. Furthermore, as described for the effect of lay-up speed, the temperature is one of the key input variables in the model for the degree of bonding and positively affects the autohesion. The strong fluctuations of nip-point temperature must be considered. As can be seen in Figure 5 and Table 2, high differences can be present in the nip-point temperature reached within one tape trajectory and between the individual tape trajectories. Consequently, the exact nip-point temperature for the single specimens could not be determined, and only the evaluated mean temperature was used.
Degree of crystallinity
A linear model and no transformation for the dependent variables were chosen for the regression analysis of the degree of crystallinity. With an R2 of 95%, about 5% of the variance remains unexplained. The R2adj is identical to 95%, so the regression model describes the correlations well. As the predictive measure Q2 is 95%, the model is stable and will not change significantly due to new measurement results. Furthermore, Visual-XSel states that the measurement error is low with a repeatability of 99%. This can also correlate to the comparably low standard deviations in Chapter 3.2.
Based on the statistical measures, the model quality seems high. However, considering the results of Chapter 3.2, the correlations are not described entirely correctly, as discussed in the following. Figure 11 shows the evaluated correlations between process parameters and crystallinity. The tooling temperature is the significant influence factor for the degree of crystallinity. Evaluated correlations between process parameters and degree of crystallinity.
32
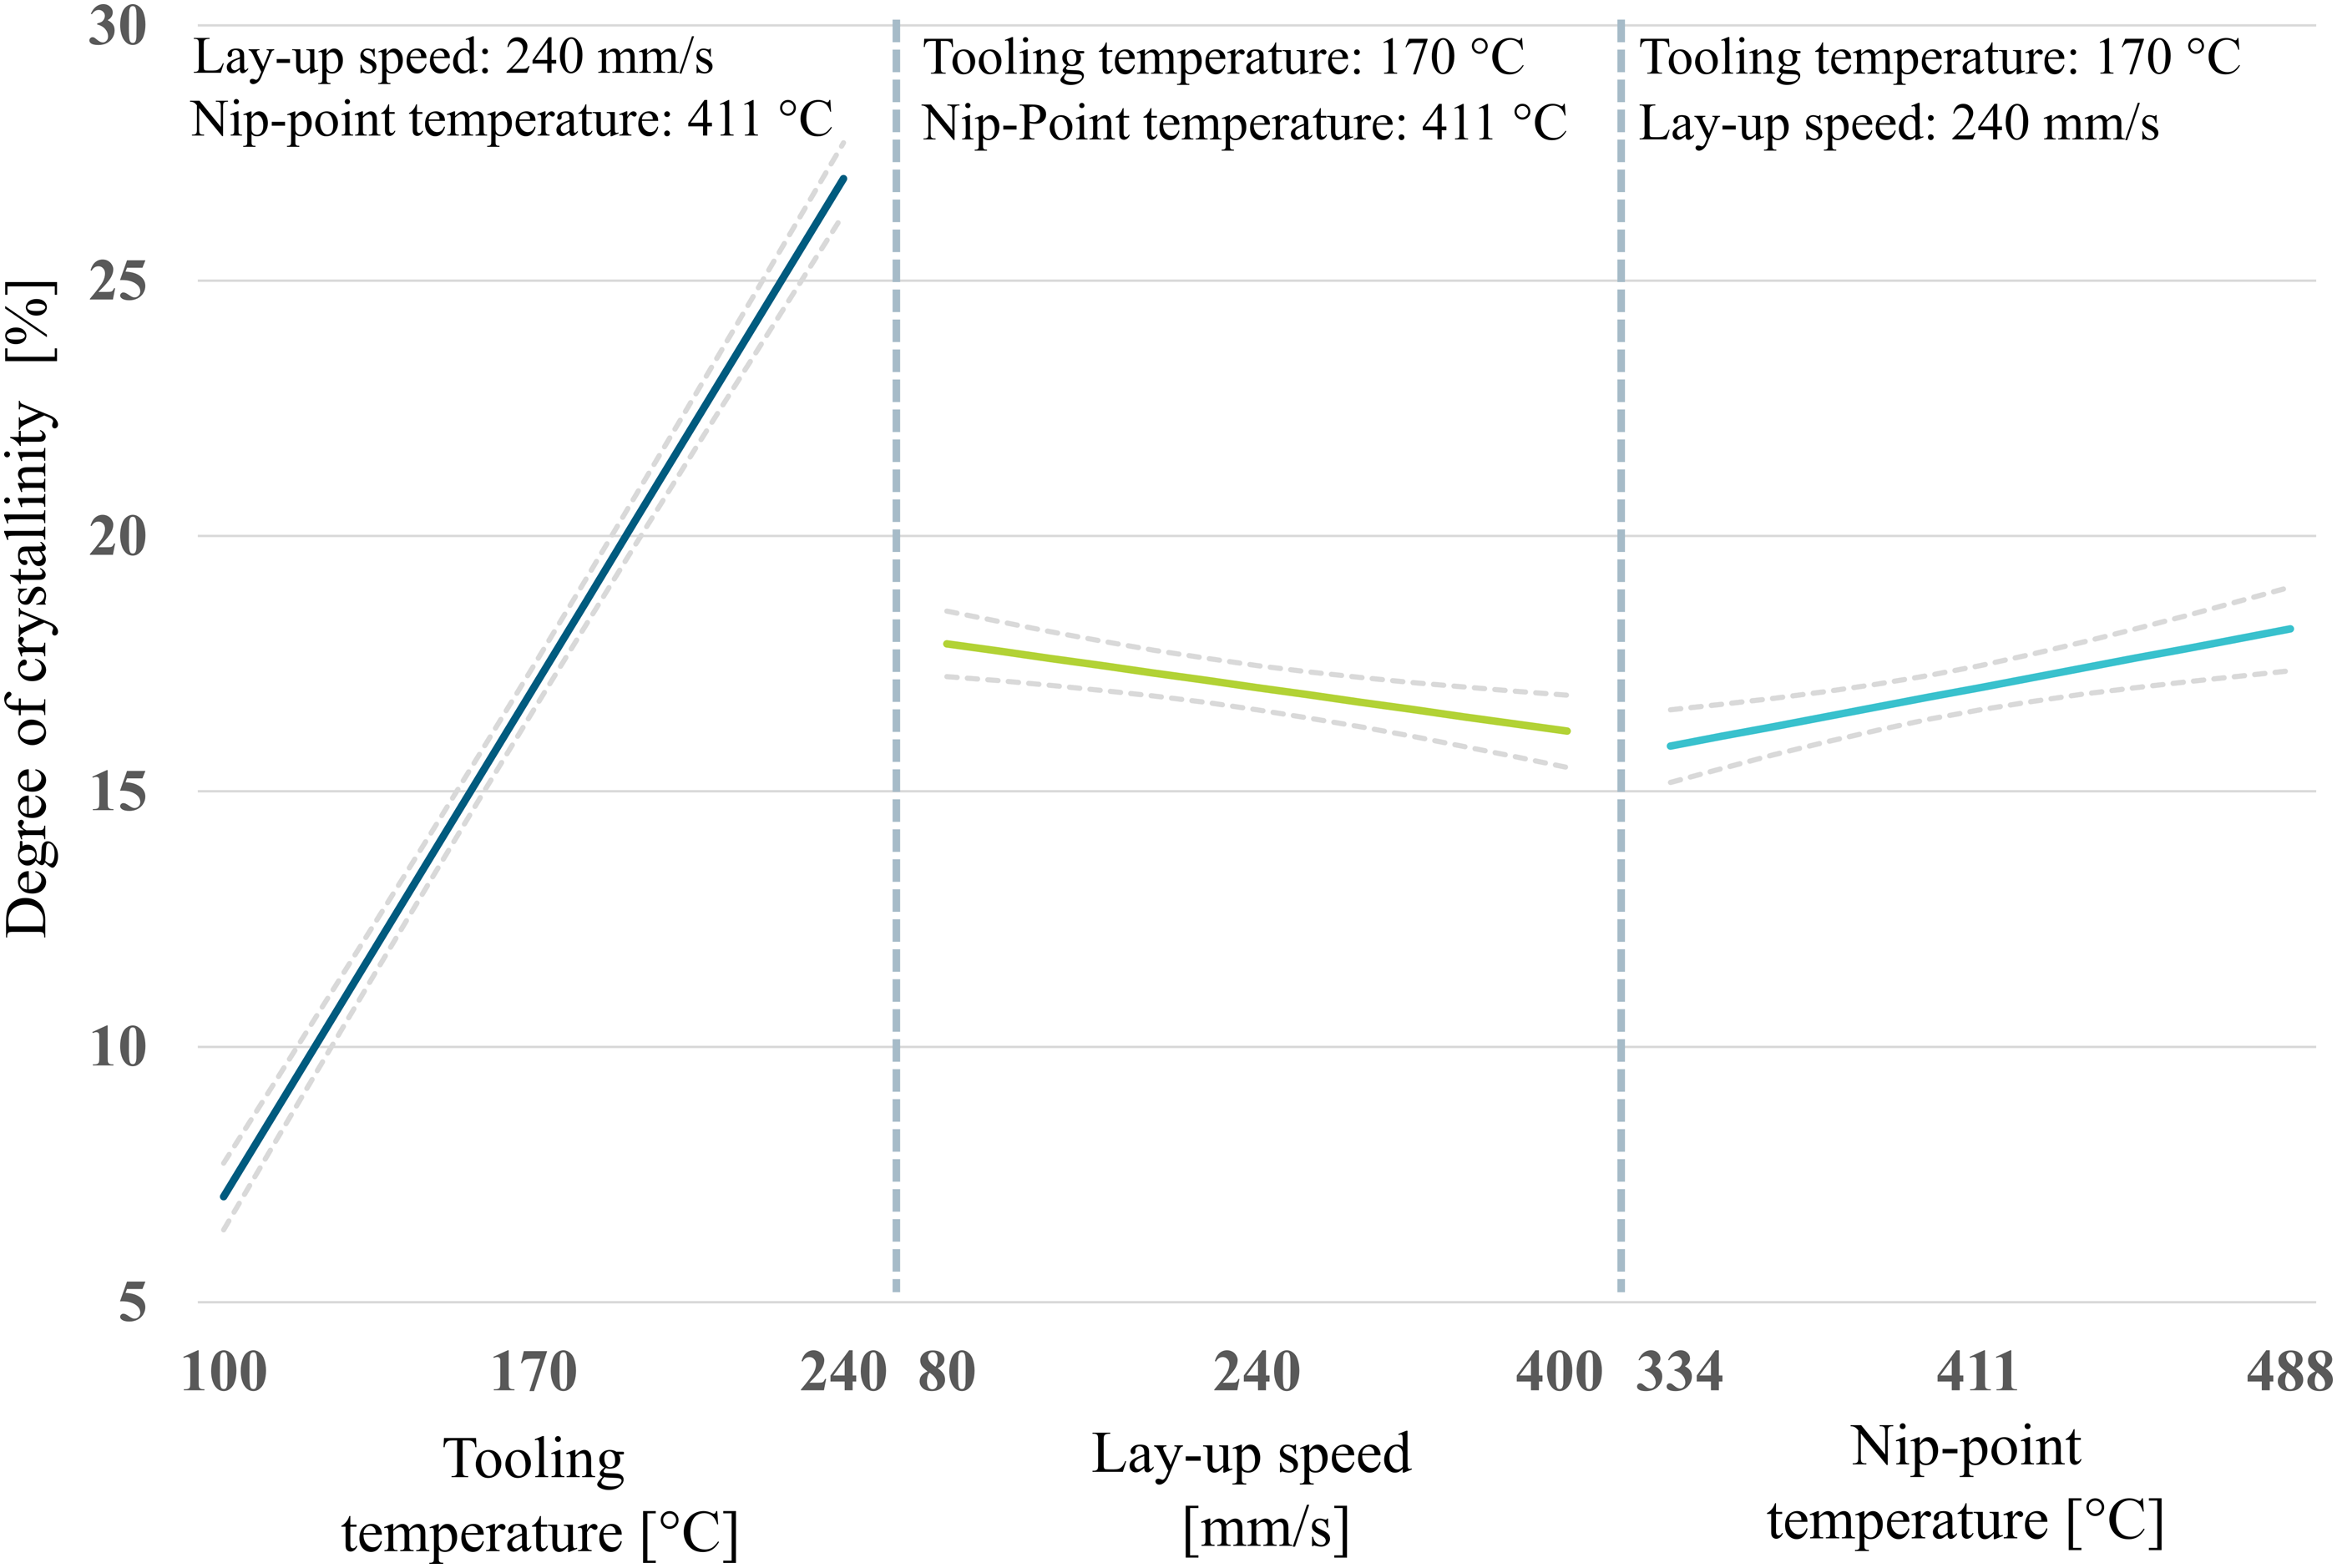
Effect of tooling temperature
The tooling temperature mainly influences the cooling rate and, thus, the crystallinity. An increase in tooling temperature leads to an increase in the degree of crystallinity. For example, at a temperature of 240°C high crystallinities above 25% can be reached.
Effect of lay-up speed
The lay-up speed has a minor effect on the degree of crystallinity. Increasing the lay-up speed increases the cooling rate, 12 which is why crystallinity tends to decrease. This minor effect is shown in Figure 11.
Effect of nip-point temperature
Regarding the effect of the nip-point temperature, the results of the model differ from the results of Chapter 3.2. The model describes a positive correlation between nip-point temperature and degree of crystallinity. However, for the results seen in Chapter 3.2, the effect of nip-point temperature depends on the tooling temperature. For a tooling temperature of 100°C, a change in nip-point temperature showed no effect on crystallinity. This was also found by Schiel et al. 17 in their investigation into the degree of crystallinity of LM-PAEK processed on unheated two-dimensional tooling. Schiel et al. measured degrees of crystallinity for unheated tooling ranging from about 7 to 9% for the median. At a tooling temperature of 160°C, the crystallinity is significantly increased by raising the nip-point temperature. In contrast, the crystallinity tends to decrease at an increasing nip-point temperature at a tooling temperature of 240°C. Schiel et al. also found a negative trend for crystallinity and nip-point temperature for a tooling temperature of 200°C with a partially high range of the results. 17
Quality of stamp-formed laminates
Degree of porosity
The comparison of the cross-sections for the laminates after lay-up and the laminates after stamp forming for a tooling temperature of 160°C can be seen in Figure 12. Regardless of the initial blank quality, the degree of porosity for the stamp-formed laminates is mainly below 1 A-%. This was also observed for the other tooling temperatures. Thus, it can be assumed that low consolidation qualities can be completely compensated for by the stamp-forming process with respect to porosity. Comparison of cross-sections of laminates after lay-up (left) laid on a tooling temperature of 160 °C and stamp-formed laminates (right).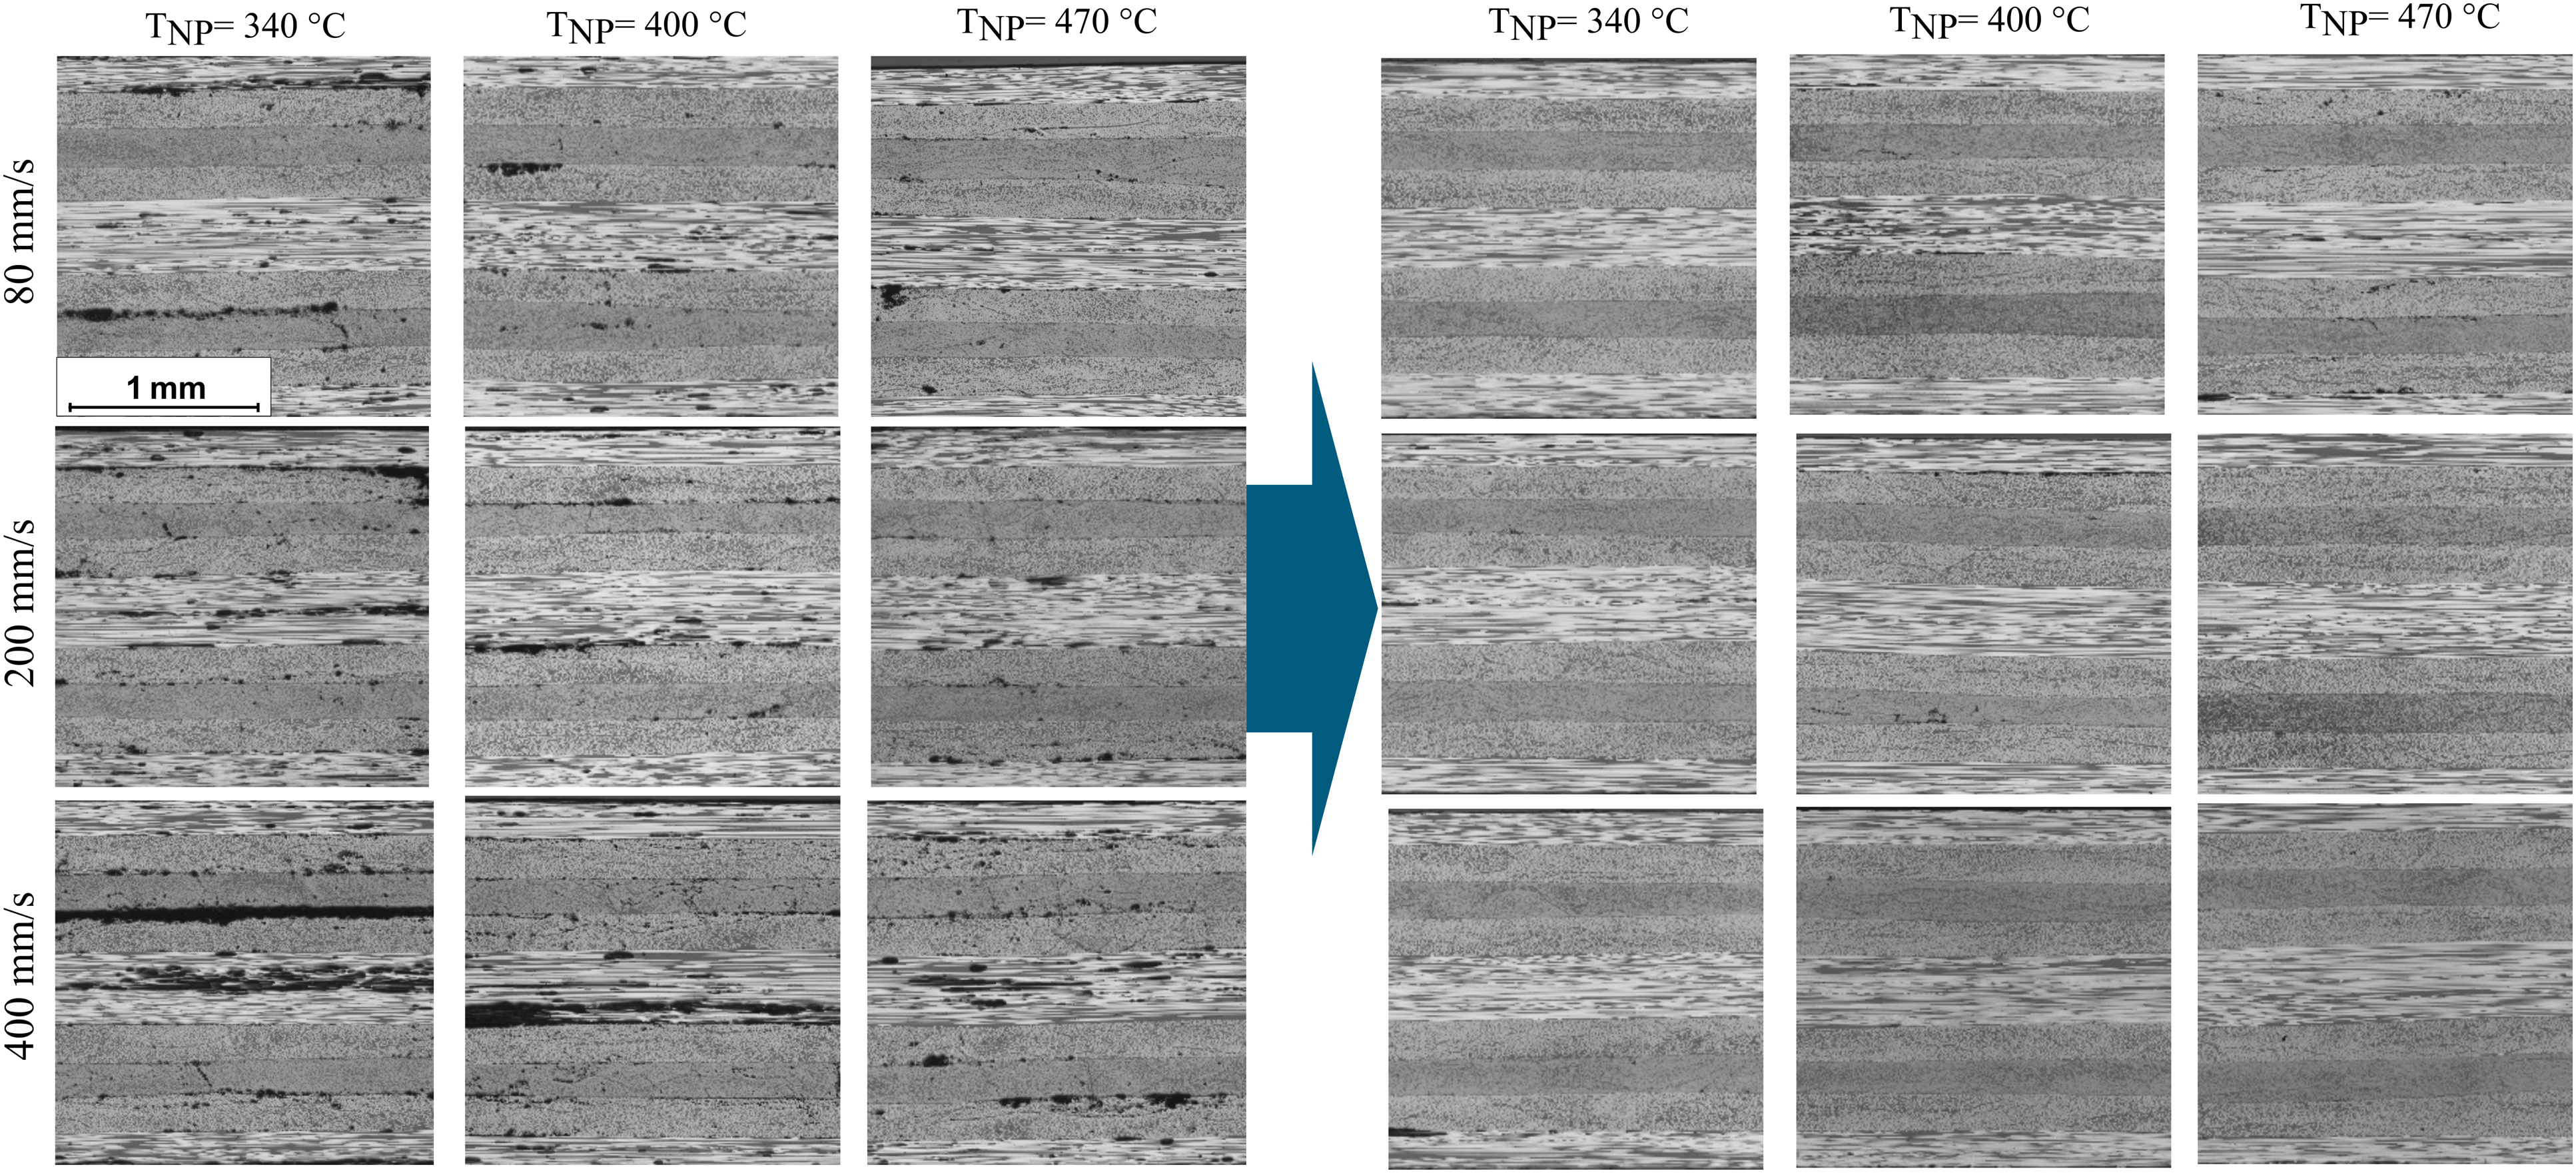
Degree of bonding
The results for the relativised apparent interlaminar shear strength of the stamp-formed laminates can be seen in Figure 13. The results are shown as a box-plot diagram with one box plot per tooling temperature because great differences were seen between the results of the individual stamp-formed laminates. Results of relativised apparent interlaminar shear strength for stamp-formed laminates.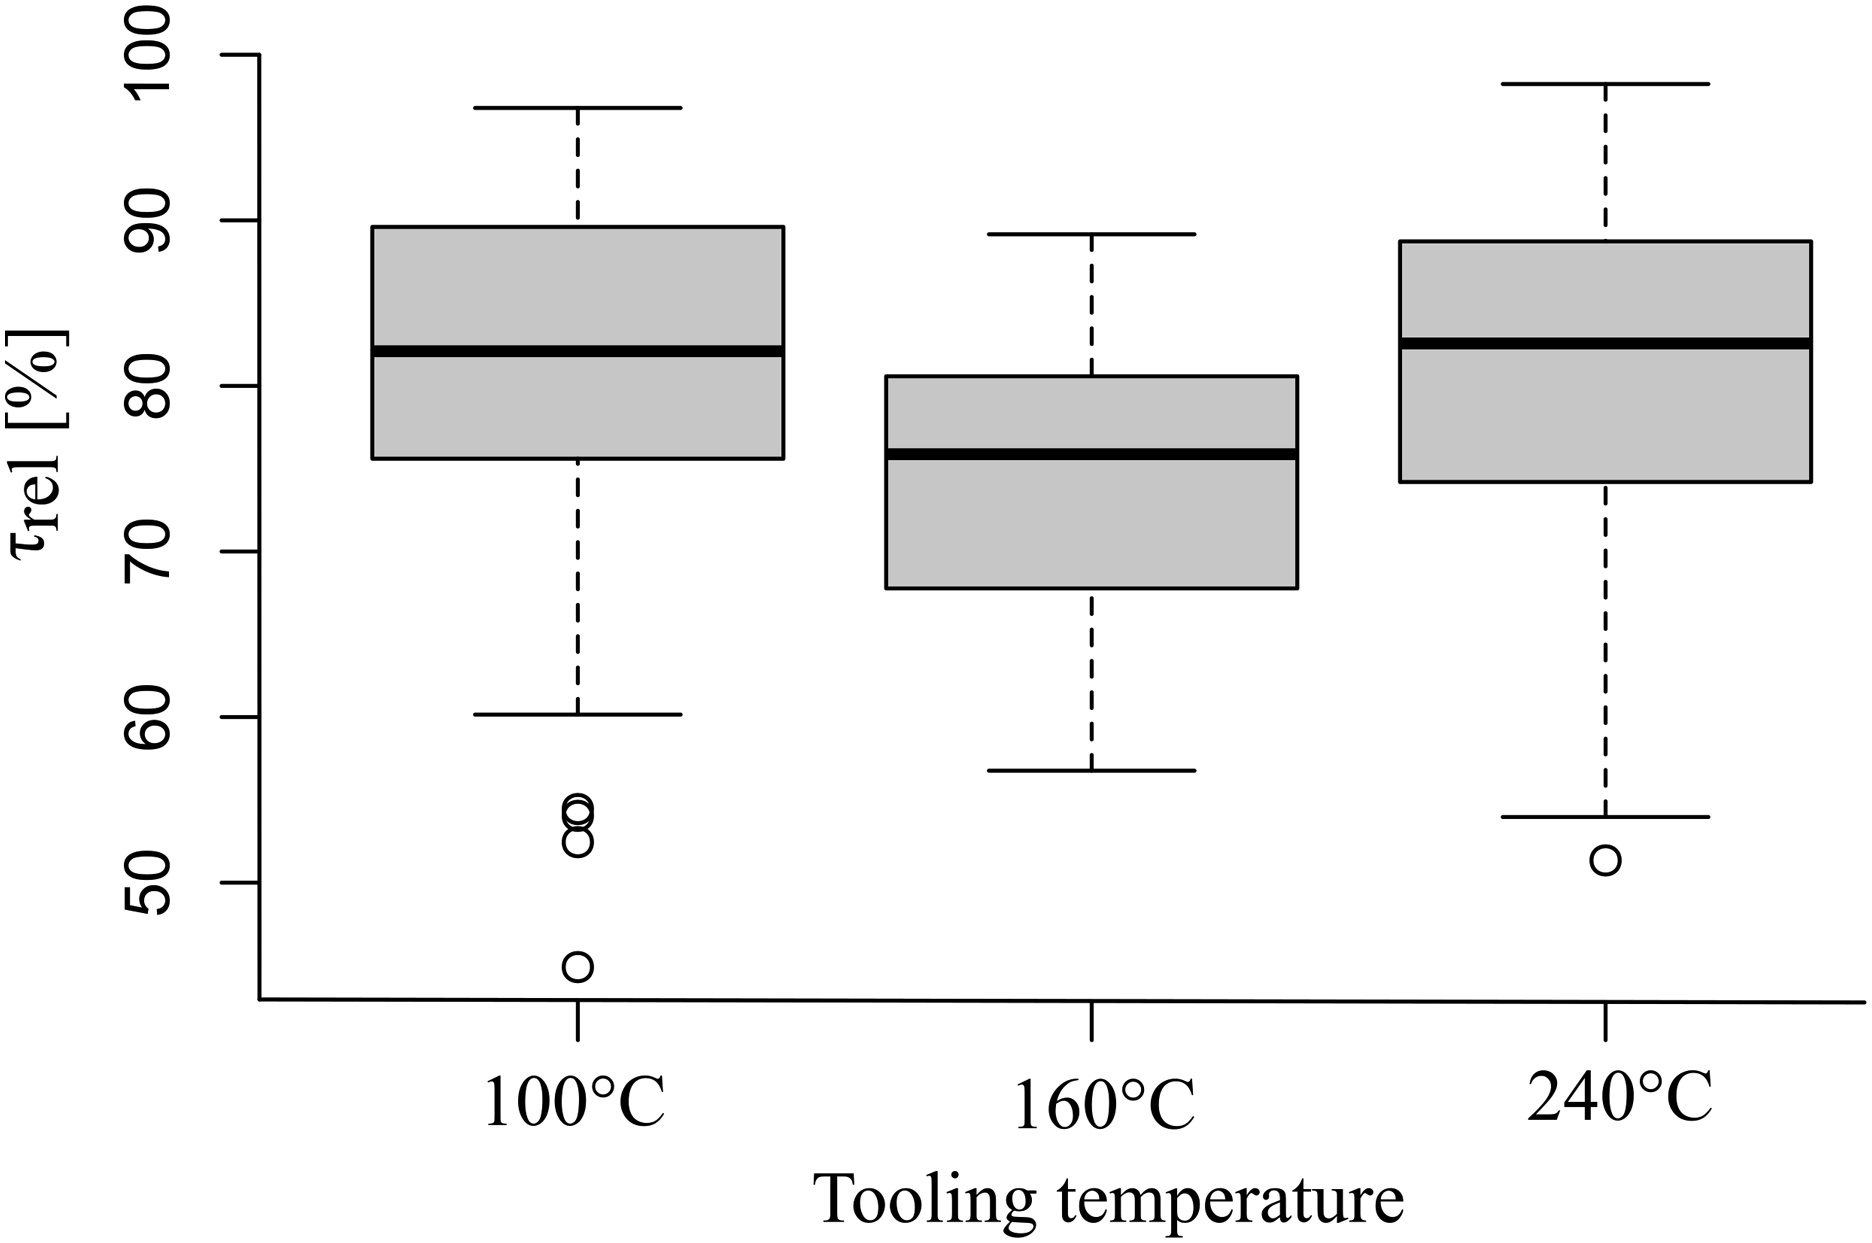
The maximal results for the three test series range from 89% to 98%. The minimal results, on the other hand, are in the range of 45 to 57%. Thus, the results are partially below the results of in situ lay-up. The median between the test series is in the range of 76 to 83%. The first quartile ranges from 68 to 76% and the third from 81 to 90%.
No correlations can be seen between the parameters of the AFP process and the results for the apparent interlaminar shear strength after stamp forming, considering the results of the individual parameter configurations. Due to the limited reproducibility of the transfer time in terms of the stamp-forming process, it cannot be clearly stated if there are correlations between initial blank quality and stamp-formed quality regarding the apparent interlaminar shear strength. The transfer time was documented for every stamp-formed laminate and was considered for interpreting the results, but no significant correlation was seen between transfer time and the results either. It can be stated that with the stamp-forming process, high degrees of bonding can be reached that are comparable to the press consolidation process. The big differences between the parameter configurations and the specimens of the individual parameter configurations themselves cannot be clearly explained due to the limited reproducibility of the used stamp-forming process.
Degree of crystallinity
The results for the degree of crystallinity visualised as a box-plot diagram can be seen in Figure 14. Results of the degree of crystallinity for stamp-formed laminates.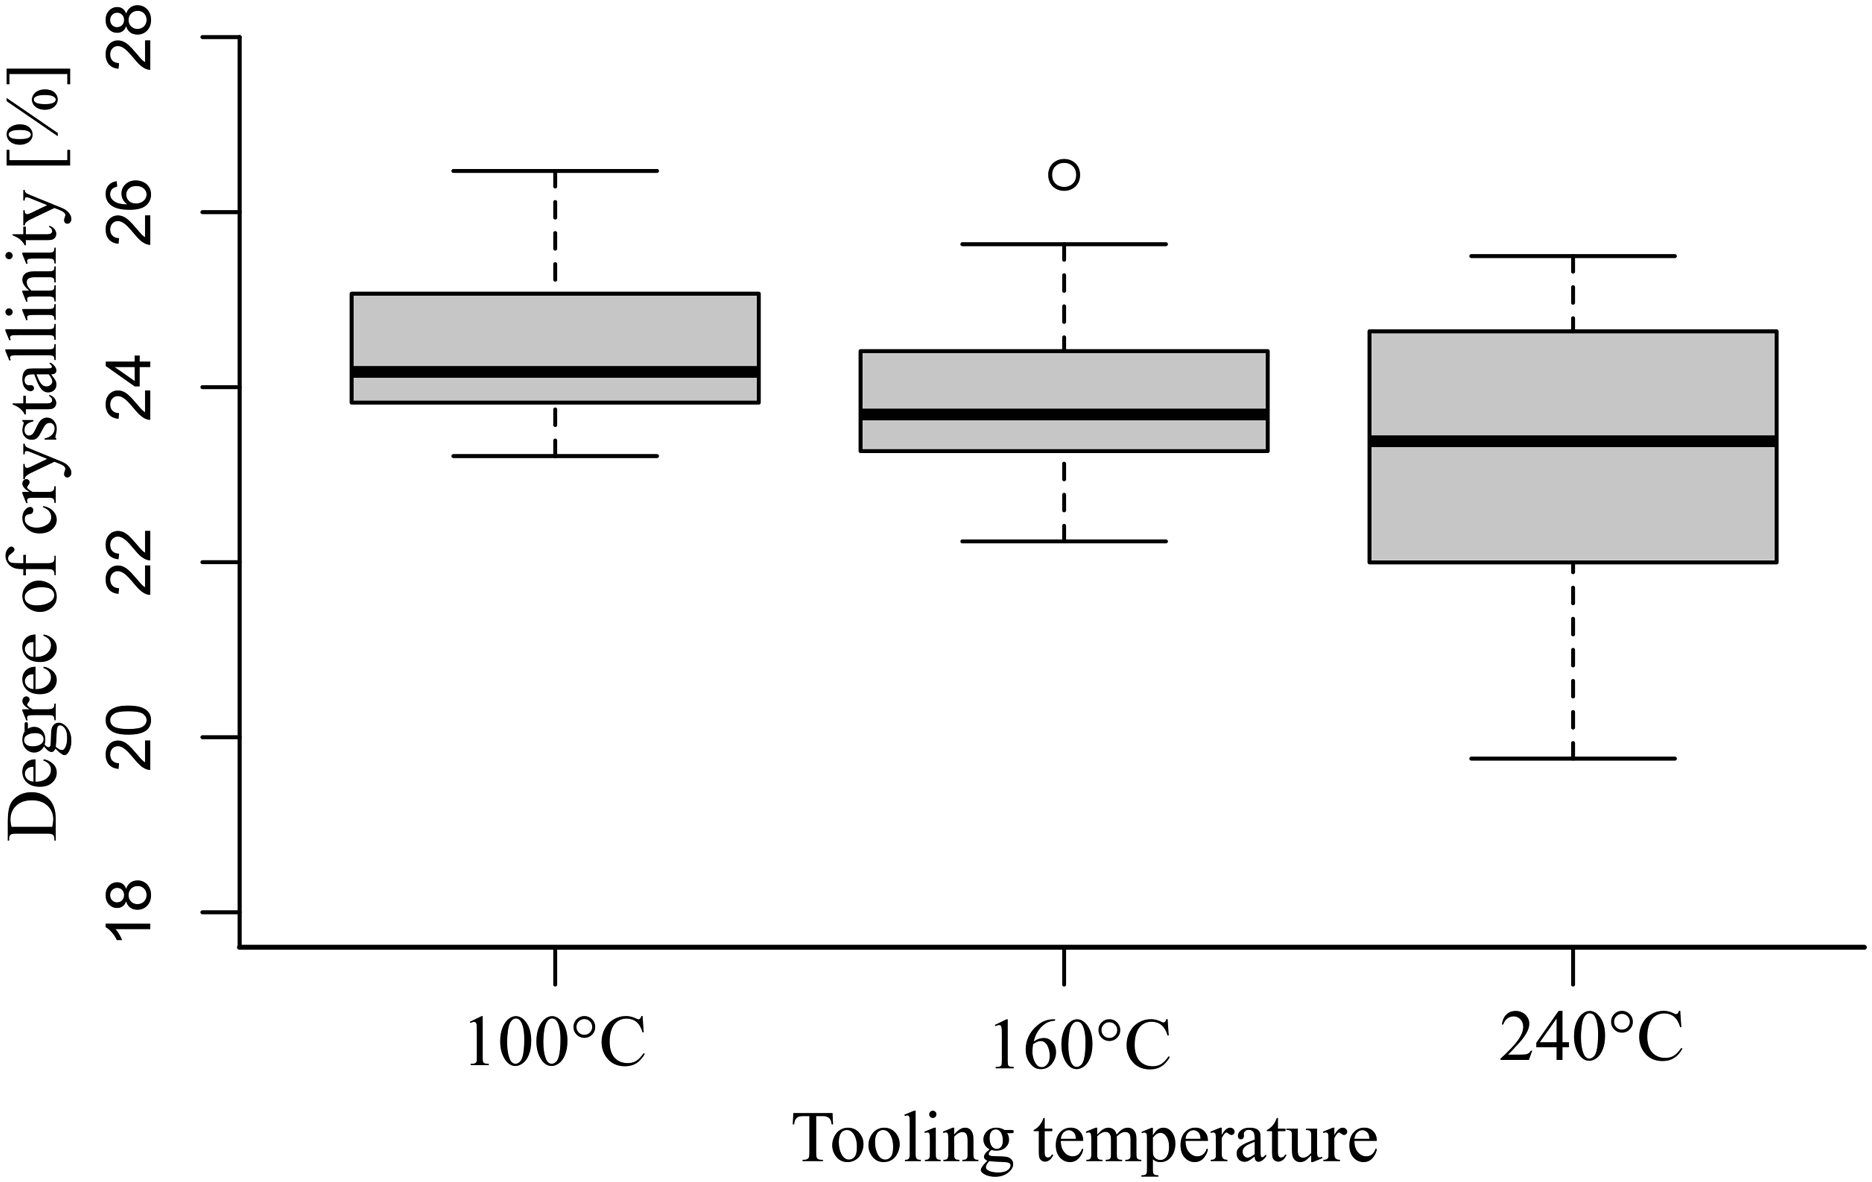
The maximal results for the three test series range from 25.5 to 26.5%. The minimal results are in the range of 19.8 to 23.2%. The median between the test series is in a range of 23.4 to 24.2% and comparable close to each other. The first quartile ranges from 21.9 to 23.8% and the third from 24.4 to 26.5%. Neglecting single outliners, the results for the degree of crystallinity are mostly in the range of 20 to 26%. The initial degree of crystallinity seems insignificant because the results for all three tooling temperatures are comparable. Especially the laminates that were laid on a tooling temperature of 240°C showed, on average, higher degrees of crystallinity after lay-up than after stamp forming. It can therefore be assumed that the last processing step is decisive for the final crystallinity.
Summarised evaluation of lay-up process and combination of lay-up with stamp forming
The following sub-chapter compares the results after the lay-up process and after post-consolidation using stamp forming for the different evaluation criteria. Furthermore, all results are set relative to the reference plate. The comparison aims to set process boundaries between in situ lay-up and rapid lay-up with required post-consolidation. In addition, it is discussed whether there is a limit to the initial blank quality to enable processing employing stamp forming.
Overview of defined lay-up configurations and the parameter combinations considered.
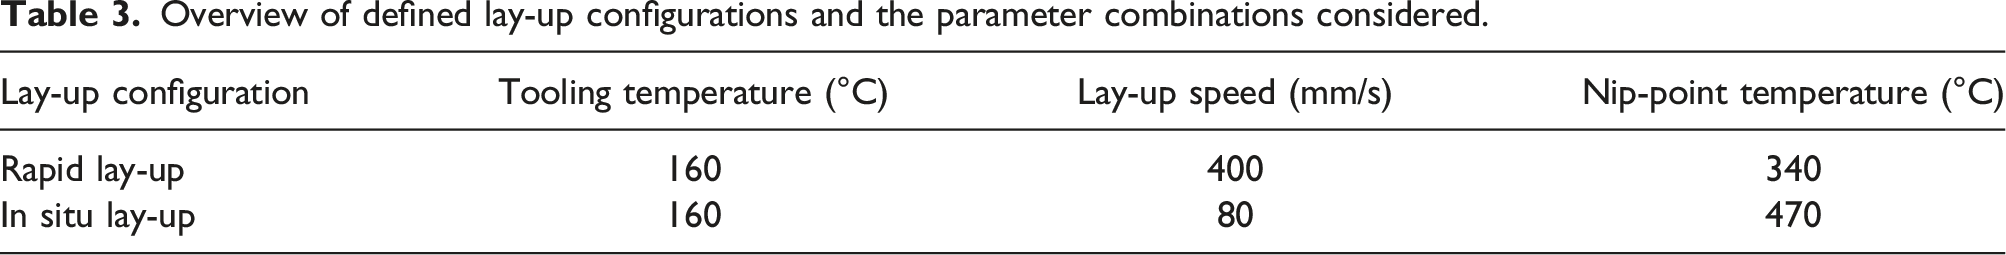
Figure 15 shows an overview of the reachable degree of area porosity for rapid lay-up, in situ lay-up, stamp forming and press consolidation. Comparison of reachable degree of area porosity for rapid lay-up, in situ lay-up, stamp forming and press consolidation.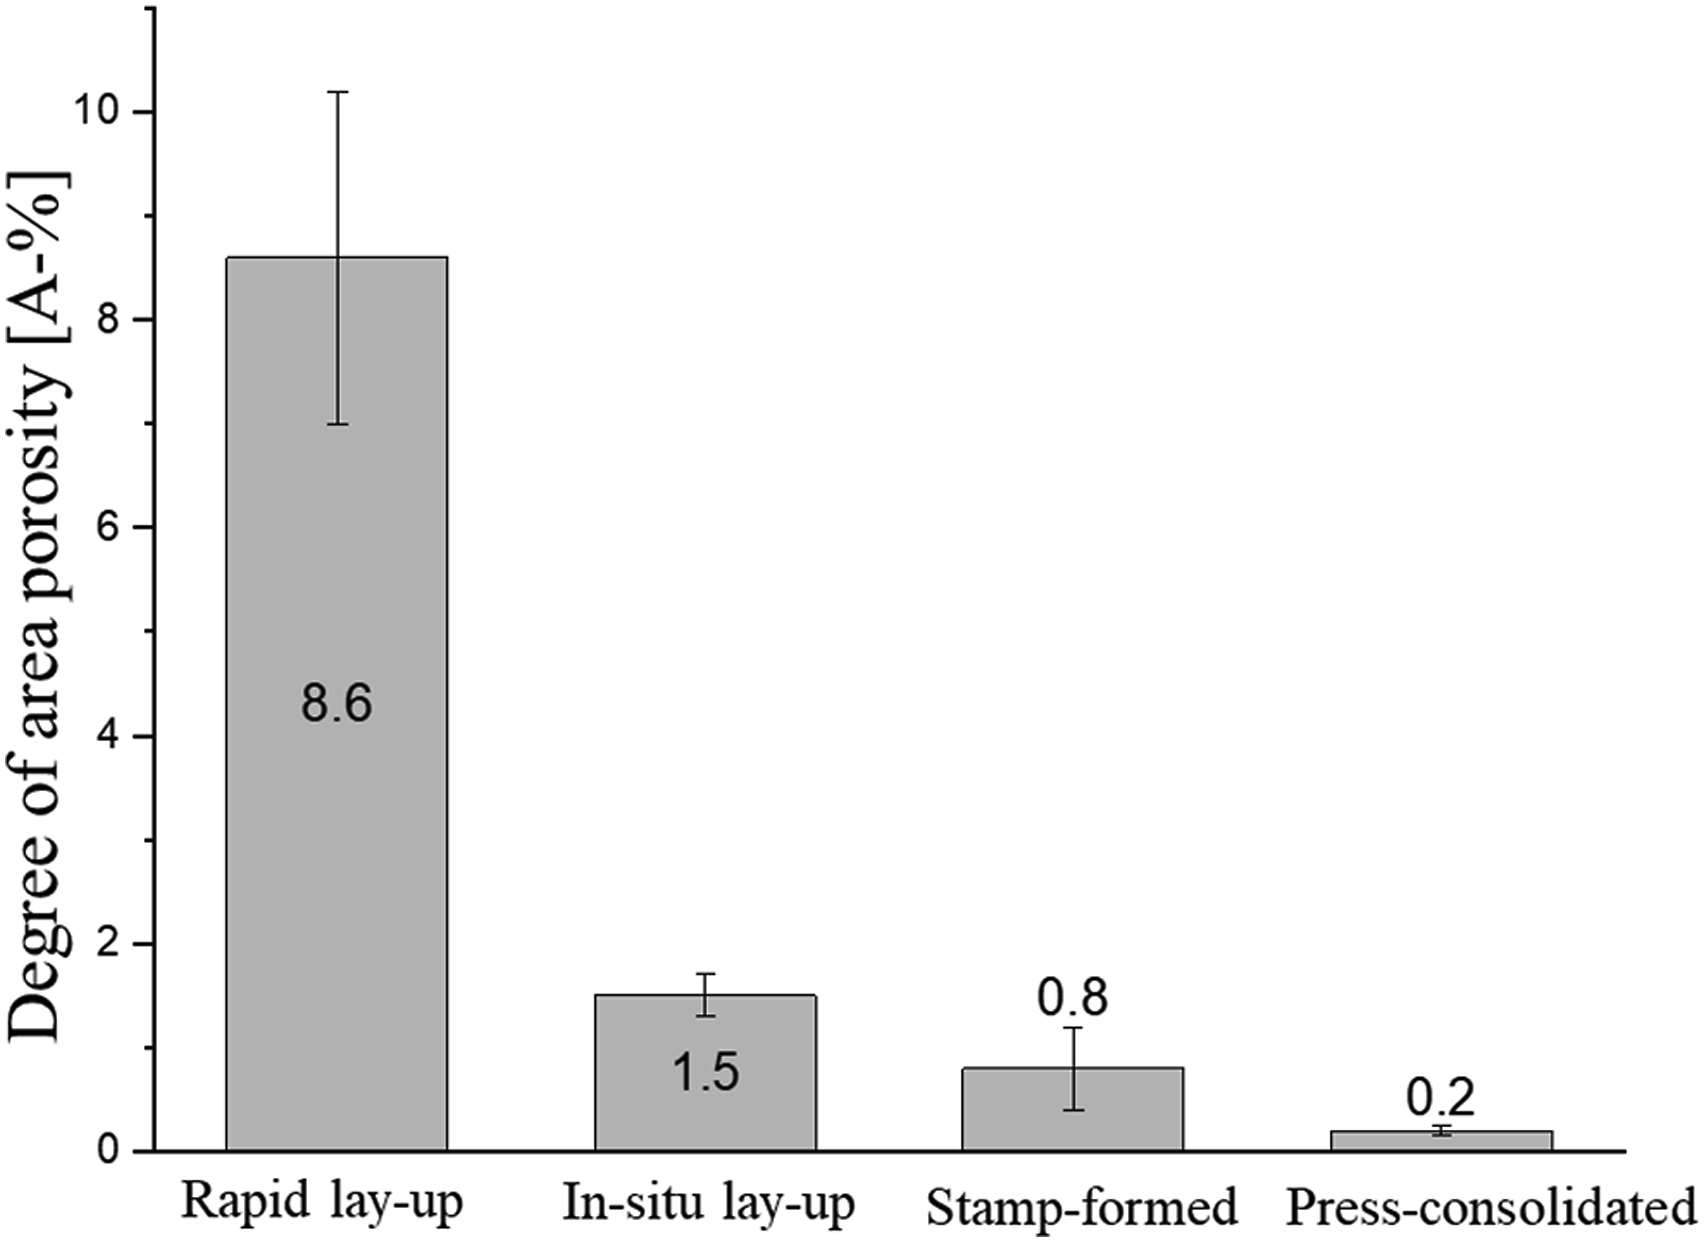
A significant difference between rapid and in situ lay-up can be seen. With the process parameters of in situ lay-up, area porosities below 2.5 A-% can be reached. However, with rapid lay-up, degrees of area porosity ranging from 7 to above 10 A-% are seen. Stamp forming further reduces the area porosity of the laminates independent of the initial degree of porosity. For rapid lay-up, the degree of area porosity can be reduced from 8.6% to 0.8% on average. The lowest degrees of area porosity were obtained by press consolidation, after which a nearly porous-free laminate with a porosity of about 0.2 A-% was obtained.
An overview of the obtained degree of crystallinity for rapid lay-up, in situ lay-up, stamp forming and press consolidation is shown in Figure 16. Comparison of the degree of crystallinity obtained for rapid lay-up, in situ lay-up, stamp forming and press consolidation.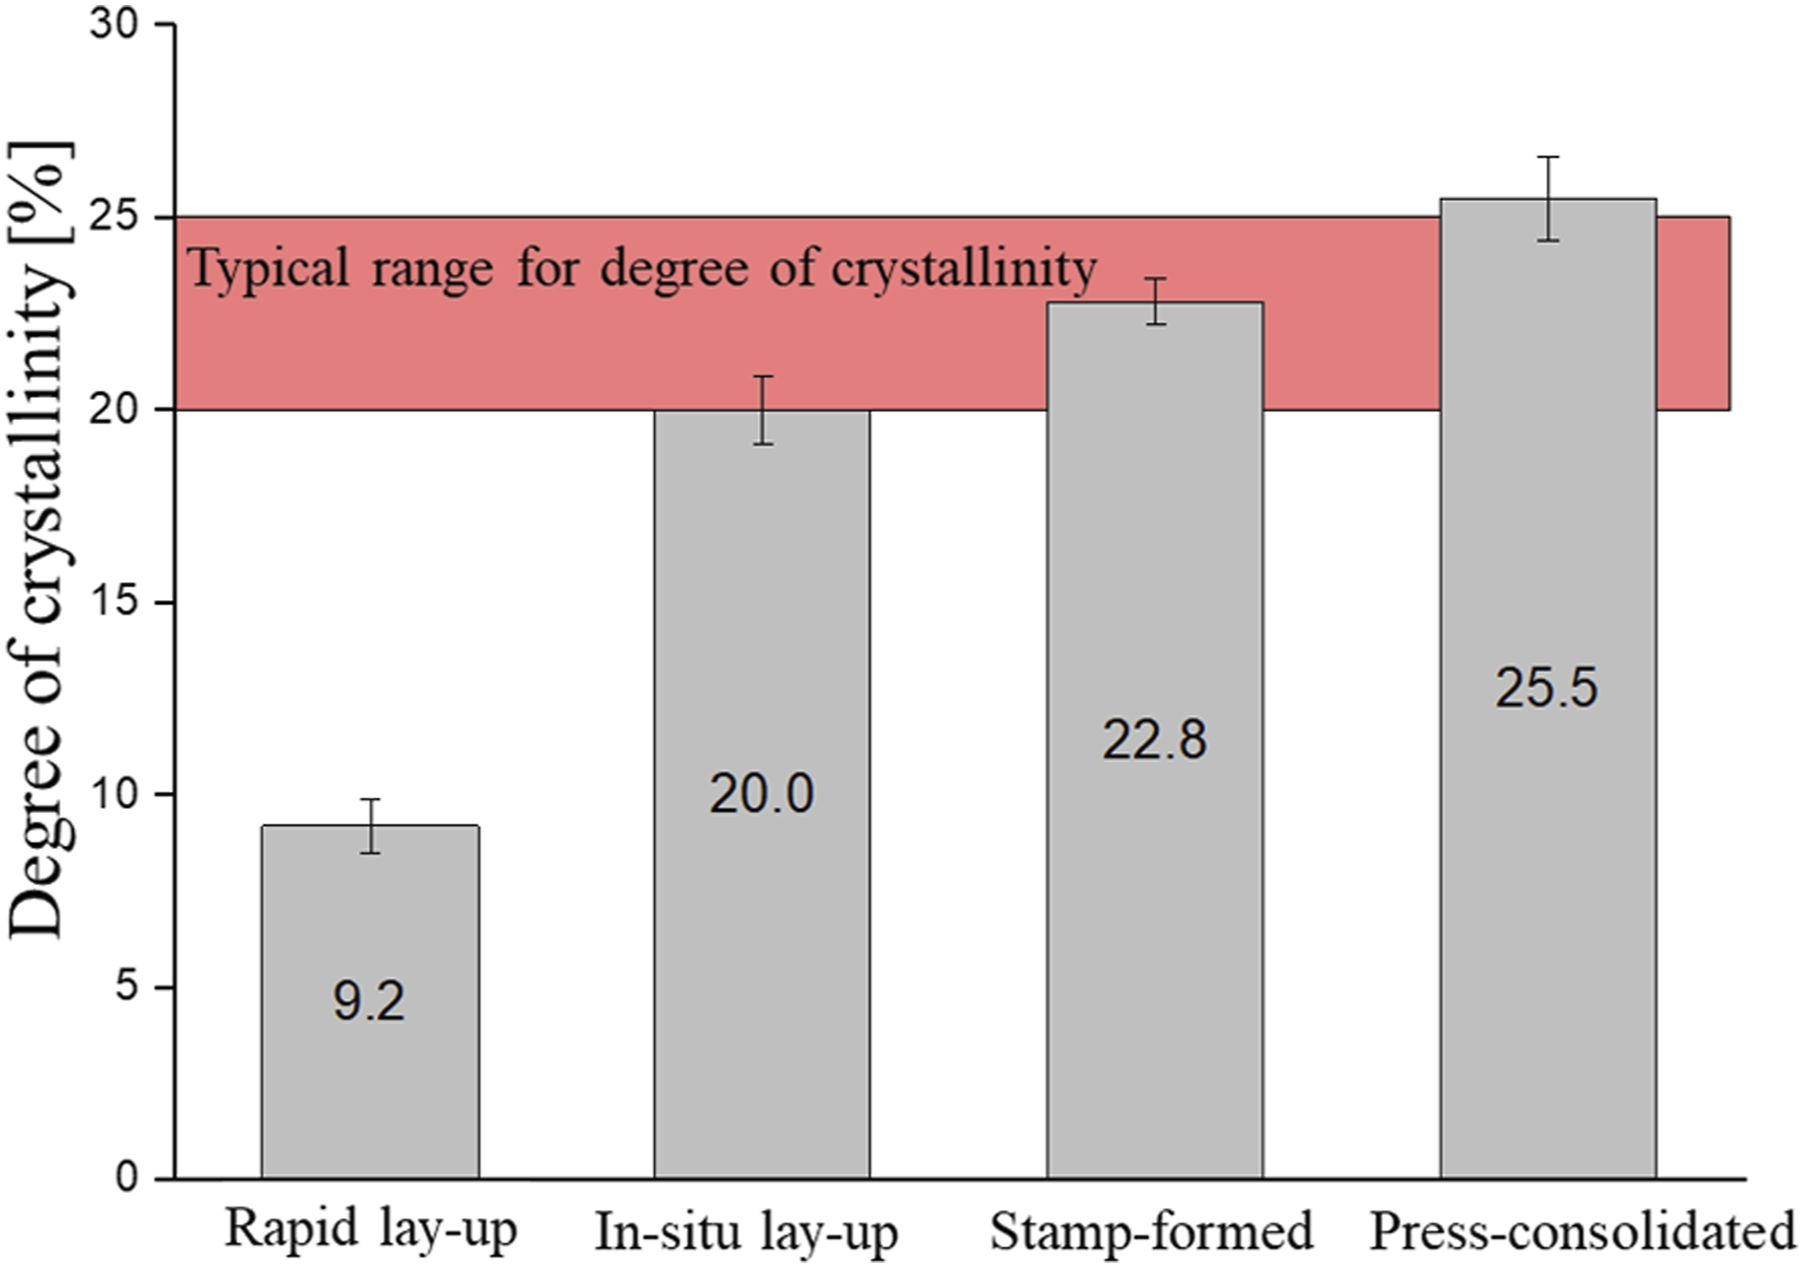
Significant differences in the degree of crystallinity can also be seen between the different processing conditions. After rapid lay-up, the degree of crystallinity is significantly below the defined typical range of 20% to 25%. After in situ lay-up, the average degree of crystallinity – at 20.0% – is at the lower limit of the typical range. Now, it must be considered that the degree of crystallinity depends strongly on the tooling temperature, and for temperatures of 240°C, degrees of crystallinity above 25% were seen. However, the required degrees of area porosity below 2.5 A-% could not be reached with these tooling temperatures. After stamp forming, the degree of crystallinity of rapid lay-up blanks was increased from 9.2% to about 22.8% on average. As a result, and as described in Chapter 3.4, the initial degree of crystallinity of the preform does not affect the result after stamp forming. The last processing step is decisive for the final degree of crystallinity so that the crystallinity can be increased or reduced by stamp forming depending on the initial blank crystallinity after lay-up. With press consolidation, degrees of crystallinity above 25% can be reached.
An overview of the achieved degree of bonding for rapid lay-up, in situ lay-up, stamp forming (rapid lay-up) and stamp forming (high) is shown in Figure 17. For stamp forming (high), the parameter combination with the maximal value of all tested laminates was used due to the strong variations seen for the stamp-formed laminate results. Comparison of the reachable degree of bonding for rapid lay-up, in situ lay-up, stamp forming (low) and stamp forming (high).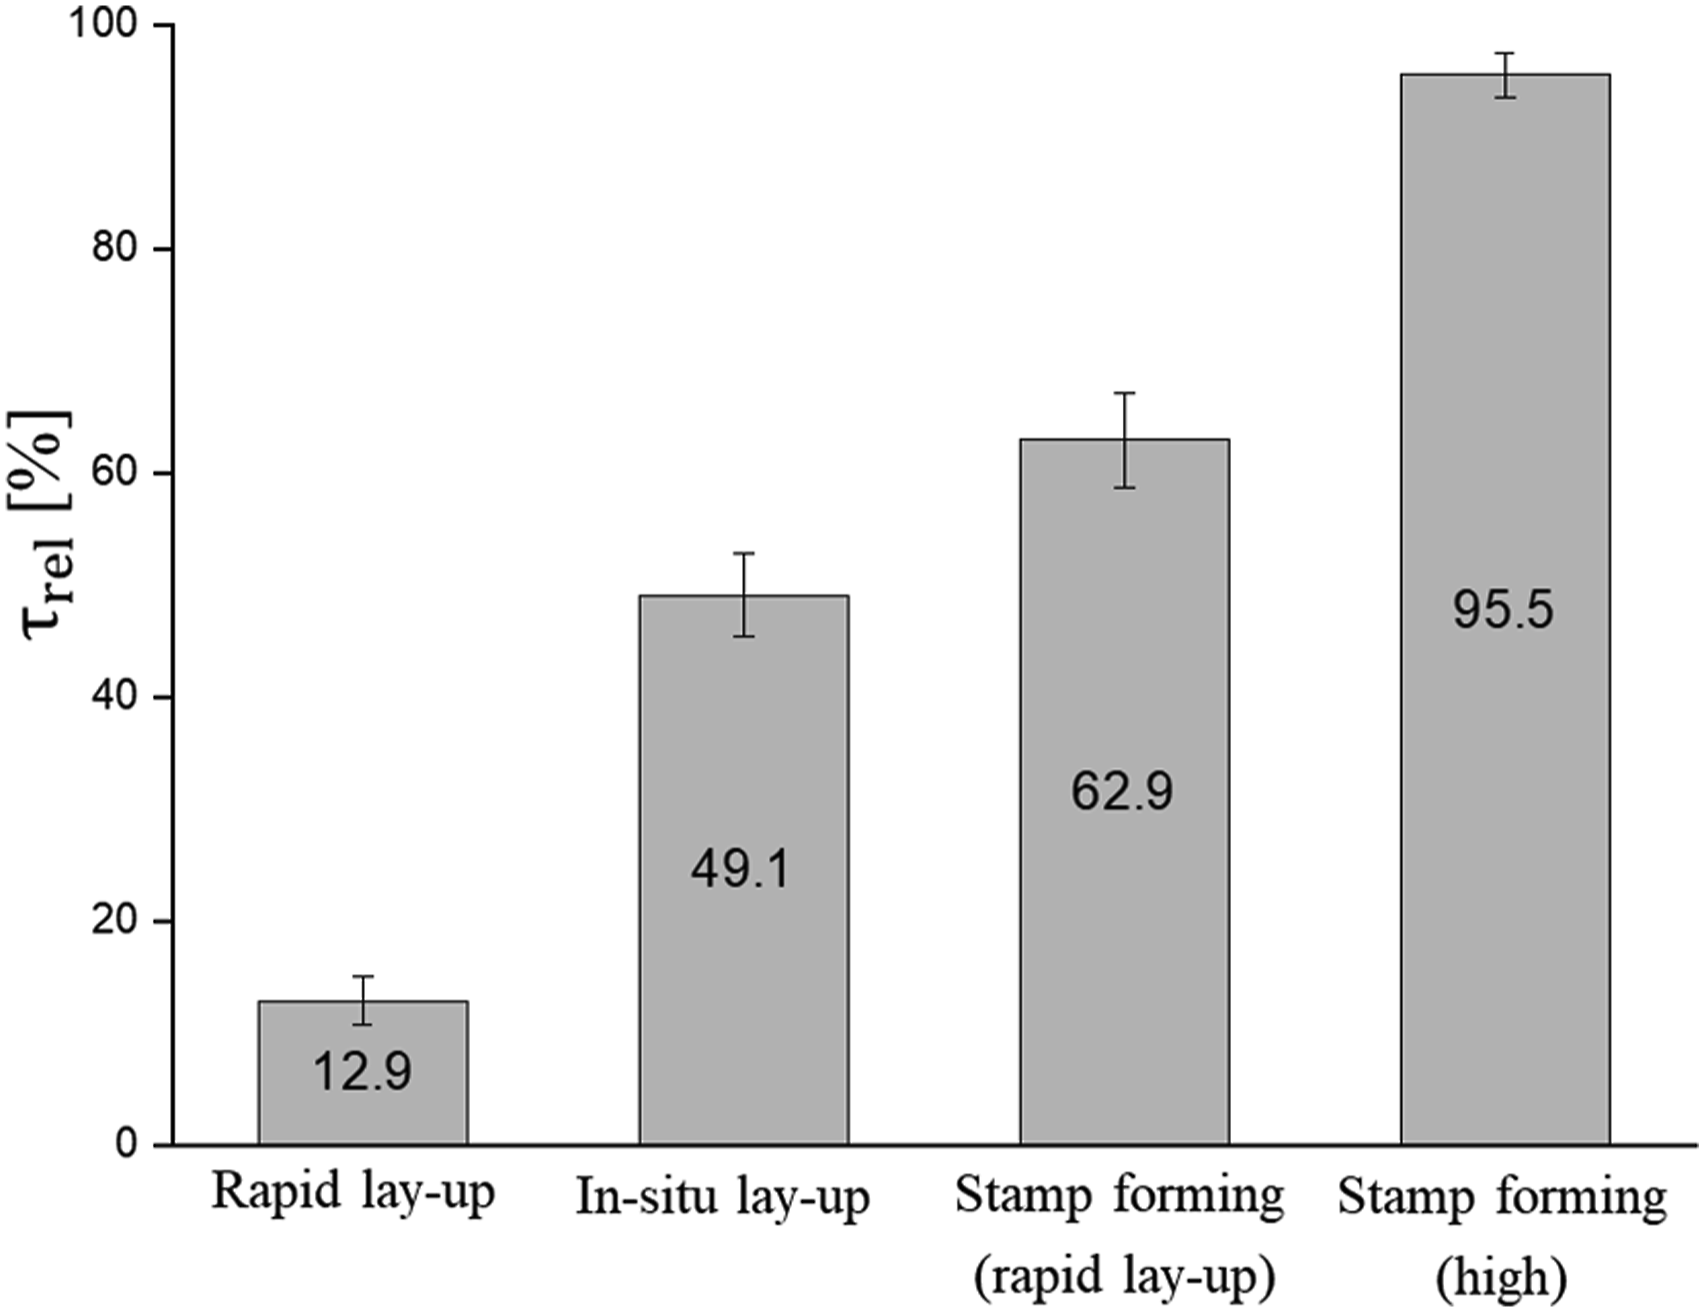
The degree of bonding significantly increases for in situ lay-up compared to rapid lay-up. A degree of bonding of about 49% of press consolidation results can be reached by in situ lay-up. In a recent study by Tehrani et al., 31 it was also found that maximal achievable degree of bonding is limited by in situ lay-up. In this study a bonding strength of about 60 to 70% compared to compression moulded specimens was achieved. 31 Regarding stamp forming, significant differences between the results were also seen. The reason for these differences cannot be stated clearly. The differences could result from the high transfer time and the limited reproducibility of the stamp-forming process. The initial blank quality could also influence the stamp-formed results. For this reason, the results of rapid lay-up configuration with stamp forming and the maximal reached stamp-formed results are shown. The maximal average degree of bonding for stamp forming was reached for the blanks laid with 200 mm/s, a nip-point temperature of 400°C and on a tooling temperature of 240°C. However, the degree of bonding can significantly be increased by stamp forming for the rapid lay-up configuration. It is assumed that for low transfer times, optimised processing conditions and high reproducibility in the stamp-forming process, the maximal reached results of about 95% can be obtained.
Conclusion and outlook
The influence of lay-up speed, nip-point temperature and tooling temperature as process parameters on the laminate quality of coupon plates produced by the T-AFP process was evaluated within the scope of the present study. Statistical analysis of the results allowed correlations to be derived. It was found that the tooling temperature significantly influences the achievable degree of crystallinity. Crystallinities of more than 25% were achieved with tooling temperatures close to the crystallisation temperature. However, higher tooling temperatures can promote the development of porosities. A significant increase in the degree of area porosity was observed for tooling temperatures close to maximal crystallisation temperature. According to this study, it is considered that an optimum tooling temperature in terms of achieving a high degree of crystallinity and low degree of porosity is between the glass transition and crystallisation temperature.
The lay-up speed and the nip-point temperature were found to have a significant influence on the degree of porosity and the degree of bonding. An increase in the lay-up speed from 80 mm/s to 400 mm/s led to a significantly increased degree of area porosity and, consequently, to a significant reduction of the degree of bonding. With regard to the influence of the lay-up speed, this finding is somewhat contrary to other studies in which no significant correlation between lay-up speed and the degree of bonding achieved for the investigated material was found.13,17 A recent study by Tehrani et al. on the other hand also showed a reduction of the bonding strength with increasing lay-up speed. 31 The positive influence of the nip-point temperature is in line with the published studies.
Based on the results, it was possible to derive regression models which describe the influence of the process parameters on the individual evaluation criteria with a partially high prediction quality. The derived models enable a prediction of the consolidation quality of laminates in dependence on the defined process parameters for the investigated parameter ranges. Only in relation to the degree of porosity did the derived model fail to show a sufficiently high prediction quality. This is attributed to the observed strong fluctuations of the area porosity within cross-sections and between cross-sections. Furthermore, based on the results and the definition of quality limits, a distinction could be made between in situ and rapid lay-up. The defined quality limits could only be achieved for low lay-up speeds of 80 mm/s, a tooling temperature of 160°C and a nip-point temperature of 470°C. However, it must be considered that the degree of bonding, as evaluated by the apparent interlaminar shear strength, was below 50% with respect to the reference produced by press consolidation.
The potential of the process chain consisting of rapid lay-up and stamp forming for producing high-quality laminates was demonstrated for the investigated LM-PAEK tape. It was found that a significant increase in consolidation quality is possible. In particular, the degree of porosity could be reduced to below 1% independent on initial blank quality. The bonding degree could be significantly increased to over 95% of the reference value. However, the strong fluctuations in the results for degree of bonding must be mentioned. The reason for these strong fluctuations cannot be clearly stated. Thus, the influence of initial blank quality cannot be excluded.
In summary, the study contributes to the fundamental understanding of the influence of the process parameters on the consolidation quality for the carbon fibre-reinforced low-melt polyaryl ether ketone (LM-PAEK) tape material used. Furthermore, with the derived regression model, a possibility for predicting the consolidation quality in dependence on the defined process parameters was shown. In further investigations, other high-performance thermoplastic tape materials will be investigated to analyse the effect of tape characteristics on thermoplastic AFP process. Moreover, concepts for optimising the in situ lay-up, particularly concerning the degree of bonding, are to be investigated, and the results of this study transferred to more complex lay-up geometries like steered lay-up trajectories and complex three-dimensional parts.
Footnotes
Acknowledgements
The authors would like to acknowledge the financial support for this study from the German Federal Ministry for Economic Affairs and Climate Action within the Aeronautical Research Programme (Luftfahrtforschungsprogramm LuFo VI-1. Call) under grant agreement No 20W1915F.
Declaration of conflicting interests
The author(s) declared no potential conflicts of interest with respect to the research, authorship, and/or publication of this article.
Funding
The author(s) disclosed receipt of the following financial support for the research, authorship, and/or publication of this article: This study is supported by German Federal Ministry for Economic Affairs and Climate Action; 20W1915F.