
Abstract
Objective
This study was designed to test if multidetector computed tomography-derived epicardial fat parameters like epicardial fat volume, thickness, and attenuation can predict obstructive coronary artery disease in a South Indian Population.
Methods
All 60 patients underwent a coronary angiogram using 128-slice multidetector computed tomography. Computed tomography coronary angiogram studies were evaluated for coronary artery calcium score, presence of plaque, type of plaque, epicardial fat volume, and degree of coronary stenosis.
Results
60 patients had a mean age of 51.7 ± 11.4 years. Obstructive coronary artery disease (≥50% luminal narrowing) was found in 91.7% of males. Various risk factors for coronary artery disease were diabetes mellitus (40%), hypertension (55%), hyperlipidemia (58.33%), smoking (15%), and body mass index >25 (41.67%). These risk factors were higher in the “obstructive coronary artery disease” group than in the “no/non-obstructive coronary artery disease” group, with a statistically significant correlation. Mean epicardial fat volume for the studied population was found to be 114.26 ± 45.68 cm3 with values ranging from 38.55 cm3 to 270.08 cm3. The mean epicardial fat volume of “obstructive coronary artery disease” group was found to be higher, that is, 137.69 ± 29.44 cm3 compared to “no/non-obstructive coronary artery disease” group, which was 108.4 ± 47 cm3, showing a statistically significant correlation (P = .046). Multiple variables showed a positive correlation of epicardial fat volume with the increasing degree of coronary artery stenosis. Epicardial fat volume demonstrated a statistically significant correlation with age (P = .007), hypertension (P = .001), hyperlipidemia (P = .034), smoking (P = .002), and body mass index (P < .001). Epicardial fat volume also showed a statistically significant correlation with the epicardial mesenteric fat area (P < .001), calcium score (P = .048), and epicardial fat thickness (P < .001). An increase in epicardial fat volume was observed with higher calcium score categories, showing a statistically significant correlation (P = .02). Based on the receiver operating characteristic curve, an optimal cutoff value of >110.48 cm3 was obtained, which shows a sensitivity and specificity of 91.67% and 60.42%, respectively. Epicardial fat volume (multidetector computed tomography) is a significant imaging biomarker for predicting obstructive coronary artery disease with a cutoff value of >110.48 cm³ for differentiating.
Keywords
Introduction
An increase in epicardial adipose tissue (EAT) parameters, measured with either echocardiography or computed tomography (CT) scan, was reported to correlate with presence of significant obstructive coronary artery disease (CAD), left ventricular mass, and metabolic syndrome by various authors.1-7 However, these are not well validated in the population in this part of the country. The aim of our study was to assess the evaluability of multidetector computed tomography (MDCT)-derived epicardial fat parameters like epicardial fat volume (EFV), thickness, and attenuation as important imaging biomarkers for the prediction of obstructive CAD in South Indian population.
Methods
This prospective observational study was conducted from March 2023 to September 2024 after the approval of the Institutional Ethics Committee. The study enrolled 60 patients who were referred for evaluation of chest pain and/or dyspnea with clinical suspicion of having CAD. All patients underwent coronary angiogram using 128-slice multidetector CT in our department. Exclusion criteria included those who had prior CABG or coronary angioplasty, those with atrial fibrillation, sick sinus syndrome, or atrioventricular block beyond the first degree, persistent heart rate >65 bpm despite beta-blocker therapy, renal disease or other conditions predisposing to contrast-induced nephropathy, hypersensitivity to iodine-based contrast agents, hypothyroidism, and contraindications to beta-blockers such as severe chronic obstructive pulmonary disease, asthma, second or third-degree heart block, or systolic blood pressure ≤100 mmHg.
The images were obtained using standard protocols on a 128-slice MDCT (Soma tom Definition AS+/Siemens Healthcare Solutions, Germany) system. Computed tomography coronary angiogram studies were evaluated for coronary artery calcium (CAC) score, presence of plaque, type of plaque (calcified/noncalcified), EFV, and degree of coronary stenosis. Patients were divided into two groups based on the degree of stenosis measured as mentioned above: Group 1: no/non-obstructive atherosclerosis (luminal narrowing <50% in diameter). Group 2: obstructive atherosclerosis (luminal narrowing ≥50%).
Calculating the EFV: The non-contrast images for calcium scoring were scrolled through the slices in a transverse view from the pulmonary artery bifurcation to the apex of the heart for manually tracing the pericardium. After the pericardial tracing, the software automatically interpolates the user-defined traces, and the volume is calculated as the summation of the areas adjusted for the intersection gap. The volume thus obtained includes all structures within the pericardium, such as epicardial fat, myocardium, and the cardiac chambers. To specifically quantify the epicardial fat, CT attenuation thresholds between −190 and −30 Hounsfield units (HU) were used to select the epicardial fat and exclude other tissues from volume quantification. The resultant volume obtained is the total EFV (Figures 1-3).
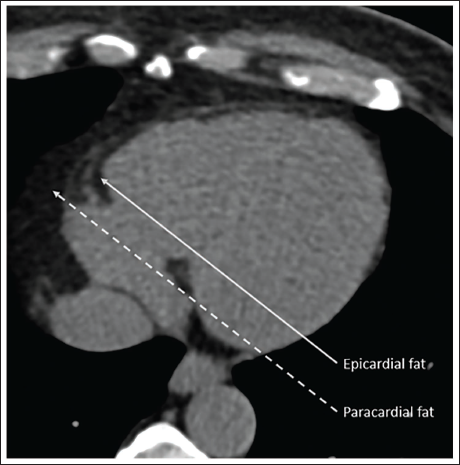
Notes: (a) Epicardial fat (arrow) refers to the adipose tissue found between the myocardium and the visceral pericardium. (b) Paracardial fat (dotted arrow) is the fatty tissue located in the mediastinum outside the parietal pericardium.
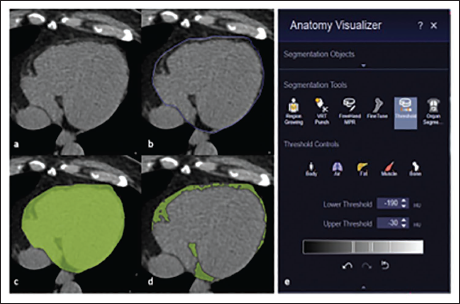
Notes: (a) Identification of the pericardium, which distinguishes paracardial fat from epicardial fat, (b) manual tracing of the pericardial contour on the axial images, (c) selection of the area enclosed by the user-defined trace, (d, e) the software detects all pixels within the volume of interest between −190 HU and −30 HU as epicardial fat (highlighted in green in d) and automatically calculates the volume and mean attenuation, measured in cubic centimeters and HU, respectively.
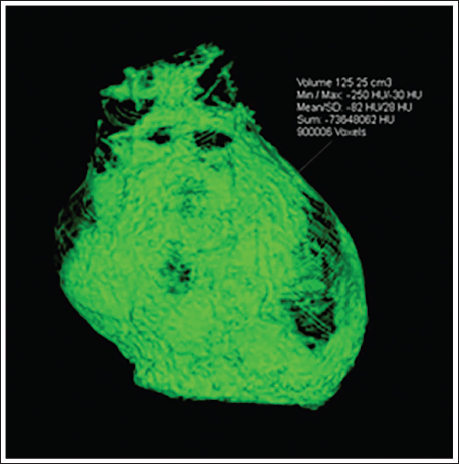
In the Same Case, After Performing a 3-dimensional Reconstruction, the Epicardial Adipose Tissue Volume Was Determined by Summing All the Pixels Identified as Fat.
Calculation of epicardial fat thickness: Epicardial fat thickness was assessed on a single axial slice at two distinct locations: one at the atrioventricular groove at the mid-level of the right coronary artery (RCA), and the second adjacent to the left anterior descending coronary artery (LAD). The maximal thickness was determined by measuring from the myocardium to the visceral pericardium, perpendicular to the heart’s surface. The two measurements obtained were divided by two to obtain the mean epicardial fat thickness (Figure 4).
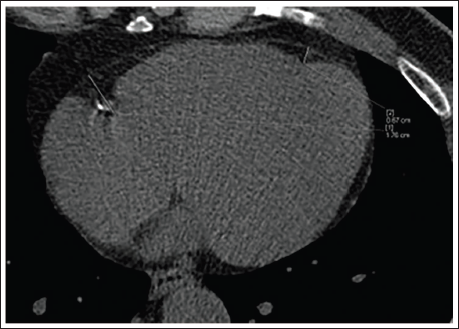
Note: Two measurements were taken, one at the atrioventricular groove at the mid-level of the right coronary artery and adjacent to the left anterior descending coronary artery.
Epicardial fat attenuation: The mean fat attenuation in epicardial fat typically involves measuring the average HU of the adipose tissue within the epicardial fat. The CT images in thin axial slices are used for calculating the mean epicardial fat attenuation. After selecting the region of interest (ROI) by manually tracing the pericardium to isolate the epicardial fat. An HU threshold ranging from −30 to −190 is applied to differentiate fat from other tissues. Using this threshold, the epicardial fat is segmented, and the mean attenuation is calculated by averaging the HU values of all voxels within the segmented fat area. The result is the mean fat attenuation, representing the average density of the EAT.
Statistical analysis was done using Microsoft Excel. All the statistical data were fed to the computer and analyzed using the IBM SPSS software package, version 20.0. Normality of the variables was evaluated. Data were presented as mean ± standard deviation for normally distributed data, median (interquartile range) for non-normally distributed data, and as percentages for nominal and categorical data. Quantitative variables were analyzed using the Student’s t-test, and qualitative variables were analyzed with the Chi-square test. The correlation between the sets of data will be done by Pearson’s correlation coefficient. A P value of less than .05 will be considered significant.
Results
Our study group consisted of 60 patients with a mean age of 51.7 ± 11.4 years, and M:F ratio was 7:3. Obstructive CAD (≥50% luminal narrowing) was found in 91.7% of males. In our study, the majority of patients, 46 patients (76.66%), exhibited right dominant circulation, followed by 10 patients (16.66%) with left dominance and four patients (6.67%) with codominance. Various risk factors for CAD were diabetes mellitus (40%), hypertension (55%), hyperlipidemia (58.33%), smoking (15%), and obesity (BMI >25; 41.67%). These risk factors were higher in the “obstructive CAD” group than the “no/non-obstructive CAD” group, with a statistically significant correlation for DM (P = .006), hypertension (P = .004), and high BMI (P = .027). The mean BMI in the “no/non-obstructive CAD” group was found to be 23.99 ± 2.63 and 25.87 ± 2.26 in the “obstructive CAD” group.
Mean EFV for the studied population was found to be 114.26 ± 45.68 cm3 with values ranging from 38.55 cm3 to 270.08 cm3. The mean EFV of “obstructive CAD” group was found to be higher, that is, 137.69 ± 29.44 cm3, compared to “no/non-obstructive CAD” group, which was 108.40 ± 47 cm3, showing a statistically significant correlation (P = .046). In obese patients, it was found that EFV was significantly higher, with a P value of .001. Multiple variables showed a positive correlation of EFV with the increasing degree of coronary artery stenosis. Regarding traditional risk factors, EFV demonstrated a statistically significant correlation with age (P = .007), hypertension (P = .001), hyperlipidemia (P = .034), smoking (P = .002), and body mass index (BMI) (P < .001). However, no statistically significant correlation was found with gender and diabetes mellitus, even though higher mean EFV was observed in males, diabetics, and those who consumed alcohol (Table 1). Epicardial fat volume also showed a statistically significant correlation with the epicardial mesenteric fat area (EMFA) (P < .001), calcium score (P = .048), and epicardial fat thickness (P < .001).
The Observed Frequencies of Patients with Non-obstructive Coronary Artery Disease and Obstructive Coronary Artery Disease within Each Calcium Score Range, along with the Expected Frequencies and Chi-square Contributions in Parentheses and Brackets, Respectively.
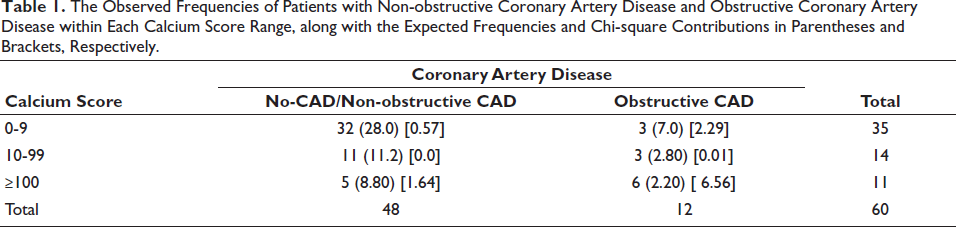
Epicardial fat volume was compared across three categories of Agatston calcium scores: 0-9, 10-99, and ≥100. The mean ± SD EFV values were 104.53 ± 47.24 cm³, 112.42 ± 35.61 cm³, and 147.58 ± 38.95 cm³, respectively. An increase in EFV was observed with higher calcium score categories, showing a statistically significant correlation (P = .02) (Table 1).
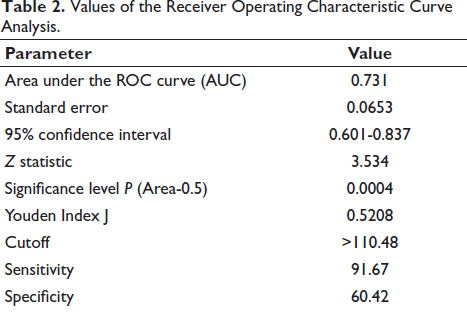
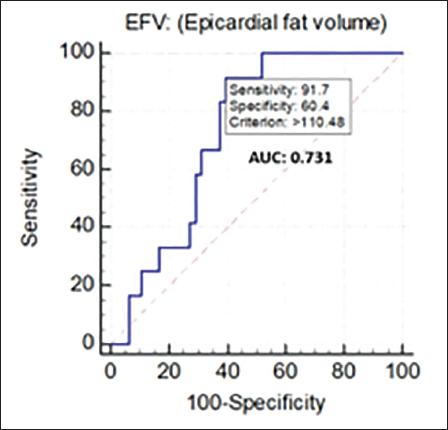
Receiver operating characteristic (ROC) curve analysis was performed for determining an optimal cutoff value of EFV for distinguishing the presence of “obstructive CAD” from the “no/non-obstructive CAD” group. The ROC analysis curve is plotted in Figure 5. An area under the ROC curve of 0.731 was obtained, which indicates that the EFV has a good ability to distinguish between the two groups. A standard error of 0.0653 obtained indicates that the average EFV value calculated from the sample data is expected to deviate from the true population mean by approximately 0.0653 units. A smaller standard error suggests a more precise estimate of the population mean. Based on the ROC curve, an optimal cutoff value of >110.48 cm3 was obtained, which showed a sensitivity and specificity of 91.67% and 60.42%, respectively, with a Youden index of 0.5208, suggesting a reasonable balance between sensitivity and specificity at this cutoff value. The diagnostic utility of the cutoff value was confirmed by a P value of .0004 (Table 2).
Values of the Receiver Operating Characteristic Curve Analysis.
The analysis of epicardial fat thickness within the patient population revealed a mean value of 1.08 ± 0.20 cm. Notably, the mean epicardial fat thickness was significantly higher in the “obstructive CAD” group compared to the “no/non-obstructive CAD” group, with measurements of 1.21 ± 0.129 cm and 1.05 ± 0.20 cm, respectively (P = .011). Additionally, a statistically significant increase in mean epicardial fat thickness was observed in obese patients compared to non-obese patients (P = .001).
The comparison of epicardial mean fat attenuation values between the “no/non-obstructive CAD” and “obstructive CAD” groups revealed no statistically significant correlation (P = .286), with mean values of −74.54 ± 9.13 HU and −77.42 ± 2.19 HU, respectively. Conversely, a statistically significant correlation (P = 0.033) was identified between epicardial mean fat attenuation and obesity status. The “obese” group exhibited a mean EMFA of −77.80 ± 9.02 HU, whereas the “non-obese” group had a mean EMFA of −73.20 ± 7.25 HU, indicating a decrease in epicardial mean fat attenuation values in the “obese” group compared to their non-obese counterparts.
Discussion
Echocardiographic and CT-scan-based studies have demonstrated that EFV was associated with increased CAD risk and can predict the severity of CAD.1-7 Our study aligns with these findings, revealing a statistically significant association between EFV and obstructive CAD, further supporting the role of EFV as a promising predictive biomarker. We found that traditional risk factors like DM, hypertension, hyperlipidemia, smoking, alcohol consumption, and obesity (defined by a BMI of ≥25 kg/m2) were more prevalent in the “obstructive CAD” group compared with that of “no/non-obstructive CAD” group. Statistically significant correlation was found for DM, hypertension, alcohol consumption, and BMI between the two groups. We found a statistically significant correlation between the two groups, with a higher calcium score in the “obstructive CAD” group. The number of patients having “obstructive CAD” doubled in the calcium score of more than or equal to 100 when compared to calcium score categories of 0-9 and 10-99. The Chi-square analysis showed a statistically significant correlation with P value of .0039. This was in line with previous studies by Taha et al. 8
We sought to establish a threshold EFV value to differentiate between obstructive and non-obstructive CAD. Employing ROC curve analysis, we determined an optimal EFV cutoff of 110.48 cm³, yielding a sensitivity of 91.67% and specificity of 60.42% in differentiating between the two groups. At this cutoff value of EFV, our study demonstrated a Youden index of 0.5208, indicating a reasonable balance between sensitivity and specificity. The diagnostic effectiveness of this cutoff was validated by a P value of .0004. Khurana et al. also sought to establish an optimal EFV threshold to differentiate between obstructive and non-obstructive CAD. Their analysis determined a cutoff value of 67.69 cm³, yielding sensitivity and specificity rates of 64.9% and 66.4%, respectively. This threshold was notably lower than those reported in other studies. The authors attributed this disparity to methodological variations in EFV quantification and differences in patient cohorts. 3 In their study conducted in 120 patients, Taha et al. detected a significant difference in EFV between patients with negative and positive CTAs for CAD. They identified an EFV greater than 124 cm³ as the optimal cutoff value, with a sensitivity of 78.57% and a specificity of 72.73% for detecting positive CTA patients. 8
In our study, we found that a statistically significant positive correlation is present between EFV and traditional risk factors like age (P = .007), hypertension (P = .001), hyperlipidemia (P = .034), smoking (P = .002), and BMI (P < .001). This finding was consistent with the previous study done by Taha et al. 8 where they found EFV showing significant correlation with dyslipidemia, hypertension, BMI, and calcium scores. Though higher EFV values were seen in male population in our study, a statistically significant correlation could not be ascertained. However, Taha et al. found a correlation of EFV with gender. They found a significant correlation between EFV and factors such as gender distribution, dyslipidemia, hypertension, and BMI. There was a strong positive correlation between EFV and calcium score, as well as a significant correlation between EFV and the degree of stenosis. Additionally, EFV was significantly correlated with all plaque types (soft, mixed, and calcified), without a specific preference for any particular type of plaque. Regarding segment involvement stenosis, they found that the mean cumulative EFV was significantly higher in patients with ostial and ostio-proximal LAD lesions, mid-segment LAD lesions, and mid-segment LCx lesions. 8 Our findings were further corroborated by the study of Alexopoulos et al., which found that EAT volume correlated with age, height, BMI, and CAC score and degree of stenosis. They also observed that EAT volume was significantly larger in patients with mixed or noncalcified plaques compared to those with calcified plaques or no plaques. 5
The epicardial mean fat attenuation values calculated in MDCT coronary angiogram in our study showed no statistically significant correlation between the “no/non-obstructive CAD” and “obstructive CAD” groups. Pandey et al. commented that some studies, including their own, indicated that lower attenuation values of epicardial fat are associated with coronary calcification, elevated serum levels of plaque inflammatory markers, and major adverse cardiac events. Conversely, a few other studies have found that higher fat attenuation is linked to a worse CAD profile and adverse cardiac events. Pandey et al. have also found in their study that EFV did not show any correlation with CAD, however, epicardial fat attenuation did. 9
Our study found that the mean epicardial fat thickness was significantly higher in the “obstructive CAD” group compared to the “no/non-obstructive CAD” group, showing statistical significance. This finding was in line with the previous study by Farag et al., which showed that the obstructive group had significantly higher mean epicardial adipose tissue thickness (EATT) and pericoronary fat thickness (PCFT) values than the non-obstructive and non-atherosclerotic groups. 10
Limitations
The small sample size of subjects in this study may limit the generalizability of the results, and as it was conducted at a single center using a specific cardiac scanner and software package. Further validation with different equipment and analysis tools is warranted. The findings may not be directly applicable to other ethnic populations.
Conclusion
This study has successfully highlighted the role of EFV, thickness, and attenuation measured by MDCT as significant imaging biomarker for predicting obstructive CAD. A cutoff value of >110.48 cm³ for differentiating obstructive CAD from non-obstructive cases, with high sensitivity (91.67%) and moderate specificity (60.42%), has been observed. This finding has a potential value in clinical practice for predicting the presence and severity of obstructive CAD.
Footnotes
Declaration of Conflicting Interests
The authors declared no potential conflicts of interest with respect to the research, authorship, and/or publication of this article.
Ethics Statement
The institutional ethics committee approval was obtained for the conduct of the study. Individual patient consent was not relevant as we had taken the existing data from hospital records after the authorities’ approval.
Funding
The authors received no financial support for the research, authorship, and/or publication of this article.