
Abstract
Assessment of thiopurine S-methyltransferase (TPMT) status is required before commencing thiopurine treatment to reduce the potential for adverse drug reactions. Our laboratory has provided a national TPMT phenotyping service since 2003. Our assay uses 6-thioguanine as substrate and detection of 6-methylthioguanine via high-performance liquid chromatography (HPLC) fluorescence. Here, we report the automation of this complex, labor-intensive, manual assay using the Biomek NXP and Biomek i5 liquid-handling workstations. We optimized assay performance and validated for precision, linearity, and lower limit of quantitation. We also compared results from the manual and automated methods. Primary sample mixing and aliquoting were performed on the Biomek NXP. On-board inversions (n = 10) replaced offline mixing. No carryover was observed. Eleven percent of primary sample tubes were incompatible with the Biomek NXP, and these were assayed manually. The Biomek i5 was used to automate the enzyme assay. Optimum vortex mixing was achieved at 2500 rpm for 60 s, and the temperature was set to 37.0 °C for the 60 min enzyme incubation. Intra- and inter-assay precision were excellent, with coefficients of variation (CVs) of ≤2.3% and ≤7.4%, respectively, for patient samples. Linearity was demonstrated up to 199 mIU/L (R2 = 0.992), with a lower limit of quantitation of 3.9 mIU/L. Correlation between the manual and automated methods was good (R2 = 0.979, n = 405), with results being interchangeable. We have successfully developed and validated a novel automated method for the TPMT phenotyping enzyme assay. The two methods are cost-neutral. Automation of other complex enzyme assays may be possible using this approach.
Introduction
Clinical guidelines advocate the assessment of thiopurine S-methyltransferase (TPMT) status before initiation of thiopurine drugs (azathioprine, mercaptopurine, and thioguanine).1–4 These drugs act as immunosuppressive antimetabolites and are used to treat various malignancies and autoimmune conditions, and to prevent solid organ transplant rejection. TPMT phenotyping allows tailored prescribing to maximize efficacy and minimize the risk of toxicity, because one in 10 individuals have low TPMT activity and one in 300 individuals are completely deficient.5,6 The biochemistry laboratory at Sandwell & West Birmingham Hospitals NHS Trust (SWBH), now part of the Black Country Pathology Services (BCPS), established the TPMT service in 2003. 7 Our laboratory is the largest TPMT service provider in the United Kingdom and currently processes more than 36,000 samples per year using a manual TPMT phenotyping assay as previously described.6,7 We consider it necessary to automate this complex laboratory procedure to cope with current workload and future growth, maintain a one-working-day turnaround, and improve overall service quality.
Automation has been adopted by routine clinical laboratories since the 1950s to improve key performance metrics and manage growth in demand.8–10 The use of robotic workstations to perform liquid handling was first described in the 1980s and driven forward by the pharmaceutical industry in the 1990s. 11 Their use in the clinical laboratory is particularly dominant in the field of genomics and proteomics.12,13 In clinical biochemistry, outside of the high-throughput routine laboratory, the adoption of automation has been relatively limited, in part due to relatively low workloads. Furthermore, the complexity of specialist chemistry assay sample preparation may have also exceeded the capability of early liquid-handling workstations. Today’s equipment, however, can perform much more than just basic pipetting and includes modules for light- and temperature-controlled incubations, mixing, centrifugation, and microplate reading. 14
To capitalize on such developments in automated liquid handling, the BCPS TPMT laboratory procured the Biomek NXP and Biomek i5 workstations (Beckman Coulter, High Wycombe, UK) to automate the majority of the steps of the TPMT phenotyping assay. The potential benefits of automation of our TPMT phenotyping assay include increased throughput, less hands-on staff time, and improved quality of results. All of this aims to deliver significant improvements to our TPMT service and ensure it can cope with future demand.
Materials and Methods
Materials
S-adenosyl-L-methionine chloride (SAM), L-tryptophan (≥98%), 2-amino-6-methylmercaptopurine (6-MTG; ≥95%), sodium hydroxide (NaOH; ≥98%), and glycerol (≥99.0%) were purchased from Sigma Aldrich (Dorset, UK). 6-thioguanine (6-TG; 98%) was obtained from Alfa Aesar (Heysham, UK). Potassium phosphate monobasic (KH2PO4) and dibasic (K2HPO4) (≥98%) were obtained from Honeywell Fluka (Bucharest, Romania). High-performance liquid chromatography (HPLC)-grade acetonitrile and tetrahydrofuran were purchased from Rathburn (Walkerburn, Scotland). 0.9% saline was supplied by Roche (Burgess Hill, UK), and 18.2 MΩ.cm ultrapure water was obtained using the Milli-Q (Millipore, Watford, UK).
Preparation of all reagents, including mobile phase, whole-blood suspension buffer (WBSB), and test reagent (TR), was performed as described previously.6,7 WBSB consisted of 0.01% (w/v) L-tryptophan internal standard (IS) in 0.1 M phosphate buffer, pH 7.4. TR was composed of 120 mg/L 6-TG substrate and 60 mg/L SAM co-factor in 0.1 M phosphate buffer, pH 7.4. Surplus patient samples received from laboratories across the United Kingdom for routine TPMT analysis were used for the validation. Samples were received in primary tubes containing ethylenediaminetetraacetic acid (EDTA) anticoagulant and stored at 4 °C between analyses. Whole-blood pools were obtained by combining surplus patient samples known to have TPMT activity at the level of interest. Red-dye solutions were prepared using PME Red concentrated natural food coloring (cochineal E120, curcuma extract; Knightsbridge PME, Enfield, UK) at a concentration of 0.2% (v/v). For the Biomek NXP pipetting steps, the red-dye solution was prepared in a blood analogue solution using 36.6% (v/v) glycerol in 0.9% saline to replicate the viscosity of whole blood.15,16 For the Biomek i5 pipetting steps, red dye was added to 0.1 M potassium phosphate buffer, pH 7.4. A red-dye solution was also prepared in 0.9% saline.
The following consumables were supplied by Beckman Coulter: square and round nonsterile polypropylene 96-well deep-well plates (SQ-96DWP and RO-96DWP, respectively), 230 µL and 1070 µL nonsterile i-Series pipette tips, a microfuge 24-position tube rack holder with 1 mm inserts, Teflon-coated fixed tips (100 mm), SeptaFluted stainless-steel fixed tips (120 mm), and sample racks (13×75 mm, 13×100 mm, and 16×100 mm). MicroClime environmental microplate lids for use on the Biomek i5 were supplied by Labcyte (Cannock, UK). SILVERseal pierceable sealing film and polypropylene deep-well flat-bottomed microplates (392 µL) were purchased from Greiner Bio-One (Stonehouse, UK).
Biomek Configuration
A Biomek NXP Span-8 with gripper and integrated automated tube barcode reader (ATBCR) was used for primary sample mixing and aliquoting. The Span-8 pod probes were fitted with four Teflon-coated fixed tips and four SeptaFluted stainless-steel tips. A Span-8 active wash kit and barcode reader were also installed. A Biomek i5 Multichannel workstation with enclosure was used for the TPMT enzyme reaction steps. The Biomek i5 was configured with a 96-multichannel (MC) pipetting head (5–1200 µL), a gripper tool, and a barcode reader. Peltier control was provided by INHECO (Martinsried, Germany), with temperatures maintained at 46.5 °C, 95 °C, and 4 °C for Peltier units 1, 2, and 3, respectively. Peltier units 2 and 3 were also fitted with aluminum 96-DWP (deep-well plate) adapters. Also installed was a BioShake 3000 elm (Quantifoil Instruments, Jena, Germany) (BioShake2) for vortex mixing and a BioShake 3000-T elm with an Eppendorf 96-DWP adapter (Quantifoil Instruments) (BioShake1) maintained at 37.0 °C by a Peltier unit for incubation during enzyme reaction. A trash container was fitted for disposal of tips. Remote access and control of the analyzers were provided by Biomek Software, versions 4.1 and 5.1.9 for the Biomek NXP and Biomek i5, respectively. The Biomek NXP and Biomek i5 configuration and starting deck layout are shown in Figure 1 .
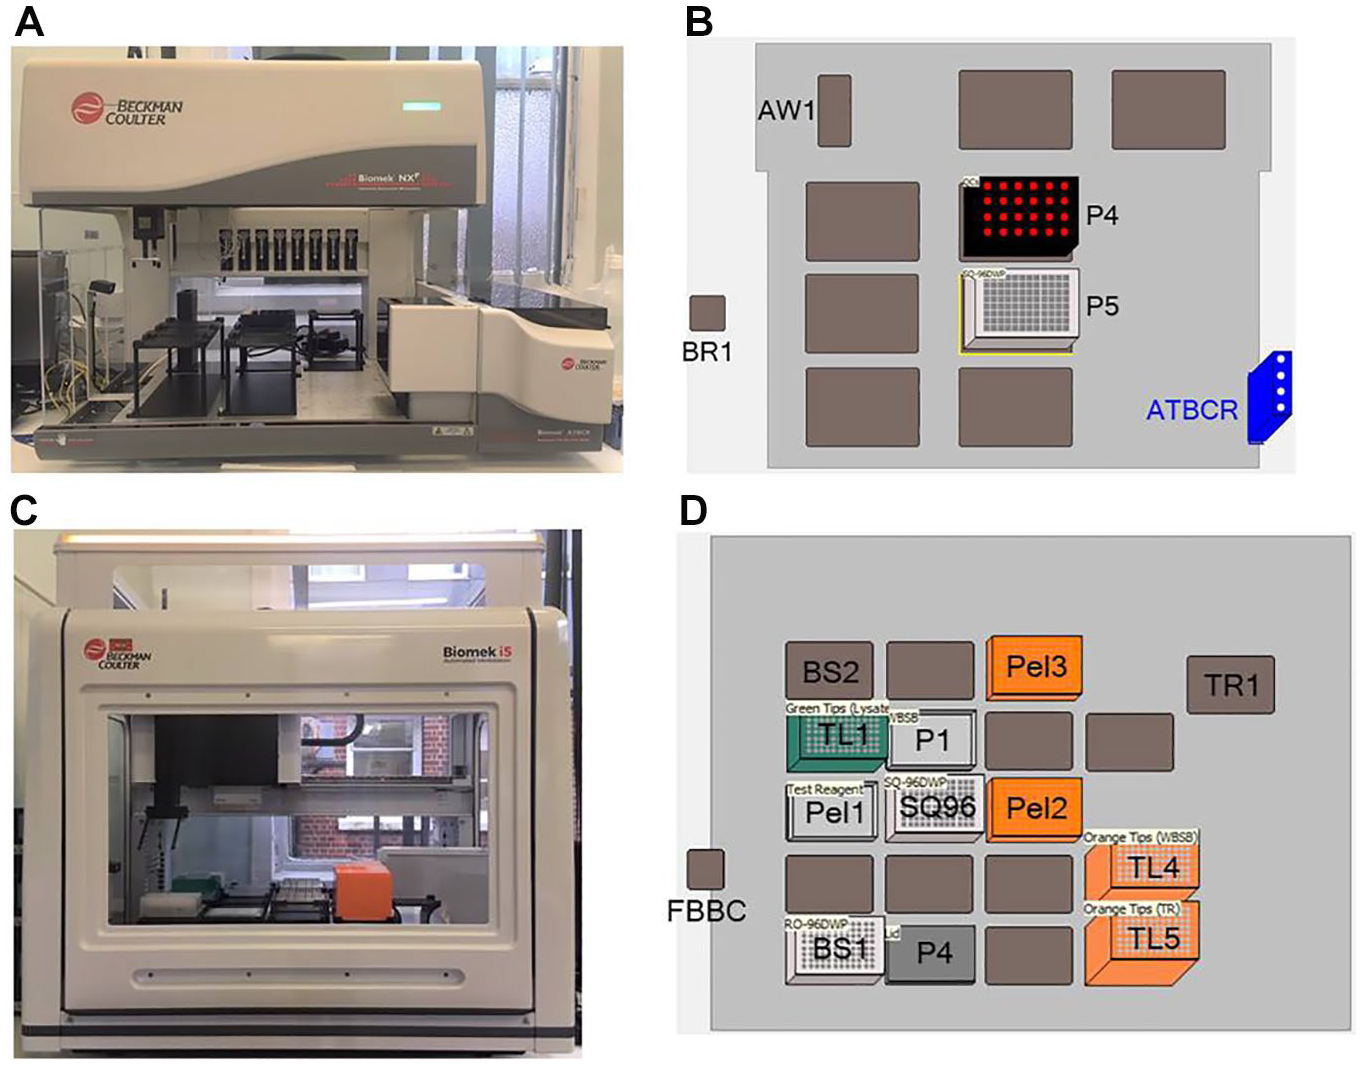
Biomek NXP and Biomek i5 configuration. (
Manual Method
Manual sample extraction for TPMT activity was performed as described previously.6,7 In brief, whole-blood samples were mixed on a rotator mixer for at least 5 min. 200 µL whole blood was pipetted into a test tube, and aliquots were incubated at −80 °C for 15 min. 700 µL WBSB was added to the frozen aliquots, and the lysates were allowed to thaw for a minimum of 10 min. 200 µL lysate–WBSB was then transferred into glass vials. TR was quickly defrosted and warmed to 37.0–37.5 °C in a water bath, and 500 µL TR was added to each vial. Vials were capped and incubated in a dry block heater at 37 °C for 60 min. Vials were then transferred to a 95 °C dry block heater for 10 min before being placed in cold tap water (approximately 15–20 °C) for an additional 10 min to cool. Vials were centrifuged at 4500 revolutions per minute (rpm) [2260 relative centrifugal force (rcf)] for 11 min and then loaded onto the HPLC analyzer.
Automated Method
Compatible primary sample tubes were loaded onto the ATBCR. Rack and sample barcodes were read before primary sample tubes were mixed by on-line inversion 10 times. On-line inversion involved tilting the primary sample racks from 0° (vertical) to 135° at 100% ATBCR speed. Span-8 SeptaFluted stainless-steel tips moved into the primary tubes at 20% Span-8 pod speed and aspirated 100 µL whole blood at 10 mm from the bottom of the tube, with leading and trailing air gaps of 10 µL and 1 µL, respectively. Whole blood was dispensed into pre-defined wells of the SQ-96DWP according to the method script, which omitted wells A-1 to E-1, G-3, C-5, E-7, C-10, and F-12 to H-12. Whole blood was dispensed at 1.5 mm from the bottom of the well, with a tip touch −1 mm from the top of the well at 90°. A passive wash of 2 mL and an active wash of 3×200 µL at −75 mm were performed between each rack of samples. Blank (saline), calibrator, and quality control (QC) were aliquoted from Eppendorf tubes loaded on the Biomek NXP deck to the pre-defined positions across the SQ-96DWP, as listed above. Samples were aspirated 3 mm from the bottom of the Eppendorf tubes and dispensed as above. Once pipetting was complete, the SQ-96DWP was covered with Parafilm M film (VWR International, Lutterworth, UK) and placed in the −80 °C freezer for a minimum of 45 min.
The SQ-96DWP was removed from the freezer and placed on the Biomek i5, and 350 µL WBSB was added to each well, except the blank (A-1), using i-Series 1070 µL tips. The analyzer was paused for 45 min to allow the lysate–WBSB to thaw, after which the SQ-96DWP was transferred to the BioShake2 and vortex-mixed at 2500 rpm for 60 s, then 100 µL lysate–WBSB solution was transferred to the equivalent well of a RO-96DWP located on BioShake1 using i-Series 230 µL tips. The analyzer was paused, and TR was quickly defrosted and warmed to 37.0–37.5 °C manually off-line, then 250 µL TR was dispensed into each well of the RO-96DWP using i-Series 1070 µL tips. The lid was added, and the RO-96DWP was incubated on BioShake1 at 37.0 °C for 3600 s before being moved to Peltier 2 (95 °C) and incubated for 600 s. The temperature of Peltier 2 was then reduced to 4 °C, and the RO-96DWP was incubated for a further 200 s. The RO-96DWP plate was then moved to Peltier 3 (4 °C) and incubated for 400 s. Once complete, the RO-96DWP was sealed with film and centrifuged at 2260 ×g for 10 min using a Rotanta 460 benchtop centrifuge (Hettichlab, Tuttlingen, Germany). The RO-96DWP was loaded onto the HPLC for analysis.
Chromatography
For both the manual and automated methods, reverse-phase chromatography was performed using a Prominence-i LC-2030 Plus liquid chromatograph with an RF-20A fluorescence detector (Shimadzu, Milton Keynes, UK). The mobile phase was pumped using isocratic flow at 1.3 mL/min, and 2 µL sample was injected onto a Luna C18(2) column (75×4.6 mm) with a C18 (4×3 mm) SecurityGuard cartridge (Phenomenex, Macclesfield, UK). The column oven temperature was maintained at 25 °C. L-tryptophan IS eluted at approximately 1.45 min and was detected via ultraviolet (UV) absorbance at 267 nm. The enzyme reaction product, 6-MTG, eluted at approximately 2.00 min and was detected via fluorescence detection with excitation and emission wavelengths of 314 nm and 394 nm, respectively. Total run time was 2.75 min. Peak detection and TPMT activity quantitation were performed as described previously.6,7
Method Development and Optimization
The performance of each step of the automated method was assessed and compared to that of the manual method.
Primary Sample Tube Compatibility
We conducted an audit of the range of primary tubes received from referring laboratories to determine the number and frequency of different primary tube types that are received by the TPMT laboratory. For each different primary tube type received, we assessed compatibility with the Biomek NXP racks and the ATBCR.
Pipetting Precision and Accuracy
We assessed pipetting precision and accuracy for each pipetting step using a modified published technique for both the manual and automated methods. 17 In brief, a red-dye solution was pipetted into each well of a flat-bottomed 96-well plate, and the absorbance of each well was read at 492 nm using a Multiskan FC plate reader (Thermo Scientific, Loughborough, UK). Precision was calculated from absorbance readings across the whole 96-DWP, and the acceptance criterion was a coefficient of variation (CV) <3%. For assessment of accuracy, we pipetted a known volume of red-dye solution into wells of the 96-well plate and produced a calibration curve from the resulting absorbance readings. This was then used to calculate the volume in each well, with accuracy deemed acceptable if results were ±10% of the target. Note the acceptability criteria for each pipetting step are more stringent than guidelines, which state <15% and ±15% for precision and accuracy, respectively. 18
On-Board Mixing of Primary Samples
We prepared four pools of whole blood. These were aliquoted and stored upright at 4 °C overnight. Samples from each pool were aliquoted by the Biomek NXP following a number of on-board inversions (n = 0, 1, 2, 3, 5, 10, 15, and 20). In addition, one sample from each pool was mixed off-line and aliquoted as per the manual method. We then performed the TPMT enzyme assay via the manual assay for all aliquots. The number of on-board inversions was deemed adequate if the TPMT activity was within two standard deviations of the offline-mixed result, at a CV of 3%.
Carryover
Four deficient patient samples (TPMT activity <10 mIU/L) and four “high” patient samples (TPMT activity >150 mIU/L) were pipetted in alternating sequence using all four Span-8 probes of the Biomek NXP (n = 9). We reviewed the TPMT activities obtained to assess if any of the deficient samples had TPMT activity ≥10 mIU/L.
Vortex Mixing
We added 450 µL red-dye-colored 0.9% saline to selected wells of a SQ-96DWP. Vortex speed was increased stepwise from 200 to 3000 rpm, and we assessed the height of the liquid in the wells and the extent of the vortex via visual inspection. Optimum speed was determined to be that which ensured complete vortex mixing of the liquid to the bottom of all wells but without any loss of well contents.
BioShake1 Incubation Temperature
We assessed the temperature profile of selected wells of the RO-96DWP (F-1, B-3, D-5, F-7, and A-10) using a modified lid to allow a Traceable RTD platinum thermometer PT-1000 (Fisher Scientific, Loughborough, UK) to access the well contents. The complete Biomek i5 method was run with patient samples, and we recorded the temperature of the well contents sequentially for the three incubations on BioShake1, Peltier 2, and Peltier 3. In a different experiment, we added 350 µL water to each well of an RO-96DWP and allowed it to equilibrate on BioShake1 at 37.0 °C for 30 min. We then measured the temperature of every well in duplicate using the PT-1000 thermometer. The BioShake1 temperature was optimized by performing the automated method on the same batch of patient samples three times (n = 84), with the BioShake1 temperatures set at 36.5 °C, 37.5 °C, and 38.5 °C. We compared the TPMT results from the automated method to the manual method to determine which incubation temperature demonstrated the best correlation and agreement.
Method Validation
We performed the method validation with reference to published guidelines. 18
Precision
We assessed intra- and inter-assay precision of the automated method using four whole-blood pools, which were aliquoted by the ATBCR 12 times within a single batch and 10 times across consecutive batches, respectively. Total CV was calculated for both methods as the root sum square of the CVs for each pipetting step. The precision of sampling from the Biomek NXP deck was assessed using calibrator and QC (lots DO10, AF08, and AF09). Results obtained were compared with QC results from routine manual batches from the same period. Furthermore, we assessed precision across the whole 96-DWP using a single pooled whole-blood sample, which was aliquoted into each well using the Biomek NXP. TPMT sample preparation was then completed via the automated method. We conducted an analogous experiment via the manual method using another pooled patient sample in which 96 aliquots were prepared. We compared the resulting CVs from the automated and manual methods, with an acceptance criterion of CV <15%. 18
Linearity
We prepared a series of dilutions, up to 1:16 in saline, using a patient sample pool with initial TPMT activity >180 mIU/L. We analyzed each sample in triplicate within a single batch. Linear regression analysis was applied to the mean TPMT activity for each dilution. The assay was deemed to be linear if the R2 >0.95.
Lower Limit of Quantitation
We diluted a whole-blood sample pool in saline to give TPMT activities between 2.5 and 40 mIU/L. Each level was analyzed five times within a single batch using the automated method. The lower limit of quantitation was determined to be the lowest TPMT activity in which the CV was <20%. 18
Method Comparison
We randomly selected patient samples from 15 routine TPMT batches that had been prepared using the manual method. Samples (n = 444) were then analyzed across seven automated method runs, and we compared results using Passing–Bablock regression and a Bland–Altman plot using MedCalc, version 19.5.3 (MedCalc Software, Ostend, Belgium). We excluded results from 39 samples due to insufficient volume (n = 4), clotted sample (n = 1), and HPLC issues (n = 34). When the TPMT activities differed by more than ±10 mIU/L, we repeated the analysis by both methods. In addition, we performed TPMT genotyping as described previously on all samples when mean TPMT activity was <35 mIU/L or between 58 and 78 mIU/L, or when there was a difference in TPMT status classification between the two methods. 6 We assessed and compared the genotype–phenotype correlation between the two methods.
Cost Analysis
A cost analysis for both manual and automated methods was performed. This assumed a predicted workload of 38,000 for 2020–2021, and that 20% of the workload would be done via the manual method. The cost analysis compared labor, equipment, and consumable costs, and costings were correct as of June 2020. Labor costs were based on a predicted reduction in hands-on staff time, particularly during the primary sample aliquoting and enzyme reaction assay steps, and a redistribution of workload to lower-grade staff.
Results
Automated Method
We were able to automate all steps of the TPMT assay using the Biomek NXP and Biomek i5 liquid-handling workstations, except for the incubation at −80 °C, thawing and heating of TR to 37.0–37.5 °C, centrifugation, and loading of RO-96DWP onto the HPLC for analysis. Programmed method steps are shown in
Method Development and Optimization
Of the 34 different primary tube types sent from referring laboratories, only 14 were compatible with the ATBCR. These, however, accounted for 89% of the total samples received (n = 1423). Of the incompatible tubes, 84% were manufactured by Sarstedt, and the majority failed because they were slightly too tall to fit under the connection between the ATBCR and the Biomek NXP presentation point, or under the presentation point itself, due to a tube height of 108 mm including cap. Sarstedt tubes were also subject to being lifted by the sampling probes, thereby causing rack jam errors (see
We showed that on-board inversions (n = 10) of the primary samples provided adequate mixing, thereby negating the requirement for off-line mixing of samples before loading. Lower inversions, particularly when n < 3, were associated with a significant over- or underestimation of TPMT activity due to inadequate mixing. We optimized vortex mixing using BioShake2 to 2500 rpm for 60 s, and we optimized the temperature of the Peltier unit for the 60 min enzyme reaction incubation to 37.0 °C, having obtained a mean positive bias of 3 mIU/L at 37.5 °C and a mean negative bias of −3 mIU/L at 36.5 °C. The precision and accuracy for each pipetting step of the automated method were acceptable, with CVs <3% and deviation from target between −7.5% and 0.9% ( Table 1 ). The automated method also demonstrated improved precision compared to the manual method, with a total CV of 3.1% compared to 4.0%.
The Precision and Accuracy of Each Pipetting Step Assessed by Both the Manual and Automated Methods.

Note: A red-dye solution was pipetted into each well of a flat-bottomed 96-well plate, and absorbance was measured at 492 nm (n = 96). TR, Test reagent; WBSB, whole-blood suspension buffer.
Experiments to assess the temperature profile of selected wells across the 96-DWP during the three incubation steps, and the temperature of each well during the 60 min incubation at 37.0 °C, showed that the wells at the edges of the RO-96DWP (columns 1 and 12) had a marginally lower temperature than those at the center of the plate, with a temperature difference of 0.70 °C between the warmest to coolest wells. The TPMT activity results across the plate also showed a similar pattern, with slightly lower TPMT results obtained in wells around the edges of the plate. The difference between the lowest and highest activity was 10 mIU/L across the plate, at a mean TPMT activity of 94 mIU/L.
Method Validation
We found both intra- and inter-assay precision for patient samples (A–D) aliquoted via the ATBCR to be acceptable at all levels, with CVs of ≤2.3% and ≤7.4%, respectively. For calibrator and QC samples aliquoted from the Biomek NXP deck, intra- and inter-assay precision were ≤2.5% and ≤4.0%, respectively ( Table 2 ). For comparison, inter-assay precision for QC lots DO10 (mean: 100.5 mIU/L) and AF09 (mean: 49.6 mIU/L) obtained via the manual method were 3.6% and 4.8%, respectively. We also assessed precision across the whole 96-DWP, and this was found to have a CV of 2.5% at a TPMT activity of 94 mIU/L. This compared to the manual method, in which the precision of a batch of 96 samples had a CV of 1.8% at a mean TPMT of 99 mIU/L. We showed the automated assay was linear throughout the range of 0–199 mIU/L (R2 = 0.9924), and it could precisely measure TPMT activity down to 3.9 mIU/L with a CV of 3.4%, which is much lower than the reporting limit cutoff for a deficient sample of <10 mIU/L. We observed no discernible carryover following active and passive probe washes, with the TPMT activity of all deficient samples <10 mIU/L.
Intra- and Inter-Assay Precision of Primary Sample Aliquoting via the Biomek NXP across a Range of TPMT Activities.

Note: Patient samples (A–D) were aliquoted via the ATBCR. Cal and routine QC samples (lots DO10, AF08, and AF09) were pipetted from Eppendorf tubes located on the Biomek NXP deck. Two different patient sample pools were prepared for the intra- and inter-assay precision experiments, and so the mean TPMT activities are not directly comparable. ATBCR, Automated tube barcode reader; Cal, calibrator; CV, coefficient of variation; QC, quality control; TPMT, thiopurine S-methyltransferase.
We demonstrated excellent result comparison between the manual and automated methods, with the automated method having a tendency to negative bias with a mean difference of −3.6 mIU/L [95% confidence interval (CI): −3.9 to −3.2 mIU/L] and 95% limits of agreement (LOAs) of −10.7 mIU/L (95% CI: −11.3 to −10.1 mIU/L) and 3.6 mIU/L (95% CI: 2.9 mIU/L to 4.2 mIU/L) ( Fig. 2 ). Passing–Bablock analysis showed a slope of 0.971 (95% CI: 0.957 to 1.000) and intercept of −0.471 (95% CI: −3.000 to 0.826) ( Fig. 2 ). In the CUSUM (cumulative sum) test for linearity, we showed no significant deviation from linearity (P = 0.57). There were 18 (4.4%) samples with a difference in TPMT activity of >10 mIU/L, and on repeat analysis, the manual method results were lower by −7 mIU/L, whereas the automated method repeat results had a mean difference of 0 mIU/L compared to the initial analysis. Three samples had TPMT activity that still differed by >10 mIU/L on repeat analysis; however, the mean TPMT activity of these samples was between 109 mIU/L and 164 mIU/L, so the difference was not clinically significant. Five (1.2%) samples received a discrepant TPMT status classification, with four classified as low by the automated method but normal by the manual method, and vice versa for the remaining sample. We performed TPMT genotype analysis on 33 samples ( Table 3 ), which satisfied the inclusion criteria described above, including four of those with discrepant TPMT status classifications. We observed a good phenotype–genotype correlation for both methods, with the manual method phenotype consistent with genotype 76% of the time, and the automated method was correct 70% of the time. We showed both methods correctly assigned a deficient TPMT phenotype to the sample with a homozygous deficient genotype (*3/*3). The slight negative bias of the automated method meant that it assigned a low TPMT activity status to more samples with a wild-type (*1/*1) genotype than the manual method did. The automated method was also slightly better, however, at assigning a low TPMT activity to samples with a confirmed heterozygous deficient genotype (*1/*2 or *1/*3). For the four samples with discrepant TPMT status classification that underwent genotype analysis, the manual method assigned the correct TPMT phenotype for three of them, and the automated method phenotype was consistent with the genotype for one. Again, the discrepancies were due to the slight negative bias on the automated method incorrectly assigning a low TPMT phenotype to samples with a *1/*1 genotype.
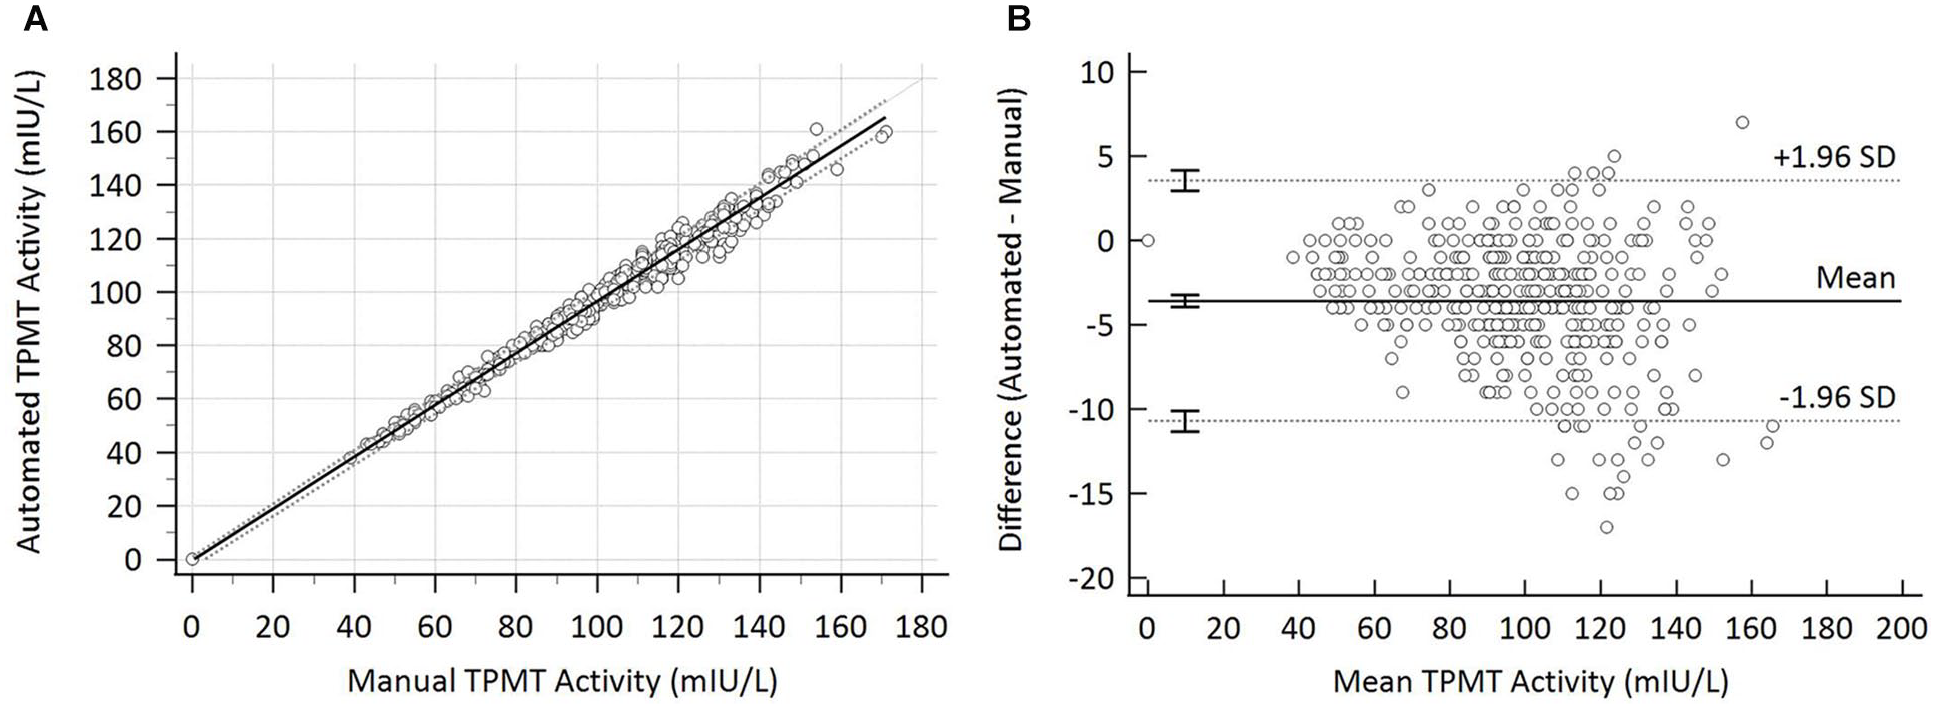
Result comparison between manual and automated methods (n = 405). (
TPMT Phenotype and Genotype Comparison When TPMT Activity Status Was Determined Using Either the Manual Method or the Automated Method.

Note: TPMT activity is classified as Normal (68–150 mIU/L), Low (10–35 mIU/L), or Deficient (<10 mIU/L) (n = 33). The TPMT genotype is designated as wild-type (
Cost Analysis
Comparative costs of the manual and automated assays show that there was little difference in the test cost (manual: £5.92; automated: £5.83); however, there was an inverse split for labor and for equipment and consumable costs between the two methods. For the manual method, labor costs make up approximately two-thirds of the total test cost, whereas this is reduced to less than 40% for the automated method. For the automated method, however, the costs for equipment and consumables are more than 50% higher than for the manual method, because these must absorb the capital outlay of the Biomek workstations and their ongoing maintenance contract costs.
Discussion
We have adapted the Biomek NXP and i5 automated liquid-handling workstations to the novel application of automation of complex enzyme activity analysis. Previously, these analyzers have primarily been developed for DNA extraction, DNA library construction, enzyme-linked immunosorbent assays (ELISAs), flow cytometry, and sample extraction prior to liquid chromatography–tandem mass spectrometry (LC-MS/MS).19–21 We have demonstrated that the analytical performance of the automated TPMT enzyme assay is as good as the manual method and that results generated using the automated method were directly comparable to the manual method.
The automated assay has several operational benefits over the manual method, which is labor-intensive and repetitive. For example, the preparation of an equivalent batch of samples to a full 96-DWP via the manual method involves nearly 400 pipetting steps and 650 movements of test tubes or vials between racks. Almost all these steps are automated using the Biomek NXP or i5 workstations, and when manual intervention is still required, it involves movement of only a single 96-DWP plate. Due to 96-DWP well capacity, the automated method uses 50% less volume of patient samples and reagents compared to the manual method. Furthermore, there is no need for off-line primary sample mixing. Automated liquid-handling workstations have previously been shown to improve both the precision and accuracy of results, with fewer pipetting errors also observed.19,22,23 We were able to demonstrate improved precision for the automated method during the method validation. Furthermore, they can also reduce the “monotony of repetitive tasks,” and the analyzers are not subject to fatigue.13,24
The Biomek Method Launcher software enables the operator to start the method with a single click, and this operational simplicity is considered fundamental to successful routine use. The automated method cannot be edited in the Method Launcher application, which will ensure consistency of operation throughout time and remove the operator-related variation seen in the manual assay. The automated method has a significantly reduced potential for samples to be mixed up during the assay. In the manual method, there are at least five steps in which samples could be transposed, which are all eliminated with the automated method, thanks to sample tracking and automatic worklist generation. To reduce the probability of sample mix-up errors, the manual method uses sequential numbering of samples, a practice that is time-consuming and cumbersome. In contrast, samples can be loaded onto the ATBCR in any order without the risk of sample mix-ups downstream.
For our Trust, the cost analysis has shown that the manual and automated methods are at least cost-neutral, albeit with an inverse split between pay and non-pay. The automated method can make significant savings in terms of pay from using lower-grade staff and requiring less hands-on time. This also facilitates the redeployment of higher-band staff to other, more grade-appropriate duties in the laboratory. Non-pay costs for the automated method are more than 50% higher than for the manual method, because these must absorb the capital outlay of the Biomek analyzers and their ongoing maintenance contract costs. As a result, the long-term goal should be for the majority of the TPMT workload to be undertaken via the automated method, because this will allow the economies of scale to be realized. To further maximize economies of scale, we will be looking to transfer some of our other high-volume complex manual assays onto the Biomek analyzers. A prime candidate is our 6-thioguanine nucleotides (6-TGN) assay, whose workload is comparable to that for TPMT and still fast-growing. The primary sample-aliquoting step of the 6-TGN assay is identical to that of the TPMT method, and hence the same Biomek NXP method developed here could be used.
The interchangeability of the results generated by the automated and manual methods means that the two methods can be used concurrently. This is essential because a proportion of the routine work will continue to be prepared using the manual method each day, including low-volume samples and those received in ATBCR-incompatible primary tubes. It would also be impracticable to have different reference ranges for the manual and automated methods. This dual-assay approach ensures that TPMT laboratory staff can maintain their skills and competencies to perform the manual assay. This will be critical for the continuity of the TPMT service in the event of Biomek analyzer downtime, until such time that the workload enables an additional automated workstation to be installed. This also mitigates against concerns that automation will result in a loss of technical skills.
In conclusion, we have successfully developed and validated an assay for TPMT enzyme activity analysis using a novel application on robotic liquid-handling analyzers. We have shown that these analyzers can be adapted to perform complex enzyme assays requiring stringent temperature control and precision. This will also be of interest to other clinical laboratories where complex manual assays are undertaken, for example in the field of metabolic biochemistry.
Supplemental Material
sj-pdf-1-jla-10.1177_24726303211008856 – Supplemental material for Automation of the Whole-Blood Thiopurine S-Methyltransferase (TPMT) Phenotyping Assay Using the Biomek NXP and Biomek i5 Liquid-Handling Workstations
Supplemental material, sj-pdf-1-jla-10.1177_24726303211008856 for Automation of the Whole-Blood Thiopurine S-Methyltransferase (TPMT) Phenotyping Assay Using the Biomek NXP and Biomek i5 Liquid-Handling Workstations by Rachel L. Griffiths and Jonathan D. Berg in SLAS Technology
Footnotes
Supplemental material is available online with this article.
Declaration of Conflicting Interests
The authors declared no potential conflicts of interest with respect to the research, authorship, and/or publication of this article.
Funding
The authors received no financial support for the research, authorship, and/or publication of this article.
References
Supplementary Material
Please find the following supplemental material available below.
For Open Access articles published under a Creative Commons License, all supplemental material carries the same license as the article it is associated with.
For non-Open Access articles published, all supplemental material carries a non-exclusive license, and permission requests for re-use of supplemental material or any part of supplemental material shall be sent directly to the copyright owner as specified in the copyright notice associated with the article.