
Abstract
Single-cell delivery platforms like microinjection and nanoprobe electroporation enable unparalleled control over cell manipulation tasks but are generally limited in throughput. Here, we present an automated single-cell electroporation system capable of automatically detecting cells with artificial intelligence (AI) software and delivering exogenous cargoes of different sizes with uniform dosage. We implemented a fully convolutional network (FCN) architecture to precisely locate the nuclei and cytosol of six cell types with various shapes and sizes, using phase contrast microscopy. Nuclear staining or reporter fluorescence was used along with phase contrast images of cells within the same field of view to facilitate the manual annotation process. Furthermore, we leveraged the near-human inference capabilities of the FCN network in detecting stained nuclei to automatically generate ground-truth labels of thousands of cells within seconds, and observed no statistically significant difference in performance compared to training with manual annotations. The average detection sensitivity and precision of the FCN network were 95±1.7% and 90±1.8%, respectively, outperforming a traditional image-processing algorithm (72±7.2% and 72±5.5%) used for comparison. To test the platform, we delivered fluorescent-labeled proteins into adhered cells and measured a delivery efficiency of 90%. As a demonstration, we used the automated single-cell electroporation platform to deliver Cas9–guide RNA (gRNA) complexes into an induced pluripotent stem cell (iPSC) line to knock out a green fluorescent protein–encoding gene in a population of ~200 cells. The results demonstrate that automated single-cell delivery is a useful cell manipulation tool for applications that demand throughput, control, and precision.
Introduction
Precise delivery of exogenous materials into cells is essential to performing a variety of cell manipulation tasks, including CRISPR-Cas9 gene editing,1,2 plasmid transfection,3,4 and small interfering RNA (siRNA) gene silencing. 5 To this end, Espinosa and coworkers developed a nanofountain probe electroporation (NFP-E) system capable of delivering molecules of different sizes (i.e., DNA plasmids, molecular beacons, proteins, nanoparticles, and CRISPR-Cas9 complexes) into a variety of cell types.2,6–8 The localized-electroporation mechanism used by NFP-E is a gentle process in which only a small area of the cell membrane, in contact with the nanoprobe (~500 nm diameter), is permeabilized. Conversely, bulk physical membrane disruption methods (i.e., bulk-electroporation and mechanoporation systems) subject the entire cell surface to high electric fields or mechanical stresses that may lead to an undesirable intracellular stress response or reduced viability.9–12 Other commonly used delivery methods, like lipid-vesicle carriers and viral vectors, are limited by low delivery efficiency, 13 lack of dosage uniformity, 2 and cytotoxicity. 14 The nondestructive mechanism and precise dosage control enabled by the NFP-E system are advantageous for applications that require uniform delivery, temporal precision, high cell viability, and single-cell control (i.e., single-cell gene editing and monoclonal cell-line generation). 15 These applications, however, require the delivery of molecular cargoes into hundreds to thousands of cells, which necessitates a high-throughput workflow.
To increase throughput of single-cell delivery systems and expand the range of applications, automation of the experimental workflow is essential.16,17 Single-cell transfection systems perform calibration routines prior to delivery and use live imaging and manual selection of cells within a field of view (FOV). Consequently, these operations require user intervention and result in extended experimental times. To automate this process, computer vision algorithms must be integrated in the experimental workflow to precisely locate the positions of cells and nanoprobes in a FOV prior to probe positioning and molecular delivery ( Fig. 1 ). Moreover, the computer vision routine must be able to distinguish cells in both brightfield- and fluorescence imaging modalities to enable label-free transfection. Traditional image-processing workflows, like watershed and mathematical morphology operations, have been implemented to detect cells but with limited success. For example, the watershed algorithm is well suited for segmentation of fluorescent images when there is a sharp intensity gradient between adjacent objects. The contrast at the edges of cells and their nuclei in phase contrast micrographs is not, however, as clear as in fluorescence imaging. One approach, the ellipse-fit algorithm, was developed to segment the nuclei of brightfield images based on the identification of high-contrast internal features through a series of mathematical morphology and edge detection operations. 18 This method, however, is limited to specific cell types possessing clearly discernable nuclei features.
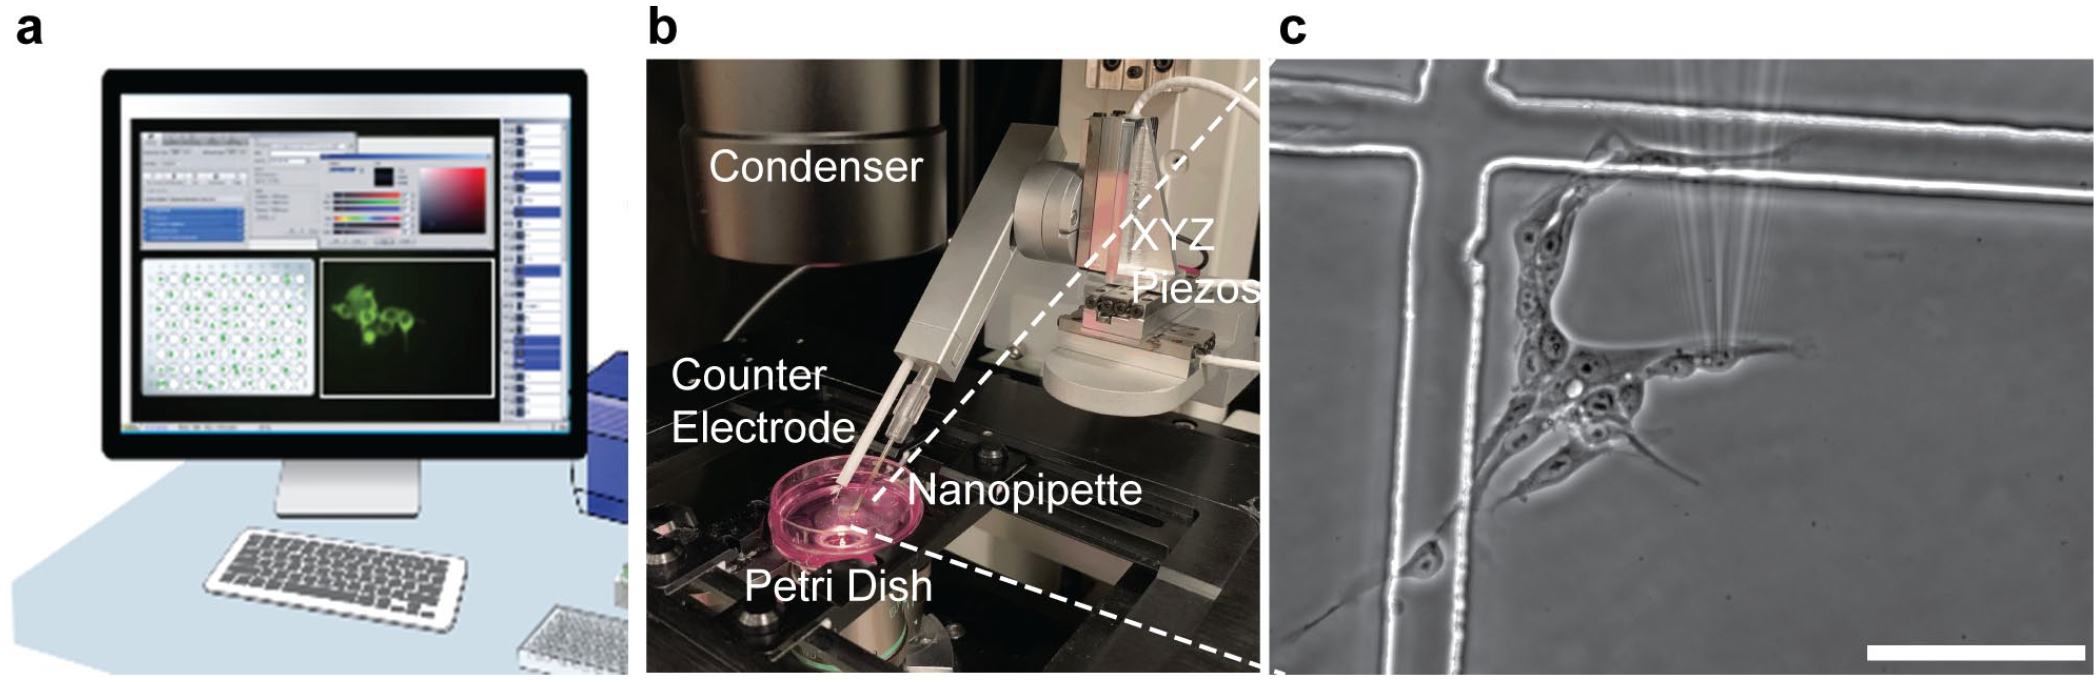
Schematic of automated single-cell delivery workflow using Infinitesimal’s nanofountain probe electroporator (NFP-E): (
These limitations have been overcome with the rapidly growing field of artificial intelligence (AI), in which deep learning algorithms vastly outperform traditional image-processing workflows for executing computer vision tasks, in some cases exceeding human inference performance.19–21 Deep learning convolutional neural networks (CNNs; e.g., VGG16 22 and ImageNet 21 ) are particularly advantageous for the task of object recognition due to their ability to extract features (like edges and color patterns) from local regions in an image. Fully convolutional networks (FCNs), an encoder–decoder adaptation of CNNs, provide pixel-level object classification, thereby enabling the identification and segmentation of numerous individual objects in an image. 23 The instance-aware segmentation capability of FCNs is particularly advantageous for segmenting closely bound objects, such as cells, and has been widely used for cell recognition tasks. 24 For example, cell nuclei segmentation was the objective of a computer vision competition, Kaggle’s 2018 Data Science Bowl, 25 where high-performing deep learning networks included FCNs, mask-RCNNs (region CNNs),26,27 feature pyramid networks (FPNs), 28 and ensemble networks. Building on such investigations, here we use FCNs and a transfer-learning approach to accurately detect cells in phase contrast micrographs and enable high-throughput automated delivery of exogenous cargoes into single cells. Furthermore, we demonstrate an automatic ground-truth (GT) labeling approach to expedite the annotation process and provide a more rapid avenue for laboratories to use their own datasets for training deep networks.
Materials and Methods
Automated Single-Cell Electroporation
An NFP-E system (Infinitesimal LLC, Skokie, IL) was used to deliver molecular cargoes into adhered cells via application of electrical pulses. Delivery reagents were loaded into a nanopipette (Eppendorf, Hamburg, Germany) and connected to the NFP-E instrument via a pipette holder containing a Pt-wire electrode. Culture dishes with adhered cells were then placed on a motorized microscope stage (±1 µm resolution) for XY positioning and inverted microscopy imaging (Nikon TE 2000; Nikon, Tokyo, Japan). Next, the nanopipette was immersed in the culture dish, focused using a normalized variance autofocus routine, and calibrated using a template-matching algorithm ( Suppl. Fig. S1 ). Once the pipette-tip position was calibrated, the cells were brought into focus using the autofocus routine. Phase contrast images (20× objective; Nikon) were acquired with CCD (Andor, Oxford Instruments, Abingdon, UK) and machine vision cameras (FLIR, Wilsonville, OR), and cells in the FOV were automatically identified using the AI machine vision routines. The calibrated pipette tip was moved to each cell using the three-axis piezo drive. Once positioned on the nuclei centroid coordinate, the nanopipette tip was lowered while simultaneously acquiring circuit resistance measurements using Infinitesimal LLC proprietary electronics. Using Infinitesimal’s contact detection algorithm, 29 based on a resistance measurement profile, the nanopipette motion was stopped to achieve a good seal while avoiding cell puncture. Once in contact with the cell, a pulsed voltage history, selected via a graphic user interface (GUI), was applied to open pores in the membrane and deliver the reagents. The following pulse parameters were adjusted prior to electroporation: pulse shape (i.e., square, bi-level, or exponential), supplied voltage [Vs (V)], pulse duration (s), frequency (Hz), and number of pulses.
Cell Detection Using Fully Convolutional Networks
A FCN containing 20 hidden layers ( Fig. 2A ) was developed (using TensorFlow, www.tensorflow.org; and Keras, https://keras.io) to detect cells in phase contrast and fluorescence imaging modalities. The FCN architecture consists of an encoder–decoder structure designed to extract local image features and construct a multiclass probability output that maps to each pixel in the image. Convolution layers (3×3 kernel size) were connected to a ReLu nonlinear activation function, and downsampled with a max-pooling layer (2×2 kernel size, stride 2). Upsampling (2×2 kernel size, stride 2) and concatenation steps were implemented in the decoder portion of the network. A weighted soft-max cross-entropy loss function was used to classify the cell interior, outlines, and exterior with a weight ratio of 5:10:1, respectively. Image datasets, containing image input and labeled ground truth, were divided for cross-validation with a 5:1 training-to-validation ratio. Augmentation generators (image flipping, zooming, intensity variation, and rotation) were applied to transform the image and GT inputs. Training was performed on a graphic processing unit (GPU; NVIDIA RTX 2080; NVIDIA, Santa Clara, CA) equipped with network acceleration libraries (NVIDIA cuDNN). The FCN network was trained in batches (batch size: 6), in which the network weights were optimized using stochastic gradient descent (learning rate: 1e-4; and momentum: 0.9). Training was stopped when the moving average of the validation loss reached a minimum value.
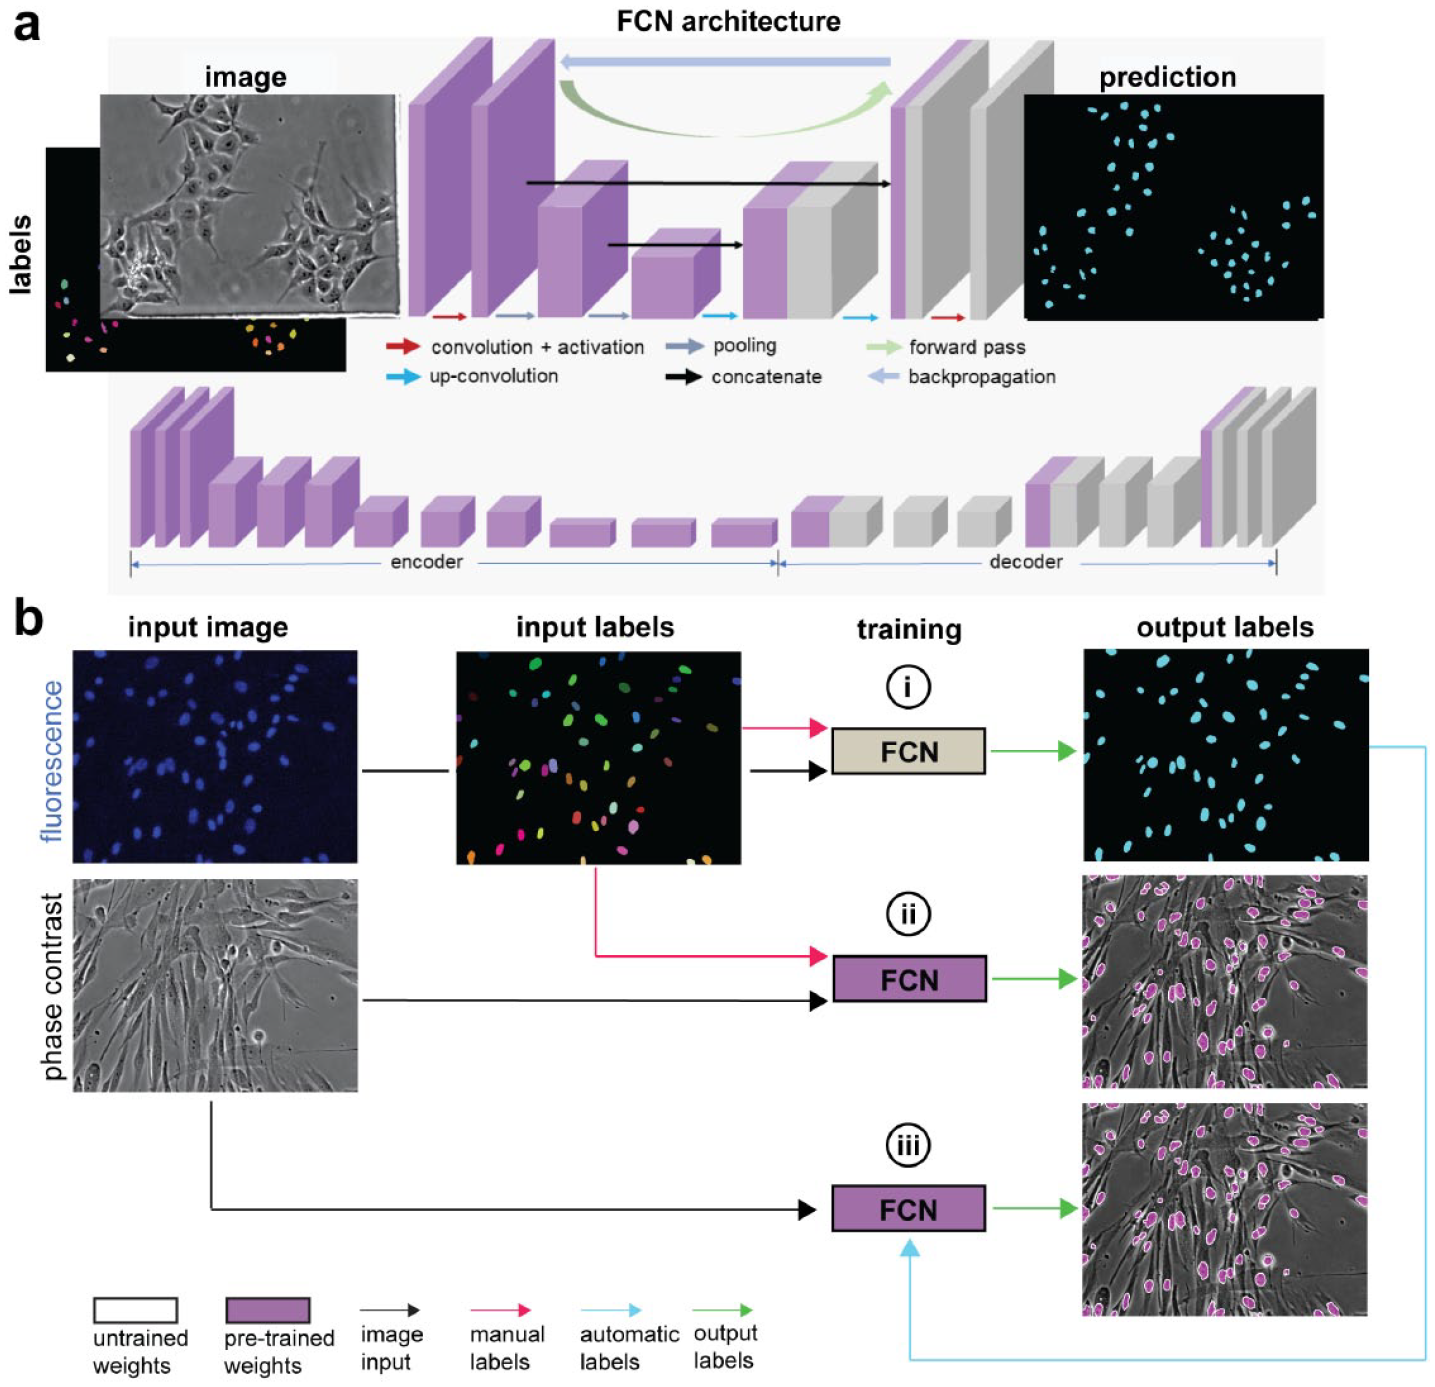
Fully convolutional network (FCN) architecture and training scheme. (
The image sets used for training the FCN network were obtained by capturing phase contrast and fluorescence micrographs, in the same FOV, of cells stained with fluorescent dyes to enable accurate localization of the nuclei (Hoechst) or cytosol (Calcein AM), respectively. The fluorescent micrographs were used to label the outlines of the nuclei or cytosol using an image manipulation software (GIMP, www.gimp.org), and were processed with an image analysis pipeline (CellProfiler, https://cellprofiler.org) to generate the three classes (interior, boundary, and exterior) for each image. 30 After labeling the images, a general fluorescence FCN model was trained with the fluorescence images (including all cell types in our database) and the manually annotated GT labels as inputs (see Fig. 2Bi ) to enable nuclei or cytosol detection in fluorescence micrographs. Since the phase contrast and fluorescence micrographs were captured for each FOV, the same GT labels generated using the fluorescent images were used as inputs for training a FCN network to enable nuclei or cytosol detection in phase contrast micrographs (see Fig. 2Bii ). In addition to a general phase contrast FCN model (trained with all of the cell types in our database), we fine-tuned separate FCN models for each individual cell type to increase performance. To expedite the GT labeling process, an automated labeling approach was incorporated (see Fig. 2Biii ) by using the FCN model used for fluorescence predictions ( Fig. 2Bi ) to generate the GT labels on new image sets (fluorescence and phase images captured in the same FOV) automatically.
After training the FCN models for cell and nuclei detection for various cell types, the models were optimized for inference acceleration by using an inference engine optimization software development toolkit (Intel OpenVINO; Intel, Santa Clara, CA). The optimized models were integrated into the NFP-E software (C# language) to enable nuclei and cytosol detection from live images and subsequent nanoprobe electroporation.
A postprocessing pipeline was developed in the NFP-E software (OpenCV, https://opencv.org) to measure the shape and intensity profiles of the detected nuclei and cells. The following shape features were measured for each object: area, perimeter, circularity, solidity, eccentricity, major axis, and minor axis (
Suppl. Table S1
). To obtain the intensity-based features (mean intensity, median intensity, and intensity variance), the FCN-predicted objects were overlaid with the original input image for measurement of intensity at the location of the objects. Statistics were obtained for each of the shape and intensity features for each cell type (nuclei and cytosol) measured from the GT labels and used for determining thresholds for filtering objects in the live images. Area filters were used to remove small artifacts and large clumps, if present, determined using the following:
Performance Metrics
The segmentation performance of the FCN algorithm was evaluated by measuring the overlap of the output predictions with the GT annotations. The intersection over union (IOU) was calculated from the following equation:
A threshold IOU value was used to determine true positives (TP), false positives (FP), and false negatives (FN). The precision (P) and sensitivity (S) were calculated from these values according to the following equations:
Protein Delivery Experiments
Breast cancer cells (MDA-MB231) and kidney cells (HEK293) were plated in separate 35 mm culture dishes (Corning, Corning, NY) 24 h prior to electroporation. A 2.5 mg/mL solution of bovine serum albumin (BSA) protein tagged with Alexa Fluor 488 (BSA-488; Thermo Fisher Scientific, Waltham, MA) in 1× Dulbecco’s phosphate-buffered saline (DPBS; Gibco, Carlsbad, CA) was loaded into a nanopipette (Eppendorf) and mounted on the NFP-E. The cells were electroporated with the following pulse parameters: bi-level profile, VS1 = 15 (V), VS2 = 10 (V), t1 = .5 (ms), t2 = 2.5 (ms), f = 20 (Hz), and Npulses = 200. Cells were imaged post electroporation in an inverted microscope equipped with fluorescence and phase contrast imaging modules (Nikon).
Human induced pluripotent stem cells (iPSCs) encoding for a copGFP gene (copGFP-iPSCs) were plated on a gridded dish (~25,000 cells) and incubated for 24 h prior to electroporation. A stock solution of red fluorescing BSA-AF647 (Thermo Fisher Scientific) in 1× DPBS (Gibco) was loaded into a nanopipette. A bi-level pulse profile [VS1 = 15 (V), VS2 = 5 (V), t1 = .5 (ms), t2 = 2.5 (ms), f = 20 (Hz), and Npulses = 200] was applied to electroporate the cells.
Cas9–gRNA Delivery Experiments
A guide RNA (gRNA) was engineered to target the sequence of the copGFP gene of an iPSC line. A final concentration of 1 µM gRNA and 1 µM Cas9 nuclease in DPBS was prepared and placed in an incubator (5% CO2, 37 °C, and 98% relative humidity) for 10 min to synthesize the Cas9 and gRNA.
The Cas9–gRNA ribonucleoprotein complex was loaded into a nanopipette and placed in the NFP-E holder. The automated electroporation protocol was performed to deliver the gene-editing molecules into the iPSCs (~1000) plated on a gridded dish (Ibidi) using the following electroporation parameters: The bi-level profile is VS1 = 15 (V), VS2 = 10 (V), t1 = .5 (ms), t2 = 2.5 (ms), f = 20 (Hz), and Npulses = 200. The cells were treated with rho-kinase inhibitors post electroporation and allowed to expand for 4 days. Loss of green fluorescence in the electroporated cells indicated the absence of copGFP protein and consequently the knockout of the copGFP gene.
Cell Culture
Cancer cell lines (HEK293, MDA-MB231, and HeLa) were cultured with Dulbecco’s modified Eagle medium (DMEM; Gibco) with 4% fetal bovine serum (FBS) and 1% antibiotic. The cells were passaged with 0.25% Trypsin-EDTA (Life Technologies, Carlsbad, CA), transferred to a 35 mm culture dish (Corning), and placed in an incubator (5% CO2, 37 °C, and 98% relative humidity) for 24 h prior to electroporation.
Primary fibroblasts were cultured in culture dishes containing fibroblast basal medium with a low-serum growth kit (ATCC PCS-201-041; ATCC, Manassas, VA). The cells were passaged with 0.05% Trypsin-EDTA (Life Technologies), transferred to a 35 mm culture dish (Corning), and placed in an incubator (5% CO2, 37 °C, and 98% relative humidity) for 24 h prior to electroporation.
iPSCs engineered with green-fluorescing copGFP genes were cultured in Matrigel-coated (Corning) culture dishes containing Essential 8 Medium (Thermo Fisher Scientific).
Fluorescence Staining
A Hoechst nuclear dye (Life Technologies) solution of 0.1 mg/ml in phosphate-buffered saline (PBS) was prepared. The Hoechst solution was added to culture dishes plated with cells after removal of the culture media. Culture dishes with Hoechst were placed in an incubator for 10 min at 5% CO2, 37 °C, and 98% relative humidity. After incubation, the Hoechst solution was removed and washed thrice in PBS prior to imaging.
Statistical Analysis
Statistics and performance metric calculations were performed in Python. A two-tailed t test was used to calculate P values to assess statistical significance. Standard error bars were computed from experiments with triplicate data at minimum. Spearman’s correlation matrix was used to generate the heat map of extracted cell features.
Results and Discussion
Phase Contrast Cell Nuclei and Cytosol Detection
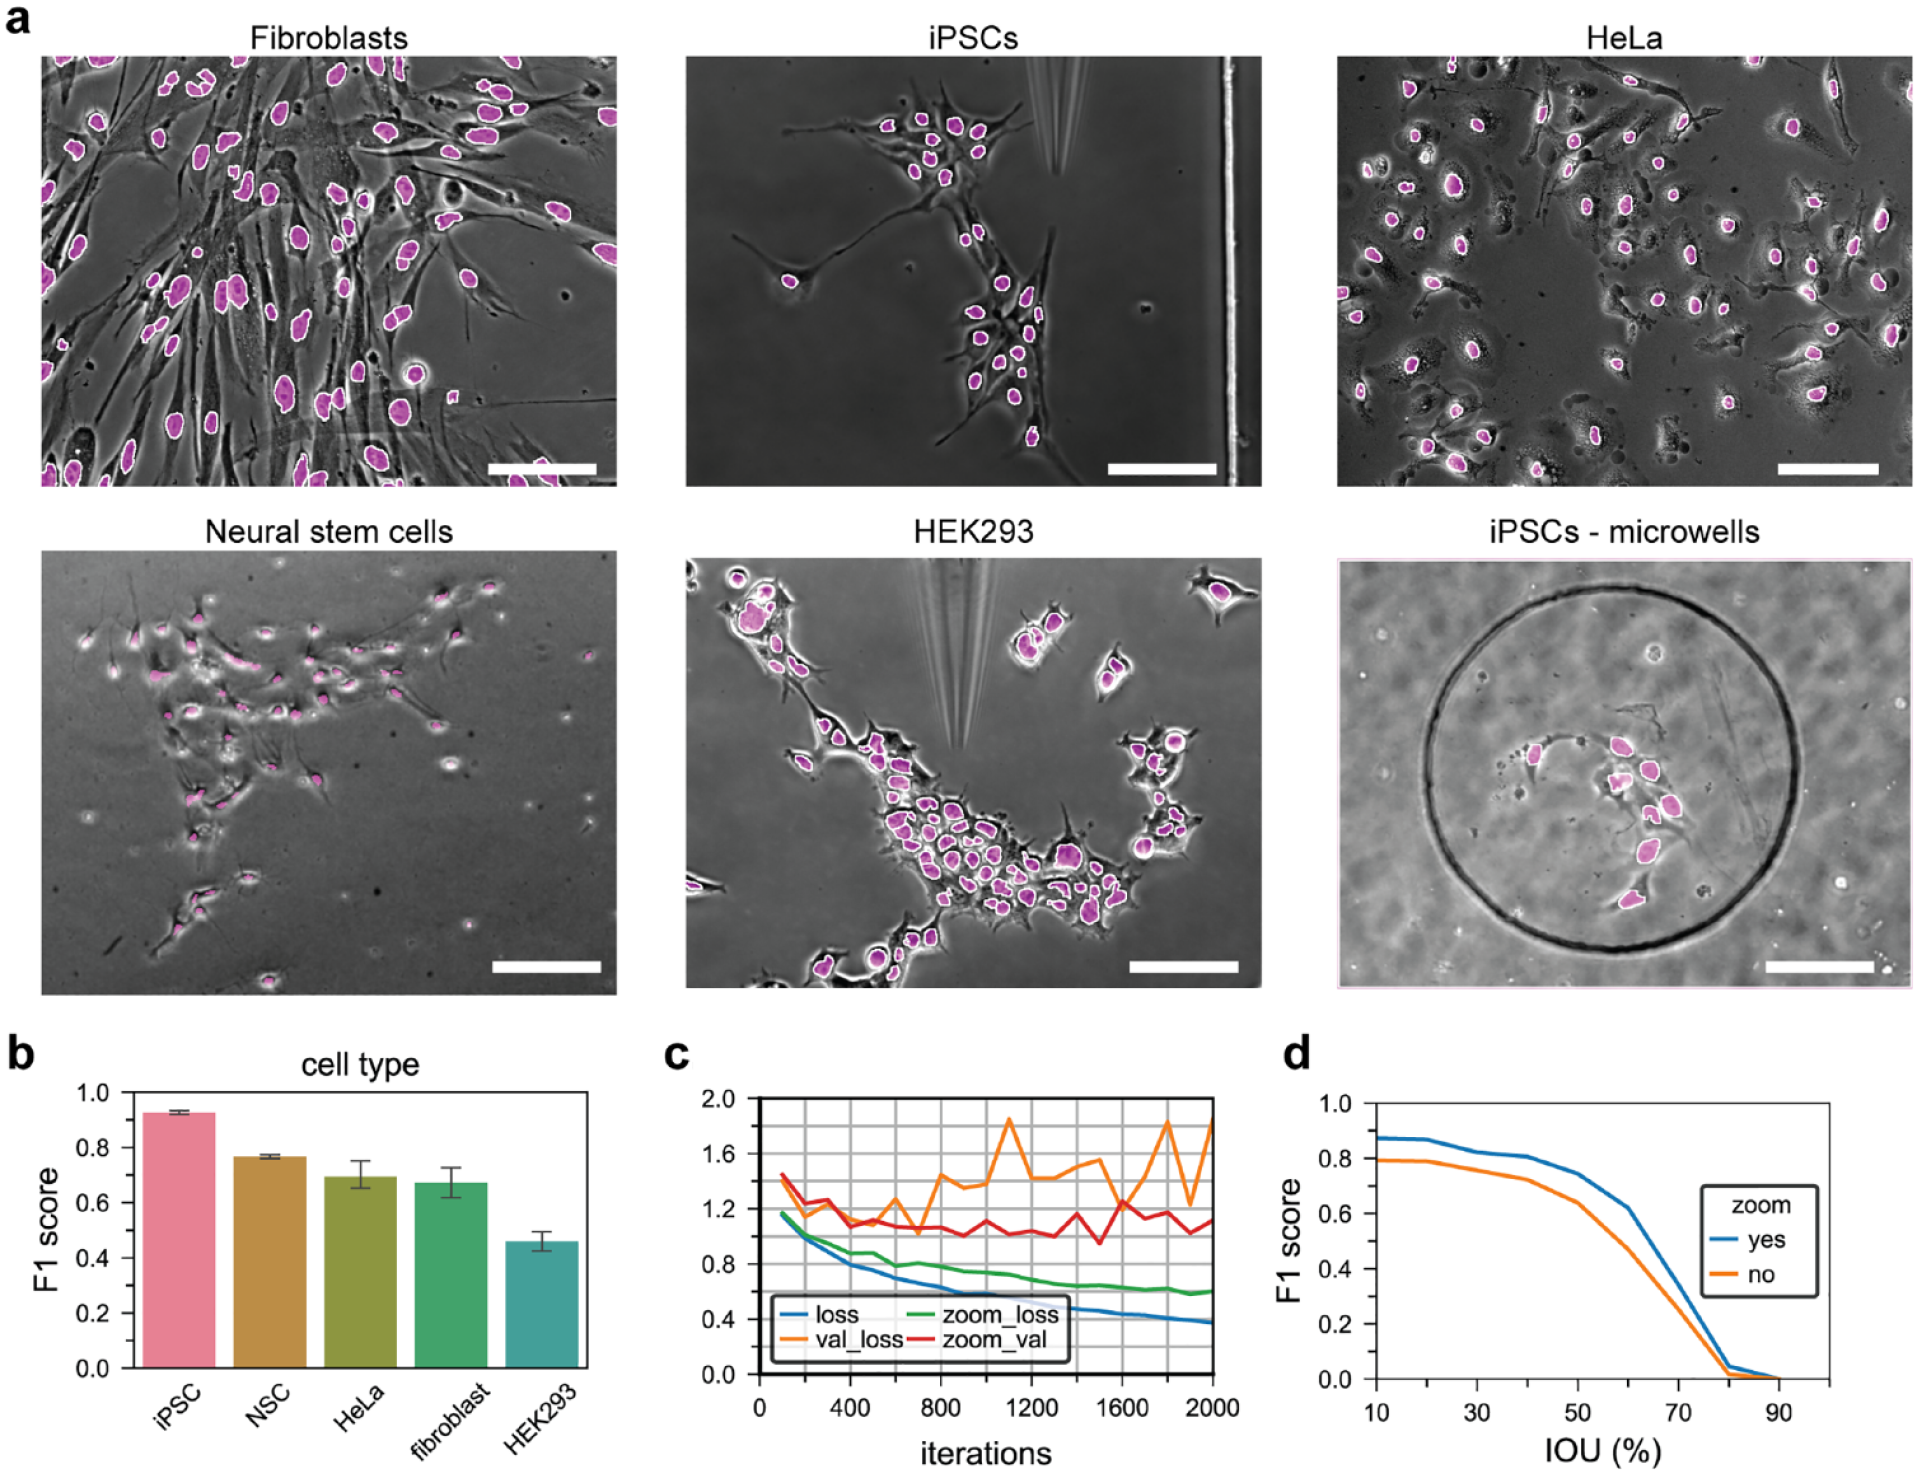
Precise detection of cell nuclei in brightfield images is essential for the automated label-free delivery of exogenous materials, including plasmids and CRISPR-Cas9 complexes, into a large number of cells using the NFP-E system. We obtained phase contrast and fluorescence images of various cell types stained with a nuclei marker [including HeLa cells, iPSCs, HEK293 cells, fibroblasts, and neural stem cells (NSCs)], each comprising a unique morphology, and trained the FCN algorithm to detect the nuclei in the phase contrast images using the manually annotated GT labels obtained from the fluorescent images. The segmentation outputs overlaid with the image inputs are shown in
Figure 3A
. Nuclei of all of the cell types were clearly identified, including images in which cells were seeded inside micropatterned substrates used for the generation of monoclonal cell lines. Segmentation performance was measured from the IOU overlap of predicted nuclei outputs and GT label inputs. A threshold IOU value was used to discriminate true positives from false positives, and in turn used to calculate segmentation precision and sensitivities. A segmentation score (F1), calculated from the harmonic mean of precision and sensitivity values, was used to measure the segmentation performance for each of the cell types in our dataset using the fine-tuned FCN models (
Fig. 3B
). Cells containing clearly distinct nuclei outlines in the phase contrast images, like iPSCs, were segmented with the highest precision and accuracy (F1iPSC = 0.92), while highly merged cells, like HEK293, resulted in the lowest segmentation score (F1HEK293 = .48). The other cell types, including NSCs, fibroblasts, and HeLa cells, contained clearly separated nuclei and were segmented with high segmentation scores (FNSC = .75, F1fibroblast = .69, and F1HeLa = .66, respectively). The average segmentation scores gathered for all of the cell types were in the range of the high-performing algorithms submitted to the Kaggle nuclei segmentation competition, in which the dataset used comprised a high number of fluorescence-labeled nuclei.
25
Segmentation performance of fluorescence micrographs is higher than that of brightfield imaging modalities due to the sharp intensity gradients at the edges of the stained nuclei compared to phase contrast. Using transfer learning from a large database (~10,000 nuclei) facilitated the training process and made the network more robust to overfitting. Furthermore, we implemented image augmentation (zoom, flip, and rotation) during the training to increase the size of the training data and to generate a robust FCN model capable of detecting cells at regions of interest (ROIs) of different sizes. Consequently, the augmentation steps enabled the FCN algorithm to be trained for more iterations while avoiding overfitting (
Fully convolutional network (FCN) nuclei segmentation. (
To test the performance of a network trained with automatically generated GT labels, we collected images (phase contrast and fluorescence) of HeLa cells containing a blue nuclei stain (Hoechst) and automatically generated labels by passing the fluorescence images through a pre-trained FCN network. We compared the automatically generated labels to human annotations and measured the segmentation scores. The segmentation performance of the automatically generated labels approached the precision of human annotations [F1auto (70% IOU) = .94] compared to the fluorescence GT labels. Next, we used the automatically generated labels to train a FCN network to identify cell nuclei in phase contrast images. The nuclei segmentation outputs from two independent FCN networks, trained with manual and automatically generated GT labels respectively, coincide closely with the fluorescent nuclei staining, as illustrated in the composite images ( Fig. 4A ). Furthermore, the F1 segmentation performance was similar for both cases, with no statistically significant difference in the segmentation scores ( Fig. 4B ). The capability to rapidly annotate image data while maintaining high performance is essential to expediting the workflow from image acquisition to software deployment.
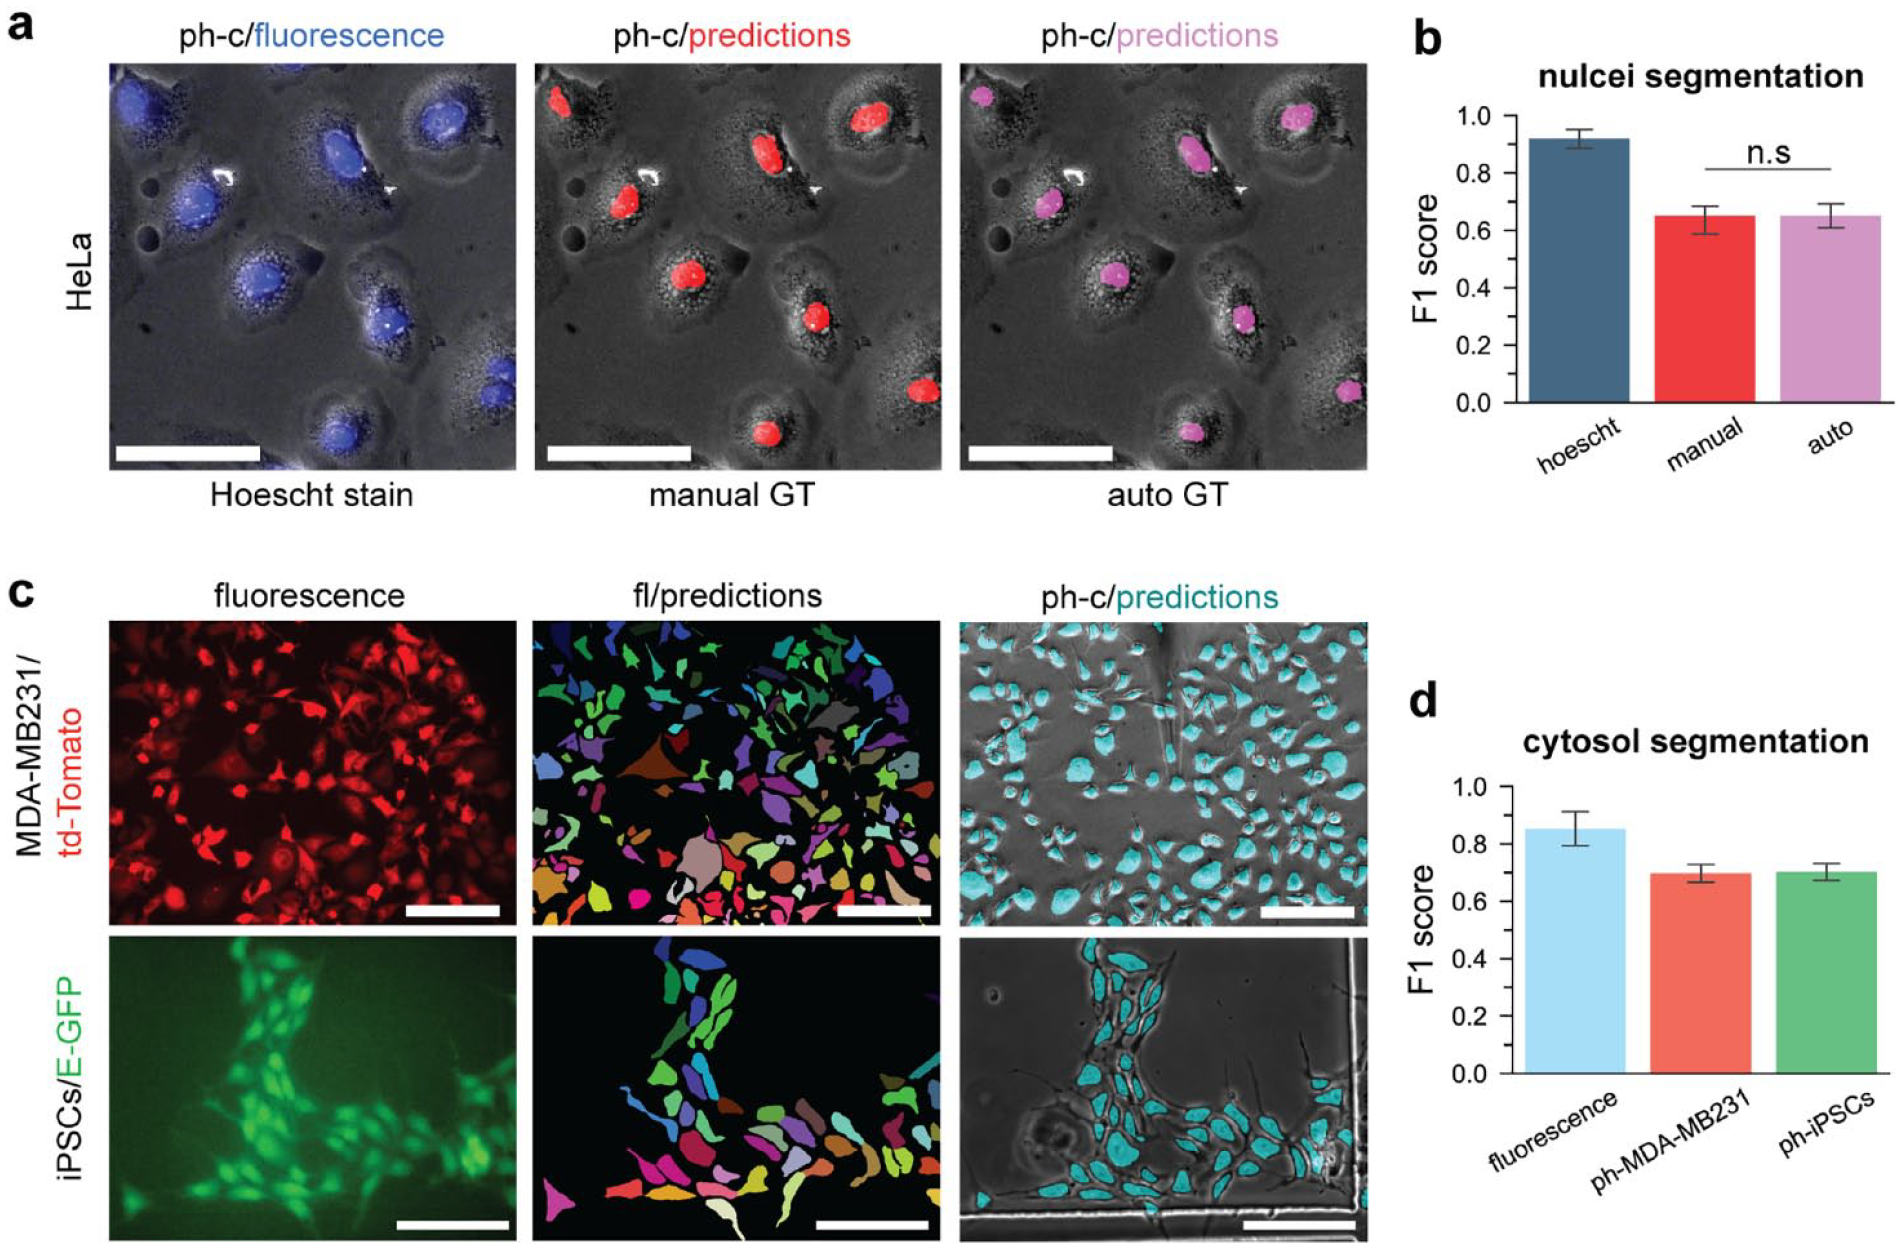
Automatic label generation performance and cytosol segmentation. (
To segment the exterior outlines of the cells, we used the automatic GT labeling workflow to train FCN models with images of two engineered cell types: (1) td-Tomato-expressing MDA-MB231 breast cancer cells, and (2) enhanced green fluorescent protein (eGFP)-expressing iPSCs (see Fig. 4C ). In this manner, we automatically generated approximately 3000 labels in a matter of minutes. We measured the overlap between the automatically generated GT labels with manual annotation and observed high segmentation performance (F1fluorescence = 0.82) ( Fig. 4D ). Likewise, the segmentation performance of the phase contrast predictions was high and similar for both cell types (F1ph-MDA-MB231 = 0.69 and F1ph-iPSCs = 0.70). The high performance of FCN algorithms for segmenting cell outlines and nuclei is uniquely advantageous for the task of recognizing various types of cells for automated single-cell delivery. Importantly, high performance was maintained while processing phase contrast images, which is an essential capability for label-free cell manipulation protocols.
Feature Extraction and Image Analysis
Automated extraction of features (e.g., shape, intensity, and texture features) from accurately segmented images enables a process for high-throughput analysis and screening of large populations of cells. Consequently, we implemented a feature extraction pipeline to measure various shape and intensity features from single cells. To test this capability, we quantified and compared the normalized distributions of distinct shape (i.e., area, circularity, and solidity) and intensity features (i.e., mean intensity) of the td-Tomato-MDA-MB231 cells and iPSCs (
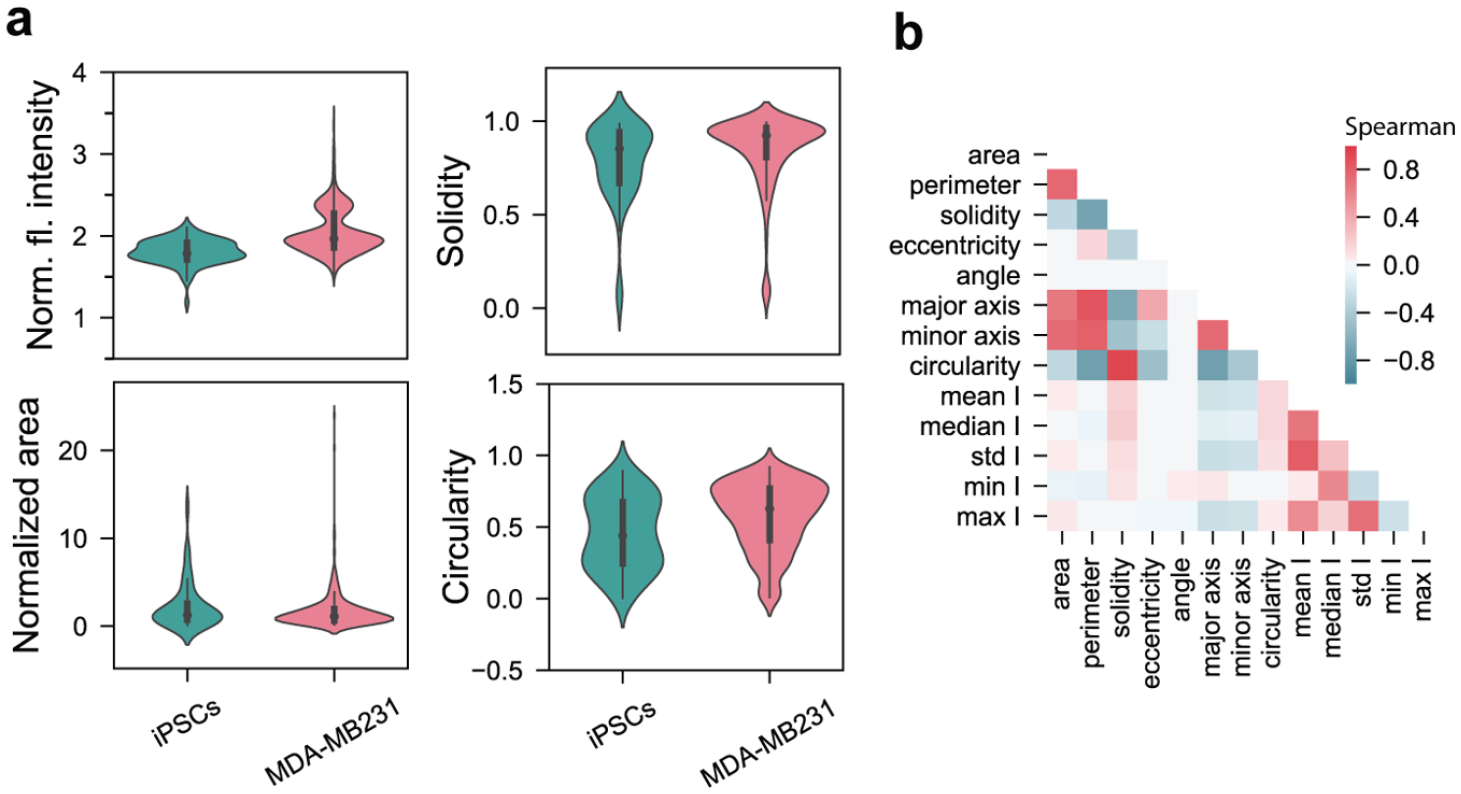
Cell feature extraction. (
To selectively transfect cells of interest in experiments, we implemented a GUI to filter cells based on intensity and shape features. For example, we found that electroporation efficiency is increased for well-adhered cells compared to rounded cells. Using this filtering scheme, we successfully selected cells with high transfection probability automatically. Moreover, to increase the system reliability and prevent engagement of pipette tip on false-positive locations, we filtered the segmented nuclei centroid with a mask generated from the cell outline segmentations. In this manner, we were able to measure detection performance (sensitivity and precision) and filter out potential false-positive locations. We compared the detection performance prior to filtering, and compared it to an ellipse-fit image-processing pipeline. Higher sensitivity and precision values were obtained with the FCN network for all cell types ( Suppl. Table S1 ). Consistent with the literature reports, deep learning algorithms outperform traditional image-processing techniques in the field of computer vision.
To integrate the detection and feature extraction pipelines in a deployable manner that can be used without the need of specialized GPUs, we optimized the FCN models using inference engine acceleration routines. The inference engine optimization step stripped the trained FCN model of layers used exclusively for training (i.e., batch normalization) and incorporated libraries optimized for acceleration. In this manner, we were able to rapidly detect cells (in 1.25 s; Suppl. Fig. S5 ), extract features, and apply filters prior to single-cell electroporation. In comparison, the manual selection time of cells in a FOV (~80 cells) is in the range of 60–100 s. This translates to approximately a 1 h reduction in the electroporation workflow for processing 5000 cells. As a result of the increased throughput provided from the AI-driven automation platform, the NFP-E can be used for manipulating large numbers of cells, which is an essential capability for cell-engineering applications like gene editing and cell line generation.
Single-Cell Delivery and Cas9–gRNA Gene Knockout
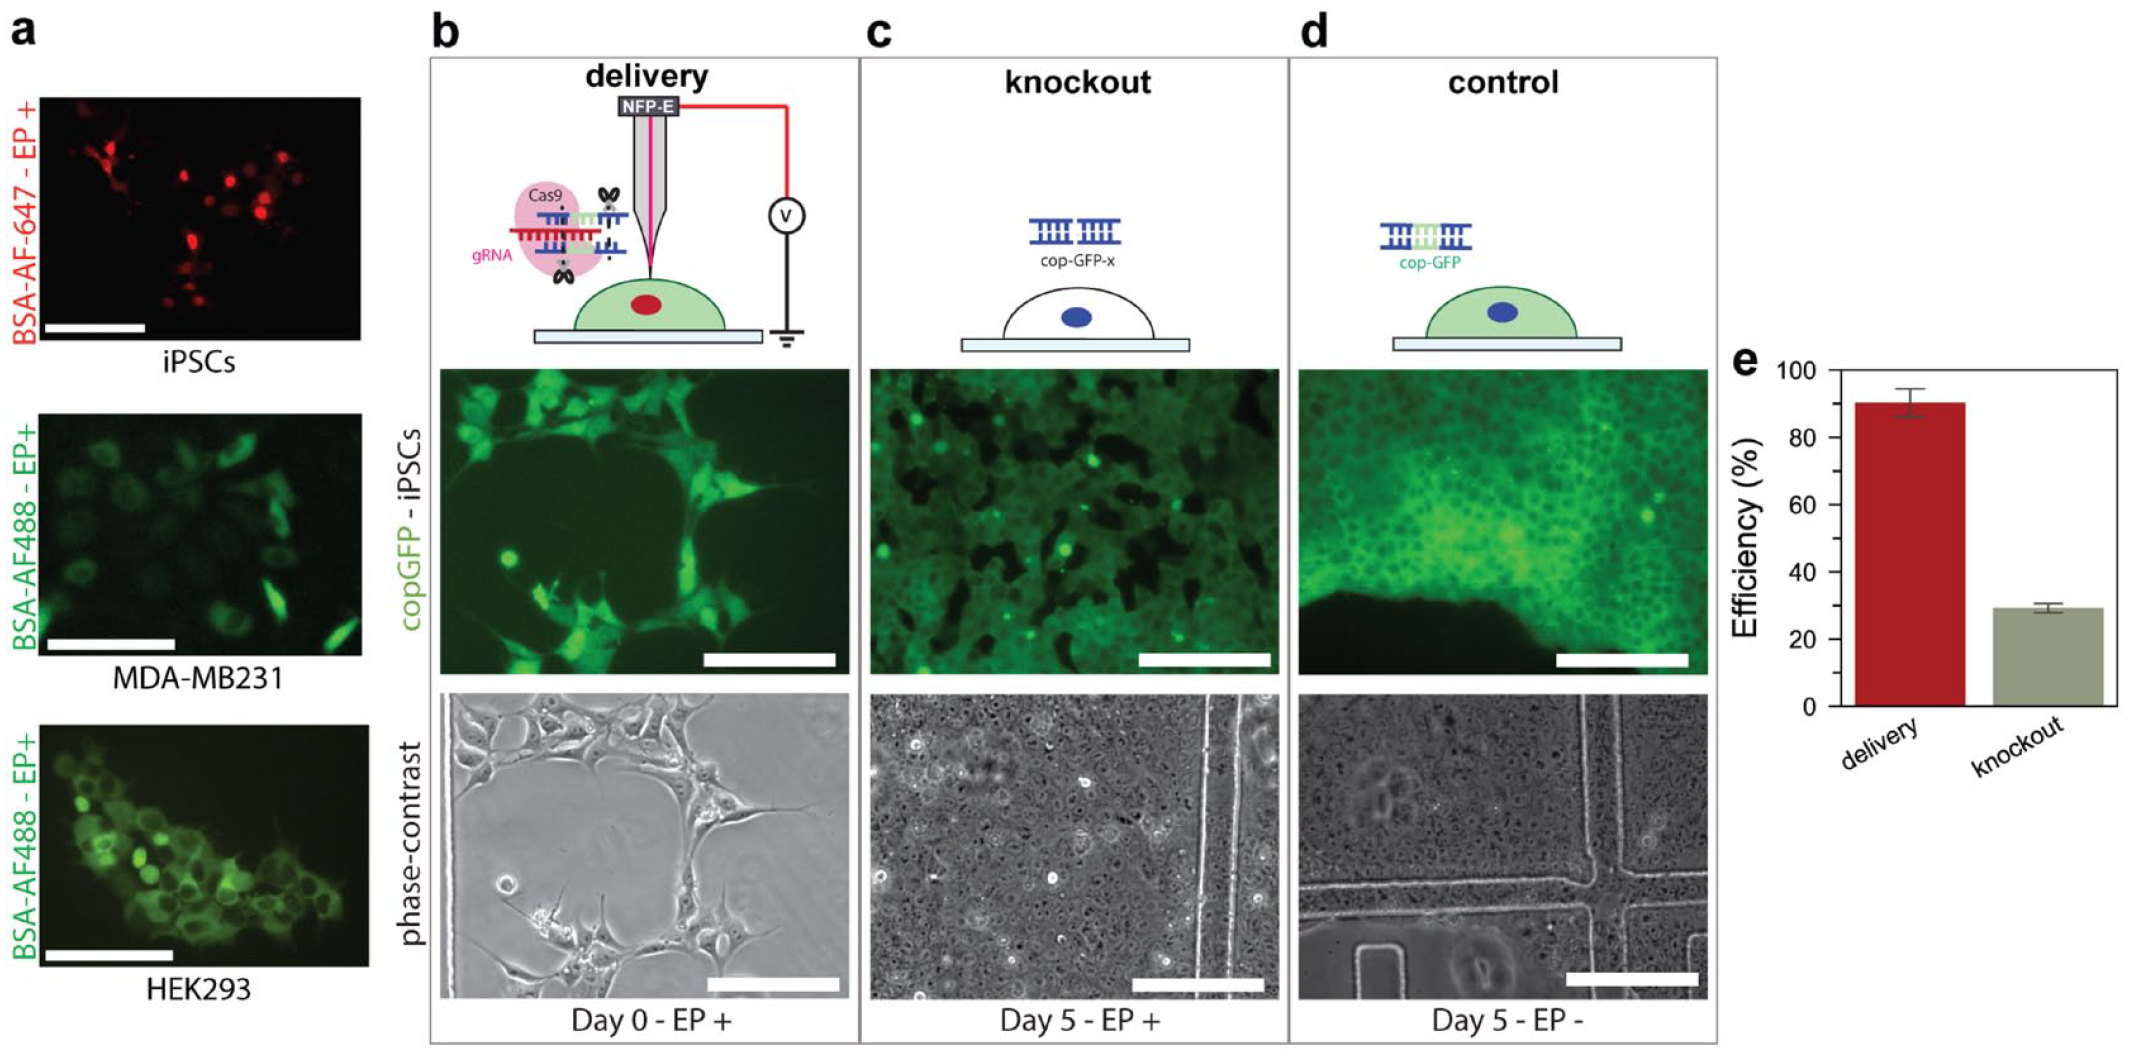
Automated delivery of exogenous materials into single cells is the central feature of the NFP-E system. To measure the efficiency of delivery following automatic detection, we delivered a red fluorescent protein (BSA-AF647) into an engineered iPSC line containing a gene that encodes for a green fluorescent protein (copGFP), and green fluorescent BSA protein (AF488-BSA) into breast cancer and kidney cells (MDA-MB231 and HEK293) ( Fig. 6A ). Following optimization of the delivery conditions, we delivered Cas9–gRNA complexes into copGFP-iPSCs to test our system’s capabilities for gene-editing applications. The gRNA was designed to target the location of the copGFP gene in the iPSC chromosomes to enable specific removal of the gene with the Cas9 nuclease via the nonhomologous end-joining (NHEJ) mechanism ( Fig. 6B–6D ). iPSCs in the FOV were automatically detected with the AI software and electroporated with the NFP-E system, allowing for the efficient delivery of Cas9–gRNA complexes into populations of cells adhered on a gridded dish (~30 cells per grid FOV; see Fig. 6B ). We used the NFP-E to deliver gene-editing complexes into ~200 cells in an automated manner. The cells were incubated post electroporation for 5 days and imaged. Successful knockout was observed in cells that no longer expressed the green fluorescent cop-GFP protein ( Fig. 6C ). No cells were edited in the control experiments ( Fig. 6D ). Using the NFP-E system, we successfully delivered proteins into 90% of cells and knocked out the copGFP gene in ~29% of cells ( Fig. 6E ). The editing efficiency was consistent throughout the different regions of the culture dish, indicating uniformity in the delivery conditions.
(
The uniform delivery and precise dosage capabilities provided by the NFP-E systems are ideally suited for the implementation and optimization of CRISPR-Cas9 editing workflows. Researchers have leveraged CRISPR-Cas9 technologies to edit genes via homology-directed repair (HDR), or knock out genes through NHEJ,34,35 to edit pathogenic genes, 36 engineer novel cell lines,2,37 study intracellular signaling,6,38 perform functional genomic screening, 39 and develop cellular and animal models. 40 The efficiency of gene editing for both HDR and NHEJ remains low, however, due to complexities in the biochemical processes (e.g., dependency on cell cycle stage and off-target binding)35,41 and inefficiencies in the methods used to deliver the gene-editing cargoes into the cell. 13 Consequently, increasing the precision, timing, and dosage control of the delivery mechanism is imperative to reduce the technical noise of the gene-editing workflow and elucidate the biological aspects of the experiments. 8 The automated NFP-E system provides these advantages. Furthermore, the nondestructive localized electroporation process allows for repeated editing, while the automated AI segmentation and feature extraction pipelines enable the systematic tracking of phenotypic changes incurred from the gene-editing treatments.
Conclusion
Single-cell electroporation systems provide a gentle and efficient platform for executing cell manipulation and analysis tasks. Throughput is, however, a concern. When augmented by AI-enabled feature extraction algorithms, the system achieves the throughput needed in applications ranging from gene editing to cell line generation to cell analysis, in which high delivery efficiency, throughput, and dosage control are essential. It also allows for acquisition of a multitude of shape and intensity measurements from each cell, opening up new avenues for studies in the fields of systems biology, stem cell differentiation, and cell–cell communication. Lastly, the implemented cell-staining and FCN transfer-learning approach can also be applied to other problems that necessitate the labeling of brightfield micrographs for subsequent deep learning training and cell phenotype recognition.
Supplemental Material
sj-pdf-1-jla-10.1177_2472630320982320 – Supplemental material for Deep Learning and Computer Vision Strategies for Automated Gene Editing with a Single-Cell Electroporation Platform
Supplemental material, sj-pdf-1-jla-10.1177_2472630320982320 for Deep Learning and Computer Vision Strategies for Automated Gene Editing with a Single-Cell Electroporation Platform by Cesar A. Patino, Prithvijit Mukherjee, Vincent Lemaitre, Nibir Pathak and Horacio D. Espinosa in SLAS Technology
Footnotes
Supplemental material is available online with this article.
Author Contributions
H.D.E., C.A.P., P.M., and V.L. conceived the project. C.A.P. developed the computer vision routines. P.M. and C.A.P wrote the automation software. P.M., V.L., and N.P. performed the biological experiments. All authors analyzed and interpreted the data. H.D.E., C.A.P., and P.M. wrote the manuscript.
Declaration of Conflicting Interests
The authors declared the following potential conflicts of interest with respect to the research, authorship, and/or publication of this article: H.D.E. declares majority ownership of Infinitesimal LLC, a company commercializing biotools for cell manipulation and analysis.
Funding
The authors disclosed receipt of the following financial support for the research, authorship, and/or publication of this article: Research reported in this publication was supported by the National Institutes of Health (NIH) SBIR Phase 1 award (no. 1R43GM128500-01) and NIH R21 award (no. 1R21GM132709-01). This work used the Argonne National Laboratory Center for Nanoscale Materials. Use of the Center for Nanoscale Materials, an Office of Science user facility, was supported by the US Department of Energy, Office of Science, Office of Basic Energy Sciences (under contract no. DE-AC02-06CH11357).
References
Supplementary Material
Please find the following supplemental material available below.
For Open Access articles published under a Creative Commons License, all supplemental material carries the same license as the article it is associated with.
For non-Open Access articles published, all supplemental material carries a non-exclusive license, and permission requests for re-use of supplemental material or any part of supplemental material shall be sent directly to the copyright owner as specified in the copyright notice associated with the article.