
Abstract
Electroporation (EP) is a process of applying a pulsed intense electric field on the cell membrane to temporarily induce nanoscale electropores on the plasma membrane of biological cells. A nonlinear size-dependent equivalent circuit model of a single-cell electroporation system is proposed to investigate dynamic electromechanical behavior of cells on microfluidic chips during EP. This model consists of size-dependent electromechanical components of a cell, electrical components of poration media, and a microfluidic chip. A single-cell microfluidic EP chip with 3D microelectrode arrays along a microchannel is designed and fabricated to experimentally analyze the permeabilization of a cell. Predicted electrical current responses of the model are in good agreement (average error of 6%) with that of single-cell EP. The proposed model can successfully predict the time responses of transmembrane voltage, pore diameter, and pore density at four different stages of permeabilization. These stages are categorized based on electromechanical changes of the lipid membrane. The current-voltage characteristic curve of the cell membrane during EP is also investigated at different EP stages in detail. The model can precisely predict the electric breakdown of different cell lines at a specific critical cell membrane voltage of the target cell lines.
Introduction
Electroporation (EP) is a biophysical process in which an intense electric field transiently permeabilizes the cell membrane for the delivery of exogenous molecules due to the creation of volcano-shaped electropores. 1 In 1982, Neumann et al. 2 were the first to use a short-circuited electrophoresis apparatus for gene transfer into murine cells. Since then, the EP technique has been significantly improved over the past three decades.3,4 To date, many theoretical and numerical models have been proposed to describe EP phenomena5,6—for example, the continuum mechanics-based EP models, 7 stochastic mechanics-based models, 8 equivalent circuit models,9–11 and molecular dynamics simulations.12,13
Deng et al. 14 proposed a quasistatic electromechanical EP model to improve the formation, stabilization, and resealing processes of electropores on the cell membrane. Their energy-based model can determine the equilibrium pore size, the activation energy, and critical transmembrane potential of different types of cells. Agarwa et al. 15 used finite element simulations to determine the effect of size of target cells on electroporation. Their research illustrated that the larger cells have better survival and permeabilization rates. However, Henslee et al. 16 used experimental data to derive the critical transmembrane potential of different cell lines based on their sizes. They used a simplified equation to predict the transmembrane potential for different applied voltages. Their result challenges the generally accepted assumption that larger cells are permeabilized better than smaller cells for a particular cell line. One reason for different results could be because of the lack of a precise model to accurately estimate the critical transmembrane potential for different cell sizes in the EP system.
Chang et al 17 and Shagoshtasbi and Lee 18 described four different stages of structural changes of the cell membrane. Based on their description, prior to pulse application, the intact cell membrane is not permeabilized. After applying the electrical pulse, the critical transmembrane potential is quickly achieved, and as a result of electrical breakdown, first structural changes occur, and then the membrane is permeabilized. The structural changes of the cell membrane at this stage occur in the first few milliseconds after applying electrical pulses. 19 Later, as a result of transportation of molecules along the electropore, more structural changes occur. Therefore, more expansion of the electropore is expected at this stage. Finally, after the electrical pulse is removed, the recovery stage starts.
The conventional lumped equivalent circuit models of EP are either too complicated or too simplified. Gowrishankar et al. 20 proposed a transport lattice method to construct a model with active and passive interactions, including 126,000 local transport models. Each local transport model also consists of several subcomponents. Cole 21 proposed a simplified model composed of four passive components to describe the impedance change of a stimulated Nitella cell in which the membrane resistance decreases once the other parameters of the system, such as membrane capacitance, remain constant.
Smith et al. 10 implemented a simple circuit composed of four elements for a uniformly polarized artificial membrane. The model considered the main parameters of the cell membrane, which are the membrane capacitance, the pore-variable resistance, and the constant resistance of protein channels. The total parasitic resistance of the experimental setup is considered a series resistance. Some of the main parameters of the system, such as parasitic capacitance of the experimental setup, are ignored in their model.
He et al. 22 derived a nonlinear equivalent circuit model of the electroporation system from electric impedance spectroscopy (EIS) of micro-EP chips. Their model comprised four elements. This model considers the nonlinear double-layer charge at the media and electrode interface based on electrochemical impedance spectroscopy. This model does not consider the corresponding elements related to the cell. The cell membrane and cytoplasm impedances are not considered. Their model has recorded the electrical current with and without the cell under an applied electric field. Based on the comparison between these two recorded currents, the total electroporation current passing the cell membrane is calculated.
Morshed et al. 23 derived an equivalent circuit model containing dynamic components for cell membranes and electropores. The dynamic behavior of electropores on the cell membrane during EP is modeled by a voltage-controlled resistor. This resistor is activated by a voltage-gate switch at a two-stage cascaded integrator. The model implements the voltage-controlled resistor to predict the breakdown voltage of cell membrane during EP. The mechanical components of cell membrane and pores are modeled by a voltage-controlled resistor. The derived equivalent circuit model predicts the dynamic behavior of electropores during EP.
As briefly described, for several decades, different research groups have investigated the permeabilization of cells under an applied electric field by experimental or theoretical methods. However, there has been a lack of reliable theoretical models of electroporation based on experimental data. Most of the proposed models are either static or semi-dynamic. The derived models mostly ignore the dynamic responses of the cell membrane as a coupled electromechanical system. In this article, we propose a nonlinear equivalent circuit model for single-cell EP on microfluidic chips.14,16,18,24
In this model, first we derived different electrical elements of the electroporation system. Then, we considered the corresponding electromechanical elements of the cell. We derived the mathematical description of each element. The derived elements are basically a function of electroporation chamber geometry and cell size. Later, we derived the corresponding theoretical model to describe the nonlinear dynamic behavior of cells during electroporation. This model is based on coupled electromechanical responses of different elements of the whole system. We used different types of data derived from our micro-EP experiments, such as electrical current responses, to validate and improve our electroporation model. Finally, with our EP model, we studied different aspects of electroporation, such as the current-voltage, I-V, and characteristics of single-cell EP, and revealed the time response of electropores’ size and density at different stages of EP. The results are compared with micro-EP experiments using HeLa cells.
Methods
Single-Cell EP System
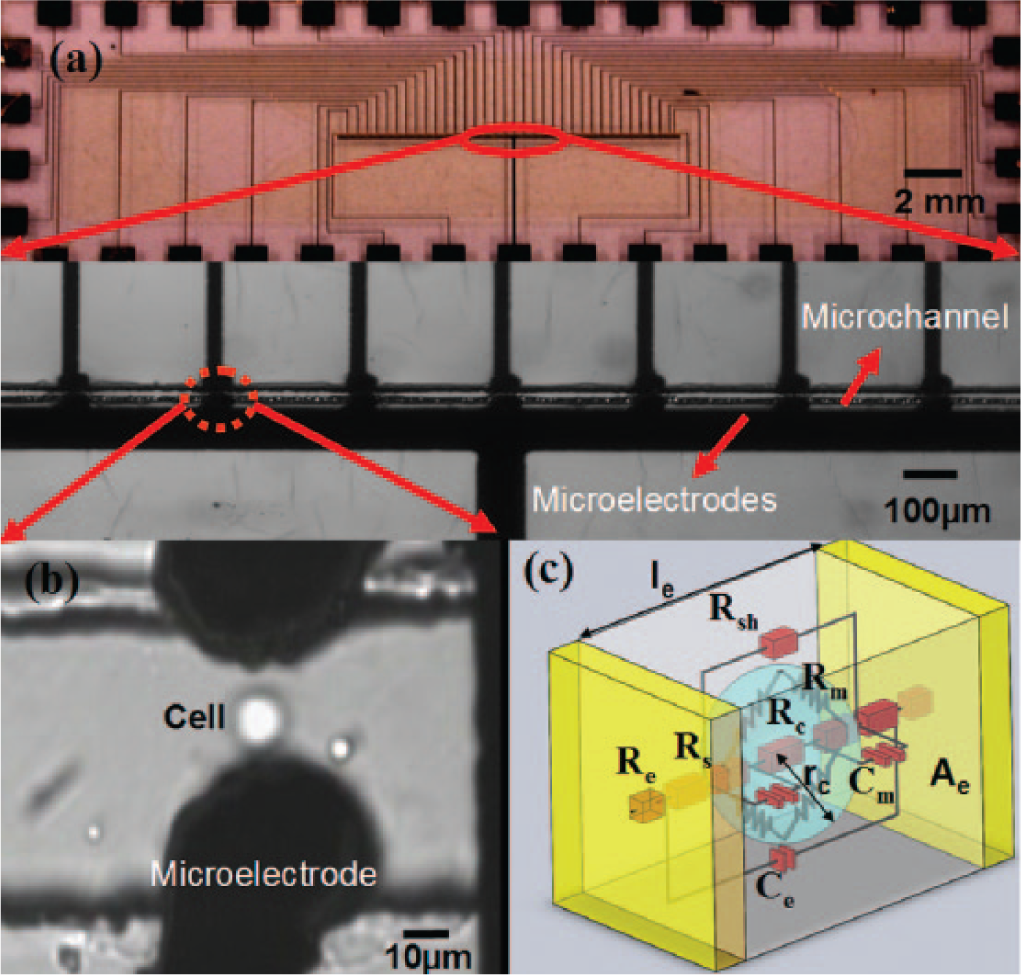
Figure 1a shows a fabricated microfluidic chip on a glass wafer (Pyrex 7740; Dow Corning, Midland, MI) for a single-cell EP composed of integrated 3D microelectrodes inside a microchannel. The seed electrodes, conductive pathways, and pads were patterned using the standard lift-off process. After plating the 3D microelectrodes on the seed electrodes, a layer of SU-8 3025 (MicroChem Corp., Newton, MA) was patterned to create a microchannel. This microchannel was patterned along the microelectrode arrays. Later, the SU-8 layer of the chip was sealed by a polydimethylsiloxane layer.
(
The experimental setup for a single-cell EP system is shown in Figure 2 . A MicroFluidic Control System (MFCS-4C; Fluigent, Paris, France) is used to control transportation of the suspended single cell in the microchannel to precisely position it in front of the pair of 3D microelectrodes. An optical micrograph ( Fig. 1b ) shows a suspended HeLa cell between a pair of microelectrodes. The 3D structure of microelectrodes generates the uniform electric field on the entire cell body.
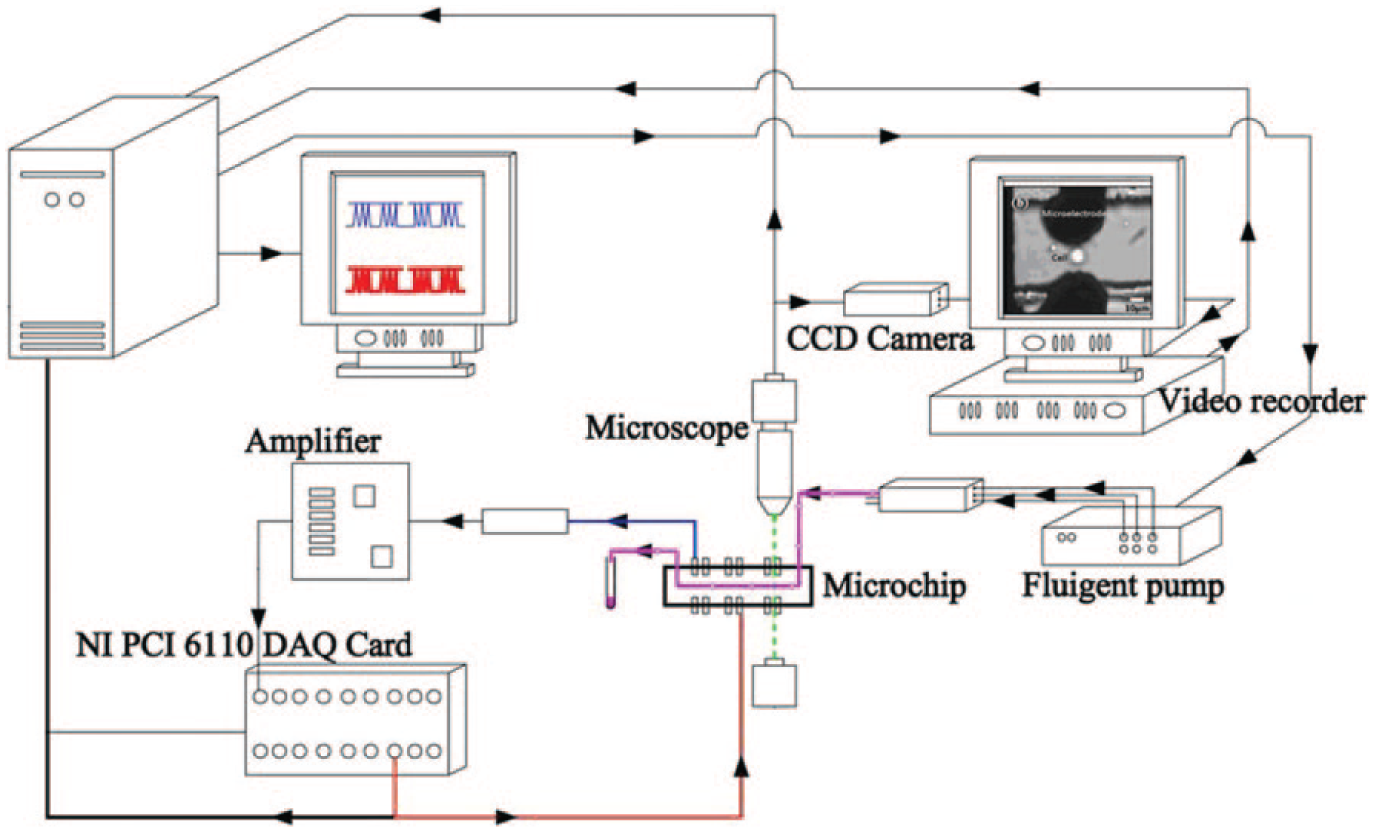
Block diagram of experimental setup for a single-cell electroporation (EP) system. The micro pump, Fluiwell (Fluigent, Paris, France), loads the suspended HeLa cells into the microchannel of a single-cell EP microchip. Once the cell reaches the pair of 3D microelectrodes, an electrical pulse is generated by a LabVIEW program and a PCI 6110 DAQ card (National Instruments, Austin, TX). The total electrical current for single-cell EP is amplified and recorded. The ICCD-350F (Video Scope International, Dulles, VA) records the fluorescence and bright-field video of an inverted fluorescence microscope (Olympus IX70; Olympus, Tokyo, Japan).
The suspended HeLa cells in phosphate-buffered saline (PBS) are mixed with the PI solution prior to being loaded into the reservoir of the micro-pump system (Fluiwell; Fluigent). Then, the cells are loaded into the inlet of the single-cell EP microchip by controlling the applied pressure on the reservoir using the MFCS-4C micro-pump. Once the cell enters the inlet of the microchip, it passes through the microchannel and crosses the EP 3D microelectrodes. Once it reaches the EP microelectrodes, the LabVIEW (National Instruments, Austin, TX) program generates the electrical pulse. The voltage is applied across the EP microelectrodes using the PCI 6110 DAQ card (National Instrument, TXs). At this time, the electrical current of the single-cell EP is recorded. Finally, digital fluorescence microscopy is used to investigate the successful permeabilization of the cell. The video is recorded using the ICCD-350F (Video Scope International, Dulles, VA).
Formulation
Figure 1c shows the schematics of a single cell between two 3D microelectrodes, including some of the electromechanical components of the EP system. To consider both the electrical and mechanical behavior of single-cell EP, a nonlinear size-dependent equivalent circuit model is proposed. Here, a cell is assumed to be a sphere with a radius of rc, composed of the cytoplasm enclosed by the thin-lipid bilayer membrane. The system consists of several distinct elements: the resistance of the EP electrode, Re; the resistance of the poration media between the electrode and cell, Rs; the resistance of the media in parallel with the cell in which the leakage electrical current passes through, Rsh; and the parasitic capacitance corresponding to the charges accumulated on the electrodes, Ce.
The value of Rs can be determined based on the medium resistivity, ρ; total length of the gap between microelectrodes, le; cell radius, rc; and microelectrode cross-sectional area, Ae:

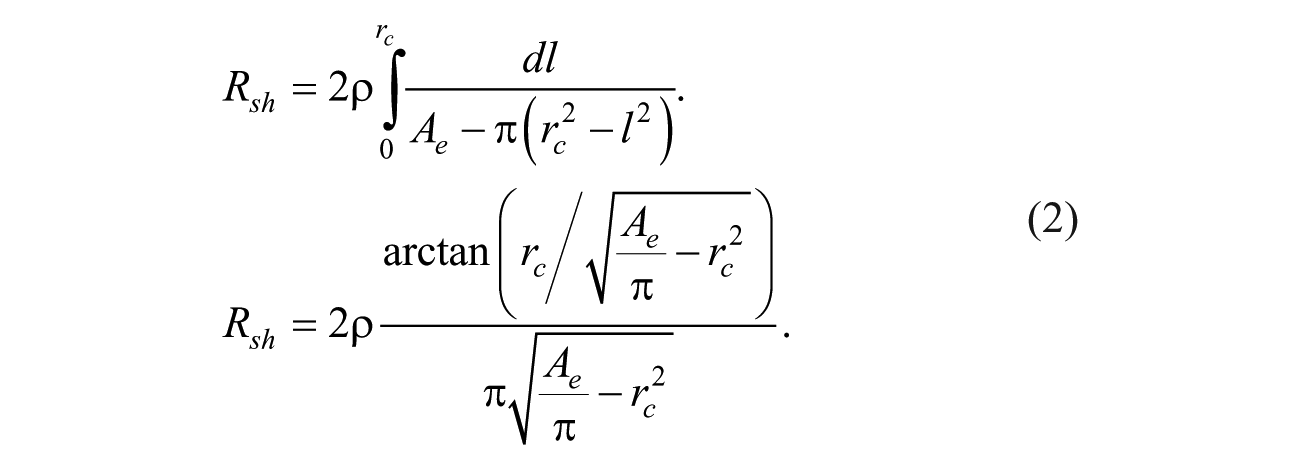
Rsh is the total resistance of the medium inside a cuboid with a cross-sectional area of Ae and length of 2rc surrounding a sphere with a radius of rc with infinite resistance. Here, the spherical shape is the cell that is located inside the cuboid and is tangent to two faces of the cuboid in parallel with the microelectrode surface.
The shunt current just passes through the medium inside the cuboid around the spherical cell. To determine the Rsh, the cuboid is assumed to be divided into infinite cuboids in parallel to the microelectrode surface. Therefore, total cross-sectional area of each proposed new cuboid is the total area of microelectrode minus the cross-sectional area of the cell at that position. All resistances of the new cuboids are connected in series to derive Rsh. Therefore, the Rsh is the integral of the resistance of each new proposed cuboid as follows (see
The essential electric components of a cell include membrane resistance, Rm; cytoplasm resistance, Rc; and cell membrane capacitance Cm. Rc and Cm are functions of cell radius. The resistivity of the media, ρ, is different from that of cytoplasm, ρ cyt . The resistance of the cytoplasm, Rc, as an ideal sphere is infinite as follows:

To overcome the singularity of equation (3) when l = rc, it is assumed the cytoplasm shape is a sphere with two cuts from its two lateral faces in parallel with the microelectrode surface. Here, the total length of this resistance is assumed to be 1.8rc, and the integration in equation (3) can be conducted from l = 0 to l = 0.9 rc with a controllable accuracy of 95 estimated based on our experimental electrical current responses of EP. The axis of this resistance passes the center of the cell, perpendicular to the microelectrode surface. Thus, the cytoplasm resistance, Rc, is calculated as follows:

The specific capacitance of the cell membrane, Cmua, 25 is used to estimate the membrane capacitance:

The intact cell membrane is impermeable to most extracellular molecules/ions, and therefore its ionic resistivity is too high. Once the external electric field is applied, the cell membrane permeabilizes, and consequently, its conductivity increases. An increase in the conductivity of the cell membrane is the overall result of the expansion of all electropores on the membrane. Therefore, the increase in conductivity of the membrane is a function of the total number of electropores and their radius.10,26 The electrical resistances of these electropores are assumed to be in parallel. Therefore, the total resistivity of the cell membrane, Rm, is equal to the sum of the resistances of all electropores in parallel. Therefore, once the total area of the induced electropores on the cell membrane increases, the total resistance of the membrane decreases. The resistance of the induced single electropore, Rp, on the cell membrane consists of two different resistances: the input resistance at the entrance area of the electropore and the electrolyte resistance along the electropore length. 27 Therefore, the total resistance of the membrane during the EP can be estimated as follows:

where N is the total density of electropores, h is the membrane thickness, and Acell is the surface area of the cell membrane. For small nanopores, the dominant parameter is electrolyte resistance. However, for larger nanopores, the input resistance is considered a major factor in total resistivity of the single nanopore.
It is clear from the described equations (1),(2), (4), and (5) that the EP system specification is a function of cell radius. As shown in
Figure 3a
,
b
, the Rs and Rc are smaller for larger cells, but Rsh and Cm are larger for larger cells. It is assumed the cell size does not change during the short period of applied EP pulse (see
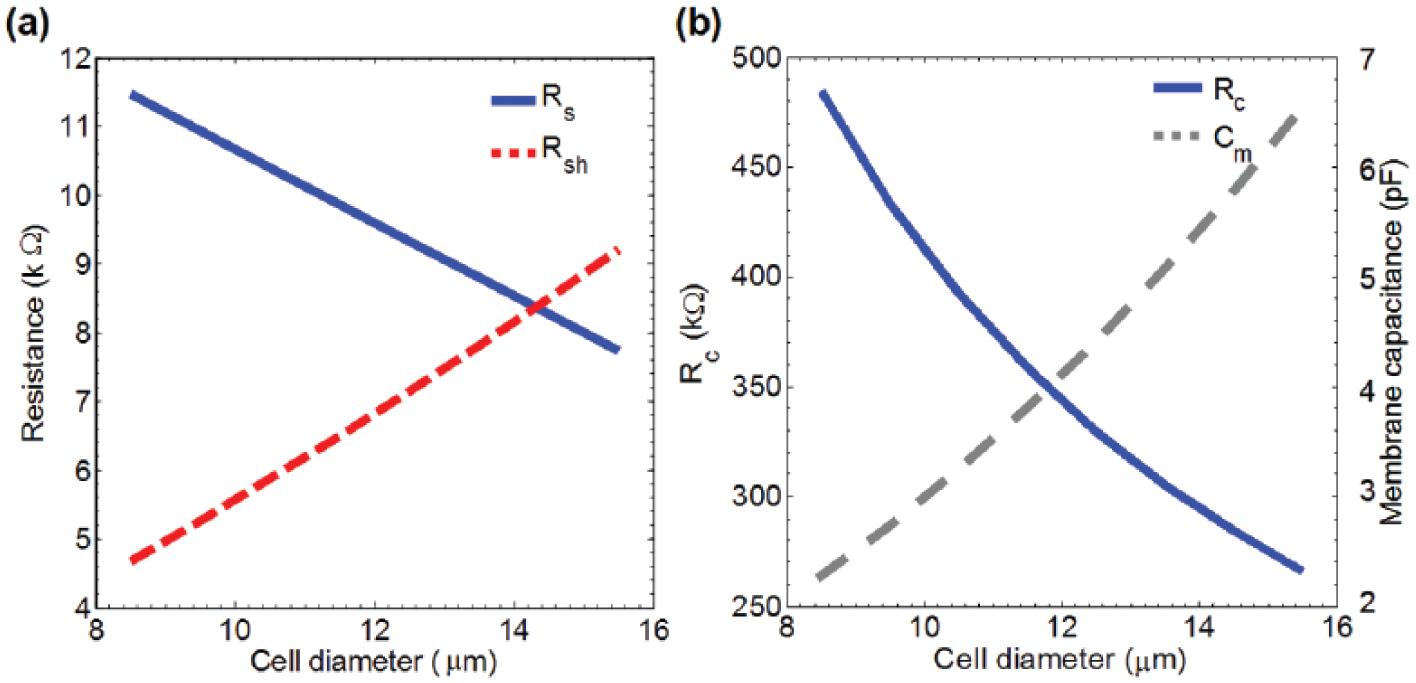
Simulation result of size-dependent components of the electroporation (EP) system for suspended cells between a pair of microelectrodes inside a microfluidic channel: (
Equivalent Circuit Model
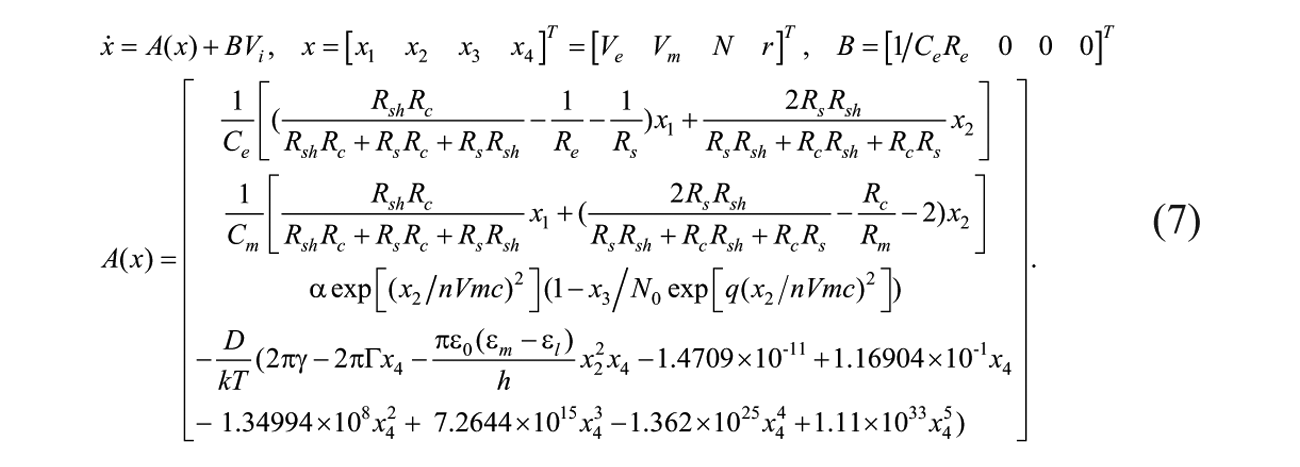
The nonlinear size-dependent model of EP summarized in equation (7) consists of four state variables: the voltage across the EP electrodes, Ve; the transmembrane voltage, Vm; the density of pores, N; and the average pore radius, r. The pore radius and density are functions of Vm and time. Vm is also a function of the applied electric field, Ve, and the total area of pores on the cell membrane (derived from r and N). According to Kirchhoff’s voltage law (KVL), the first two equations in equation (7) can be derived for Vi and Vm ( Fig. 4 ), respectively. The third equation is for the density of the pores, N, on the cell membrane, from which we generalize the result from Neu and Krassowska 30 by considering the different EP breakdown voltages of different cells. The fourth equation is for the average radius of the pore, r.14,29
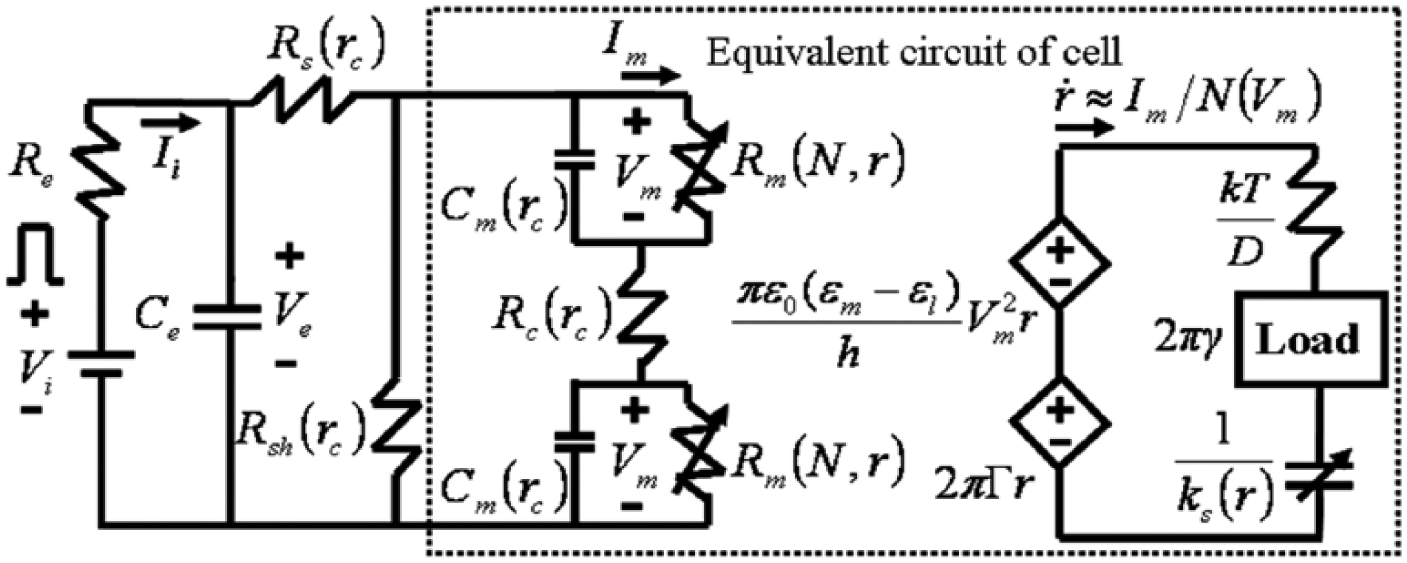
The nonlinear electromechanical electroporation (EP) model consists of two main electromechanical parts. The dashed-line rectangular box includes the components of cell. The cell membrane capacitance (Cm), series (Rs), shunt (Rsh), and cytoplasm (Rc) resistances are functions of the cell size (rc). The cell membrane resistance (Rm) is a function of pore density (N) and the pore radius (r). The equivalent circuit for the pore dynamics is illustrated on the right-hand side. The two controlled voltage sources are corresponding energy source for the applied voltage (Vm) and the surface tension (2πΓr). The line tension (2πγ) is represented by a constant load; the nonlinear spring (ks(r)r) for the membrane elasticity is represented by a nonlinear capacitance. The energy dissipative element (kT/D) is represented by a resistance. The total current passes the cell membrane, Im, is a part of total EP current, Ii, passes the EP system.
In equation (7), α is the pore creation coefficient, Vmc is the critical voltage (or called characteristic voltage) of EP, n is the specific EP factor depending on the cell line used in the experiment, and N0 is the equilibrium pore density at Vm = 0 and q = (rm/r*), 2 where rm and r* are the minimum radius of hydrophilic pores and minimum energy radius at Vm = 0, 30 respectively. Electroporation factor is introduced to consider the biodiversity of different cells, such as HeLa cells, red blood cells, and myoblast cells in comparison with the definition of the characteristic voltage of electroporation in Neu and Krassowska. 30
The pore radius, r, can be obtained by the fourth equation in equation (7), where the cell membrane is assumed to be hyperelastic by using the Mooney-Rivlin model. 31 The pores are assumed to be cylindrical for the derivation of the free energy, E(r), of the cell membrane, consistent with previous research work 14 . Here, γ is the edge energy along the circumference of the pore, Γ is the surface energy per unit area of a pore-free membrane, and ε0, ε m , and ε l are the vacuum permittivity, dielectric constant of media, and lipid membrane, respectively. The pore radius is governed by a first-order differential equation 29 :

where D is the diffusion coefficient of pore radius, 10 k is the Boltzmann constant, and T is the absolute temperature.
The lumped-equivalent circuit model of derived equation (7) is shown in
Figure 4
. The equivalent electrical components for mechanical behavior of one of the electropores are shown on the right-hand side of
Figure 4
. The transformation of electrical energy to mechanical energy is analogous to a voltage-controlled voltage source in modern microelectronics.
32
The equivalent circuit representation for line tension, surface tension, electric force, and nonlinear elasticity is analogous to a constant load, two distinct controlled voltage sources, and a nonlinear capacitance, respectively. The energy dissipative element, kT/D, is considered a viscous damper that is analogous to a resistor. This element dissipates the energy of the system to heat (see
Results
Numerical Simulation
Our new EP model will be validated by micro-EP experiments using HeLa cells. The electrical current responses of EP were measured by using the fabricated microfluidic single-cell EP chip as shown in
Figure 1
and micro multicell EP chips in our previous study.
11
The experimental current responses are shown as the solid line in
Figure 5
. The predicted current responses in MATLAB (MathWorks, Natick, MA) based on the proposed EP model are shown as the dashed line in
Figure 5b
. The proposed EP model shows a good agreement with the experimental results, and the average error between the experiment and our new model is 6% and 8% for single/multicell data, respectively. Note that the two constants in equation (7), the pore creation rate (α = 4 × 10²⁰ m−2s−1) and the pore diffusion coefficient (D = 1.7 × 10⁻¹⁵ m2s−1), were chosen to minimize the relative error between the simulation and experimental data. The corresponding values of α and D were obtained by a MATLAB program to minimize the relative error between the simulation and experimental data.
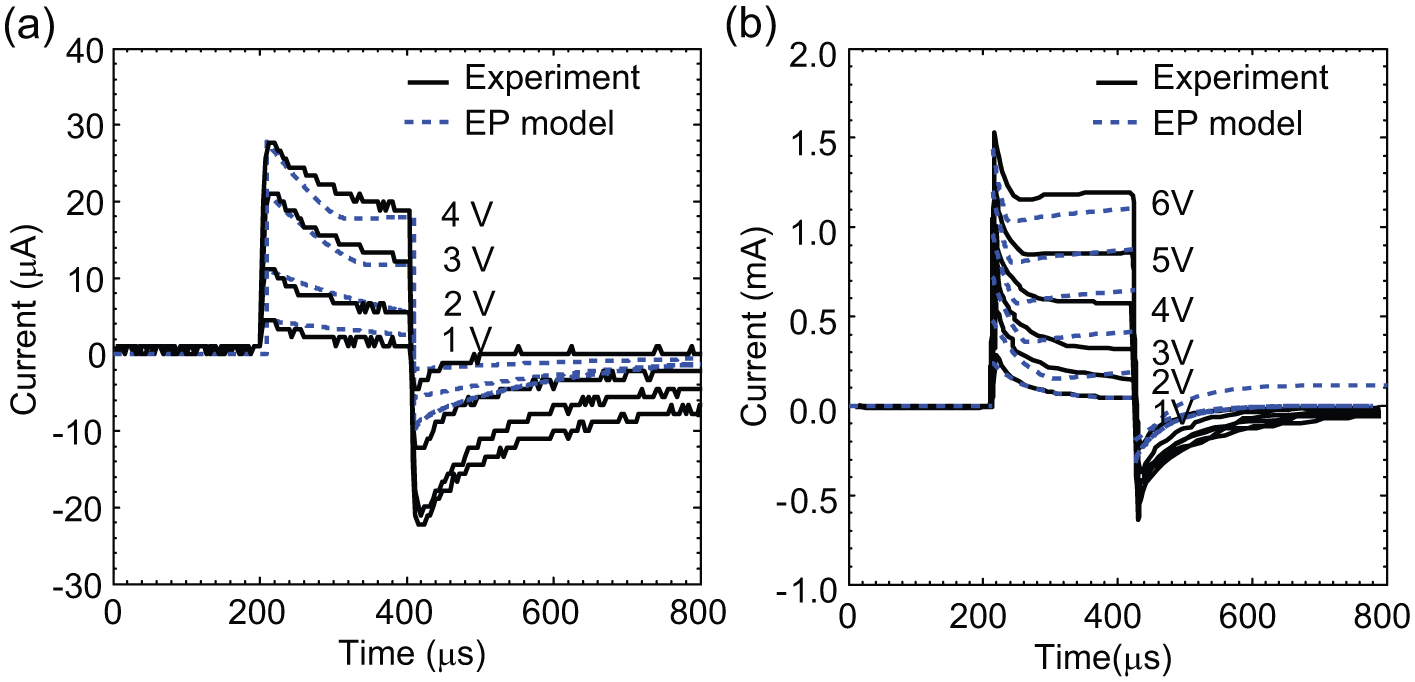
Transient response of the total electrical current to various applied electric voltages (Vi) during electroporation (EP) with HeLa cells in two different EP systems: (
Current-Voltage Characteristic of the Membrane
As discussed in the introduction, the electromechanical behavior of cells during EP consists of different stages. Here, we mostly focus on the second stage described by Chang
17
in more detail. The second stage is mostly related to the formation and expansion of the electropore to reach the steady state. At this stage, different electromechanical forces on the electropore reach equilibrium.
14
We discuss the electropore status during two steps: (1) the short period of pulse application and (2) right after pulse removal as the membrane discharges. We divide these steps into four stages. Each stage describes electromechanical changes on the cell membrane at the area of permeabilization.
Figure 6
shows the schematics of these four different stages of EP.
33
These stages are categorized based on electromechanical changes of the cell membrane during EP. These stages are the nonpermeabilized state (NPS), primary permeabilized state (PPS), secondary permeabilized state (SPS), and discharging state (DCH) (see
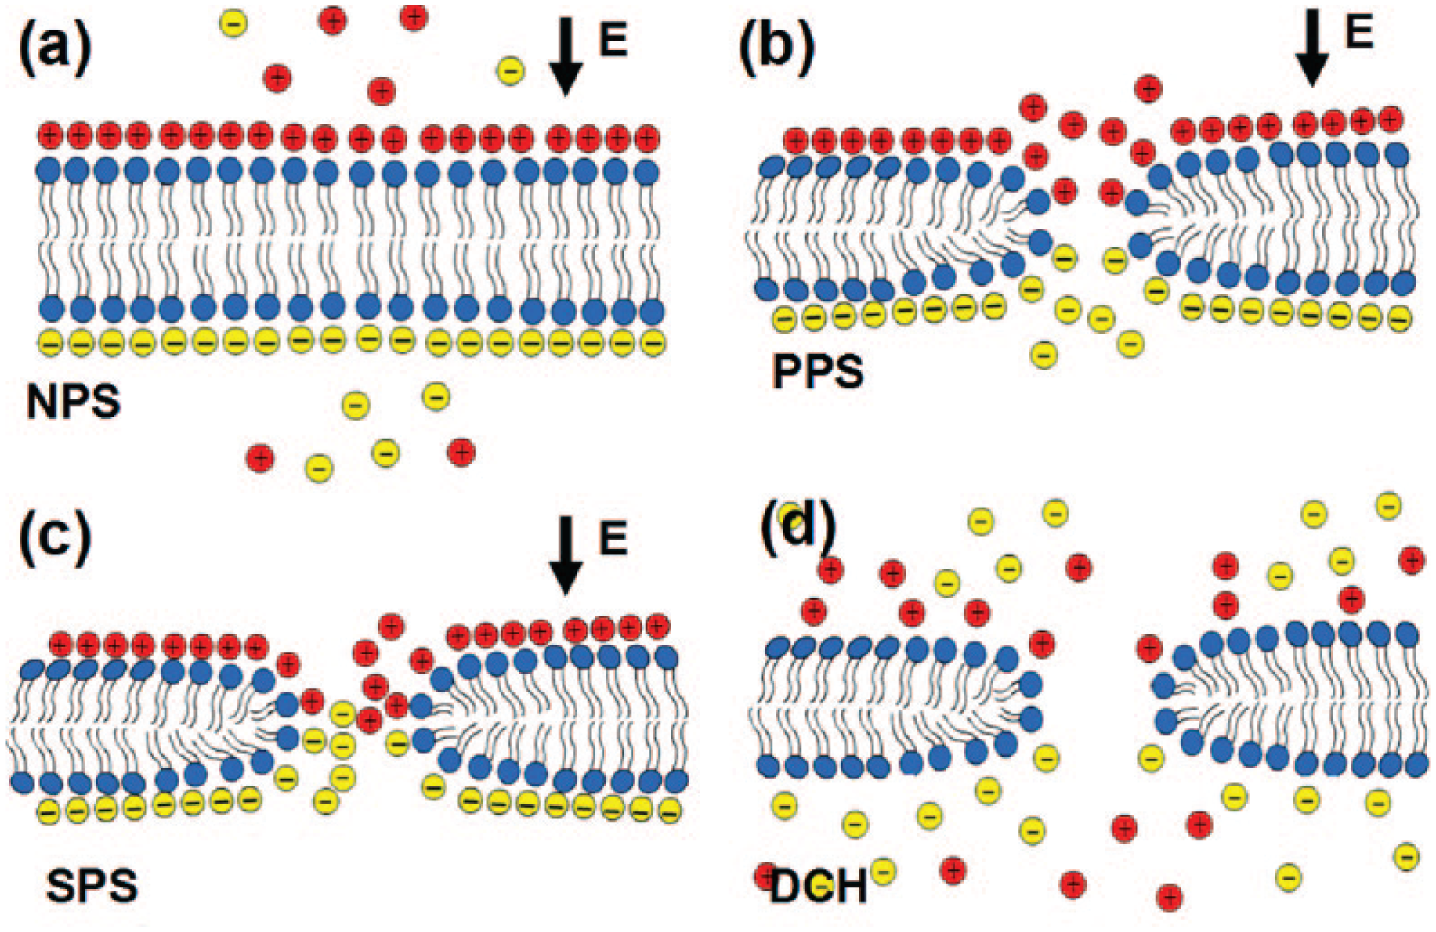
Schematics of different stages of electroporation (EP): (
As an intense electric field is applied on the cell, the cell membrane is charged with negligible structural change, referred to as NPS; consequently, some hydrophilic electropores are formed, referred to as PPS. Then, the hydrophobicity of pores changes, and hydrophilic pores are formed and the membrane permeabilized, referred to as SPS. 34 Once the applied electric field is removed, the cell membrane is discharged, referred to as the DCH state, and the electropores start resealing. 11
The I-V characteristic of an artificial lipid bilayer membrane under an applied electric field indicates that the pore formation and media properties are two important factors for nonlinear conductivity change on the lipid membrane.35,36 Our EP model enables us to investigate the transient I-V characteristic of the cell membrane and corresponding mechanical changes on the cell membrane such as the pore size and density at different stages of EP. Figure 7 shows the transmembrane current, Im, as a function of transmembrane voltage, Vm, at different EP states: NPS (solid line) for t = 0 to 12 µs, PPS (dashed line) for t = 12 to 29 µs, and SPS (dotted line) for t = 29 to 200 µs, where a single electric pulse with Vi = 6 V and td = 200 µs was employed to induce EP. The pore radius and density at the end of each EP state are shown in Figure 7 . The initial pore nucleus at the beginning of NPS is assumed to be the H-C bond distance (i.e., 0.11 nm).13,37 As a result of the applied electric pulse, electric charges gradually accumulate on the cell membrane, and the transmembrane potential gradually increases until it reaches 1.04 V at the end of NPS. The time period for this charging process is 12 µs. Note that, at the NPS, the transmembrane voltage is still lower than the critical transmembrane voltage, 1.27 V, for HeLa cells. 14 Therefore, during this stage, only minor structural changes occur on the cell membrane. At the end of NPS, the radius of the pore nucleus slightly increases to around 0.12 nm with a density of 21 µm−2, and still the membrane is nonpermeable to extracellular molecules.
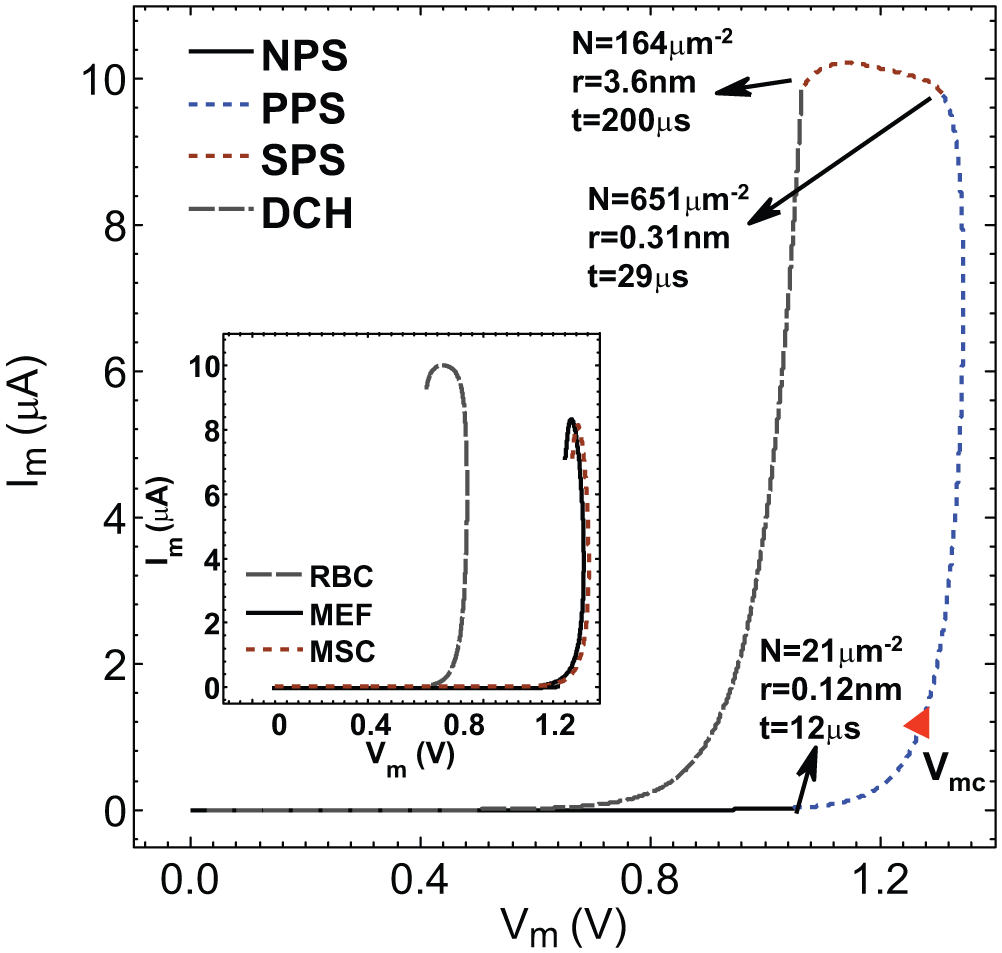
Numerical simulations illustrate the I-V characteristics of HeLa cell membrane under an electric pulse Vi = 6 V and td = 200 µs. The cell membrane during electroporation (EP) has four distinct states: nonpermeabilized state (NPS) for t = 0 to 12 µs, primary permeabilized state (PPS) for t = 12 to 29 µs, secondary permeabilized state (SPS) for t = 29 to 200 µs, and discharging state (DCH) for t = 200 to 380 s. The experimentally determined critical transmembrane voltage Vmc = 1.27 V 18 is marked for comparison. The pore density and average pore radius at the end of each state are also listed. The inset illustrates I-V characteristics of the cell membrane for three different cell lines during the EP pulse application in the first three stages of EP. Vmc for different cell lines are as follows 18 : chicken red blood cell (RBC): 0.72 V; mouse embryonic fibroblast (MEF): 1.31 V; bone marrow mesenchymal stem cells (MSC): 1.33 V.
At the PPS, the transmembrane voltage keeps increasing and finally reaches the critical EP voltage (1.27 V) for HeLa cells.
14
The time period for this process is 17 µs. Note that, with the increase of the transmembrane voltage, the induced electrostatic tractions acting on the electric pore’s sidewall provide a larger driving force for pore expansion.
14
Once the transmembrane voltage reaches 1.27 V, the pore density significantly increases to 1140 µm−2, which is the largest pore density during EP. At this stage, the average pore radius reaches 0.19 nm. Here, the pore density is larger than the pore density of 100 µm−2 in the previous report.
30
This value is the maximum pore density at a pore radius of ~1 nm. However, the maximum pore density is before the hydrophobicity of the electropores changes (0.3–0.5 nm). The value we reported here is related to maximum induced energy before hydrophobicity changes the region. Afterward, because of the charge transfer across the pore and pore expansion, the total energy across the membrane at the permeabilization region decreases, which causes most of the hydrophilic pores to reseal as a result of lipid fluctuations.30,34 Eventually, the pore density reaches 651 µm−2 with an average radius of 0.31 nm (see
At the SPS, the charges accumulated on the membrane continue discharging through the expanded pores. As the pore radius expands to 0.3 to 0.5 nm during t = 145 to 190 µs, some hydrophobic pores change to hydrophilic form, 38 which is consistent with the results from the molecular dynamic simulation of Leontiadou et al. 38 Finally, at the end of the applied electrical pulse, t = 200 µs, the average pore radius reaches 3.6 nm. The decrease in the total number of pores still continues, and at this time, the pore density reaches 164 µm−2.
Once the applied pulse is removed, the transmembrane voltage discharges in 180 µs, and the resealing process starts. Although the total time for the transmembrane discharging is in the sub-millisecond range, the reported resealing time is several seconds. 11 One reported pore density, based on scanning electron micrographs of rapid freezing of permeabilized human red blood cells, is 7 µm−2. This micrograph is taken approximately 40 ms after pulse application. Further study is needed to clearly describe the resealing process based on its large time constant.
We also apply our EP model in equation (7) to study the I-V characteristics of different biological cells. The critical transmembrane voltage, Vmc, previously estimated in previous work, 14 is as follows: chicken red blood cells (RBC): 0.72 V; HeLa cells: 1.27 V; mouse embryonic fibroblasts (MEFs): 1.31 V; and bone marrow mesenchymal stem cells (MSCs): 1.33 V. The estimated values of Vmc are implemented in our EP model. The I-V characteristics for these cells are illustrated in the inset of Figure 7 for the first three stages of EP. For all these three cell lines, the applied pulse charges the lipid membrane. As a result, the hydrophobic electropores are formed. Once the total energy at the area of permeabilization is large enough, the electric breakdown of the membrane occurs. Consequently, the hydrophobicity of electropores is changed. Therefore, more charges pass through the electropore, which results in discharging of the transmembrane voltage. Here, the size of all cells is assumed to be equal. I-V curves illustrate that the electric breakdown of the RBCs occurs at a lower transmembrane voltage compared with that of MEFs and MSCs. One reason could be the difference in the structure of the membrane of these cell lines.
In summary, a nonlinear size-dependent model for single-cell EP on microfluidic chips is proposed. The electrical parameter of this model, Re, Rs, Rsh, Rc, Ce, and Cm, is estimated based on size of the cell and characteristics of the micro-EP chip. Thanks to the derived strain energy model in our previous research, 14 we can correlate the pore size with the membrane deformation. In this way, the equivalent circuit is coupled with the mechanical process of EP, which makes it also different from conventional models. This way, the dynamic behavior of a single cell is studied in detail by considering the coupled electromechanical responses of different elements of the EP system. The model is used to investigate the dynamic responses of important parameters of EP such as cell membrane I-V at different stages of EP. The simulations data predicted by the current model are in good agreement with micro-EP experiments.
The proposed model is currently applied to develop the next generation of microfluidic EP systems with a higher cell viability and transfection rate. The model is also used to further analyses of single-cell EP. One particular implication of the developed model and cell membrane I-V characteristics is to further study the critical transmembrane voltage of a target cell line for different cell sizes. The model can also be used to estimate the diffusion of extracellular molecules into the cell as a result of difference in osmotic pressure. Therefore, this model can be used to estimate the swelling of the cells after electroporation. One typical application is to study the difference in swelling of healthy and cancerous cells under an applied electric field. One potential application of this study would be tumor detection 39 and separation of circulating tumor cells (CTCs) from healthy cells as a result of different swelling behavior.
Footnotes
Declaration of Conflicting Interests
The authors declared no potential conflicts of interest with respect to the research, authorship, and/or publication of this article.
Funding
The authors disclosed receipt of the following financial support for the research, authorship, and/or publication of this article: This work was supported by the Hong Kong RGC GRF grant (No. 16205314).
References
Supplementary Material
Please find the following supplemental material available below.
For Open Access articles published under a Creative Commons License, all supplemental material carries the same license as the article it is associated with.
For non-Open Access articles published, all supplemental material carries a non-exclusive license, and permission requests for re-use of supplemental material or any part of supplemental material shall be sent directly to the copyright owner as specified in the copyright notice associated with the article.