
Abstract
Many biological methods are based on single-cell isolation. In single-cell line development, the gold standard involves the dilution of cells by means of a pipet. This process is time-consuming as it is repeated over several weeks to ensure clonality. Here, we report the modeling, designing, and testing of a disposable pipet tip integrating a cell sensor based on the Coulter principle. We investigate, test, and discuss the effects of design parameters on the sensor performances with an analytical model. We also describe a system that enables the dispensing of single cells using an instrumented pipet coupled with the sensing tip. Most importantly, this system allows the recording of an impedance trace to be used as proof of single-cell isolation. We assess the performances of the system with beads and cells. Finally, we show that the electrical detection has no effect on cell viability.
Introduction
Many biological methods, including genomics, transcriptomics, proteomics, and cell cloning, rely on single-cell isolation to extract cell-specific parameters otherwise hidden in population studies.1–4 For example, tumor cell heterogeneity is now known to be responsible for cancer dormancy and relapse several years after a patient’s remission. Thus, the consideration and analysis of single cells has gained tremendous interest for cancer research and other diagnostic assays. As a consequence, numerous studies have proposed integrated methods to perform single-cell -omic analyses.5–11 Among commercially available products, one could mention the ICell8 12 (Takara, Kusatsu, Japan), the Polaris 13 (Fluidigm, South San Francisco, CA), and the Rhapsody 14 (BD, San Jose, CA). However, these solutions present a limitation when the cell content analysis is not sufficient for characterization, and the single cell has to be retrieved for further processing. Such is the case for assays requiring a cell culture.
Specifically considering cloning, recombinant protein production 15 is a typical example where genetically modified cells must be isolated individually and expanded in culture. Each of the single-cell clones is then screened to select for the best protein producer candidate. 16 In this context, the standard method used to isolate single cells is serial dilution. 17 This technique consists of pipetting a given volume containing on average only one cell per dispensed aliquot according to Poisson distribution. Serial dilution is prone to errors, as it often leads to multiple cells per aliquot or low recovery, that is, only a few aliquots with cells versus the overall number of aliquots generated. To lower the risk of a clone being derived from multiple cells, each of the clones is cultured for 1 week, diluted, and subcloned at least two to three times, hence turning this isolation step into a long process lasting for several weeks.
To avoid these limitations of serial dilutions and subsequent subcloning steps, one could use modern versions of fluorescence-activated cell sorting (FACS), 18 such as FACSAria (BD), which is now capable of isolating single cells into wells 19 despite being initially designed to analyze and separate cells into subpopulations. However, FACS uses fluorescent detection to select and separate the cells, which requires preliminary knowledge of the markers highly expressed by the target cells. Other limitations of FACS are inherent to the large dead volume of the fluidic tubing, which makes the instrument difficult to sterilize while enhancing the risk of cell loss, making it incompatible with a limited amount of input cells.
For such reasons, researchers developed several methods to perform direct isolation of single cells, while allowing their label-free retrieval. Gross et al. performed a thorough analysis of some of these techniques and compared their respective advantages and limitations. 20 An example is laser capture microdissection where a microscope supplemented with a laser gives the ability to extract a single cell from a tissue. 21 Another technique widely used is cell picking, with the examples of the TransferMan (Eppendorf, Hauppauge, NY) and the CellCelector 22 (ALS, Jena, Germany). Under a microscope, a single cell is selected and aspirated from a dish using a capillary terminated with a diameter slightly bigger than a cell. This single cell of interest is then simply ejected in another container used for the culture. 23 Both techniques require technical skills and offer a limited throughput. Two fully automated alternatives have been proposed, both relying on high-throughput optical feedback: the CellenONE (Cellenion, Lyon, France) uses a piezoacoustic drop-on-demand to dispense the cells, 24 while the x-sight (Cytena, Freiburg im Breisgau, Germany) uses a pneumatic shutter.25,26 Such instruments, despite being efficient and automated, remain expensive.
These considerations support the need for a simple, user-friendly, handheld tool that would specifically answer the challenges of single-cell isolation, in particular for processes where the single cell is going to be further manipulated and cultivated. In the 1950s, Wallace Coulter invented an instrument for detecting and counting particles suspended in a conductive liquid. 27 The principle of the Coulter counter consists of passing particles through an aperture while applying an electric current between the two compartments, which results in an impedance change that depends on the particle volume. To apply the electric current, one electrode is placed in each of the compartments separated by the aperture. When a particle passes the aperture, its section is diminished, leading to the decrease of the electrical current and the increase of the impedance. The electrical current is measured, and the current drop detected to count the particle passage. The bigger the particle passing the aperture, the larger the current drop. This paper discusses the modeling, designing, and performance testing of a disposable sensing tip, relying on this Coulter counter concept, and developed specifically for single-particle detection and subsequent dispensing.
Materials and Methods
Bead and Cell Sample Preparation
We dispersed nonfluorescent polystyrene beads of 6, 10, and 15 µm (Polybeads; Polysciences, Warrington, PA) and fluorescent beads of 10 µm (Fluoresbrite; Polysciences) in medium (Dulbecco’s phosphate-buffered saline [DPBS] 1×; Thermo Fisher Scientific, Waltham, MA). We then measured the resistivity of this medium (electrical resistivity ρ = 0.65 Ωm). We diluted the beads to a working concentration of 104/mL for the particle size assay and 5 × 10³/mL for the particle dispensing assay.
We cultured murine fibroblast (3T3-J2) cells as previously described. 28 We detached adherent cultured cells with trypsin/EDTA (Sigma-Aldrich, St. Louis, MO), filtered using a 40 µm cell strainer (BD) and then diluted to a final concentration of 104 cells/mL. As the suspending medium, we used Hank’s balanced salt solution (HBSS; Gibco–Thermo Fisher Scientific, Waltham, MA) complemented with 3% bovine serum (BS; Gibco–Thermo Fisher Scientific).
Fabrication and Quality Control of the Sensing Tip
We started the fabrication process of the sensing tip (
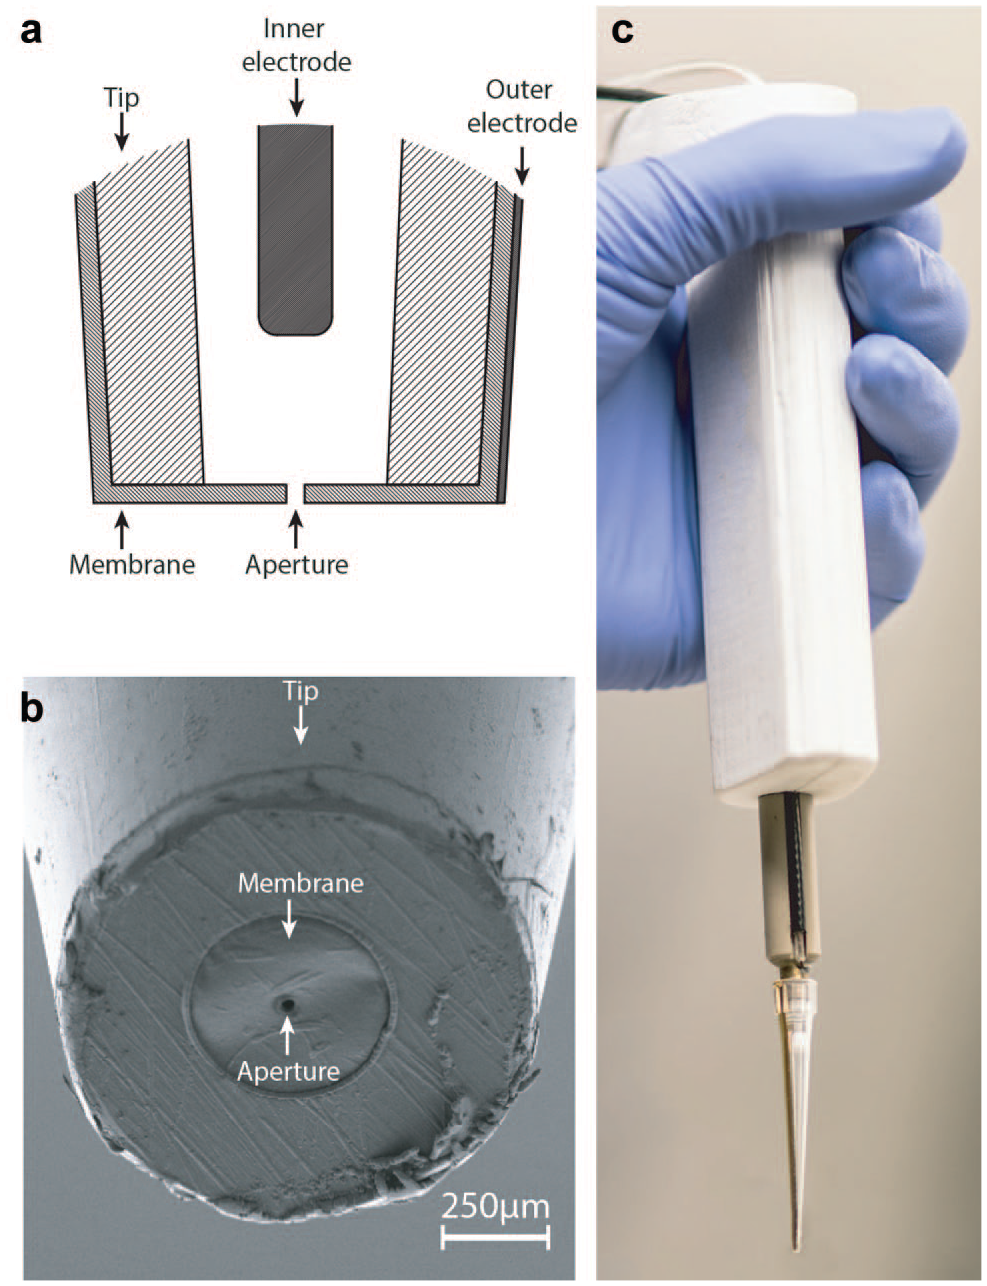
Design and implementation of a single-cell dispenser integrated in a pipet tip. (
Fluidic and Electric Instrumentation of the Pipet
To dispense the cell, a system controller consisting of a LabVIEW (National Instruments, Austin, TX) algorithm running on a PC coordinates a flow controller and an impedance analyzer. When a single cell is required, the pressure-based flow controller with a range of −25 to 25 mbar (MFCS-EZ; Fluigent, Okabé, France) starts the flow of the previously loaded medium from the sensing tip. The pumping system consists of a push–pull pump capable of both aspirating to load the tip and dispensing the medium containing the particle. This has been described above. The loaded medium contains a cell suspension in a concentration range between 103 and 105 cells/mL. The impedance of the sensing tip is measured according to a lock-in demodulation principle with an electronic circuit that implements an integrated lock-in demodulator (SI-QSD; Sensima, Gland, Switzerland). On the outer electrode, an excitation frequency of 49 kHz with an amplitude of 0.5 Vpp is applied by the SI-QSD. From the inner electrode, the current is amplified using a transimpedance amplifier (OPA2350; Texas Instruments, Dallas, TX). The amplified current is then measured and the impedance is determined using the acquisition, demodulation, and filtering capabilities of the SI-QSD. Impedance measurements are then transmitted to the system controller at a sampling rate of 2.4 kHz. A high-pass filter at 6 Hz is applied on the signal to remove the slow variation of the signal baseline due, for instance, to medium conductivity changes as well as aperture obstruction. On the filtered signal, peaks representing particle passage are detected using a threshold above the noise level. Each signal with a magnitude exceeding the threshold triggers the peak detection. The peak is validated and considered as a particle passage when the signal magnitude returns below the threshold. Impedance peak height is then extracted to deduce the particle size. When a single particle is detected, the flow is automatically stopped and the impedance data are saved. The whole procedure is triggered again when needed, to dispense the next single particle.
Bead Dispensing Assay
Before dispensing, we loaded 20 µL of beads (5 × 10³ beads/mL of DPBS) in the sensing tip. For the dispense, we manually immersed the tip in a well containing 150 µL of DPBS for 96-well plates and 6 µL of DPBS for 1536-well plates, respectively. The dispensing pressure of −0.3 mbar was applied in addition to the hydrostatic and capillary pressure. Once an impedance peak was detected above the 20 Ω threshold, the system waited for 500 ms to avoid reaspiration of the bead and automatically switched to the holding pressure of −0.9 mbar to avoid further bead dispensing. We then manually extracted the sensing tip from the well and recorded the impedance trace together with the well number.
Cell Viability Assay
For live/dead staining, we incubated 3T3-J2 cells with 1 µM calcein AM for 30 min (Thermo Fisher Scientific). In a first well, we dispensed 100 cells by serial dilution using a conventional pipet as the positive control. In a second well, we dispensed 100 cells using the instrumented pipet. In the third well containing 20% ethanol, we dispensed 100 cells by serial dilution as the negative control. We repeated each of the conditions in triplicate, with the cells left to sediment for 30 min. Then, we imaged the wells containing the cells under an inverted fluorescent microscope (Axiovert 200M). We analyzed the images and manually counted the number of live (green, fluorescein isothiocyanate [FITC]) versus dead (unstained) cells. We calculated the ratio of live cells to total cells for every condition to estimate cell viability.
Results
Principle of the Sensing Tip and Design Considerations
As illustrated in
Figure 1
, the tool presented in this study combines (1) a sensor located at the end of a pipet tip to detect particle passage with (2) a specific instrument to dispense single particles on demand into a commercially available pipet tip, which is disposable and made of polypropylene. This allows the compatibility of the sensing tip with living cells and cell culture. To perform the dispensing function, the detected cells should leave the tip with little risk of being trapped in potential dead volumes. In this regard, we built the integrated cell sensor as the last interface of the tip with the outside world, and designed it according to a Coulter counter topology.27,31,32 This event detection principle is simple and particularly well suited for single-cell dispensing, as it requires only a membrane containing an aperture, along with inner and outer electrodes (
Electric Modeling of the Sensing Tip
The sensing tip impedance and its variation as a result of a particle passage can be modeled with a one-dimensional analytical model. This model describes the real resistive part of the sensing tip impedance, neglecting the membrane, tip, electrode, and stray capacitances. It assumes that the impedance measurement of the modified pipet will be performed in the resistive plateau frequency range. This model approximates the electrical resistance in infinitesimal sections along the sensing tip axis, using resistivity law for the bulk contribution and considering the spreading resistance in close proximity to the sensing tip aperture.
The model is segmented in four domains corresponding to the pipet geometry as shown in Figure 2 . (1) Domain 1 starts at x = –De/2, which is assumed to be an equipotential given by the outer electrode and ends at the aperture entrance. This domain is the space outside the sensing tip, where only the spreading resistance contribution is relevant. (2) Domain 2 corresponds to the space inside the aperture, which is a cylinder of diameter d and length e along the x axis, where the electrical resistance is given by the resistivity law of the bulk only. (3) Domain 3 corresponds to the portion of the conical part of the sensing tip that is located between the aperture and the inner electrode at a distance l. In this domain, the value of the electrical resistance is approximated to either the value given by the resistivity law or the value of the spreading resistance, depending on the one that has the highest value. (4) Finally, domain 4 is part of the tip of total length L, where the inner electrode is present. In this domain, the electrical resistance is assumed to be zero, as the resistivity of the metal is very low compared with that of the liquid contained in the tip.
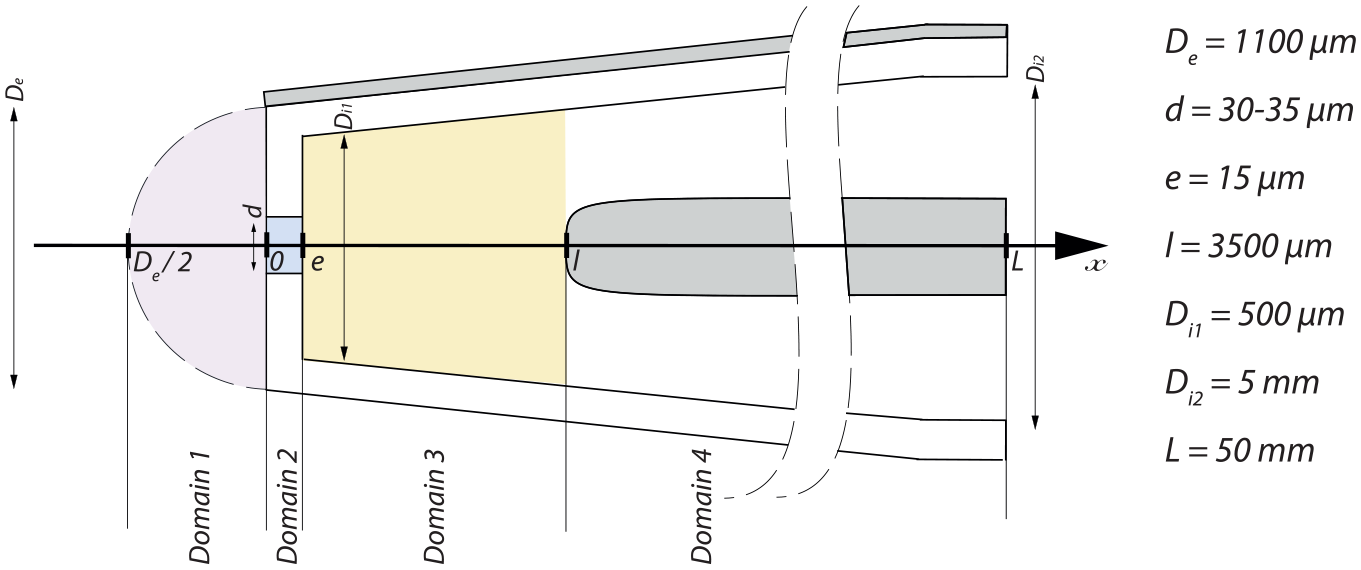
Sketch of the sensing tip segmented into four domains, with the corresponding dimensions that define the analytical model. De represents the distal external tip diameter, d the aperture diameter, e the membrane thickness, l the membrane-to-electrode distance, Di1 the distal inner tip diameter, Di2 the proximal inner tip diameter, and L the tip length.
In every subdomain, the effective section is corrected by subtracting the particle section Sparticle obstructing it. The particle is assumed to be a sphere of perfect dielectric material, with no current flowing through. Equation 1 describes the infinitesimal electrical resistance dR for each infinitesimal section of thickness dx along the pipet length:
This expression of the differential resistance allows the calculation of the sensing tip impedance with or without particles by integration along the tip axis. The evolution of the electrical potential in the structure is derived from the evolution of the impedance using Ohm’s law. We used the same model to express the sensitivity of the sensing tip to the particle size and membrane thickness, as well as the ratio of the aperture diameter to the membrane diameter by comparing the total tip impedance variation during a particle passage.
Characterization of the Sensing Tip Impedance Profile
Identification of the Sensitive Area
Using Equation 1 of the analytical model, we calculated the impedance magnitude and the electrical potential distribution of the sensing tip for the actual tip dimensions: De = 1100 µm, d = 30 µm, e = 15 µm, l = 3500 µm, Di1 = 500 µm, Di2 = 5 mm, and L = 50 mm. Figure 3a shows the magnitude of the impedance from the outer electrode along the tip structure and the electrical potential drop along the same structure, according to the indefinite integration of eq 1. Forty percent of the impedance magnitude increases and the electrical potential drops, respectively, are located within the second domain, that is, the aperture region. When considering a region that extends by only 15 µm on both sides of the membrane, that is, a region that takes into account the spreading resistance, the impedance increase represents 60% of the total impedance magnitude. This 45 µm long region, centered on the membrane, defines the sensitive area of the tip. This typical behavior is expected from a Coulter counter topology, where most of the impedance magnitude increase is localized in a sensitive area whose size has the same order of magnitude as the particle to be detected. In this design, the aperture is the area of greatest sensitivity while also having minimal dead volume. This allows the detection of each particle escaping or entering the tip by passing through the aperture.
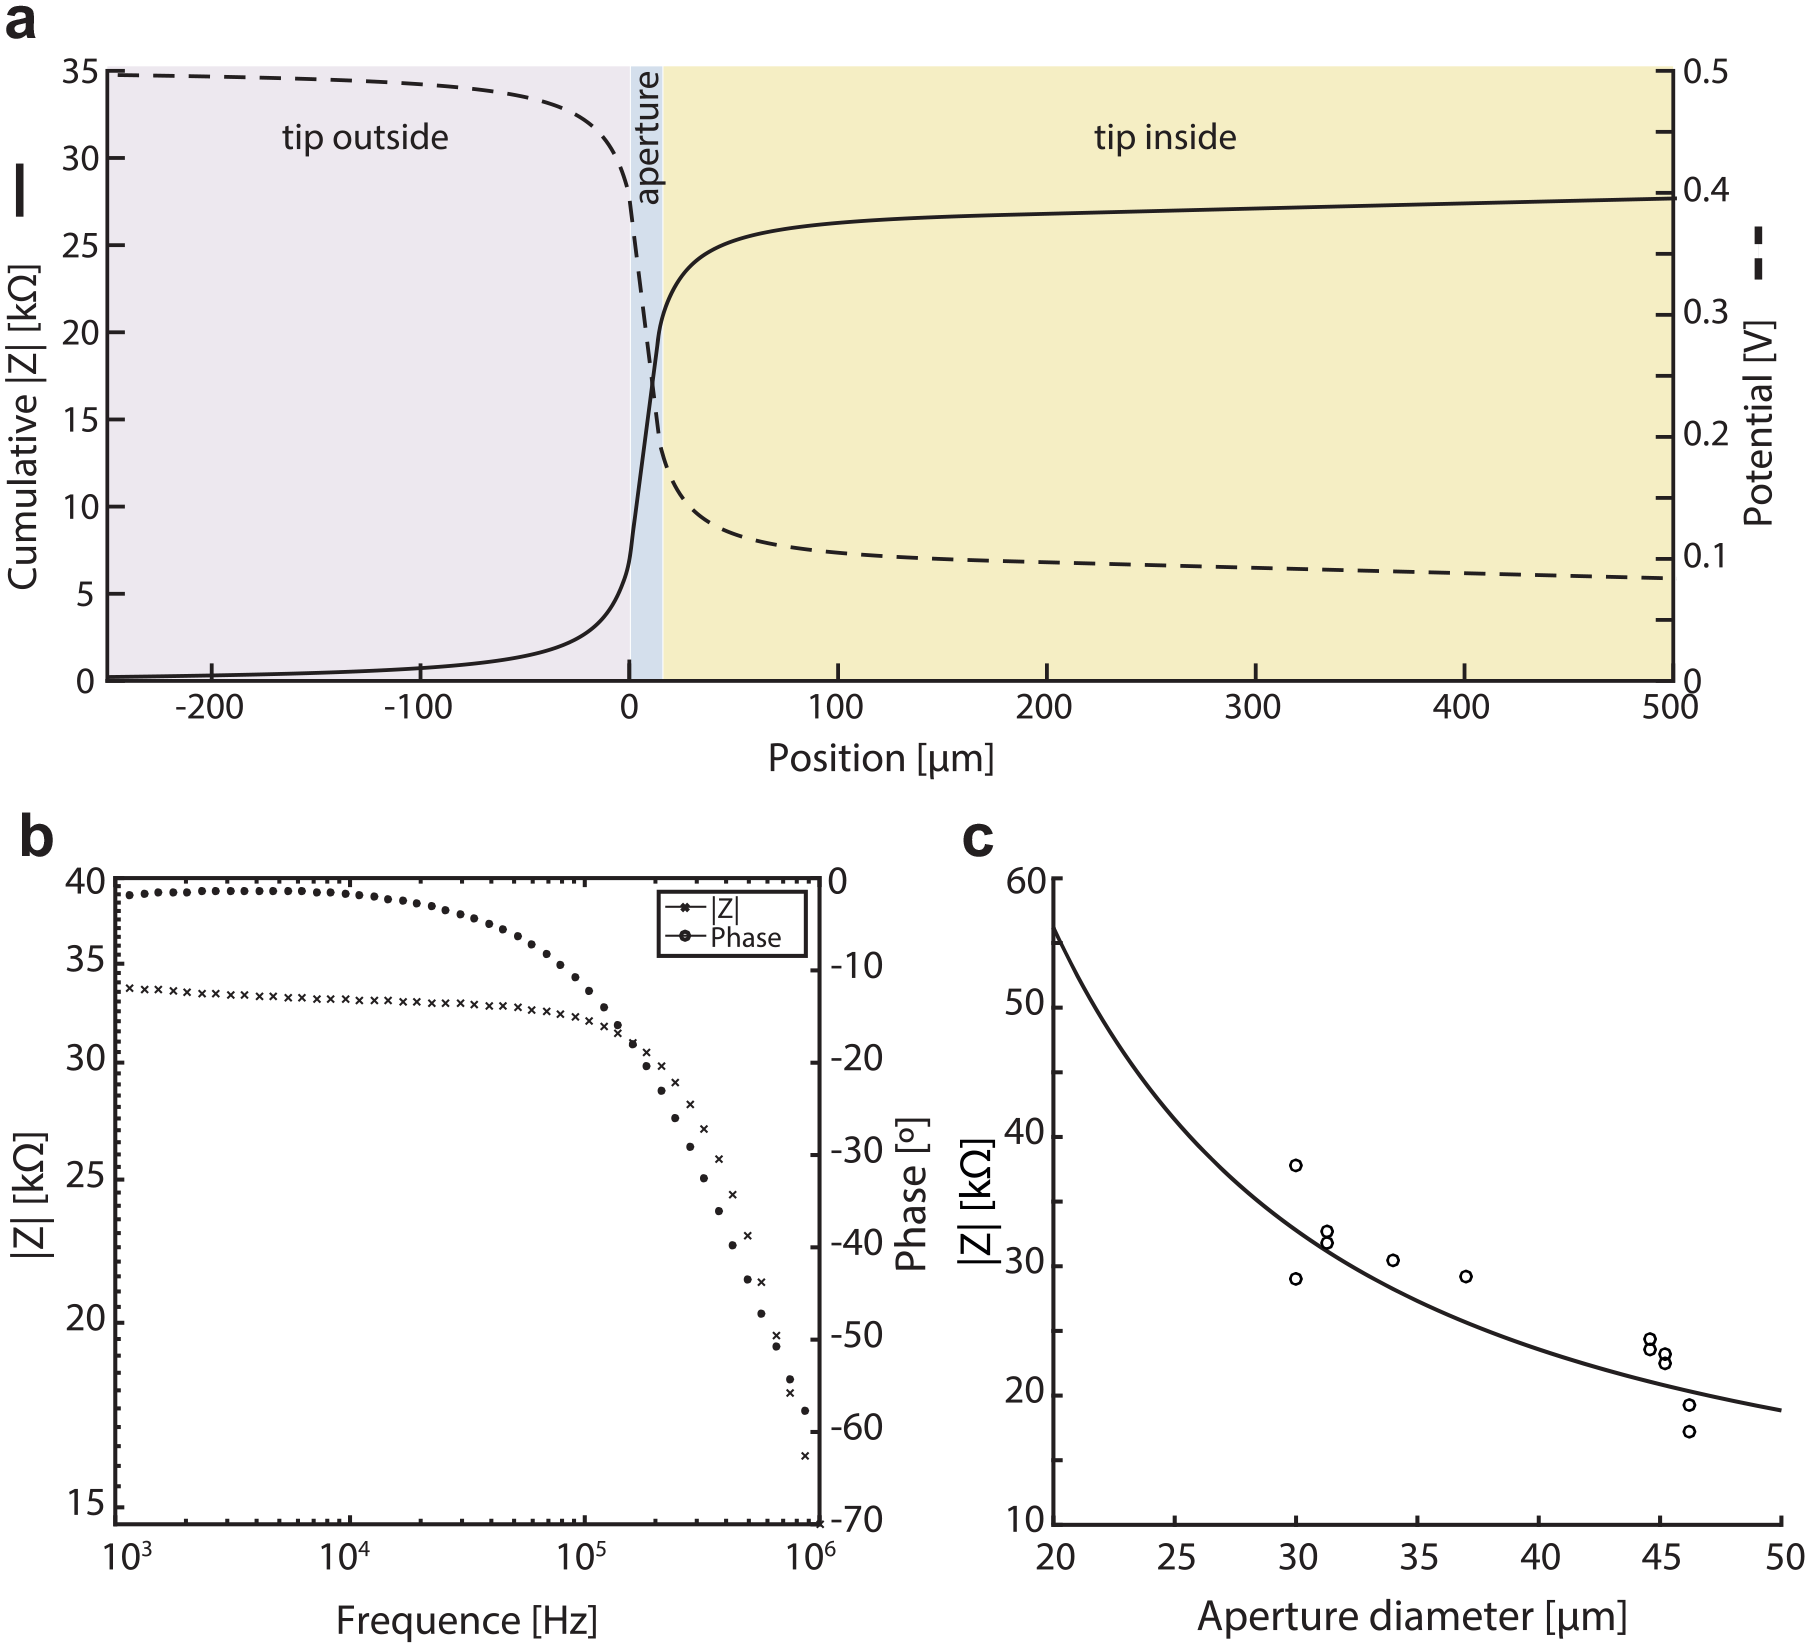
Analytical and experimental characterization of the cell sensing tip. (
Identification of the Optimal Excitation Frequency
To select the optimal excitation frequency, we measured the impedance magnitude and phase spectra of a sensing tip manufactured with an aperture of 30 µm (
Effect of the Aperture Diameter
To assess the effect of the aperture diameter, we measured the impedance of sensing tips for tips with different aperture sizes, ranging from 30 to 46 µm in diameter (
Overall, those results suggest that the analytical model agrees with the actual static electrical behavior of the sensing tip. Thus, such a model can be used for the design investigation as well as for the quality check of the sensing tip after its fabrication, by measuring the actual sensing tip impedance and comparing it with calculated values.
Electrode Placement for Fabrication Consideration
Next, we performed an experiment to better understand the design constraints in terms of electrode placement. In order to make the fabrication process compliant with disposable sensing tips, we plotted the sensing tip impedance magnitude against the inner electrode distance from the membrane, using both the analytical model (plain line) and the electric measurements (
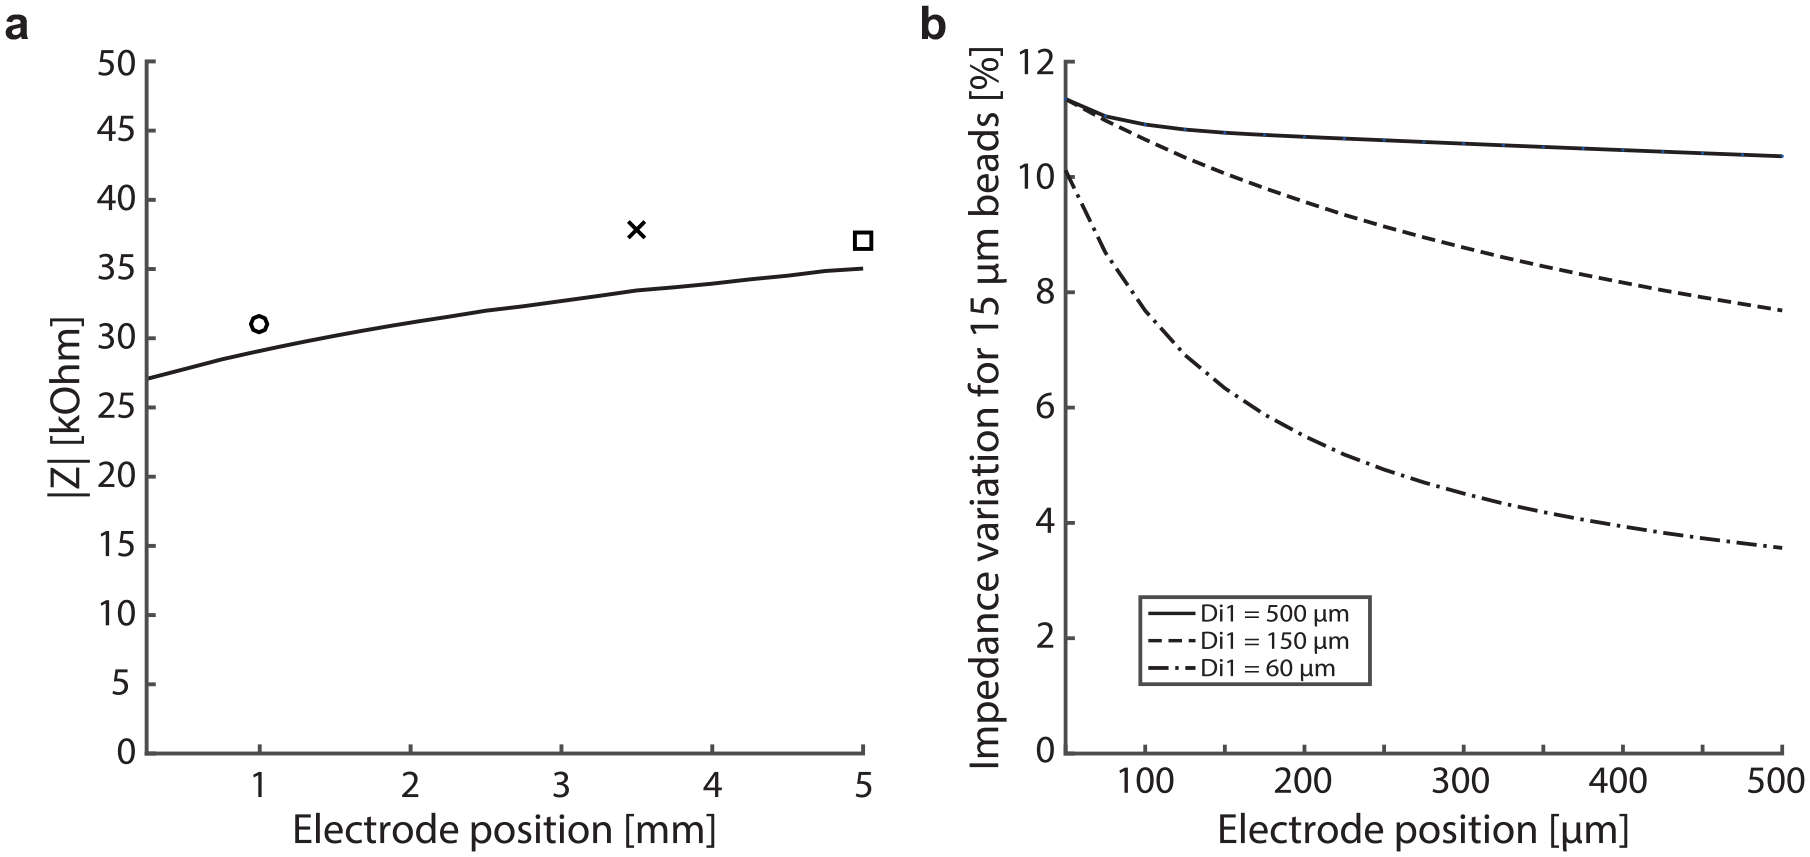
Effect of electrode position for impedance measurements with 15 µm beads. (
Additionally, Figure 4b shows the tip impedance magnitude changes for 15 µm beads passing through the aperture versus the membrane-to-electrode distance, for distal inner tip diameters of 60, 150, and 500 µm according to the analytical model. For an aperture of 30 µm and a significantly larger distal inner tip diameter of 500 µm, as chosen in this design, the impedance change due to 15 µm beads is expected to be 11% with a 100 µm membrane-to-electrode distance. When the same electrode is then retracted 500 µm away from the aperture, the impedance change is still 10% for 15 µm beads. On the other hand, for a smaller distal inner tip diameter of 60 µm, the same electrode displacement from 100 to 500 µm induces an impedance variation going from 10% to 3.5%. This again demonstrates that the large ratio between the membrane and aperture diameters chosen in this design offers great flexibility of electrode placement.
Characterization of the System Sensitivity to Particle Size
To assess the system ability to detect and size particles, and to determine the system resolution and limit of detection, we sequentially passed 6, 10, and 15 µm beads through the sensing tip ( Fig. 5 ). Then, we compared the experimental data to the analytical model.
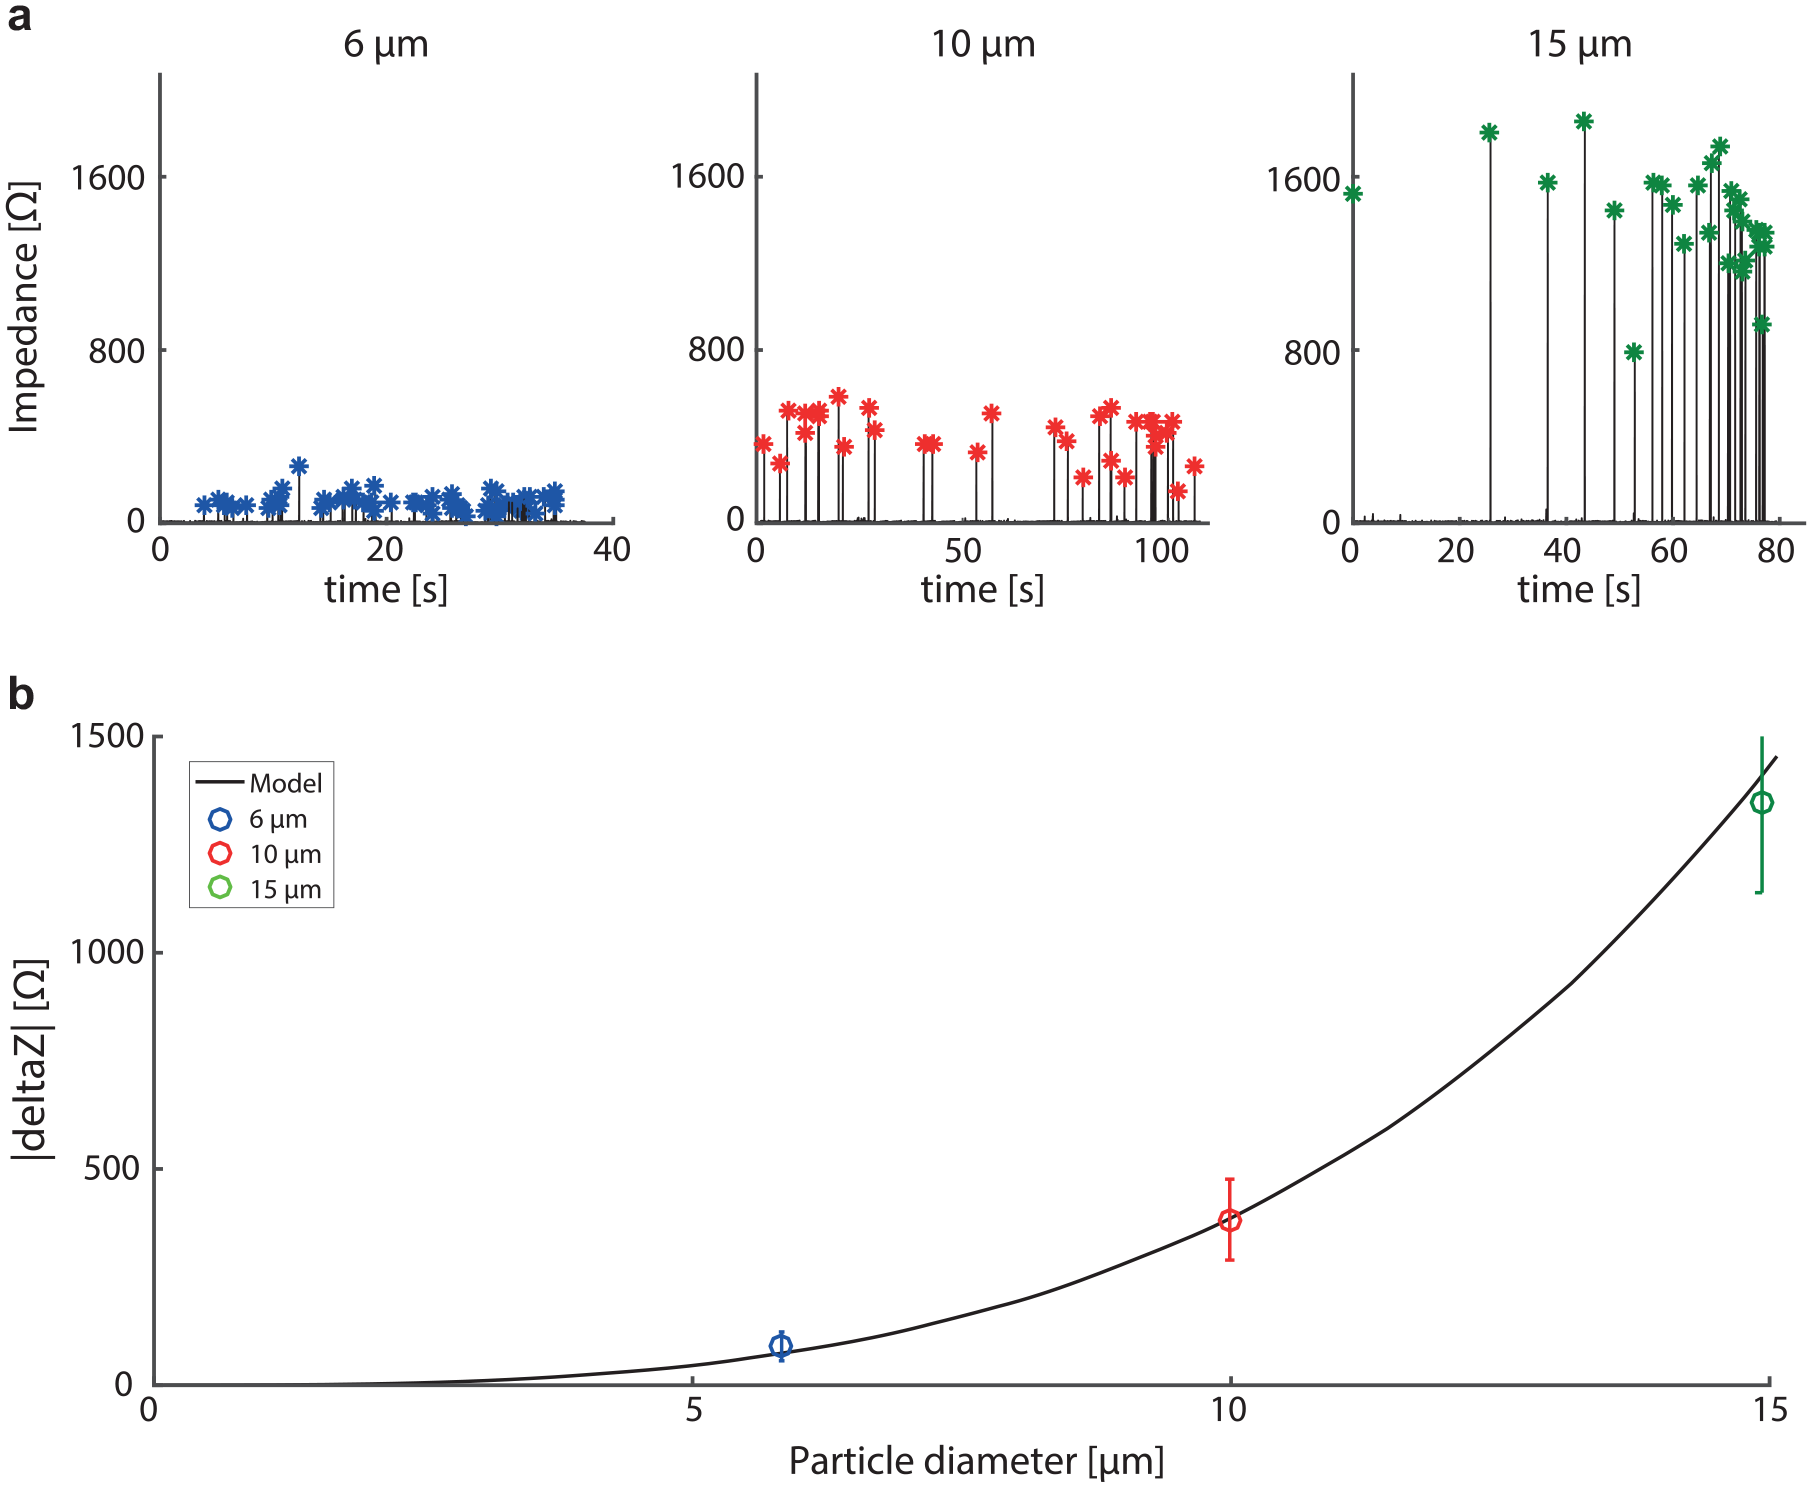
Cell sensor sensitivity to dielectric particle size as well as its resolution and limit of detection. (
Figure 5a shows the impedance magnitude obtained from the sequential passage of 6, 10, and 15 µm beads through the sensing tip. Figure 5b compares the theoretical curve for particle size sensitivity obtained with the analytical model for a 35 µm aperture with the impedance variation measured for 6, 10, and 15 µm beads. As we detected beads of a given size separately, the median value of the impedance peak prominence was used to determine the system sensitivity to a given bead size: 6, 10, and 15 µm beads had impedance peaks of 89.8, 382.9, and 1346 Ω, respectively, with standard deviations of 33, 94, and 207 Ω, in agreement with the values anticipated from the analytical model. This emphasizes that the analytical model can be used for particle size determination using their measured impedance variation. Besides, the impedance standard deviation of the signal excluding the peaks was evaluated at 3.59 Ω, which corresponds to the equivalent impedance noise of the full system. Therefore, the total noise level of the whole system is dominated by the instrumentation noise measured at 3.56 Ω using a 30 kΩ resistor plugged into the system, which is equivalent to a sensing tip with a 33 µm aperture.
Assuming the limit of detection at three times the level of noise, and using the particle size sensitivity curve, the minimal particle that can be detected with this instrumented pipet is 3.2 µm. The spreading in particle size measurement, considering the actual bead size dispersion and the instrumented pipet noise, is 1.6, 1.6, and 1.25 µm, respectively, for 6, 10, and 15 µm beads.
Effect of Membrane Thickness on Particle Size Sensitivity
We also used the analytical model to evaluate the effect of the membrane thickness on the sensor sensitivity. Figure 6a shows the ratio of the impedance variation created by the passage of a bead of given dimensions through the aperture versus the thickness of the membrane. The curves presented in this figure using the analytical model correspond to the passage of 6, 10, and 15 µm beads, respectively. The optimum membrane thickness for detecting beads of a given dimension corresponds to the point where these curves are at a maximum. This corresponds to a thickness that is slightly smaller than the actual bead size. This effect is related to the influence of the spreading resistance defining a sensitive area slightly extending from the aperture, as expected from Figure 3a .
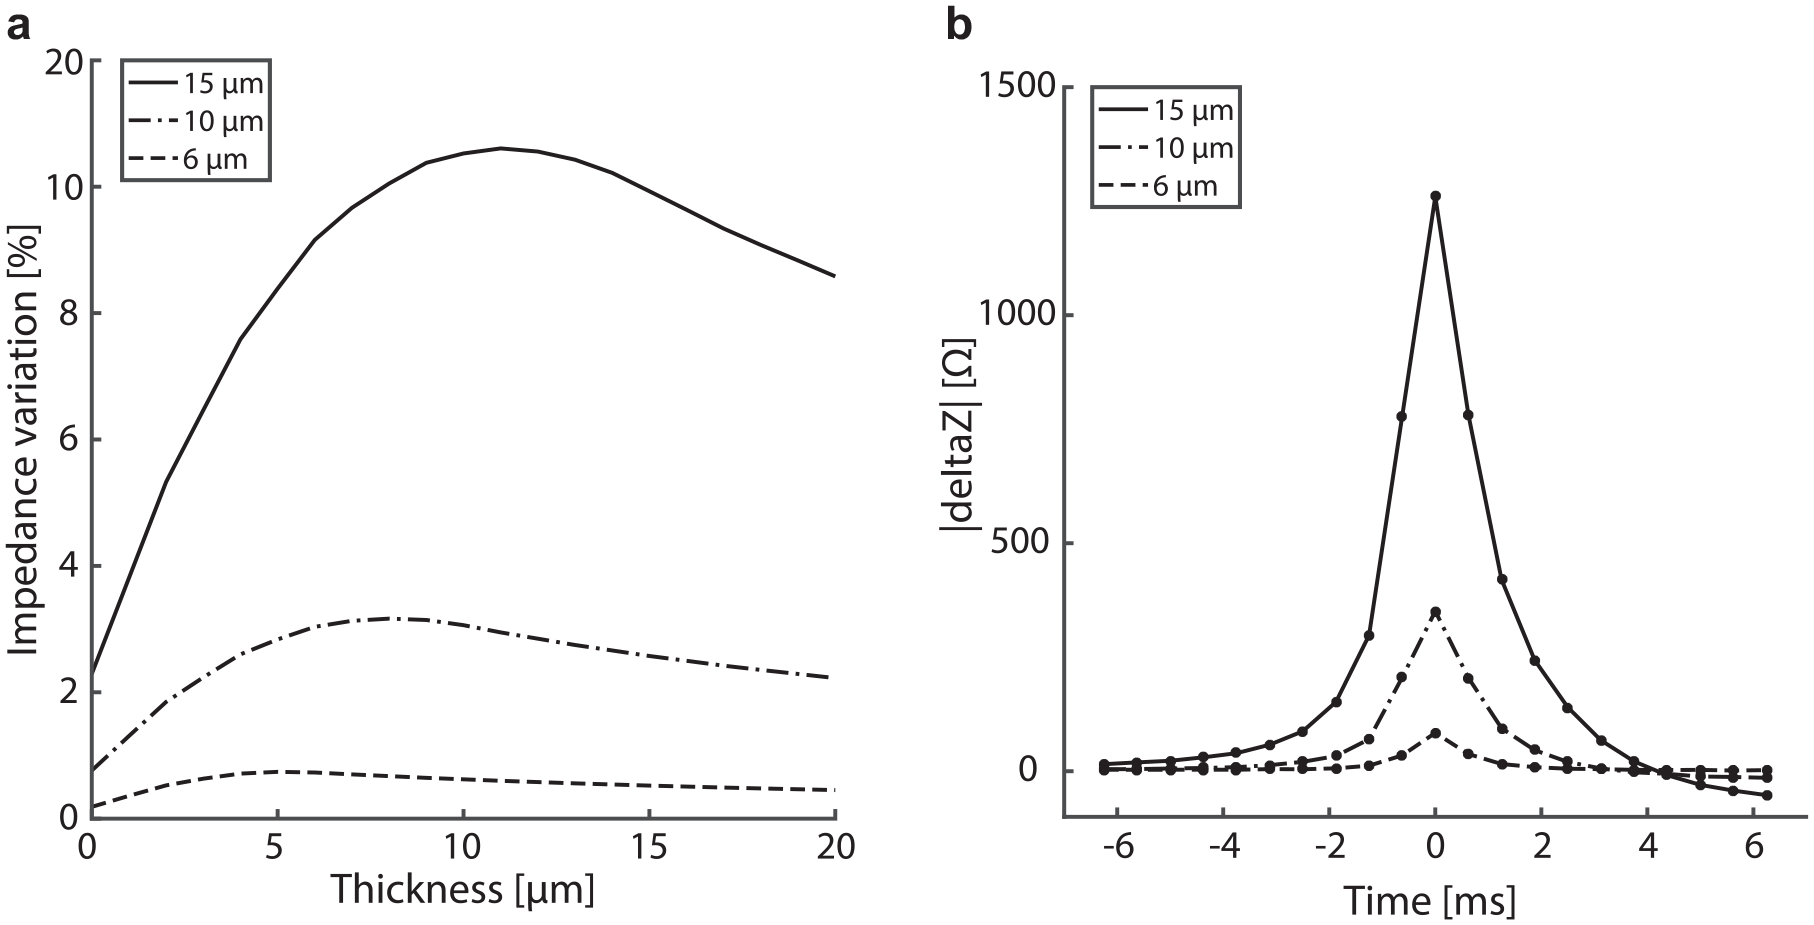
Membrane thickness and size sensitivity. (
However, the time of particle passage in the aperture also depends on the membrane thickness. As a compromise, we chose a membrane thickness of 15 µm. Such a value is not the absolute theoretical maximum according to Figure 6a but allows the particle to spend a reasonable amount of time in the sensitive zone and thus increases the number of points acquired. According to Figure 6a , this optimization on the number of points acquired on a particle passage is obtained at a minimal cost of a few percent reduction in the impedance signal variation.
Figure 6b shows the averaged impedance time trace for the same three suspensions of 6, 10 and 15 µm beads, for a dispensing pressure of 0.5 mbar and a sampling rate of 2.4 kHz. The averaged time traces have been superimposed and centered. Average impedance peaks for 15, 10, and 6 µm beads are represented by 15, 9, and 3 sampling points, respectively, above the previously chosen 20 Ω threshold. For the 6 µm bead, considering the 3 points above the threshold, their respective impedance, and standard deviation, and assuming a Gaussian distribution of the noise, the probability to miss an event is one particle every 591 dispenses. This represents the worst-case scenario for the dispensing of a population containing 6 µm beads only. The same probability drops to one event missed every 2.5 × 10⁹ dispenses for 10 µm beads. In the context of single-mammalian-cell dispensing, cells typically have a diameter between 5 and 50 µm. Thus, this demonstrates the very low probability of missing an event that could lead to the dispensing of two cells in the same well without detecting it in the impedance signal.
Validation of the Single-Particle Dispensing Capability
To validate the single-particle dispensing, we dispensed 10 µm fluorescent beads in well plates.
Figure 7b shows a typical impedance trace obtained during the dispense and displays the evidence of a single-bead deposition with only one impedance peak between the entrance and escape of the well. We performed such dispensing in 47 wells. Of these 47 wells, we rejected 24 wells because the impedance traces showed more than one peak or insufficient impedance signal quality. We selected the remaining 23 wells as the impedance traces showed one single peak. When we observed these wells under the fluorescent microscope, all of them contained only one single bead when observed under the fluorescent microscope. This corresponds to a filling rate of 49% of the wells (N = 47) but 100% correspondence between the impedance and optical detection. Each single bead leaving the sensing tip is detected and effectively transferred within the well.
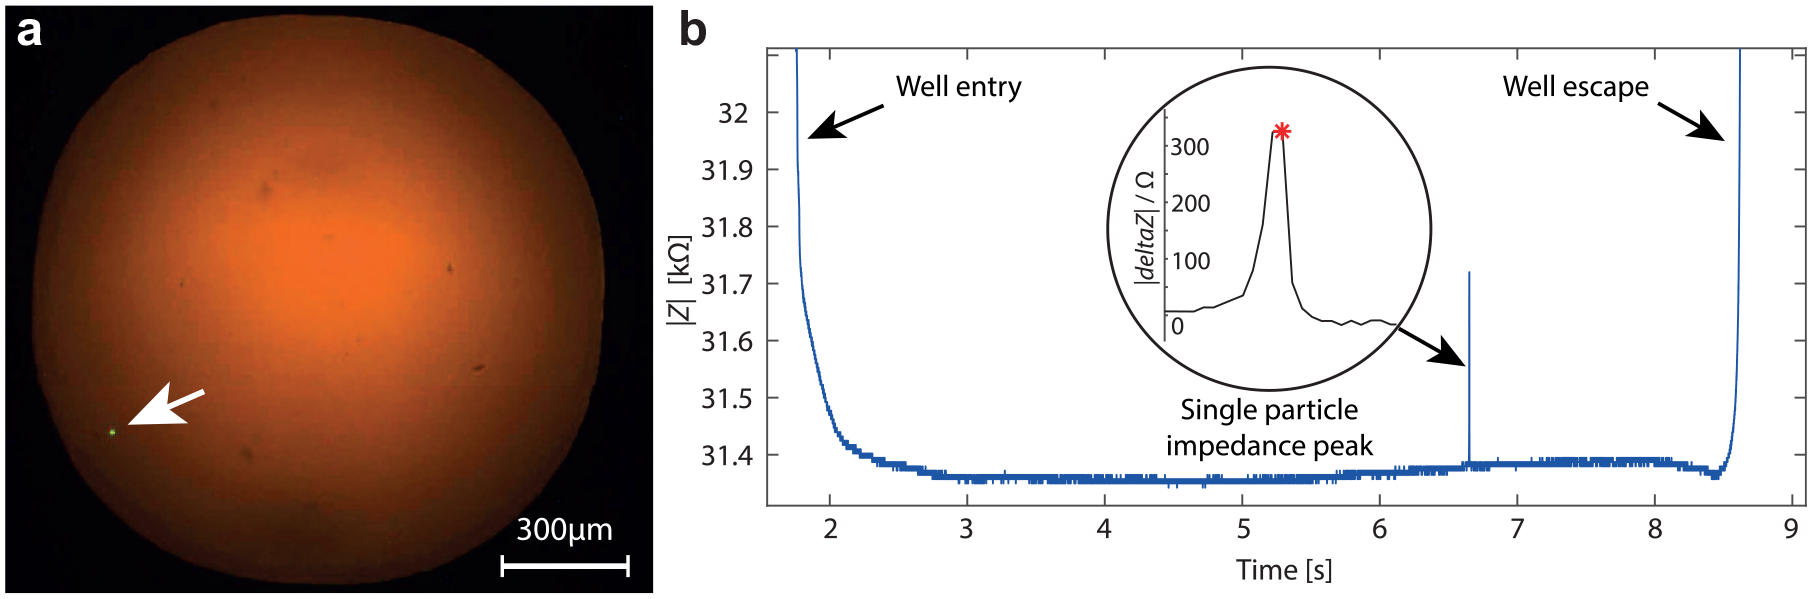
Demonstration of the system capability to dispense single particles in wells. (
To guarantee single-cell dispensing, it is better to interpret noise as a particle rather than missing a real particle. For this reason, we chose a detection threshold for the dispensing procedure of 20 Ω, which represents 6 σ of the total system noise. Assuming a Gaussian distribution, the system noise is on average interpreted as a particle in 1 in 7.2 × 10⁷ samples. For a system sampling rate of 2.4 kHz, this represents one false particle detection every 8 h of system usage.
Assessment of Cell Viability
When the cells cross the aperture of the sensing tip, they are exposed to electric fields. To make sure that the electric field does not disrupt the cells, we performed a cell viability assay on 3T3-J2 fibroblasts (
Discussion
A sensing tip for single-particle detection and a corresponding instrumented pipet for single-cell dispensing were presented here. We developed an analytical model and validated it with experiments. We then used this model for successive investigations of the system, in terms of membrane thickness or aperture size. The final tool we proposed and designed in this study is effectively capable of detecting, sizing, and dispensing particles down to the single-particle resolution.
To increase user acceptance, we embodied the tool in a pipet form, as commonly used by biologists and as already suggested by Zhang et al. 33 The choice of the Coulter counter topology fabricated at the extremity of a standard pipet tip was determinant for the following reasons.
First, the dispensing of single particles was possible as the cell sensor is effectively formed by the membrane and thus leaves minimal dead volume between the detection and dispensing areas.
Second, the Coulter counter topology is not sensitive to electrode placement, unlike most of microfabricated channel-based flow cytometry chips. 34 Consequently, cost-effective methods can be used for inner electrode placement and outer electrode deposition. In particular, photolithography can be avoided, which would be cumbersome and expensive for microfabrication on a three-dimensional object such as the disposable tip. For this study, we produced the tip in an academic research cleanroom. The production capacity was about 1000 pieces per day, mainly limited by the lack of automation of the laser and the capacity of the gold evaporator capacity. We are now working on further developing the fabrication process to increase the volume and quality of the manufacturing, while also assessing further the fabrication process variability.
Third, the possibility to fabricate the cell sensor on a commercially available pipet tip ensures a design and materials compatible with cell handling. Similarly, designing such a tool as a traditional pipet prevents significantly disrupting biologist habits and should widely speed its acceptance.
We validated the performance of the system and its dispensing capability using fluorescent beads and showed its high reliability. At this stage, the filling rate of the well plate with single beads is not perfect (49%, N = 47) as the fluidic control still has to be perfected and more parameters need to be assessed in order to dispense single beads at a higher yield. But the important feature is the ability to define and qualify wells containing a single bead with high confidence based on the impedance time trace (100%, N = 23). This capability is made possible because there is minimal dead volume between the particle sensing area and the receiving container. Consequently, each single particle leaving the sensing tip is detected and is necessarily in the well. As a comparison, the filling rate is about 1.5 times lower than what is typically reached using FACS but 1.3 times higher than by limiting dilution (at one particle per well), showing the effect of the system. However, the analysis of the impedance traces postprocessing enables the immediate and easy identification of the wells containing a single particle. This is a quality control that is not possible using FACS or limiting dilution. The dispensing time directly depends on the input cell concentration and the flow rate of the pipetting system. According to the parameters selected in this present study, the average dispensing time per well is around 10 s, which can be complemented with the time spent by the operator to move from one well to the other. This is to be compared with the 2–3 s per well that is typically reached using FACS. The speed could be greatly improved by increasing the cell concentration or by developing a multichannel pipet, but this was not the purpose of this initial feasibility study.
The instrumented pipet combined with the sensing tip presented in this paper has a limit of detection in terms of a particle size of 3.2 µm for an aperture of 30 µm. According to the experiments above, 6 µm particles can be successfully detected while 15 µm particles can still flow through the system without clogging the tip. Given this range, this should allow highly reliable single-cell dispensing with most mammalian cells. We characterized this assumption elsewhere using a wide range of cell types. 35
Finally, a cell viability assay using fibroblast cells indicated that the instrumented pipet has no detrimental effect on cells when compared with standard pipetting. As described by Zimmermann et al.
36
in an electric-based cell detection system, the electric field applied to cells can change cell viability by breaking down the lipid membrane. Considering Zimmermann’s work, the membrane dielectric breakdown would happen around a potential of 0.9 V on the cell membrane. Initial effects would include a reversible opening of the cell membrane allowing current or molecules to pass through the cell as defined by electroporation. Higher electric fields would induce a permanent destruction of the cell membrane leading to cell death.35,36 Both effects need to be avoided in the instrumented pipet. First, even though the reversible opening should not lead to cell apoptosis,
36
a bias would be induced in the effective impedance change measurement because current would flow through the cell
35
and thus induce an error on the cell size interpretation. Second, this effect could also lead to the uptake of external molecules by the cell as it occurs during electroporation,
36
which is to be avoided here. This uptake could be detrimental to the cell. In these experiments, the passage of a 10 µm bead induced a variation of 640 Ω for a total tip impedance of 33 kΩ (
Supplemental Material
Supp_Material_for_Impedance_Based_Single_Cell_Pipetting_by_Bonzon_et_al – Supplemental material for Impedance-Based Single-Cell Pipetting
Supplemental material, Supp_Material_for_Impedance_Based_Single_Cell_Pipetting_by_Bonzon_et_al for Impedance-Based Single-Cell Pipetting by David Bonzon, Georges Muller, Jean-Baptiste Bureau, Nicolas Uffer, Nicolas Beuchat, Yann Barrandon and Philippe Renaud in SLAS Technology
Footnotes
Acknowledgements
The authors acknowledge Marc Lany and Sensima Inspection for providing the SI-QSD lock-in and much advice to enable its integration and the EPFL CMI for their guidance all along the fabrication process of the sensing tip. The authors are grateful to both the LMIS4 and LDCS teams for their help and supportive discussions during this work. In particular, we thank Arnaud Bertsch and David Forchelet for their advice on the project and help with manuscript preparation. We are grateful to André Catana and Alberto Di Consiglio of the EPFL Technology Transfer Office for their continuous support.
Supplemental material is available online with this article.
Declaration of Conflicting Interests
The authors declared the following potential conflicts of interest with respect to the research, authorship, and/or publication of this article: D.B., G.M., N.U., Y.B., and P.R. have financial interests in SEED Biosciences SA, a company that commercializes the technology and intellectual property described herein.
Funding
The authors disclosed receipt of the following financial support for the research, authorship, and/or publication of this article: The Swiss National Science Foundation NanoTera program supported this work (20NA21-143082, Envirobot).
References
Supplementary Material
Please find the following supplemental material available below.
For Open Access articles published under a Creative Commons License, all supplemental material carries the same license as the article it is associated with.
For non-Open Access articles published, all supplemental material carries a non-exclusive license, and permission requests for re-use of supplemental material or any part of supplemental material shall be sent directly to the copyright owner as specified in the copyright notice associated with the article.