
Abstract
A large body of evidence points to the importance of cell adhesion molecules in cancer metastasis. Alterations in adhesion and attachment properties of neoplastic cells are important biomarkers of the metastatic potential of cancer. Loss of intracellular adhesion is correlated with more invasive phenotype by increasing the chances of malignant cells escaping from their site of origin, promoting metastasis. Therefore, there is great demand for rapid and accurate measurements of individual cell adhesion and attachment. Current technologies that measure adhesion properties in either suspension or bulk (microfluidics) remain very complex (e.g., atomic force microscopy [AFM], optical tweezers). Moreover, existing tools cannot provide measurements for fully attached individual adherent cells as they operate outside of such a force range. Even more importantly, none of the existing approaches permit concurrent and automated single-cell adhesion measurement and collection, which prohibits direct correlation between single-cell adhesion properties and molecular profile. Here, we report a fully automated and versatile platform, A-picK, that offers single-cell adhesion assay and isolation in parallel. We demonstrate the use of this approach for a time course analysis of human lung carcinoma A549 cells and substrate-specific adhesion potential using seven different substrates, including fibronectin, laminin, poly-
Keywords
Introduction
Cellular proliferation, migration, and differentiation are tightly regulated by cell adhesion molecules receiving signals from the surrounding environment, including neighboring cells and extracellular matrix (ECM).1,2 This interaction triggers multiple signaling pathways involved in the regulation of essential cellular processes, such as cell migration, survival, proliferation, differentiation, and apoptosis.1,2 Mutations in genes encoding cell adhesion molecules or associated components cause a range of diseases, with most effect on the progression and metastasis of cancer.1–4 Better understanding of this role can pave the way for more effective cancer therapies that can help reduce cancer metastasis by altering cancer cell adhesion.5,6 Moreover, because adhesion properties of the cells indicate their response to various external factors and physiological states, changes in such properties may be used as a marker in translational research or diagnostics of cancer (e.g., circulating tumor cells). In addition, knowledge of specific cell adhesion properties can improve the design and biocompatibility of biomaterial used in bioengineered devices such as transplants. Therefore, the investigation of cell adhesion properties becomes one of the key targets for anticancer drug development and other biomedical applications.
Current techniques for measuring cell adhesion include flow chambers, 7 laser traps, 8 optical tweezers (OTs), 9 biomembrane force probe (BFP),10–12 atomic force microscopy (AFM),13,14 and micropipette-based aspiration.15–21 Originally, cell adhesion was estimated using simple washing assays. 22 Later, assays with regulated flow were introduced, including spinning-disk 23 and flow-chamber 7 assays. Unfortunately, most of these bulk assays provide only estimation of cell detachment force for multiple cells and are not compatible with single-cell adhesion measurements.
Several single-cell assays have been developed to measure adhesion strength to various substrates. Laser traps use capillaries and functionalized beads to determine an adhesion strength from 0.01 to 200 pN. 8 OTs involve trapping and manipulating cells with laser beams. 9 While OTs can measure very precise forces, the method is limited to measuring forces up to 100 pN, which is inadequate for more adhesive cells and surfaces or cell detachment assays. Also, laser beams can harm cells through heating and photodamage. 24
The BFP is an ultrasensitive force spectroscope that involves a specially treated red blood cell acting as a nanospring. Such a nanospring allows precise measurements of very weak forces, as well as real-time observations of detachment events. However, like the OT method, the BFP is restricted to very weak detachment forces, measuring interactions between 0.01 and 100 pN, and analyzing the gathered data often requires additional measures involving simulations and imaging.10–12
AFM can measure cells with stronger adhesion, making it more suitable for adherent cells. It uses a cantilever with a cell attached to estimate the interaction of a cell with a specific surface, tissue, or another cell. 25 It can measure forces from 10 pN to 10 nN with contact time of up to 20 min. 25 Generally, this is a time-consuming process that requires 5–20 min for each cell, making measurements of multiple cells hardly feasible.26,27
A combination of force spectroscopy with optical sensors was recently used to demonstrate measurements of early adhesion events for multiple cells. 28 This approach offers the ability to monitor multiple single cells during initial attachment events. Its combination with force spectroscopy permits cell measurement and collection that has been demonstrated on 30 individual cells. 28 Similar to AFM, which is not capable of measuring the adhesion strength of fully attached cells, optical sensors demonstrate a low threshold, already showing signal saturation after 90 min of initial cell attachment. 28 Other challenges include low sensor resolution and its requirement of transparent functionalized surfaces to measure changes in the density of adhesion proteins. The latter renders this method impractical when feeder cells are used—a commonly employed technique in various culture systems, including stem cell propagation and differentiation.29–32
Capillary-based (micropipette) aspiration is a widely used technique for measuring the mechanical properties of single cells. It offers a compelling alternative for single-cell adhesion measurements compatible with a high-throughput format. For single-cell adhesion measurement, this technique detaches an immobilized cell by applying suction force under direct observation.15–21 It may use forces from 10 pN to 10 µN, 16 which until recently was unsurpassed by other techniques.
The strength of adhesion increases with the time a cell adheres to a surface due to increased numbers of adhesive interactions.33–35 The largest adhesion force that is recorded, termed detachment force, represents the maximum strength of cell–substrate binding and may reach up to 3.8 mN for some cells. 36 This is well outside of the range for most adhesion-measuring methods.37,38 Other challenges characteristic for current single-cell adhesion measurements approaches are the time-consuming experimental procedure37,38 and the high cost of instrumentation.
Previously, we developed a versatile capillary-based vacuum pulse-assisted instrument for microdissection of complex tissues and isolation of individual cells.39,40 The general working principle of the reported cell and tissue acquisition system (CTAS) was to collect cells and tissue regions under direct microscopic visualization by applying precise vacuum pulses into a specifically designed disposable capillary unit (DCU). 39 Our CTAS can apply up to 550 µN of force in a single pulse that allows the measurement of detachment force for even tightly attached cells with multiple pulses. 39 Here, we report a fully automated CTAS for an adherent single-cell detachment/adhesion assay, collection, and deposition: A-picK. The applicability of the instrument for single-cell studies is demonstrated using one of the standard cell lines, human carcinoma A549 cells, grown for different periods of time on seven different substrates with various adhesiveness.
Materials and Methods
Instrument
The instrument (A-picK) was either directly integrated with the Olympus IX73 microscope (Olympus Americas, PA) ( Fig. 1 ) or installed with a universal straddle 41 over other inverted microscopes. It consists of the following major components: sample collection assembly, control box harboring vacuum modules and stage controls, motorized stage (Märzhäuser Wetzlar GmbH & Co. KG, Germany), digital camera (BoliOptics, CA), PC with monitor, and joystick ( Fig. 1 ). As in the original version of CTAS, 39 a linear actuator is used for the vertical movement of the DCU with a 1.5 µm step, providing precise vertical positioning during calibration, and acquisition ( Fig. 1 ). DCU is connected to the vacuum line through the disposable filter unit (Millipore) ( Fig. 1 ). Circular LED lights are integrated with the collection assembly and used to illuminate the slide or a culture dish ( Fig. 1 ). The control box incorporates vacuum modules with electronic controls and vacuum pumps (KNF Neuberger) with pneumatic tubing ( Fig. 1 ). A range of adjustable parameters for vacuum strength, duration, valve controls, light intensities, x-y stage control, and DCU movement are electronically controlled. The enclosure for the control box and the linear actuator housing is machined from aluminum 5052-H32 sheets and 6061-T6. The inverted microscope is equipped with a port for mounting a camera (BoliOptics, CA) with an appropriate adapter (Olympus Americas) for process visualization, control, and documentation via a computer monitor and PC.
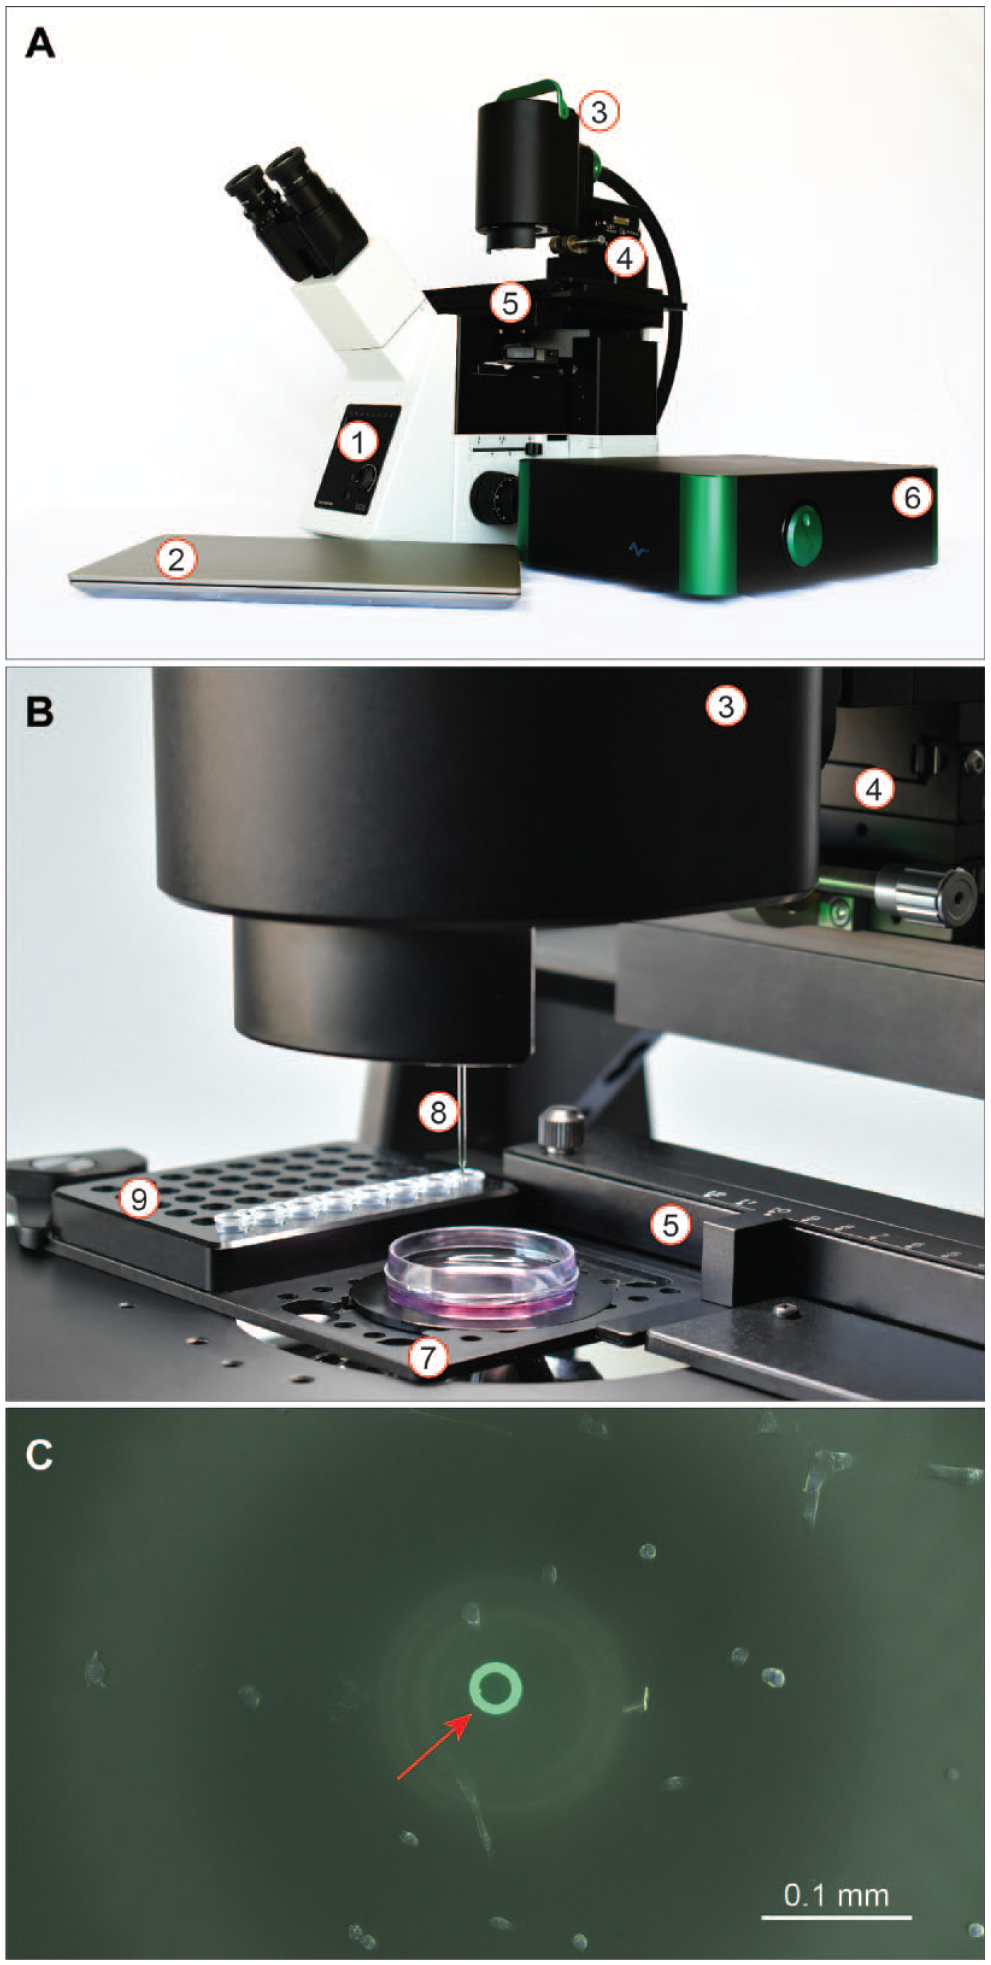
A representative image of the developed automated system and the setup for collection and analysis of adherent cells. (
Universal Sample Holder
A universal sample holder (NeuroInDx, CA) was used to accommodate different slide and plate formats for collection and deposition ( Fig. 1B ). The holder allows for collection from standard 25 × 75 mm microscope slides (Fisher Scientific) and 35 × 10 mm and 60 × 15 mm cell culture petri dishes (USA Scientific; Falcon) with all types of coating. Collected samples (cells) can be deposited to individual 200 µL PCR tubes (USA Scientific), 8-tube strips for PCR (USA Scientific), or a 48-well PCR plate (USA Scientific) compatible with ANSI/SLAS 96-well standards.
Software
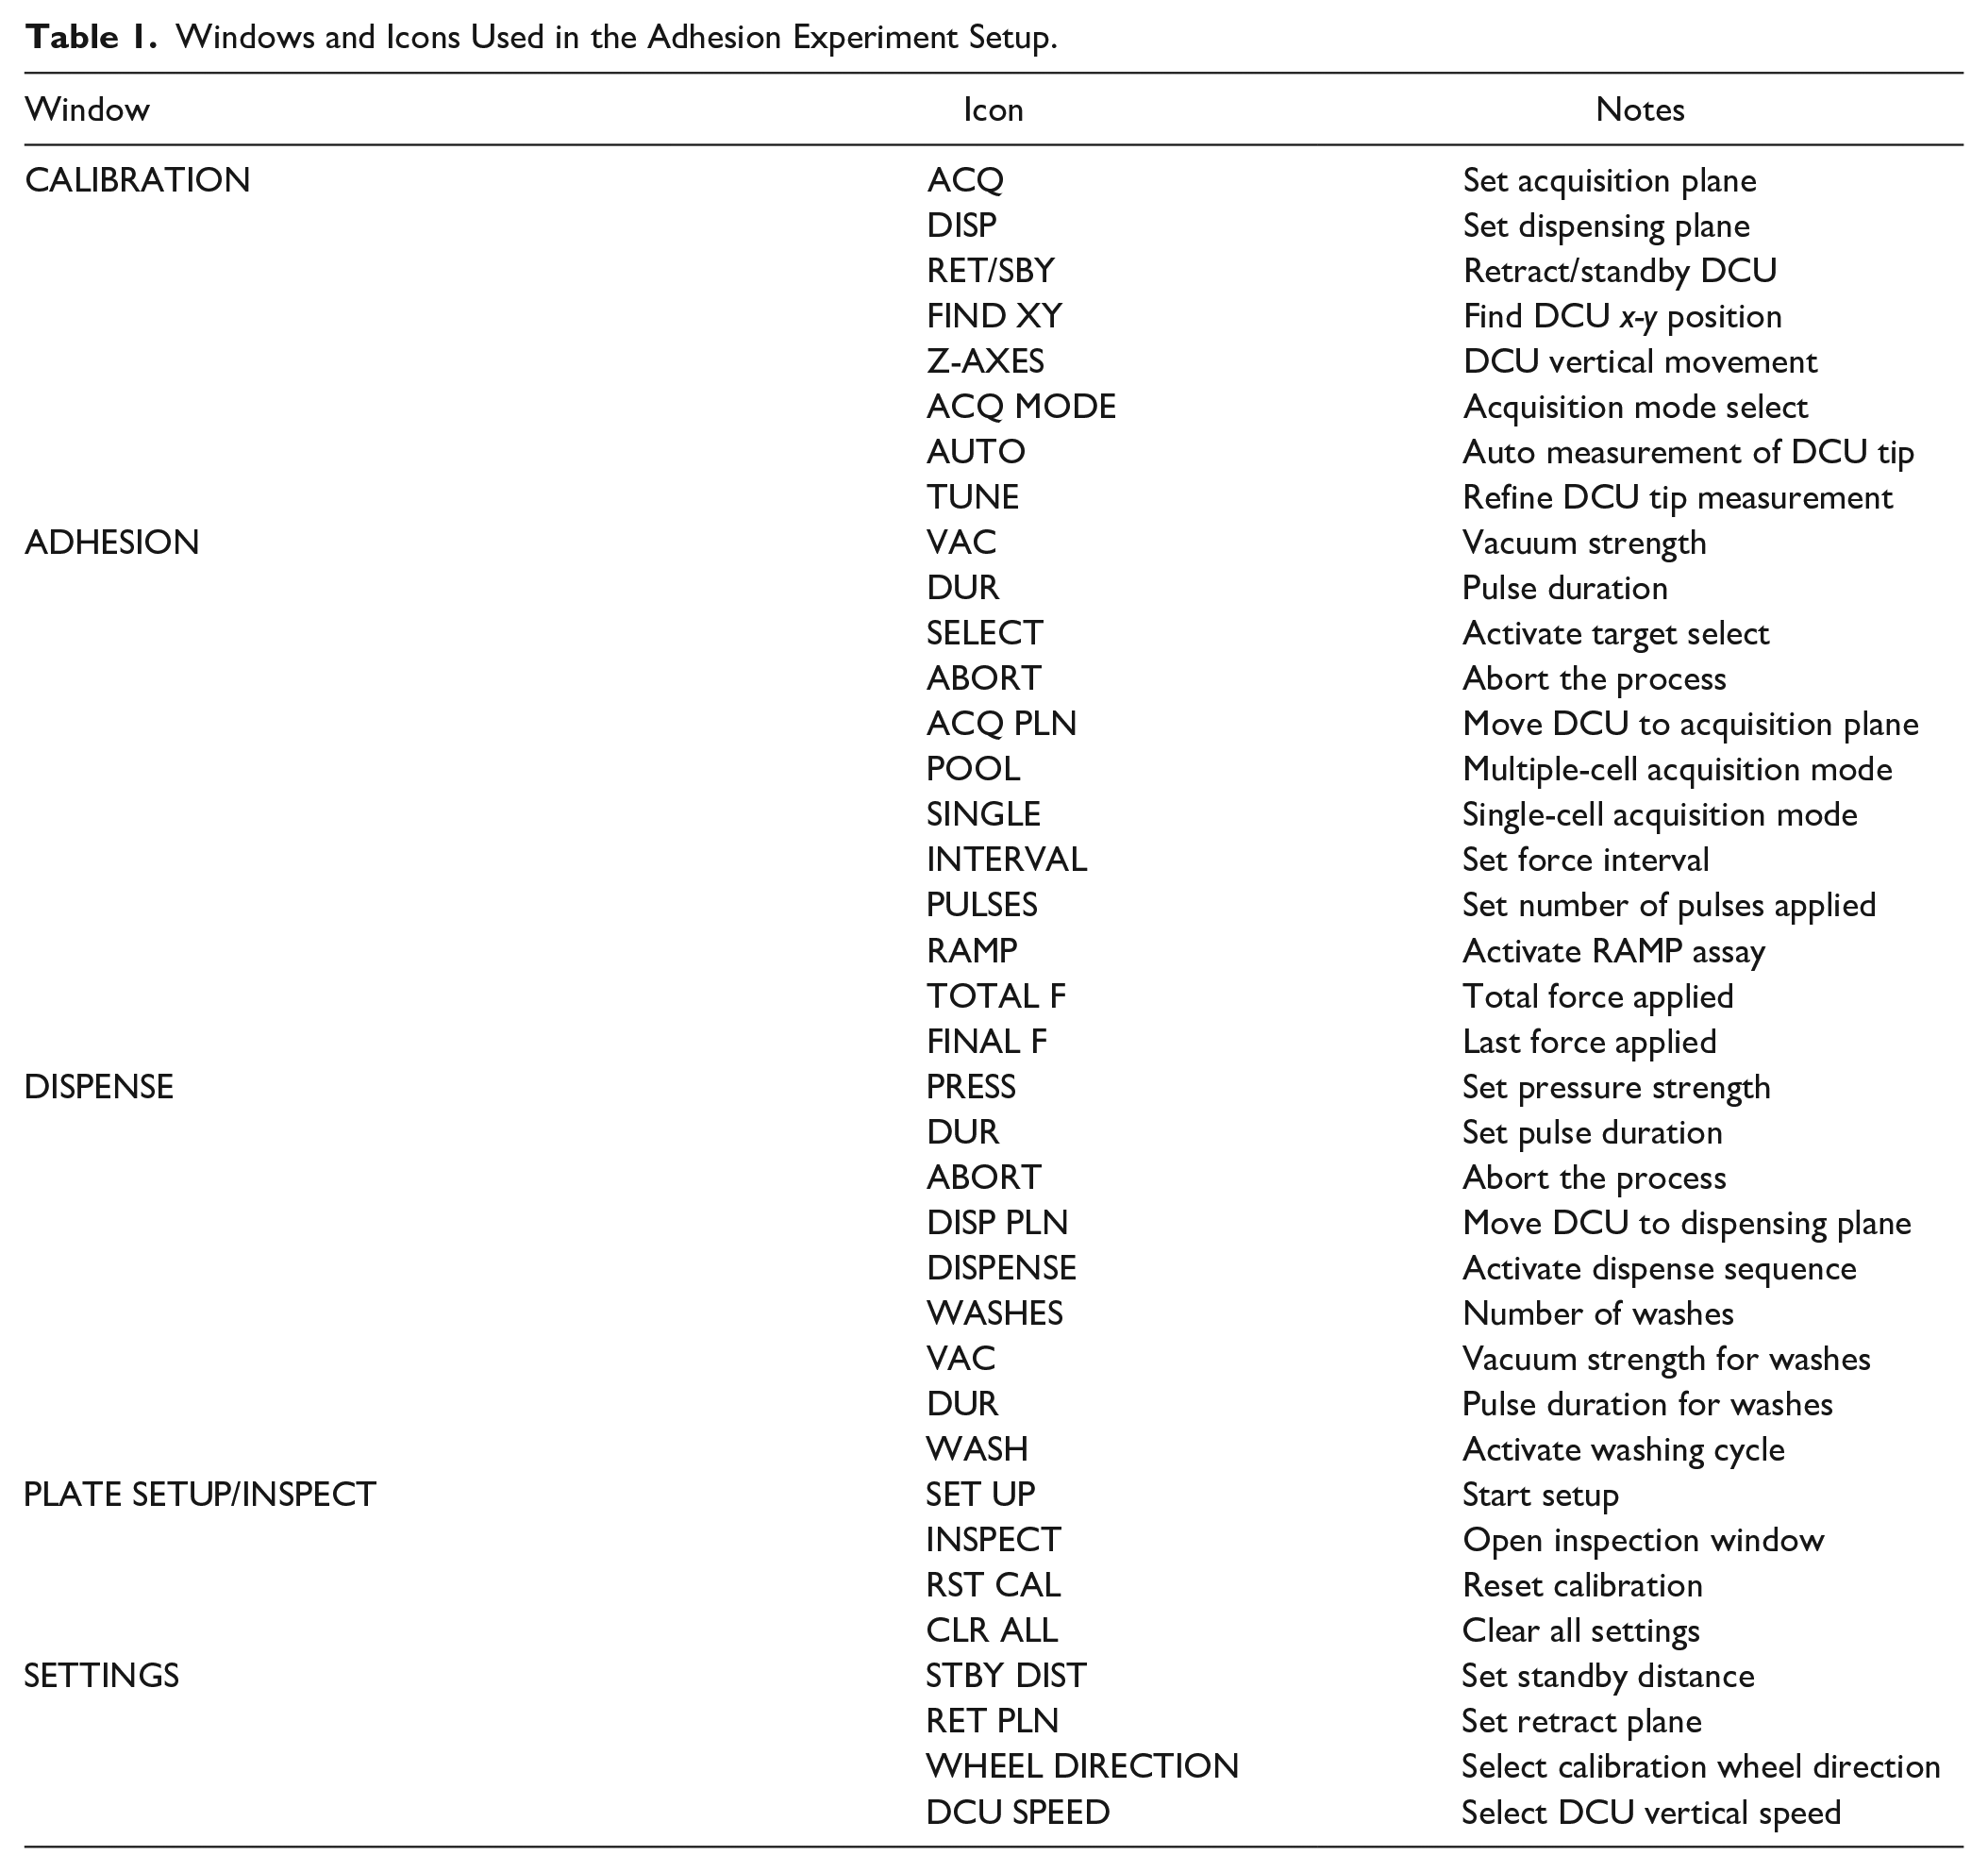
PIKCELLS software was developed to set an automatic processes for cell acquisition, dispensing, and adhesion/detachment measurements. It also allows for A-picK system calibration and camera controls ( Fig. 2 ). Main menu icons on the left, including CALIBRATION, ACQUISITION, DISPENSING, ADHESION, PLATE SETUP/INSPECTION, and SETTINGS, open corresponding windows with detailed process controls ( Table 1 ). The CALIBRATION window options provide DCU movement controls to allow setting of acquisition (ACQ) and dispensing (DISP) planes and quick DCU retract (RET/SBY), four common acquisition modes with preset dispensing planes for collections from petri dishes and slides into standard PCR tubes with 20 or 50 µL total sample volume. It also offers auto DCU tip diameter measurement and its relative positioning to the x-y stage. The ADHESION window allows one to set the initial vacuum and pulse duration, number of pulses applied, and time interval used. Adhesion measurements are performed manually via the RAMP (Ramp-Assisted Measurement Protocol) function, where multiple cells may be selected, measured, and deposited as pooled or a single cell at a time. The process may be stopped at any time (ABORT) and the acquisition plane (ACQ PLN) can be fine-tuned by bringing the DCU to an acquisition plane for minor z-axis adjustment. The RAMP function allows for the comparative estimation of the force required for a single-cell detachment. Two output measurements are provided—TOTAL F and FINAL F. TOTAL F is defined as the sum of all forces corresponding to the total number of executed pulses. FINAL F represents the force value used for the last and the highest vacuum pulse in the RAMP process. The DISPENSE window menu consists of settings for pressure, time duration, and process ABORT and settings for capillary washes (WASH) permitting multiple rounds of collection/dispensing to ensure complete dispensing of the sample. The dispensing plane may be adjusted, if necessary, by bringing the DCU down (DISP PLN) and fine-tuning it with vertical DCU controls found in the CALIBRATION window or with the encoder wheel on the right side of the control box ( Fig. 1 ). PLATE SETUP is used to preset well positions prior to auto collection and dispensing and is performed via aligning the center of the left upper corner well with the tip of a DCU. The same window harbors controls for process inspection (INSPECT) and data collection, permitting review of collected samples via saved screenshots and recorded force measurements. Plate calibration may be reset (RST CAL), and previous information may be cleared (CLR ALL). Finally, the main SETTINGS window allows for controlling the system’s main illumination, calibration light, standby distance (STBY DST), retract plane (RET PLN), direction of the encoder wheel to vertically move the DCU, and DCU vertical travel speed. It also indicates a folder where all data are stored and an exit icon.
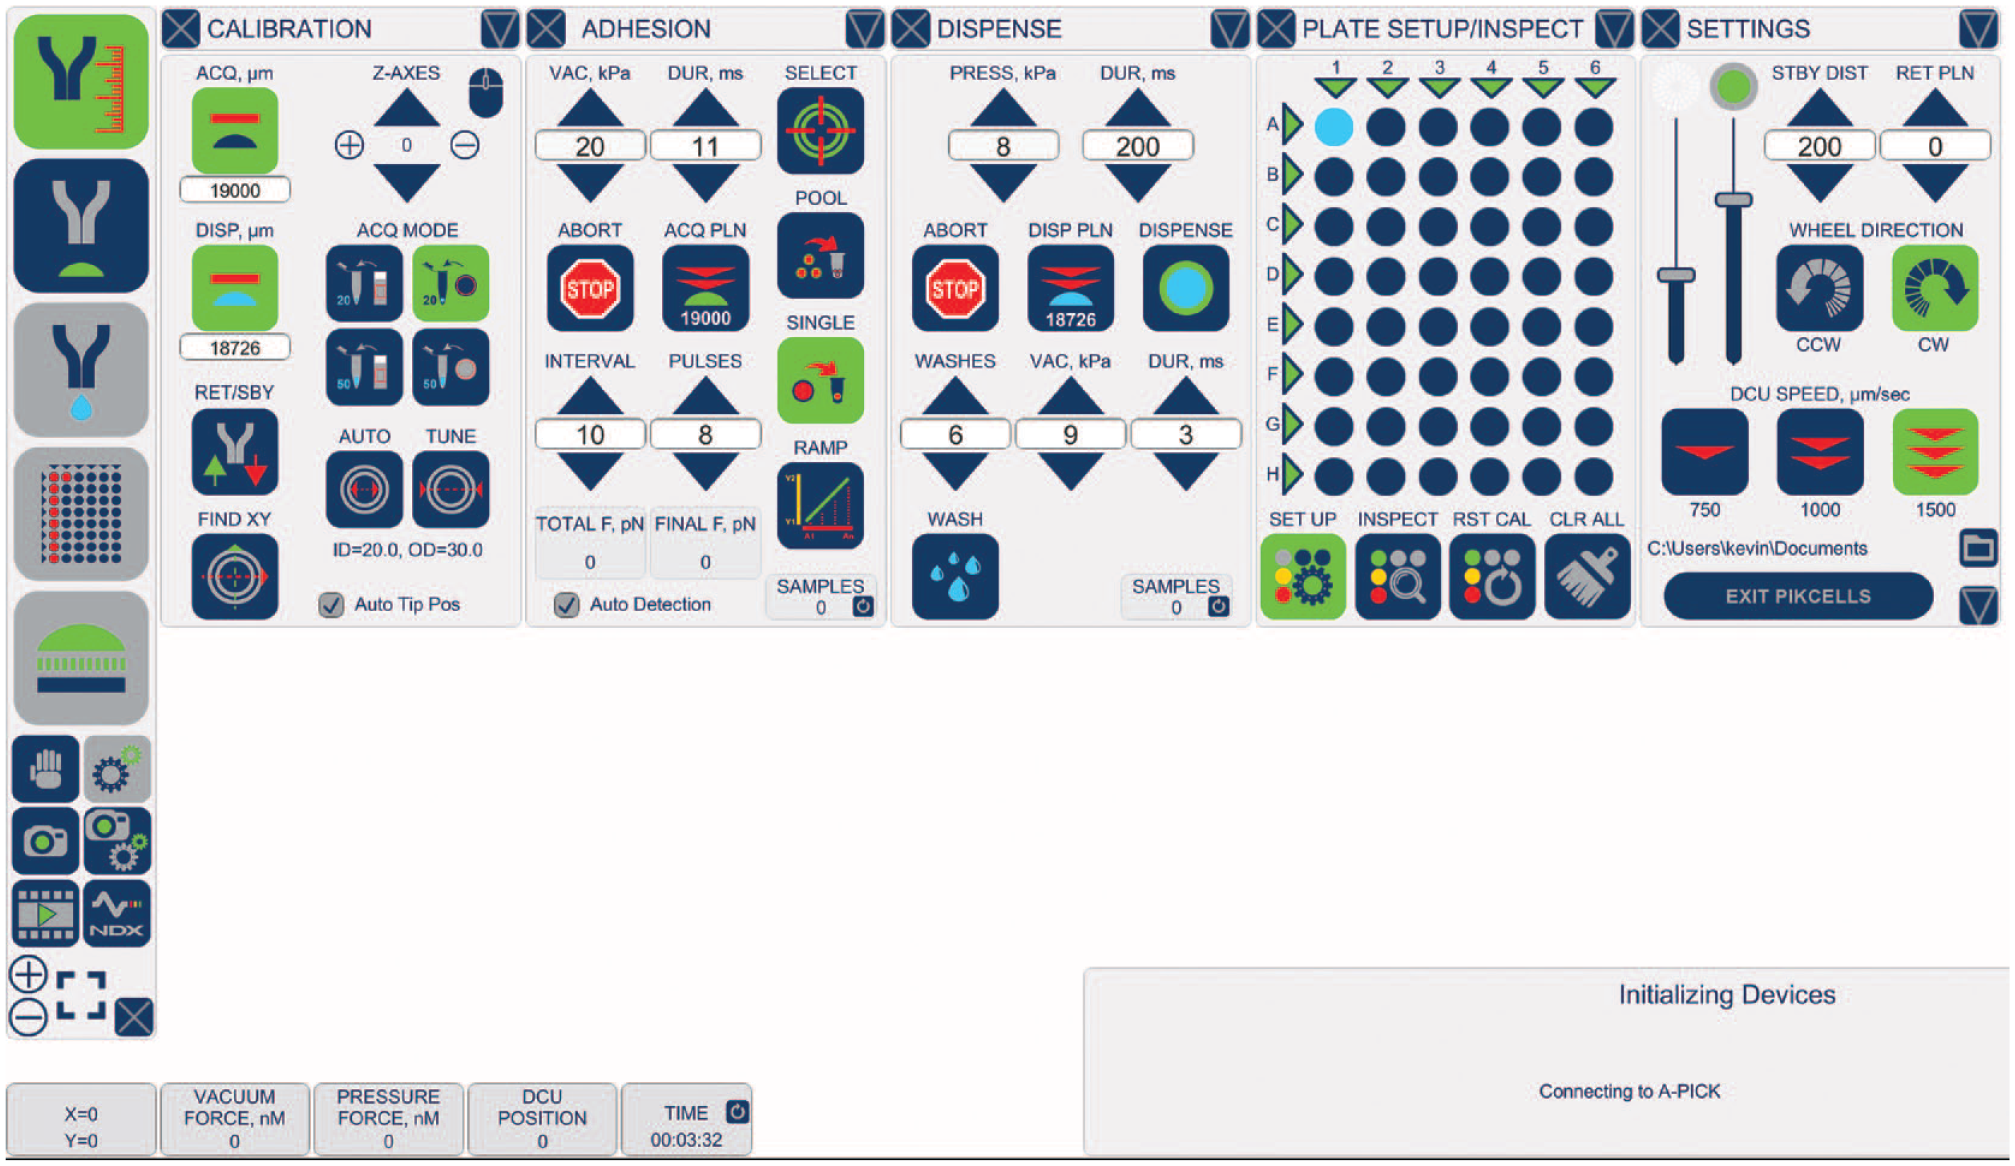
Screenshot of PIKCELLS user interface with all main menu windows open, including CALIBRATION, ADHESION, DISPENSE, PLATE SETUP/INSPECT, and SETTINGS. Camera controls, image, and video capture are available below the main control icons on the left. See Materials and Methods for details on the menu icons. Five numeric displays on the bottom of the screen provide real-time information on the x-y stage position, current vacuum and pressure force used, vertical DCU position, and total time of an individual experiment.
Windows and Icons Used in the Adhesion Experiment Setup.
DCU Construction
DCUs were constructed with noncoated borosilicate capillaries (outer diameter 1.5 mm, inner diameter 1.17 mm; Sutter, CA) which were pulled with a P-1000 micropipette puller as described earlier (Sutter, CA). 34 The tips were then broken off to form a micropipette with a level and circular opening of 20 µm. Micropipettes with a diameter of 20 µm with a variance of no more than 10% were attached to a female Luer lock needle hub (Qosina, NY) to form a DCU used to collect cells. A representative tip of a 20 µm DCU calibrated for the collection of A549 cells is shown in Figure 1C .
Cell Cultures and Substrates
Human carcinoma A549 cells (ATCC CCL-185) were routinely cultured in Dulbecco’s Modified Eagle Medium–Nutrient Mixture F-12 (DMEM/F-12) (Life Technologies, NY) supplemented with 10% (v/v) heat-inactivated fetal calf serum containing 2 mM glutamine (Life Technologies) and 1% antibiotics (penicillin–streptomycin) (Life Technologies). Cells were maintained at 37 °C in a humidified 5% CO2 atmosphere. The following substrates were used for cell culturing: fibronectin (Corning BioCoat, Corning, NY), laminin (Corning BioCoat), poly-
Single-Cell Detachment Measurements and Acquisition
Detachment force measurement for single adherent cells is performed using DCU with internal diameters (IDs) of 20 µm. Calculations of force required for the detachment of a single cell using a capillary (micropipette) were successfully performed earlier.15–21 Adhesion strength is defined as the minimum force needed to detach a single cell from its substrate via a simple formula, where the force F on a static cell in a capillary is simply the suction pressure P, which is detected by the incorporated valve pressure sensor, times the cross-sectional area of the capillary tip opening (2πr2) identified by PIKCELLS software (NeuroInDx). Therefore, the force (F, µN) required for cell detachment is calculated based on the known vacuum pressure (P, kPa) and DCU ID (µm). Once removed from the incubator, a culture dish is placed on the motorized stage of an inverted IX73 microscope (Olympus Americas, PA). To avoid bias in the assay due to cell-to-cell contact, adhesion measurements are performed in the cultures with less than 60%–70% confluency, targeting cells with no apparent contact with neighboring cells. The entire procedure is viewed via a digital camera (Boli Optics, CA) attached to the microscope. Prior to every experiment, a calibration procedure was performed as described previously. 39 Unlike the previously reported prototype, 39 our automated system controls all calibration steps via PIKCELLS software’s CALIBRATION menu window. The DCU ID and its relative position to the x-y stage are automatically determined by PIKCELLS. The cells for analysis are chosen on a computer screen with a mouse. Then, the DISPENSING mode is selected between collection and deposition of one cell at a time or pooling multiple cells into the same well ( Fig. 2 ). Locations of wells where collected cells would be deposited are selected from the Plate setup window that permits the selection of individual or multiple wells in a 48-well plate format ( Fig. 2 ). A 48-well plate represents exactly half of a standard 96-well plate and is compatible with all 96-well plate workflows. Repeated washes are selected in the Dispensing menu window to ensure that the collected material is completely removed from the DCU. After cells and parameters are selected, the run is initiated, measuring each selected cell, collecting, lifting DCU to a standby position, and depositing it into a designated well. Only morphologically similar cells with similar sizes were selected for all assays.
Statistical Analysis
At least 100 cells were measured for each experimental condition for both comparison and RAMP assays. Adhesion data were analyzed by the two-sample unpaired (one-tailed) t test for comparing samples with 95% confidence.
Results
Instrument Operation and Software
All critical blocks are outlined in Figure 1 . Collection assembly is integrated with an inverted microscope and includes a DCU z-axis position module. The main working principle of the developed platform is to collect desired tissue regions and cells under direct microscopic visualization by applying vacuum pressure pulses controlled by a valve system. 39 The cells are positioned directly under the calibrated DCU tip by motorized stage ( Fig. 1C ). A specific software, PIKCELLS, was developed to integrate the motorized stage, a digital camera, vacuum pumps, valves, illumination for image analysis, and predefined adhesion and acquisition/deposition protocols ( Fig. 2 ). It consists of several menu windows with optional menus for calibration, acquisition, adhesion, dispensing, plate setup and inspection, camera controls, and main settings ( Fig. 2 ). Cells for adhesion/detachment assays and collection were selected with parameters specified in the Calibration, Adhesion, Plate SetUp, and Dispensing windows ( Table 1 ). Precise DCU tip positioning was calibrated with the vertical position controlling encoder wheel ( Fig. 1 ) or software, making the instrument ready for repeated measurements and acquisitions. Calibration is performed prior to every experiment as described previously. 39 Minor vertical adjustment of the tip position (recalibration) may be performed when the x-y plane of the cell substrate surface deviates from its original position. The software automatically controls the x-y position of the plate relative to DCU and determines the DCU tip ID used in subsequent adhesion/detachment force calculations. For RAMP adhesion experiments, the initial vacuum pressure was set to 1 kPa. Once the RAMP sequence was initialized, the instrument delivered short vacuum pulses (20 ms) that grew progressively stronger by intervals of 1 kPa until the cell was lifted. Each cell subjected to a RAMP assay was collected and deposited in a designated plate well ( Fig. 3 ). The results of each analysis were automatically recorded and stored as a downloadable text file and image data were linked to the positional information of the collected cell accessible via the PLATE SETUP/INSPECT window ( Fig. 2 ).
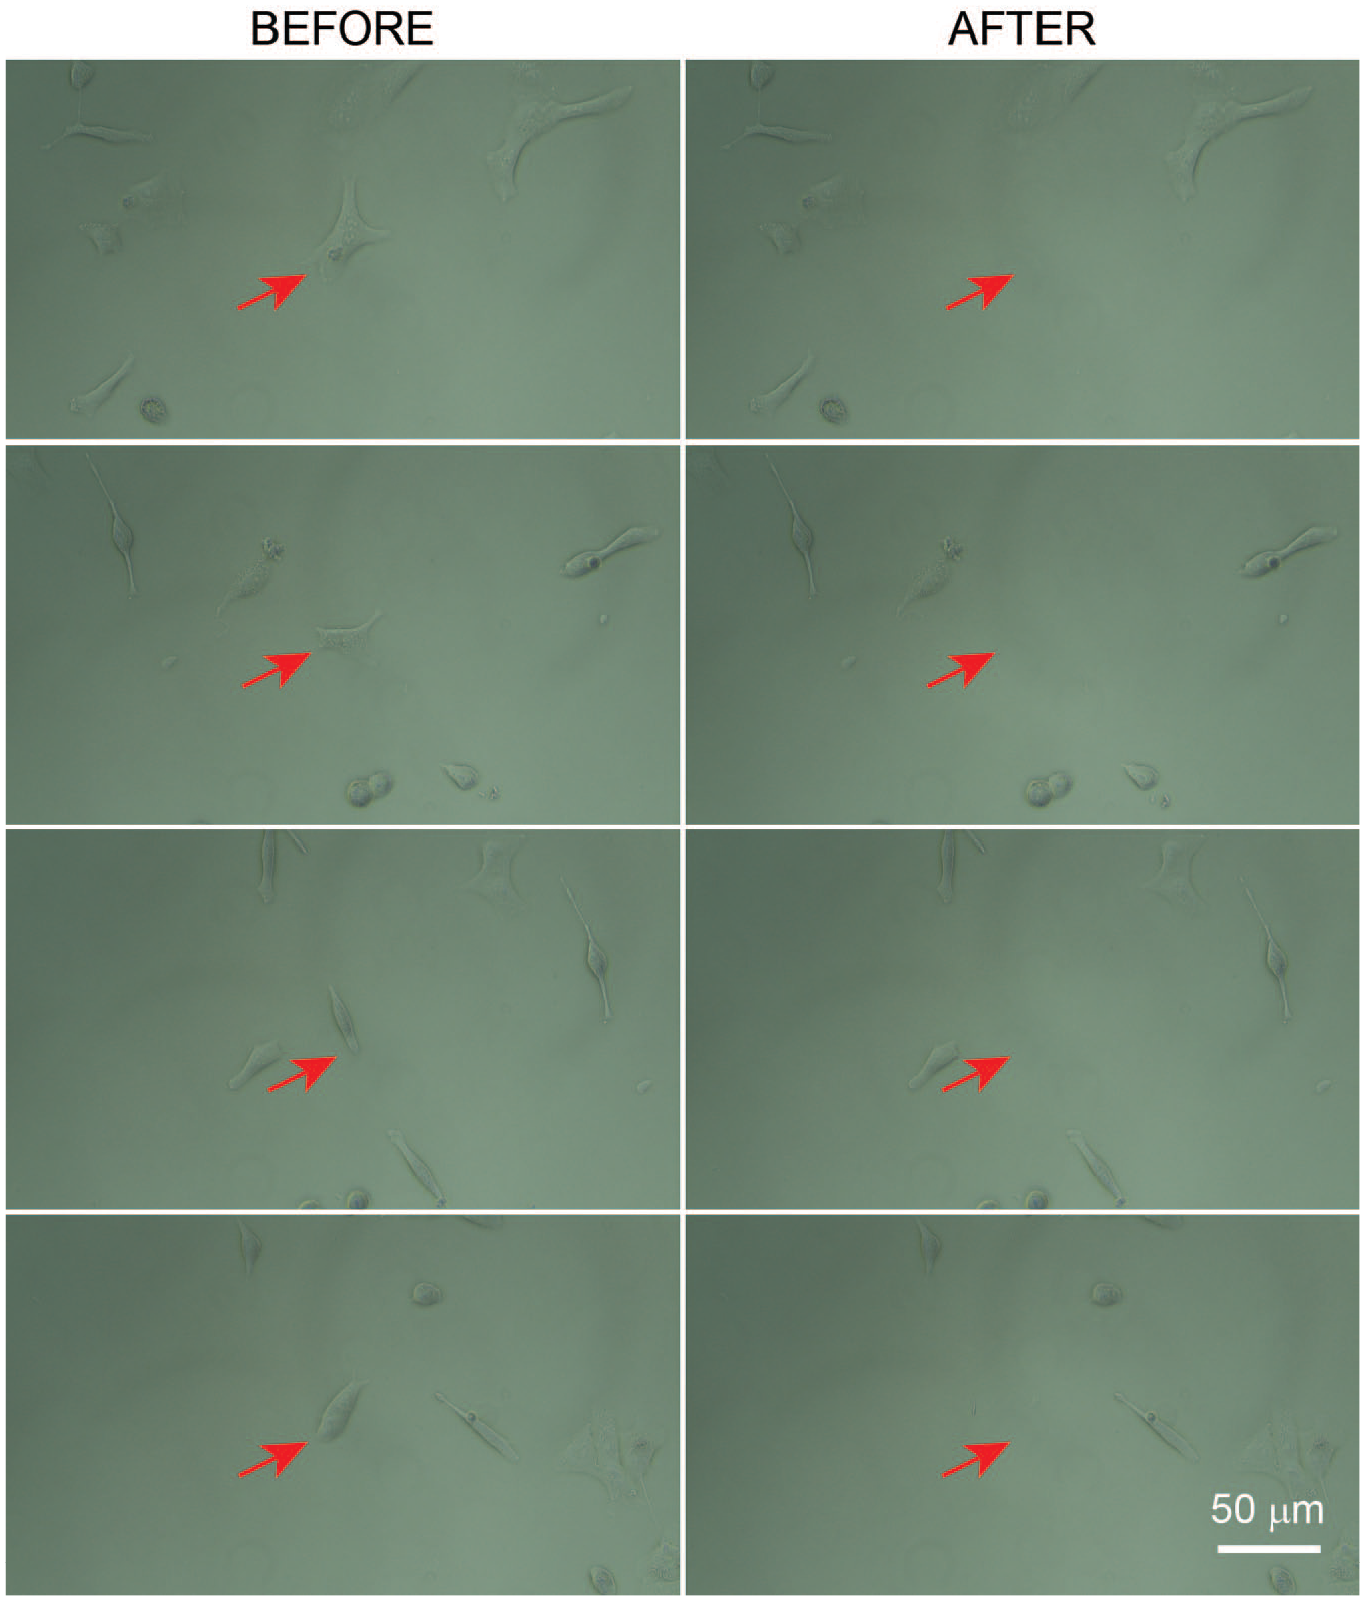
Representative collections of single A549 cells using the A-picK cell and tissue acquisition and detachment measurement system.
Adhesion/Detachment Measurement Assay Was Developed
First, specific parameters were set in the calibration menu, to establish the ACQ PLN for the adhesion assay. Normally, the DCU is positioned 1–2 µm above the cell surface. Then, the deposition sequence was configured by specifying well positions, the desired number of DCU washes, and a choice between single-cell deposition or pooling of cells and depositing them into a single well. Finally, parameters for the assay were defined, including vacuum strength, pulse duration, and RAMP interval, if desired. Two types of detachment/adhesion assays were developed, comparative and RAMP. For both assays, the DCU (ID = 20 µm) was attached to the collection assembly and the calibration procedure was performed using z-axis controls to identify the ACQ PLN. The precise DCU ID is identified automatically via PIKCELLS software in the CALIBRATION window menu (
Fig. 2
). For comparative assays, the tip of the DCU was positioned directly above the cell surface corresponding to 1.5 µm above the ACQ PLN and preset as ACQ PLN. Impulse duration was set at 20 ms. After the desired force was selected (vacuum strength), at least 100 cells for each experimental condition were subjected to a collection procedure (
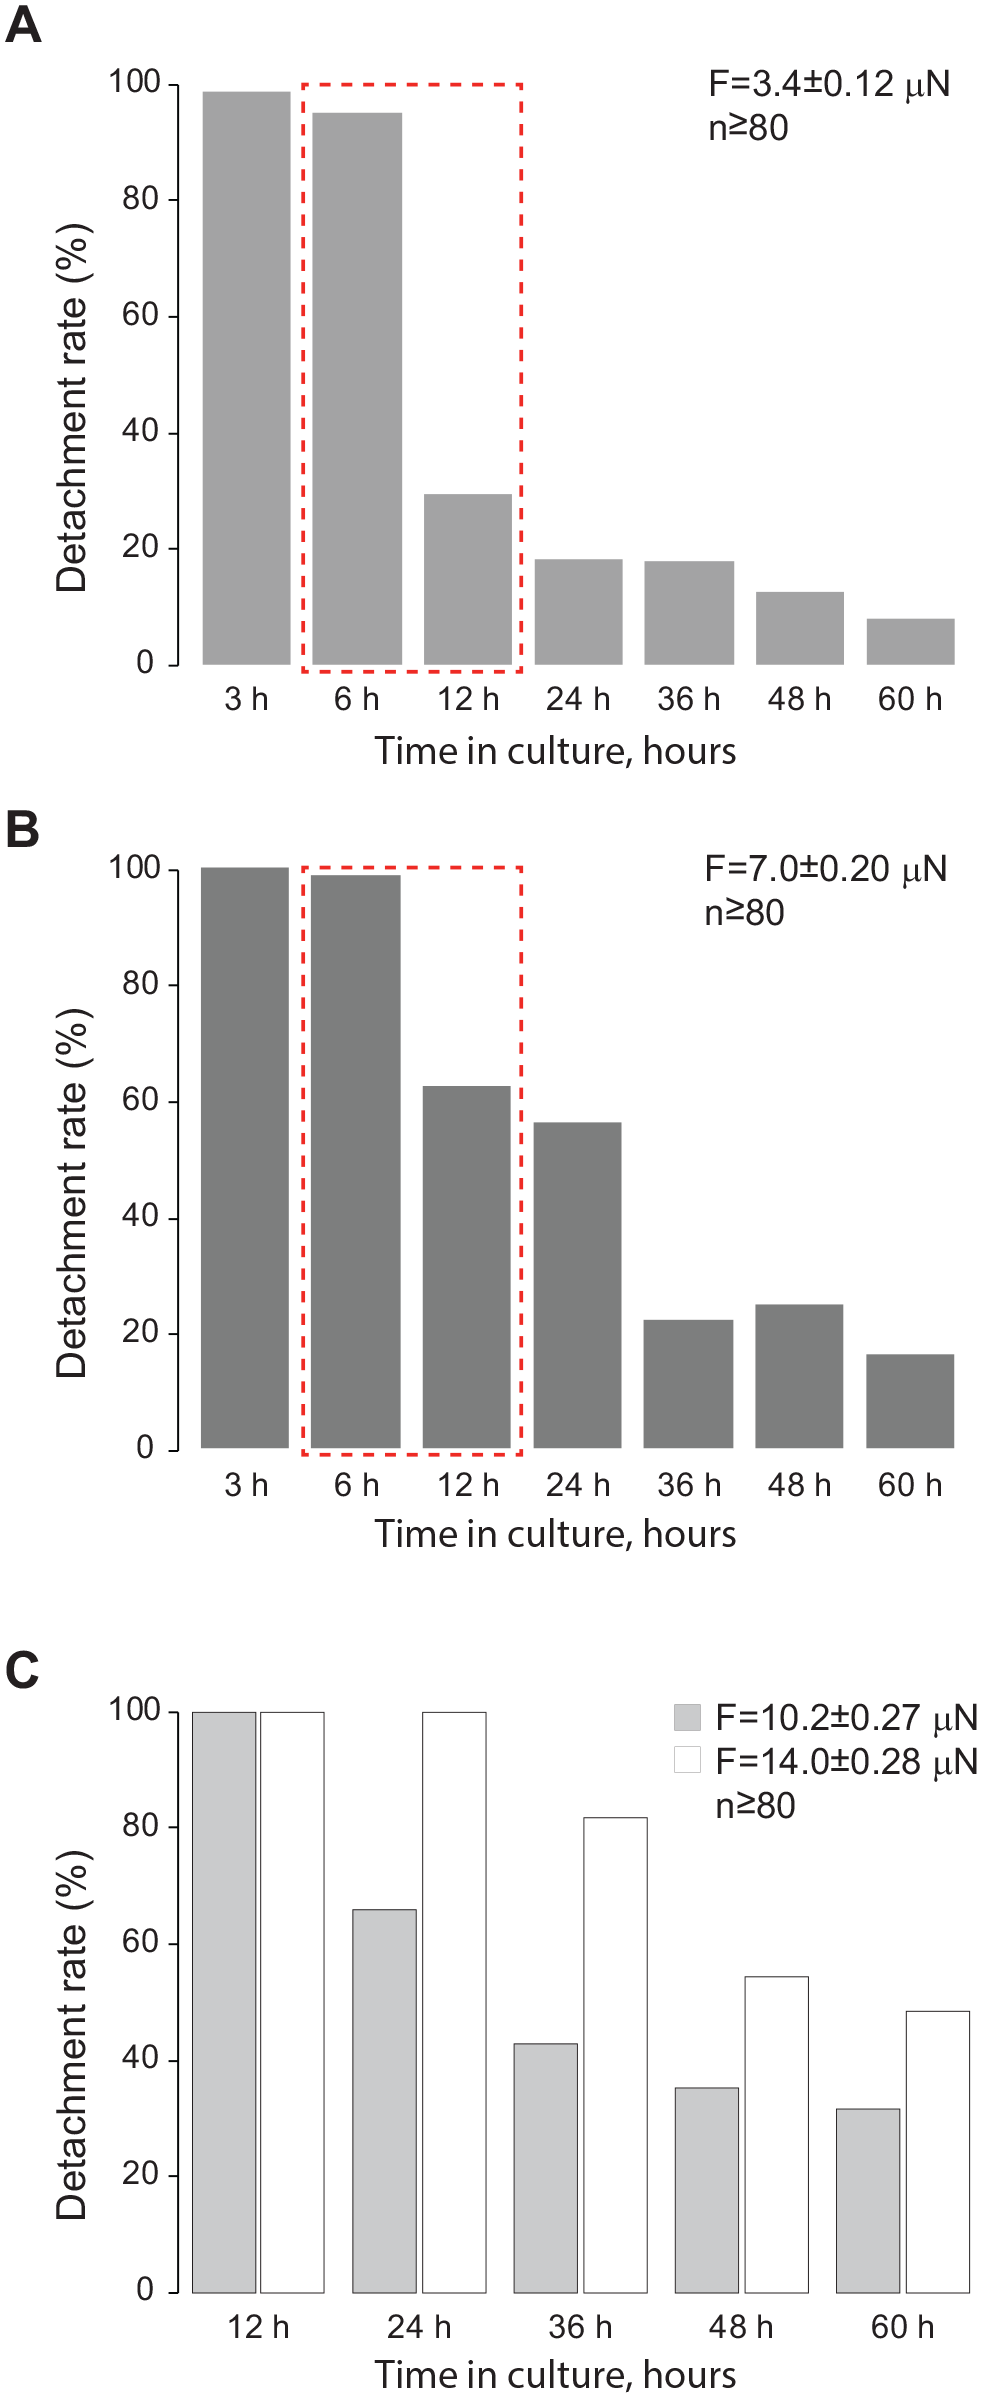
Percent detachment of A549 cells measured at (
The RAMP assay applied continuous vacuum pulses starting with a predefined initial vacuum strength (Pmin = 1 kPa, VACUUM, kPa) that was increased by a predefined interval (INTERVAL = 1 kPa) for the subsequent pulse. After settings were completed, cells subjected to the RAMP assay were selected via a mouse click on the screen over targeted cells. After the run was initiated, the motorized stage positioned each cell directly under the DCU and the detachment measurement was performed. During the RAMP sequence, the tip of the DCU remains at the same position above the cell. Once the cell was acquired, the total and final forces corresponding to that cell detachment were recorded, together with images before and after collection. The data were preserved as a downloadable text file for all cells measured. The RAMP function is linked with a deposition sequence, which automatically deposited the measured cells into predetermined wells.
It is important to note that the current instrument provides estimation of the cell’s total adhesion force without considering its individual shape, and therefore it is essential to collect morphologically similar cells for sound results. Clearly, cell shape and total area may be important factors altering adhesion by influencing the overall attachment area. Further development of imaging software for automatic shape recognition and calculation of the total cell area may become a part of the next iteration of software, which will increase the overall accuracy of the assay.
The capability to apply greater force than AFM in single or multiple pulses allows for the measurement of detachment force even for tightly attached cells. However, excessive force may potentially damage the cell membrane and decrease viability. This would not affect any downstream molecular analysis, as intracellular contents are collected, but should be kept in mind if measured cells are intended for subculturing or clonal expansion.
Comparative Adhesion Assay Demonstrates Gradual Adhesion Increase over Time in Culture
Using human lung carcinoma A549 cells, we investigated if the duration in culture affects cell adhesion. Cells were collected using constant 3.4, 7.0, 10.2, and 14.0 µN forces using a 20 ms pulse. This time course experiment revealed that the most drastic change in adhesion occurs after 6 h in culture, at which time clearly a larger percentage of cells required a higher vacuum strength to be lifted (
Adhesion Assays Correctly Identify Substrates with the Lowest and Highest Cell Adhesive Properties
We next investigated if there are any differences in attachment strength for A549 cells grown for 6 and 24 h after a split on seven different substrates, including fibronectin, laminin, PLL, carboxyl, amine, collagen, and gelatin-coated plates. Nontreated plates were used as a control. First, the comparative assay was performed at 6.0 µN for each condition (n = 100). The data clearly demonstrated that A549 cells grown on laminin showed the lowest adhesion among all substrates tested, while amine-modified and PLL-coated surfaces provided the strongest cell attachment ( Fig. 5A ) when compared with the nontreated plates. Then, using the RAMP assay, we duplicated the comparative assay using the same substrates, measuring at least 100 cells for each experimental condition. All selected cells were successfully measured and collected from culture plates with each of the substrates. Depending on the confluence of the cells, on average up to 10 cells could be collected per minute. In agreement with comparative tests, laminin demonstrated significantly lower adhesiveness (p = 0.043), exhibiting nearly four times lower the force required for lifting cells ( Fig. 5B ). Contrary to that, both amine-modified and PLL-coated surfaces provided significantly better substrates for cell attachment, exceeding the force required for cell lifting from noncoated plates by 11.2-fold (p = 3.0E-08) and 6.6-fold (p = 0.0003), respectively. These results clearly demonstrated concordance between the two different approaches. We also noticed a large spread in the detachment force among cells within the same experimental condition, pointing out high cell-to-cell adhesion variability ( Fig. 5B ).

Both (
Discussion
Here, we developed a fully automated system, A-picK, that integrates single-cell analysis (adhesion/detachment assay) and acquisition. The adhesiveness of a cell is a measurable physical property that provides valuable data regarding cell behavior and function such as gene expression, cell signaling, and cell motility. It has direct implications on embryonic development, assembly of tissues and the nervous system, cellular communication, inflammation and wound healing, tumor metastasis, and cell culturing. Cell adhesion is defined as the binding of a cell to a substrate, which can be another cell, a surface, or an organic matrix. The process is regulated by specialized cell adhesion molecules that bind to precise adhesion partners. 42 Therefore, to fully understand the cell adhesion process, a large amount of qualitative biological data must be correlated with quantitative data of physical cell adhesion properties. There is a great need for methods enabling the measurement of single-cell adhesion for basic, clinical, pharmaceutical, tissue engineering, and biomaterials research. Today, such analysis is challenging due to the lack of instrumentation capable of providing measurements of the single-cell adhesion/detachment force with its concurrent isolation and molecular analysis. The high cost and complexity of existing instrumentation, such as AFM and OTs, and the inability to measure strong binding of fully attached cells further limit the development of this important field. Here, we reported an automated instrument capable of assaying single-cell detachment/adhesion properties with its concurrent collection and deposition for clonal expansion or any downstream molecular analysis. Manually controlled capillary-based aspiration for adhesion measurement requires well-trained operators, a syringe pump, micromanipulators, and simultaneous control of multiple parameters, such as time, seal formation, vacuum application, and video recording. Our system reported here is operated automatically from target cell adhesion/detachment measurement to its collection and deposition to a desired location.
Two types of detachment assays, comparative and quantitative (RAMP), were performed to demonstrate the feasibility of the proposed approach. Cell adhesion measurements were performed using the human carcinoma A549 cell line at different time points after the initial culture split and on different substrates, demonstrating the variability in its adhesiveness. The target cells were selected on a computer screen, and parameters for the adhesion assay were selected in the PIKCELLS adhesion window menu ( Fig. 2 ). After the run was initiated, the detachment force measurement was performed for each selected cell, followed by its collection and dispensing into a designated plate well.
The Assay Determines Stable Adhesion Stage for A549 Cells
The process of in vitro cell adhesion is divided into three stages: stage I, sedimentation, or initial attachment of cells; stage II, when actual cell attachment to a surface occurs; and stage III, characterized by cell flattening, full cell spreading, and stable adhesion with the formation of focal adhesion between the cell and a substrate.
20
This is the point where most single-cell adhesion/detachment approaches do not have enough lifting power to measure the detachment strength for a fully attached cell.
20
The strength of adhesion grows stronger over time as a cell adheres to a substrate.34,37 In our experiments, we can clearly see such a demarcation line after 6 h in culture (
Both Assays Demonstrate Concordance in Identifying the Lowest and Highest Adhesive Substrates
Adhesive noncollagenous glycoproteins, such as laminin and fibronectin, play central roles in the ECM, affecting cell attachment, motility, growth, and differentiation. 43 It is known that cells respond differently to different adhesive factors. This response depends on the presence of corresponding receptors on a cell surface.44,45 Fibronectin is an essential adhesive glycoprotein that promotes the attachment of various cells, including corneal cells, 45 hepatocytes,46,47 human fibroblasts, 48 cerebral capillary endothelial cells, 49 and others, 50 to a surface. Laminin, a basement membrane glycoprotein, was also shown to be an important factor of cell adhesion. It was demonstrated that adult mouse liver cells 46 and epithelial corneal cells 45 attached poorly to laminin-coated dishes, which agrees with our observations ( Fig. 5 ). Indeed, the RAMP assay revealed a significant difference in the cell detachment rate between control (noncoated) and laminin-coated surfaces (p = 0.043) ( Fig. 5B ). Both assays indicated that A549 cells attach poorly to laminin-coated surfaces ( Fig. 5 ). Interestingly, our observations agreed with previous studies reporting that fibronectin provided a better substrate for hepatocytes, consistently demonstrating high rates of attachment in comparison with laminin-coated surfaces.46,47 In fact, the RAMP assay also revealed significant differences (p = 0.0005) between laminin and fibronectin cell attachment strength, supporting previously published data ( Fig. 5B ).46,47
Accelerated adhesion in the presence of fibronectin was previously reported for human prostate adenocarcinoma LNCaP cells, 51 the NIH3T3 and ND7/23 cell lines.52,53 In our study, fibronectin-coated dishes did not demonstrate better adhesion. The force required for lifting cells from fibronectin-coated dishes was 60% lower than that for nontreated surfaces but did not reach statistical significance (p = 0.33) ( Fig. 5 ). Many previous studies utilized cell counting as an indication of cell adhesion or attachment to a particular substrate. 51 Such data must be interpreted with caution as changes in cell morphology or proliferation rate may introduce artifacts influencing proper interpretation of cell adhesion potential. This is one reason why the estimation of cell adhesion should be performed directly and individually for each single cell, keeping in consideration its size, morphology (e.g., multiple processes), and changes in proliferation in response to specific media.
Both PLL- and amine-coated (positively charged) surfaces provided significantly better adhesion (p < 0.0003 and p < 3.000E-08, respectively) in comparison with noncoated dishes. It was shown that PLL-coated surfaces improved the adherence of the androgen-sensitive human prostate adenocarcinoma cell line, LNCaP, while the laminin coating did not have a notable effect on cell attachment, 51 which is in agreement with our data ( Fig. 5 ). PLL is a well-known coating agent that improves the overall adhesion of cells and was used in numerous studies for efficient culturing of cancer cells,54,55 fibroblasts, 56 embryonic and induced pluripotent stem cells,57,58 smooth muscle cells, 59 and many others. 60 Thus, the improved adhesion/attachment to the PLL surface observed in our study was not unexpected.
Cell behavior, including adhesion capability, is influenced greatly by various physical substrate properties, such as surface charge, hydrophobicity and hydrophilicity, surface energy, surface chemistry, and geometry.61–63 Both positively charged amine and negatively charged carboxyl surfaces support better cell attachment and growth in comparison with standard tissue culture dishes.64–66 Amine-treated surfaces provided increased growth for human mesenchymal stem cells (hMSCs), human adipose-derived stem cells (hASCs), 65 and the hamster kidney cell line BHK-21. 66 Amine coating significantly increased attachment of hERG-T-REx 293 and HEK-293 human embryonic kidney cells. 64 Similarly, PureCoat carboxyl-treated surfaces demonstrated enhanced growth and attachment for several cell lines, including the prostate cancer cell line LnCAP and the lung-derived primary cell line MRC-5. 66 It may be expected that increased cell attachment positively correlates with cell adhesion. However, our experiments clearly demonstrated that while an amine-treated surface indeed provides significantly better cell adhesion (11.2-fold, p = 3.0E-08) ( Fig. 5B ), adhesion of A549 cells to carboxyl-treated dishes was seemingly lower (2.2-fold) than in standard nontreated culture dishes, pointing to cell- and surface-specific adhesion mechanisms for each individual cell type.
RAMP Adhesion/Detachment Assay Detects Variable Adhesiveness between the Cells within the Same Experimental Group and Similar Morphology
High adhesion variability was observed within the same experimental groups ( Fig. 5B ). This could be explained by differences in the size of the attached cells and assuming that the larger area of attachment would provide stronger adhesion; however, we took caution in selecting morphologically (including area size) similar cells during the assay. This points to the existence of large variabilities in the adhesion potential of individual cells even when cultured in the same conditions. These new data demonstrate the capability of the RAMP assay for studying single-cell-specific adhesion properties, adding another dimension to characterizing single cells beyond molecular information (i.e., proteins and nucleic acids), which has been the subject of much research. Numerous protocols for nucleic acid extraction and preparation for downstream expression profiling of single cells have been developed and are continuously improving. However, integration of such information with biophysical properties of selected cells, such as adhesion, remains largely untouched despite a clear need for precise genotype–phenotype correlation analysis of individual cells. Many technologies have been developed to provide characterization for biophysical properties of individual cells, which include AFM and OTs. Unfortunately, none of them are used in conjunction with molecular analysis (e.g., next-generation sequencing [NGS]), and no instrumentation for simultaneous adhesion measurement and acquisition has been developed until now.
Our A-picK system represents the first versatile approach that remains relevant from basic research to personalized medicine by providing an integrated method for analyzing a wide variety of cells by establishing a single-cell adhesion/detachment phenotype and acquiring single cells for downstream analysis or clonal expansion. The combination of adhesion/detachment analysis and acquisition in a form of an automated suite is a critical differentiator of this technology. Importantly, the developed platform remains compatible with the applications targeted with the original CTAS instruments, UnipicK and UnipicK+, such as tissue microdissection,39,40 collection of circulating tumor cells,67–72 and other individual cultured cells.73–75 Hence, it provides the first fully automated single-cell adhesion/detachment analysis and acquisition system.
Footnotes
Declaration of Conflicting Interests
The authors declared the following potential conflicts of interest with respect to the research, authorship, and/or publication of this article: S.L.K., Z.M., and L.C.K. are co-owners of NeuroInDx, Inc. D.M. is a former employee of NeuroInDx, Inc. The main principle of the developed cell detachment and acquisition system (CDAS) is covered by U.S. Patent 8,797,644.
Funding
The authors disclosed receipt of the following financial support for the research, authorship, and/or publication of this article: This work was supported by National Institutes of Health/National Center for Research Resources (NIH/NCRR) grant R44RR024059 (L.C.K.), NIH/National Institute of Mental Health (NIMH) grant R44MH091909 (S.L.K.), and NIH/National Cancer Institute grant R44CA199194 (S.L.K.). The funders had no role in study design, data collection and analysis, decision to publish, or preparation of the manuscript.