
Abstract
Within the past years, single-cell analysis has developed into a key topic in cell biology to study cellular functions that are not accessible by investigation of larger cell populations. Engineering approaches aiming to access single cells to extract information about their physiology, phenotype, and genotype at the single-cell level are going manifold ways, meanwhile allowing separation, sorting, culturing, and analysis of individual cells. Based on our earlier research toward inkjet-like printing of single cells, this article presents further characterization results obtained with a fully automated prototype instrument for printing of single living cells in a noncontact inkjet-like manner. The presented technology is based on a transparent microfluidic drop-on-demand dispenser chip coupled with a camera-assisted automatic detection system. Cells inside the chip are detected and classified with this detection system before they are expelled from the nozzle confined in microdroplets, thus enabling a “one cell per droplet” printing mode. To demonstrate the prototype instrument’s suitability for biological and biomedical applications, basic experiments such as printing of single-bead and cell arrays as well as deposition and culture of single cells in microwell plates are presented. Printing efficiencies greater than 80% and viability rates about 90% were achieved.
Introduction
Research in many fields of molecular biology is nowadays limited by a lack of instruments and technologies enabling isolation and analysis of individual cells. In fields such as stem cell biology, hematology, cancer biology, or tissue engineering, the requirement to conduct single-cell studies has become ever more prominent in recent years. Measuring cells in populations means analyzing average signals from a large number of cells. Cell types constituting a minority in such samples can hardly be analyzed because their properties are hidden by the majority population. Thus, an appropriate analysis of samples with significant cellular heterogeneity is ideally performed on a single-cell level. Many applications in drug discovery or medical diagnostics, such as single-cell microarrays, single-cell PCR, isolation of rare cells, or production of clonal cell lines, could benefit significantly from analytical approaches based on single cells.
In practice, separation and manipulation of individual living biological cells remains a challenging task for many life science applications. At present, the commercially available technologies to separate single cells from a suspension and deposit them individually on substrates are quite rare, especially regarding processing of nontreated samples and label-free cells. Research covers a large spectrum of technological approaches to enable single cells, ranging from established technologies such as flow cytometry toward highly integrated microfluidic and microelectronic devices to approaches using modifications of existing technologies such as optical manipulators or inkjet printers developed initially for other purposes. In the following, a brief overview is given of existing technologies that have been proposed for single-cell separation, sorting, and analysis.
Commercial Single-Cell Technologies
With commercially available systems based on fluorescence-activated cell sorting (FACS), such as the MoFlo XDP (Beckman Coulter, Brea, CA) or FACSAria (BD BioSciences, San Jose, CA), fluorescent-labeled single cells can be effectively sorted and individually deposited on various substrates with very high throughput and efficiency. Without doubt, these technologies offer outstanding performance in cell analysis, sorting, and counting and are already established worldwide in many laboratories. However, besides many benefits, some limiting factors for single-cell applications still remain. Fluorescent labeling is required to enable laser detection of cells, which adds additional costs and effort to sample preparation and might adversely affect the cell viability. Minimum required sample volumes of several hundred microliters render the technology unsuitable for applications in which only a small volume of cells is available. The viability of cells can be significantly affected by the FACS process, because laser radiation and electrical droplet charging do have nonnegligible effects on cell viability.
Besides FACS systems, other manufacturers offer commercial single-cell analysis devices based on imaging methods such as the FlowSight (Amnis Corporation, Seattle, WA) or on electrical impedance such as the Impedance Microflow Cytometry (Amphasys AG, Lucerne, Switzerland). Although such technologies allow for detailed analysis of cells on the single-cell level, none of them is able to extract a specific cell for further downstream single-cell analysis (e.g., by PCR).
With the C1 Single Cell Autoprep module for their single-cell PCR System BioMark HD (Fluidigm Corporation, San Francisco, CA), Fluidigm enters the commercial market of single-cell analysis technologies as one of the first manufacturers with a lab-on-a-chip system. Although the C1 chip separates cells from suspension and prepares them for single-cell PCR with high yield, this device is meant for PCR purposes only. It neither allows for extraction of single cells for further downstream analysis nor supports any analysis technique other than PCR.
Noncommercial Single-Cell Technologies in Research
A certain number of single-cell applications have already being realized in noncommercial products or prototype systems basically invented and developed by research groups worldwide. The majority of these technologies are lab-on-a-chip devices based on well-known physical effects such as flow cytometry,1,2 dielectrophoresis, 3 acoustophoresis, 4 magnetic activated sorting, 5 capture and trapping,6,7 encapsulation, 8 seeding and culture,9,10 cell lysis and PCR,11,12 and many more. Furthermore, FACS has also strongly emerged as integrated technology in the lab-on-a-chip research field.13,14 Lab-on-a-chip systems offer a highly integrated solution to a specific problem, are small in size, and are projected to be low cost and disposable, once commercialized in sufficiently high numbers. Although the design possibilities are immense, there is also a lack of flexibility associated with each specific lab-on-a-chip device, making it impossible to perform a broader range of applications on one and the same device.
To develop more flexible approaches, researchers have also investigated droplet-based technologies such as laser-guided printing15,16 and modified inkjet printing,17,18,19 as well as alternative methods20,21 to print single living cells on various substrates. Commercial inkjet printheads from the 1990s to 2000s, such as the HP660C Wilson and Boland presented in their work, 22 have especially attracted scientific attention in the past years. This is mainly due to their ability to generate droplets only slightly larger than a typical cell. An increasing number of researchers used and modified such printheads to actually print biological suspensions containing living cells and thereby enable versatile applications especially targeting the field of tissue engineering. By precise adjustment of cell concentration, inkjet printheads have been shown to be applicable to deposit droplets containing single cells.23,24
Single-Cell Printer Technology
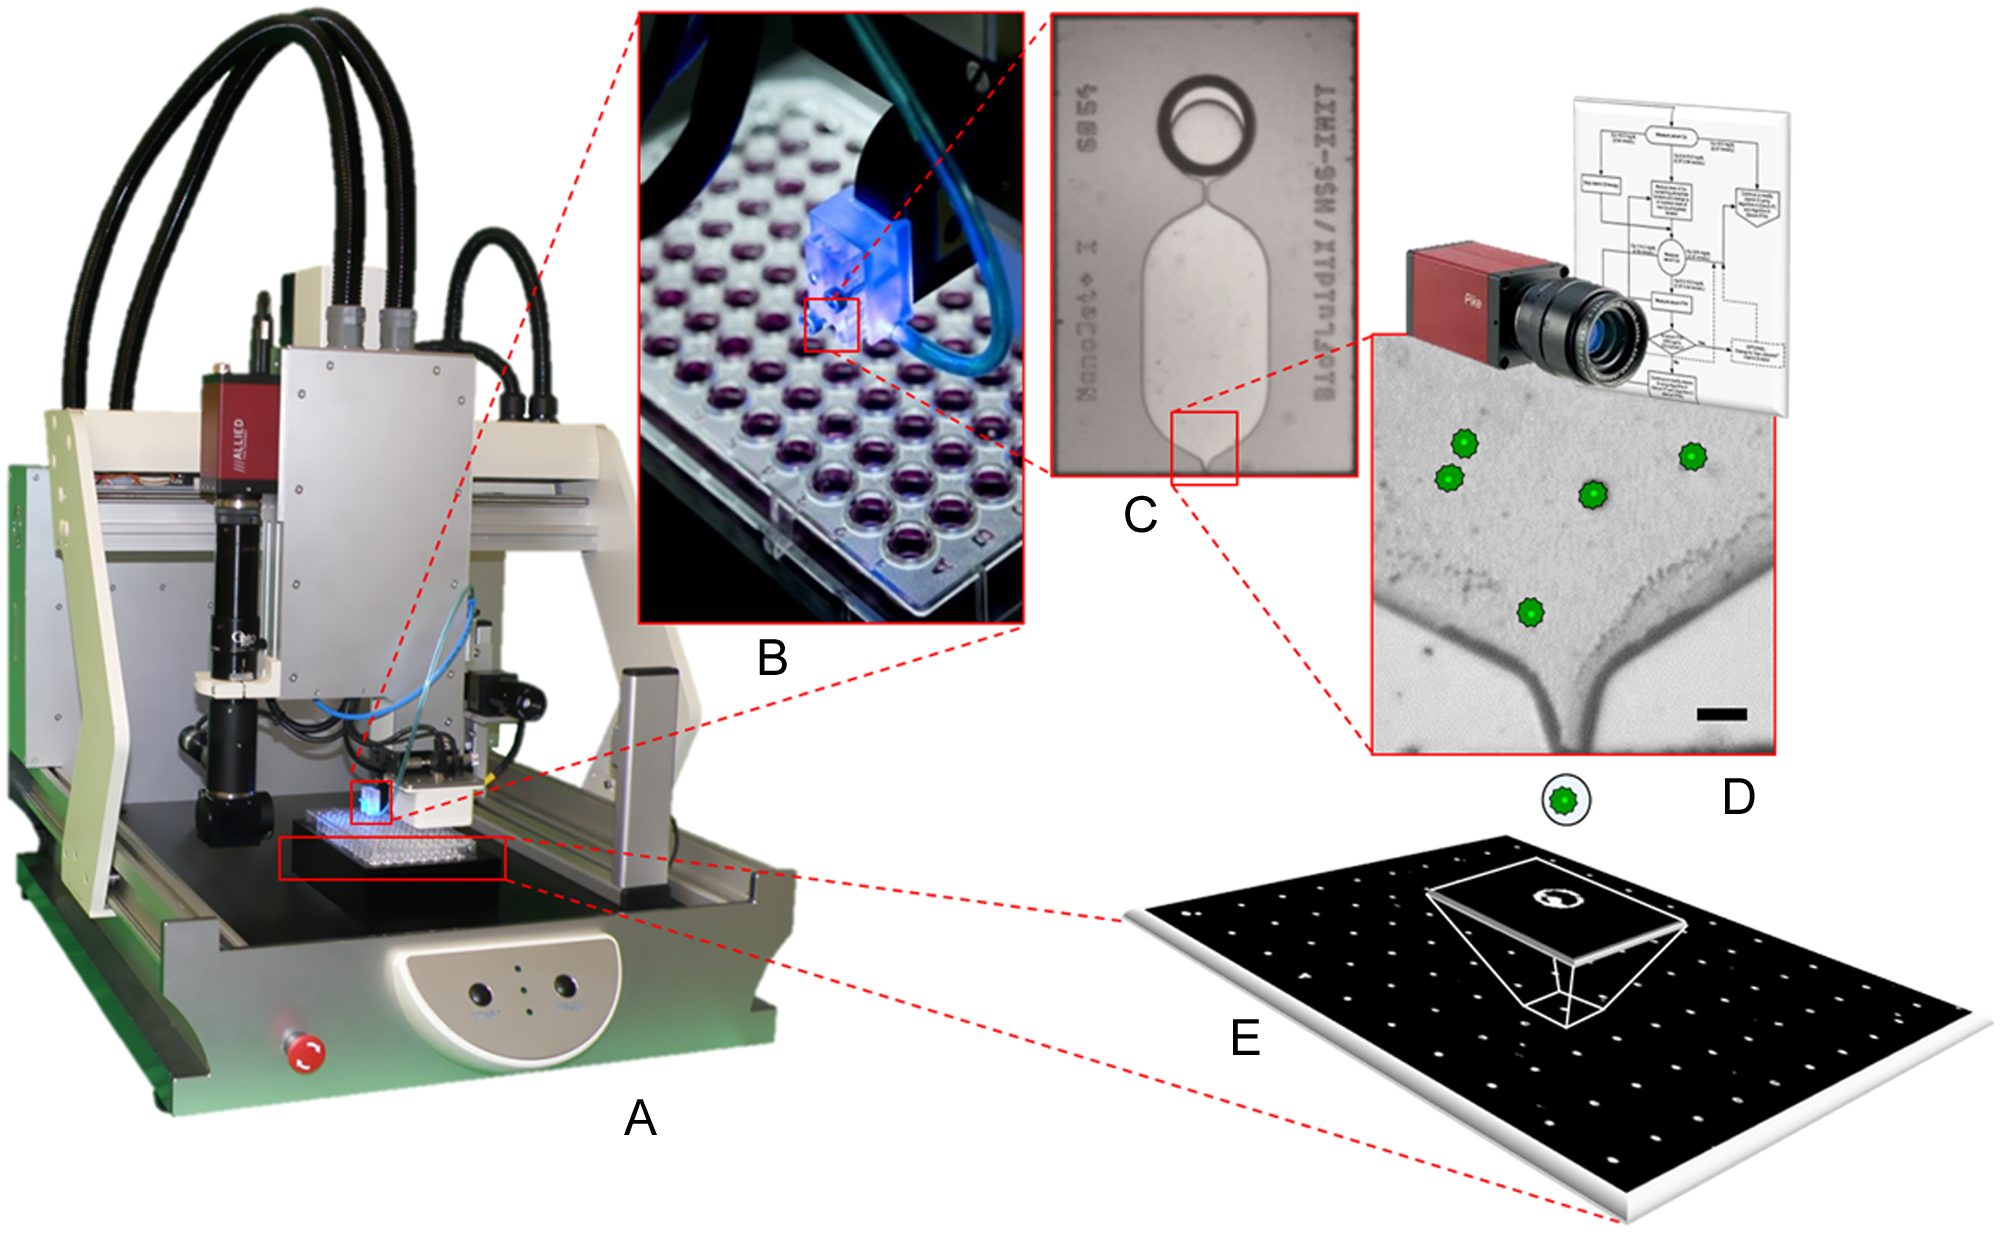
Exploiting the good performance of inkjet-based cell printing, we have developed a prototype liquid-handling instrument termed single-cell printer (SCP; cf. Fig. 1 ) that combines an inkjet-like principle with an optical system for label-free detection and printing of single living cells. The presented prototype instrument was developed within the European research project “Platform for Advanced Single Cell Handling and Analysis” (PASCA). Together with project partners, selected applications from the fields of cell line optimization, cancer stem cell research, and automated patch clamping are currently being realized with the prototype instrument.
(
The SCP technology has made significant progress since the beginning of its early stages and publication of its proof of principle. 25 With the agility of a precision robotic stage; multiple assistant cameras to control and optimize printing quality; a process speed of 60 analyzed images per second, which can be stored for subsequent analysis, and an interactive user interface, it has achieved an automated prototype instrument state. This instrument and its performance are described and characterized within this article.
Materials and Methods
Technical Description of the Prototype Instrument
The SCP technology is based on a top-side transparent micro dispensing chip for drop-on-demand generation of micro droplets from a liquid cell suspension. Coupled with a computer-controlled, high-magnifying vision system that can automatically detect single cells in proximity of the chip’s nozzle, single-cell printing and sorting can be achieved. The dispenser chip is a silicon-glass compound containing micro-fluidic structures, like those shown in Figure 2 . The so-called dosage chamber has a silicon membrane on its backside, which is deflected by a piezostack actuator. The deflection causes a displacement of liquid inside the chamber, leading to a droplet (~50 µm diameter) being ejected from the nozzle. 26 Depending on the fluid’s physical properties and piezo control parameters, droplet volumes can be controlled in the range from 100 pL to 250 pL using a nozzle diameter of 40 µm. Alternative chip designs with nozzle diameters ranging from 10 to 100 µm allow for single-droplet volumes between a few picoliters and a few nanoliters. Being connected to a reservoir, the chip can be loaded with volumes of 5 to 100 µL cell suspension. Cell suspension is loaded by simply hand pipetting it into the reservoir. The chip is self-filling by capillary forces and thus can be ready for printing directly after the sample has been loaded. The chip-reservoir compound is disposable, which eliminates cleaning and disinfection of fluidic parts.
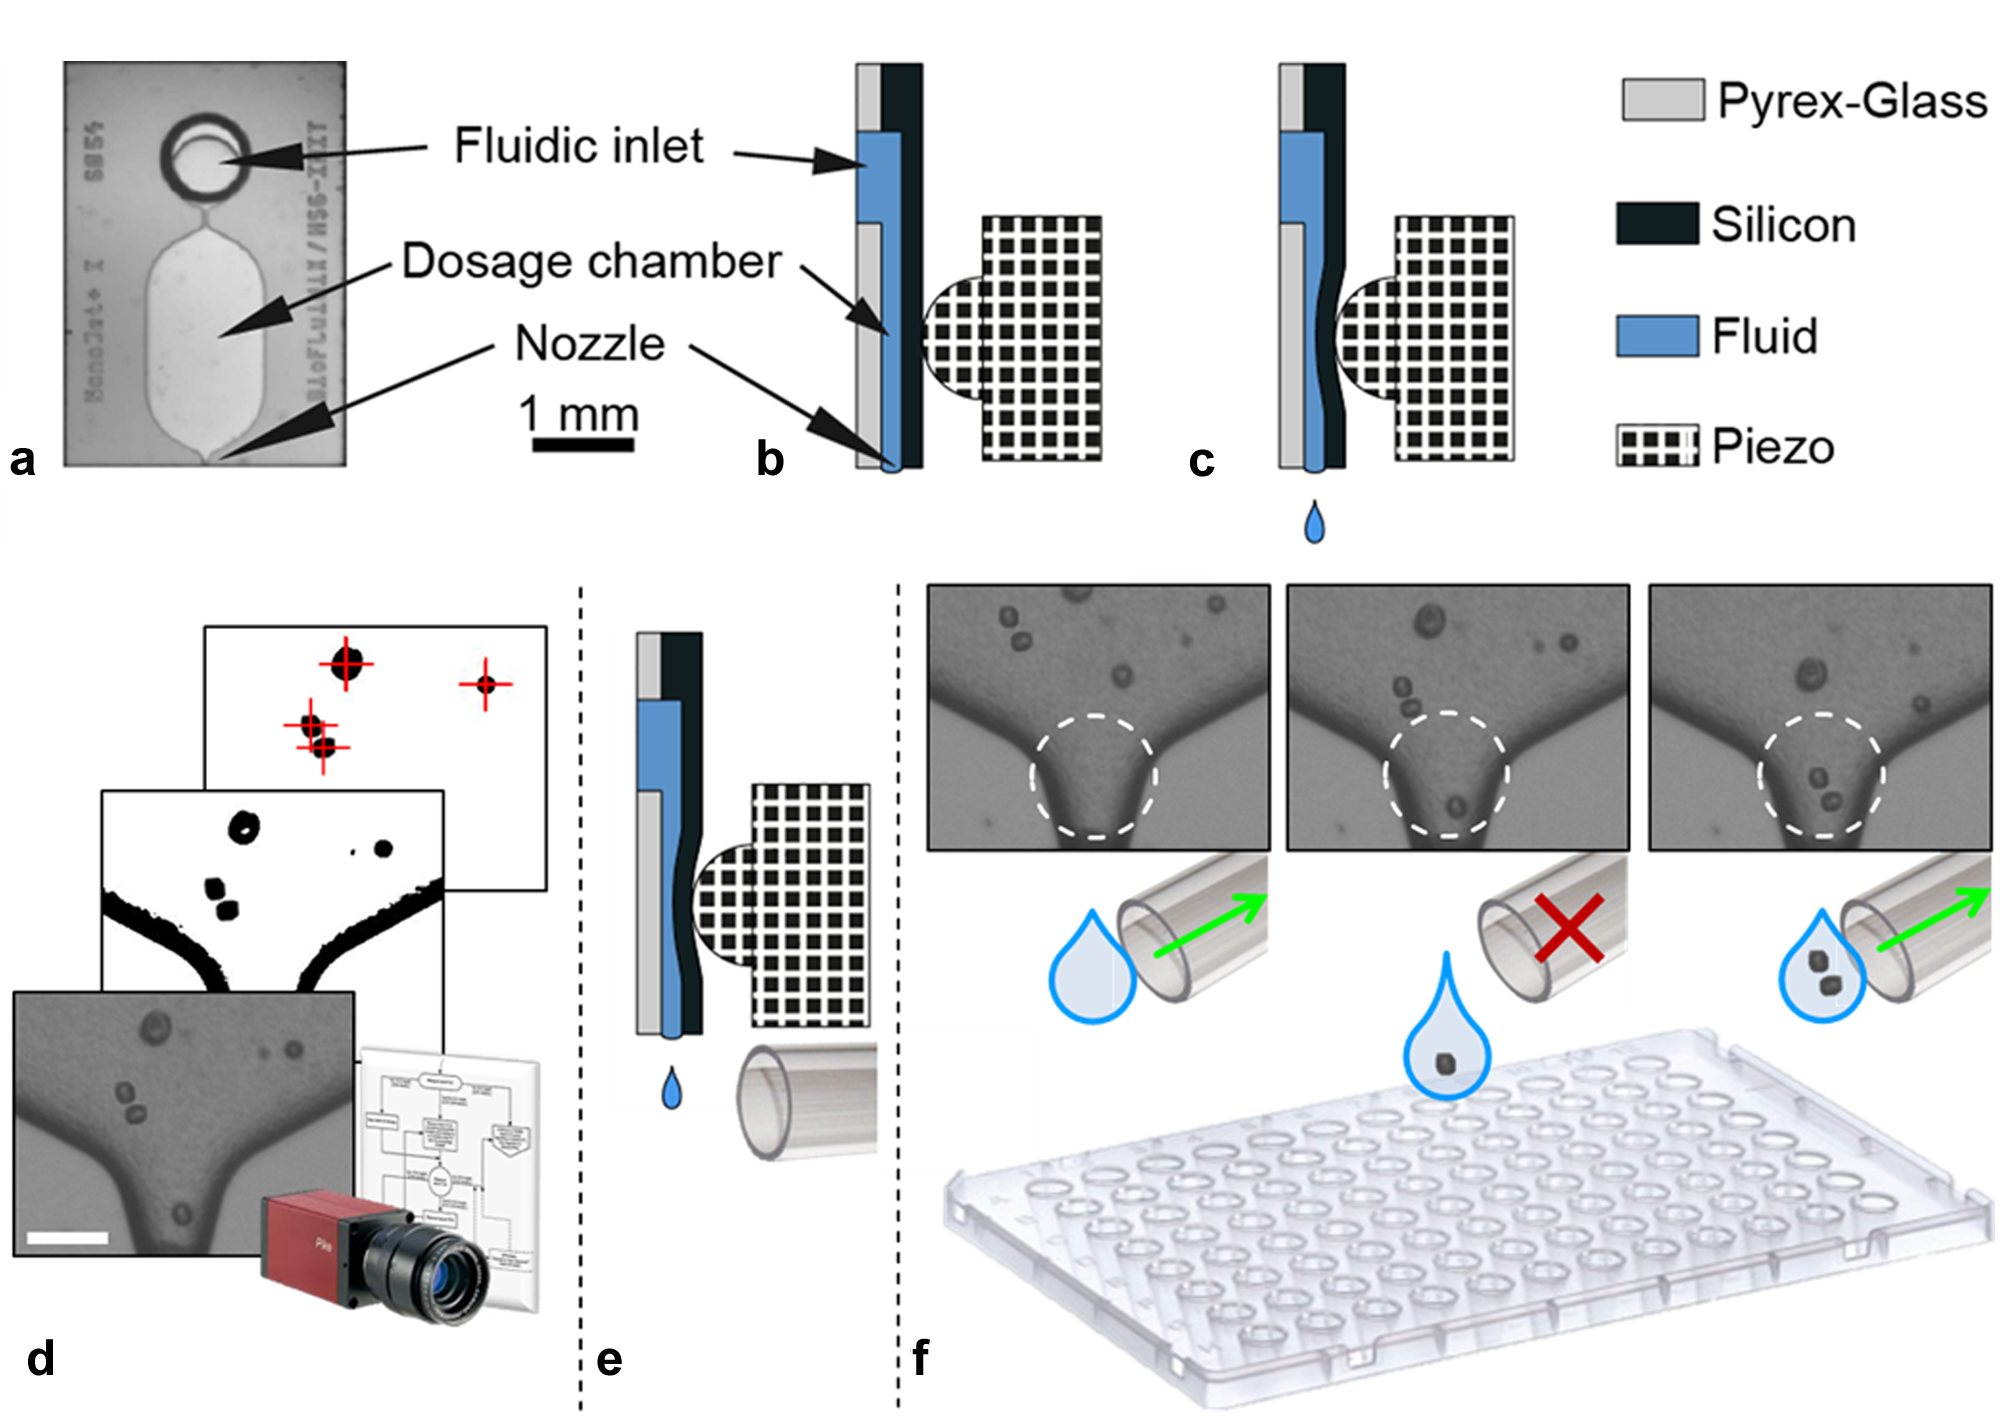
Schematic of working principle of the single-cell printer (SCP) technology. Top view shows front (
The vision system of the current SCP prototype instrument consists of a fast, highly sensitive monochrome camera (AVT Pike F-320B; Allied Vision Technologies, Germany) and a custom designed zoom optics (Opto GmbH, Germany) with a spatial resolution of 0.8 µm per pixel. The camera monitors the area of the dispenser chip’s nozzle through its transparent glass surface. Before each droplet generation, the camera takes a picture (cf. Fig. 2d ), analyzes it, and extracts the position of each cell being visible in the chip. Exactly knowing the volume that is going to be displaced from the nozzle within the subsequent droplet generation, the system can predict the number of cells that will be expelled with the next droplet.
Although the actual number of cells per droplet cannot be actively controlled, because the cells inside the chip are randomly distributed, the droplets can still be classified into those containing exactly one single cell and those containing none or multiple cells, even before the droplet is actually created. Coupled with a controllable micro-pneumatic shutter system installed directly below the chip’s nozzle (cf. Fig. 2e ), all droplets other than those containing exactly one single cell can be sucked away in flight into a waste reservoir, whereas all single-cell droplets pass the shutter system unaffected. As a result, only droplets populated with exactly one single cell are effectively printed to the target substrate (cf. Fig. 2f ).
The pneumatic shutter system consists of a vacuum pump (Jade 1420; Thomas Gardener, Wayne, PA) coupled to a high-speed magnetic valve (MHE2-M1H-3/2G-QS-4-K; Festo GmbH, Germany, opening time 2 ms). Directly behind the nozzle orifice, a tubing (1 mm inner diameter) is installed, sucking off unwanted droplets by vacuum into a separate and disposable tube. The high-speed valve is used to control this vacuum suction.
The image-processing software enabling the described process features a set of image detection algorithms for object recognition and a set of control and decision functions together termed the cell detection algorithm. Its major task is to virtually isolate the cells in the picture from the background and to distinguish them from other objects such as dust particles, cell fragments, and cell clusters or vibration- and fluidic dynamics–induced variations. To do so, multiple image-processing functions have to be performed, including dynamic background subtraction, edge filtering, contour finding, as well as area and shape computing according to well-known image-processing methods. The algorithm is capable of processing 60 images (640 × 480 pixels, 8-bit grayscale) per second, which, depending on cell concentration, axes movement, and pneumatic shutter times, enables virtually printing up to one single cell per second.
The software offers a set of control parameters to classify the detected objects and determine which are actually considered to be single cells. Also, different cell types in mixed-cell samples can be distinguished, as long as they differ sufficiently in their optical properties, for example, having different size or morphology. At a spatial optical resolution of 1 µm per pixel, the minimum diameter of an object to be reproducibly detected by the algorithm is 5 µm. The maximum diameter of printable objects (cells) is dependent on the chip’s nozzle orifice and is for the standard system chip 40 µm. Further provided chip models with different openings allow for objects with up to 100 µm in diameter. It was proved that successful optical sorting of objects differing at least 3 µm in diameter is generally possible. Furthermore, not only can the size of cells be used as a detection criteria but also shape. According to the system’s optical resolution, variations in cells morphology greater than 1 µm can be detected. These values have been evaluated along live cell experiments with HeLa and H-FIBD cells as well as on additional computing with offline image sets saved from experiments. However, these values can differ for different cell types or cell media and thus should be considered as guidance values.
All images taken by the vision system can be stored for later analysis and optimization of the algorithm to enhance single-cell printing performance. Images from single-cell events are separately stored and assigned to the specific cell location on the substrate. Thus, the user can postanalyze what has actually been printed.
The droplet generator, vision system, and pneumatic shutter are combined in a compact printhead, which is mounted to a three-axes robotic stage to build a flexible bench-top instrument able to address a wide variety of different substrates (cf. Fig. 1 ). With a positioning accuracy of 20 µm in each direction and movement speed of up to 100 mm/s, the robotic stage can precisely and quickly address standard microwell plate and slide formats, petri dishes, PCR tubes, and other substrates. The platform is further equipped with two additional supporting camera systems. One is a stroboscopic camera (UI-1240LE-C; IDS Imaging Development Systems GmbH, Germany) enabling monitoring of dispensed droplets in flight. This feature is to be used for adjustment of piezo actuation parameters to ensure stable and reproducible droplet quality when using different types of liquids, which is essential for a good printing performance. The second additional camera system is a high-resolution board-level camera (DFM 72BUC02-ML; The Imaging Source Europe GmbH, Germany) monitoring the substrate. Thereby, the printed single cells can be imaged directly after being printed to verify that the cell has been deposited successfully to the substrate.
Primary Characterization with Polystyrene Microbeads
The SCP instrument’s performance was first characterized using polystyrene microbeads (with 20 µm diameter suspended in phosphate-buffered saline [PBS] medium) in two extended benchmarks. Such microbeads proved to be an acceptable substitute model for cells but are much easier to handle and allow for extended, time-intense experiments. Previous work 25 and prior experiments demonstrated that beads show similar behavior in terms of printing properties and efficiency compared with cells. These experiments will not be explained in full detail because they are partly already published and are not focus of this article.
Droplet volume in all presented experiments was adjusted to 150 pL to ensure consistency between experiments and support calculated values. Sample volume was 20 µL, and a new chip was used in each experiment.
In the first benchmark, so-called “random printing” was performed (i.e., the detection algorithm was deactivated such that the number of cells per droplet occurred randomly). In the second benchmark, detection was activated, and controlled single-bead printing was performed. The following objectives hereby had to be evaluated:
Benchmark 1: random printing
Appearance of single beads per droplet depending on concentration
Comparison to inkjet cell/bead printing in literature
Benchmark 2: controlled printing
Dependency between printing efficiency and concentration
Dependency between bead loss and concentration
Time consumption to print a certain number of single beads
Determination of optimal working concentration for cell experiments
Benchmark 1: Random Printing
Conventional inkjet-printing approaches of particles or cells known from the literature found the statistics of single-bead or single-cell occurrence to be governed by Poisson’s distribution.15,17 According to this distribution, the probability P of dispensing a given number k of particles in an aliquot, where λ is the average number of particles in the aliquot, is calculated by the following equation 27 :
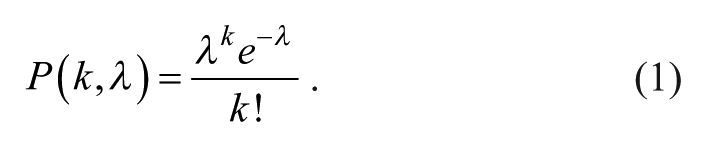
For single-particle aliquots (k = 1), equation 1 simplifies to
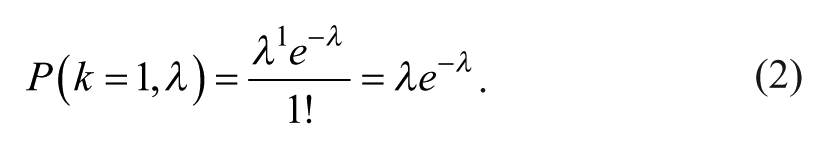
To maximize the probability of getting a single particle in a droplet, the local maximum in equation 2 must be zero:
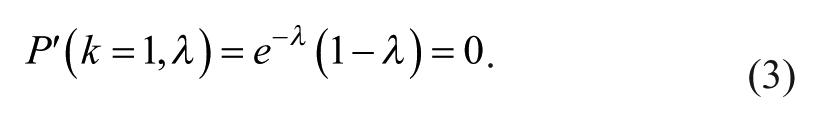
λ = 1 solves equation 3. At an optimal concentration of beads where λ = 1 and k = 1, the probability P(k = 1, λ = 1) to obtain a single bead in a droplet is calculated to be 0.368. Because λ is defined to be the ratio of particles (beads) per volume, for a droplet volume of 150 pL, the corresponding optimal concentration would be 6.7 × 10⁶ beads per milliliter.
To evaluate the actual distribution of beads in our arrays of 10 × 10, droplets were printed on glass slides, and the number of beads per droplet was subsequently counted under a microscope. Figure 3 exemplarily shows some of these experiments. Because these experiments covered a wide range of concentrations, there is only a limited number of data points per experiment. To evaluate the distribution more thoroughly, arrays with a total of 1000 droplets at 1 × 10⁷ beads per milliliter were printed with the deactivated detection algorithm. Subsequently, the detection algorithm was activated, and arrays with a total of 500 droplets with single beads only were printed. Figure 4 shows the results including the standard distribution as error bars and the Poisson distribution for 1 × 10⁷ beads per milliliter.
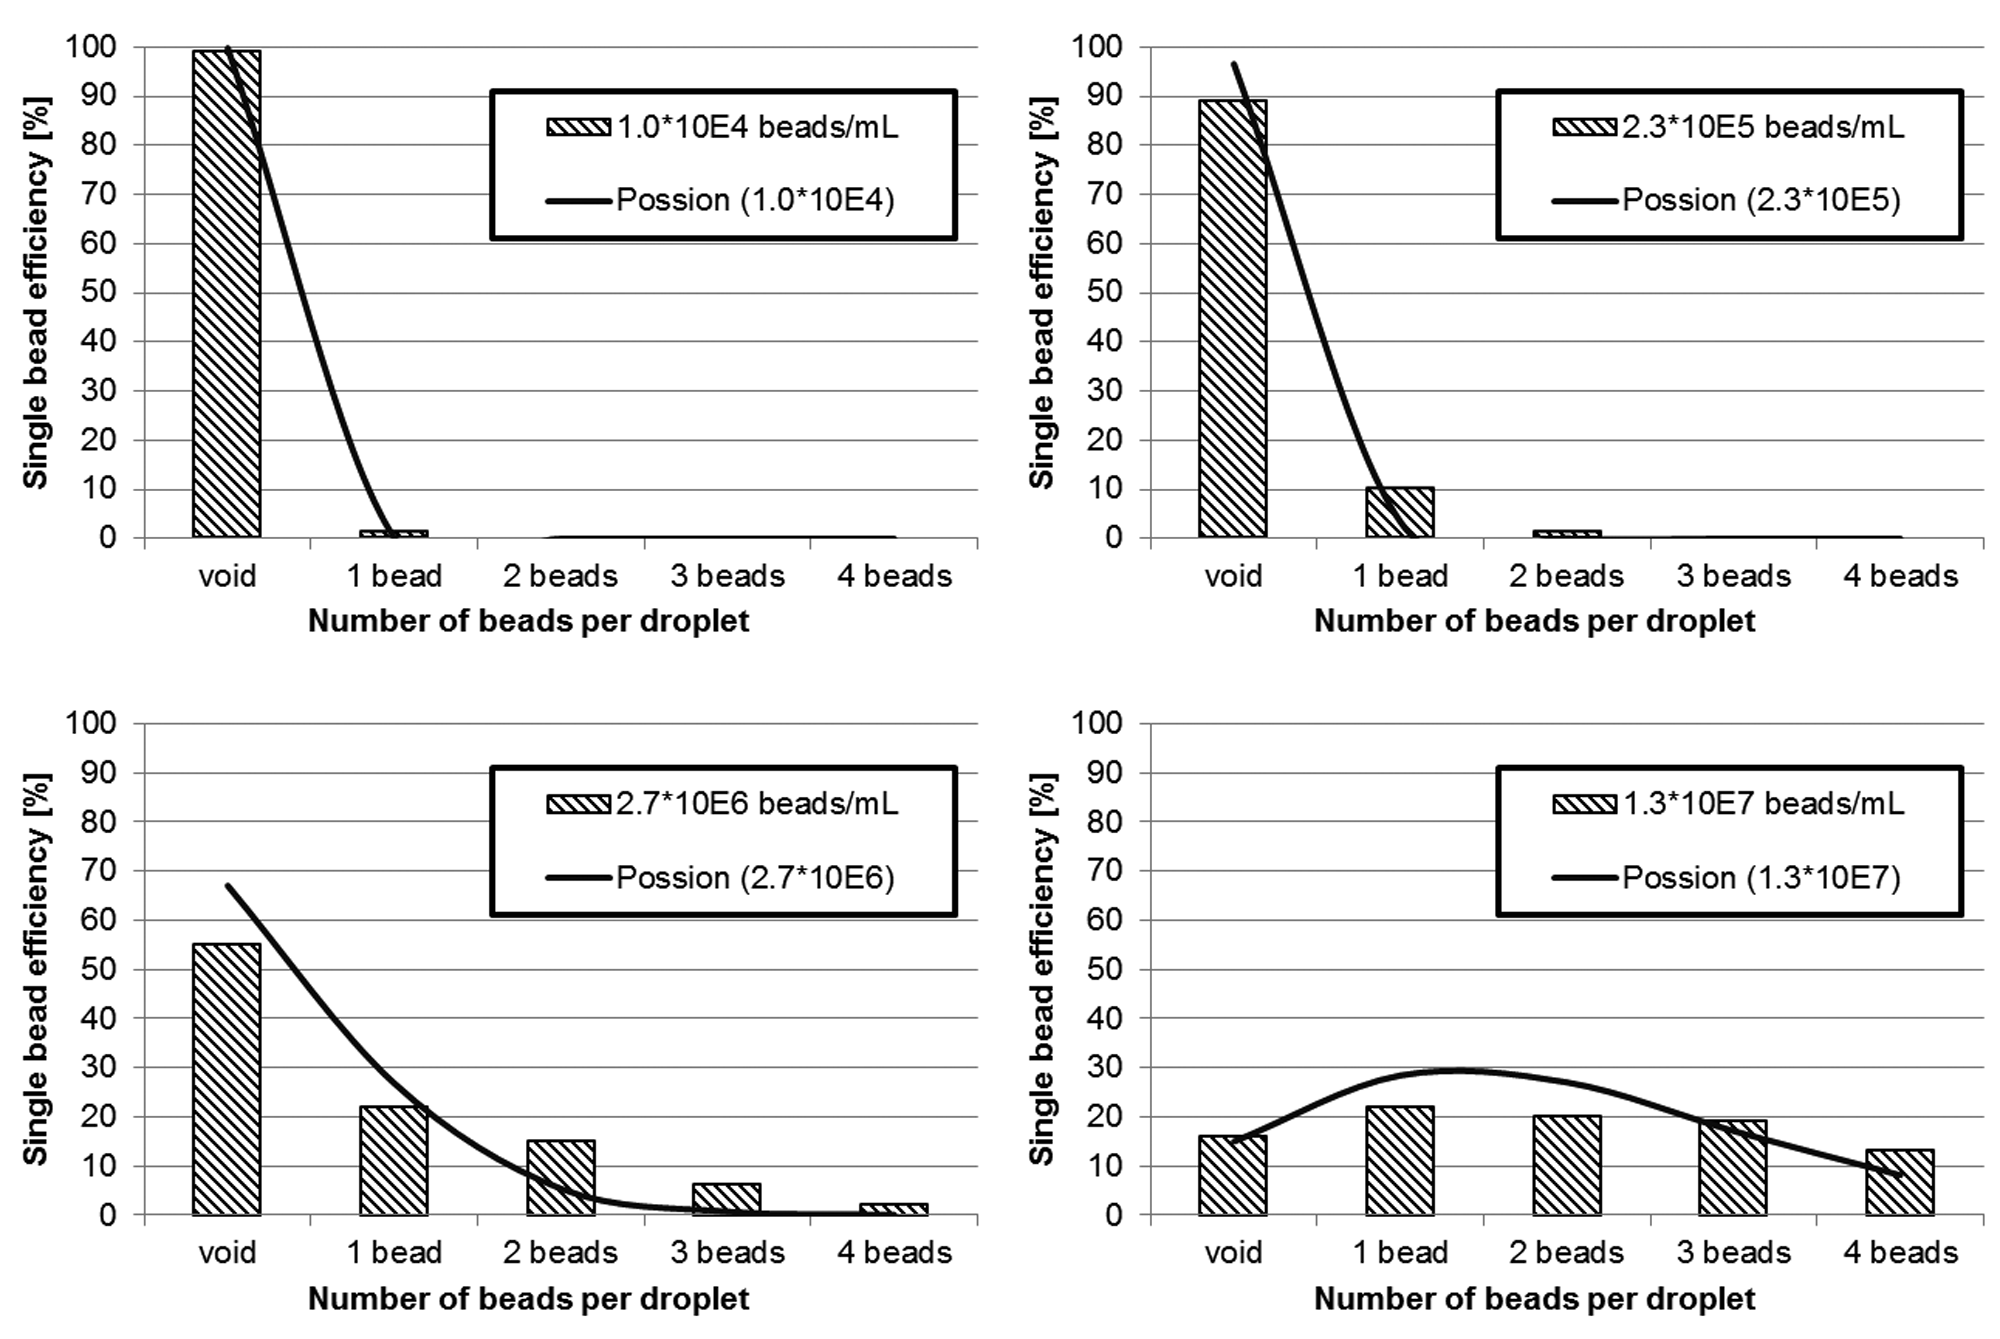
Random printing statistics for different bead concentrations gained from printed 10 × 10 arrays of 20 µm sized polystyrene microbeads (respectively, n = 100). Prior to printing, bead concentration was verified using a hemocytometer. Counting of the arrays was performed manually under a bright-field microscope at 10× magnification.
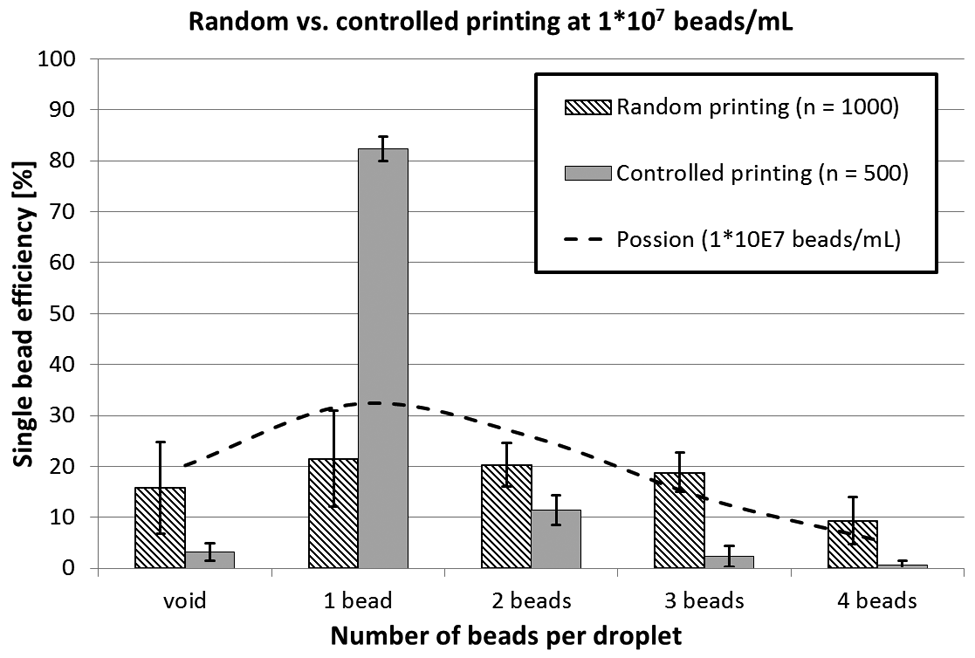
Random versus controlled single-bead printing statistics. For random printing, ten 10 × 10 arrays with a concentration of 1 × 10⁷ polystyrene beads per milliliter (diameter 20 µm) were printed with the deactivated detection algorithm (n = 1000). For controlled printing, five additional 10 × 10 arrays at the same concentration and printing parameters were printed (n = 500). Counting of the arrays was performed manually under bright-field microscope at 10× magnification. A Poisson distribution for 1 × 10⁷ beads/mL (k = 1, λ = 1.5) was plotted according to equation 1 for comparison.
Benchmark 2: Controlled Printing
To further evaluate the dependency between controlled printing efficiency and bead concentration, arrays of 500 single beads were printed onto glass slides at different concentrations. Beads per droplet were subsequently counted under a microscope. Figure 5 shows the results.
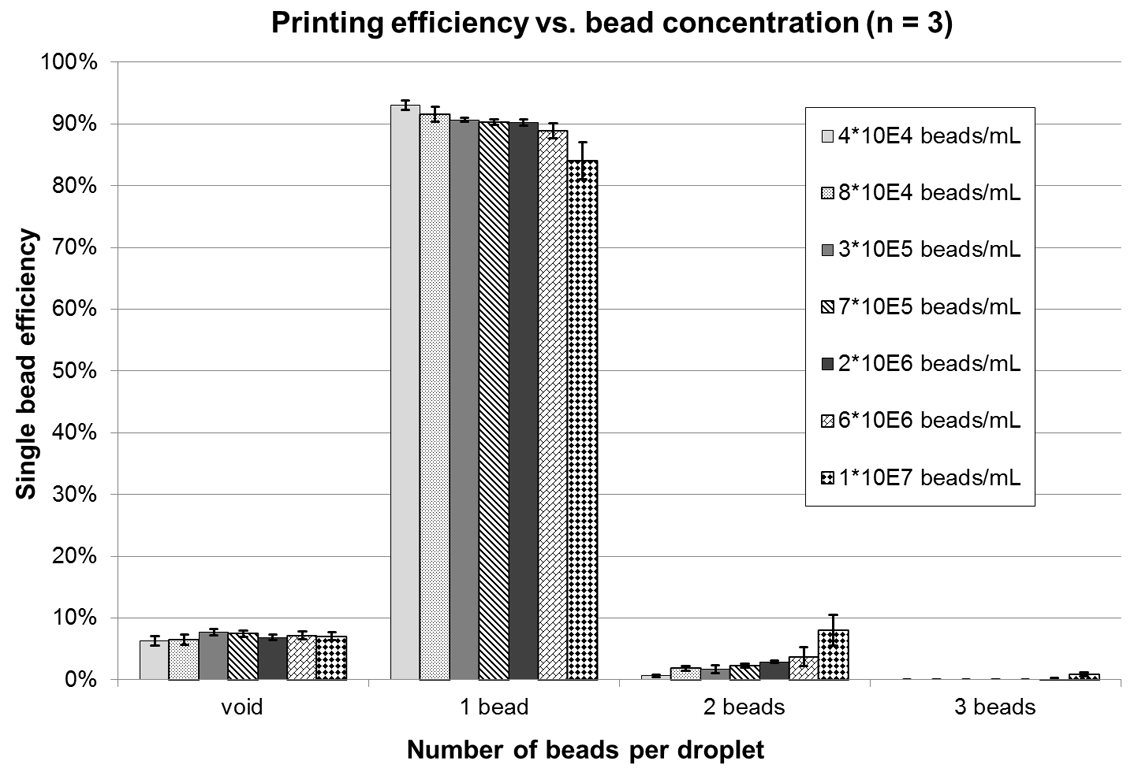
Printing efficiency versus bead concentration. For concentrations ranging from 4 × 10⁴ to 1 × 10⁷ beads per milliliter, three arrays with 500 single beads each were printed per data point (n = 3). Under microscope, the number of beads per spot was counted. Error bars show standard deviation.
Although a concentration of 6.7 × 10⁶ per milliliter was theoretically found to be optimal in terms of single-bead distribution per droplet, the probability of getting multiple beads per droplet is still 47.5%, which directly corresponds to bead loss in reality. Certainly, losing that many cells in a future cell experiment should be avoided. With reference to Figure 3 , the loss should theoretically decrease with lower concentrations. On the other hand, this should increase processing times because appearance of single beads (cells) is also less likely at lower concentrations. To verify this, lines of 20 single beads were printed onto a glass slide at different concentrations. Respectively for each run, the number of lost cells was counted online, and process time was measured. Per concentration, each experiment was repeated 10 times. Printing efficiency was not determined here. Figure 6 demonstrates the results. Ultimately, a sample concentration between 105 and 106 cells per milliliter appeared to be a reasonable compromise between cell loss and time consumption to be used for the following cell experiments.
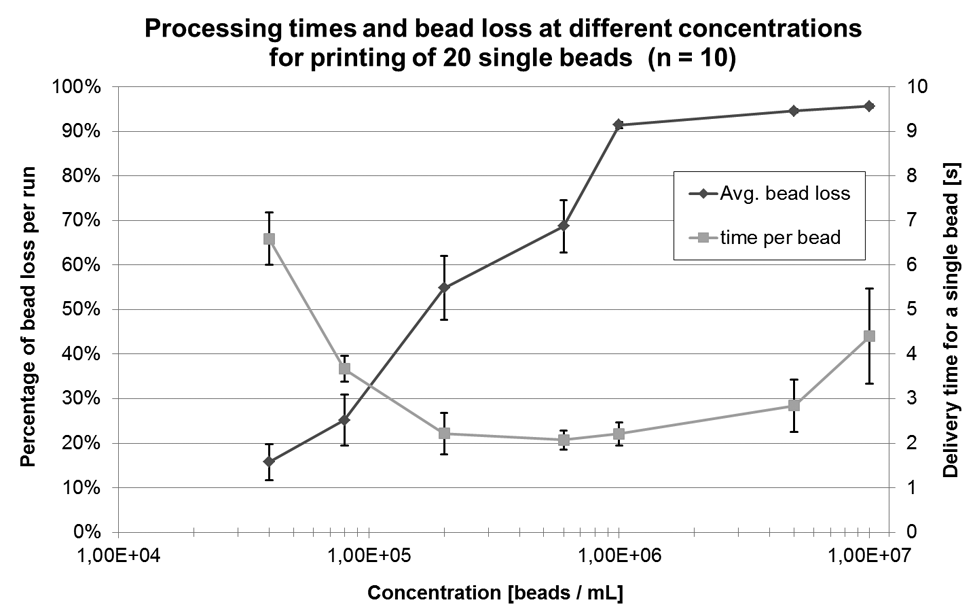
Processing times and bead loss during single-bead printing. Concentration ranges from 4 × 10⁴ to 1 × 10⁷ beads per milliliter. For each data point, 10 experiments with 20 single beads printed onto a glass slide were conducted (n = 10). Process time was measured, and total number of processed beads was counted to determine bead loss. Error bars show the standard deviation.
The dispenser chip is designed as a disposable unit but can also be reused multiple times when being cleaned between experiments. Finally, the variation in printing efficiency between different runs of a single chip (run to run) and different chips (chip to chip) is evaluated. Therefore, again, arrays of 500 single beads were printed onto glass slides. The concentration was 6.2 × 10⁵ beads per milliliter, and the sample volume loaded onto the chip was 20 µL. For the run-to-run coefficient of variation (CV), the same chip was emptied and reloaded before printing again (n = 4). Altogether, three chips were processed. A summary of the results can be found in Figure 7 .
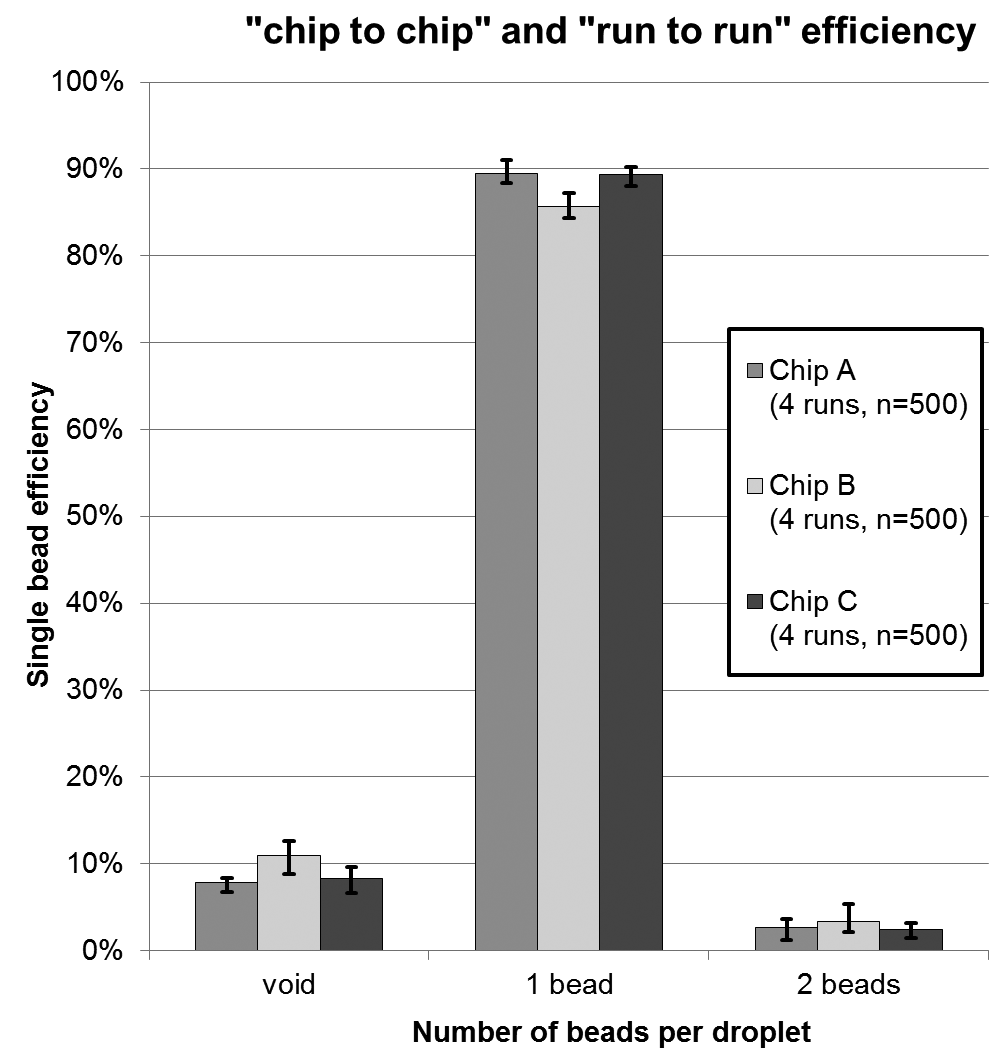
Chip-to-chip and run-to-run printing efficiency for 6.2 × 10⁵ beads per milliliter. Each chip was tested four times (run to run), and three chips were tested in total (chip to chip). Error bars represent min-max errors.
Cell Culture Maintenance
HeLa cervical cancer cells and mouse embryonic fibroblasts (NIH-3T3) are propagated in Dulbecco’s minimum essential media (DMEM) supplemented with 10% fetal bovine serum (FBS; Sigma Aldrich Co. LLC, Munich, Germany). For HeLa cells, DMEM is additionally mixed with 250 µg/mL G418 disulfate salt (Sigma Aldrich Co. LLC). Human dermal fibroblasts (H-FIBD) are propagated in fibroblast growth medium, complete (provitro GmbH, Berlin, Germany) and human keratinocytes (H-KER) in keratinocyte growth medium, advanced (provitro GmbH, Berlin, Germany). U2OS cells are stably transfected with turbo-GFP protein and cultured in DMEM with hamster nutrient (DMEM-F12) supplemented with 10% FBS and 10 µg/mL Puromycin (Sigma Aldrich Co. LLC). The culture conditions for all cells are 37 °C and 5% CO2 concentration.
Preparation of Cell-Printing Suspensions
Cells are grown in T75 cell culture flasks (Advanced TC 75 cm2 Standard Cell Culture Flask 658970; Greiner Bio-One GmbH, Germany), and upon 90% confluence, cells are rinsed twice with PBS (Life Technologies GmbH, Darmstadt, Germany) followed by detachment with Trypsin/EDTA for 4 to 6 min and neutralization with corresponding cell culture medium. After detachment, cells are spun down in centrifuge for 5 min at 1000 rpm, supernatant is taken off, and cells are diluted in 500 µL PBS. Cell concentration is assessed using a hemocytometer.
Postprinting Cell Culture Maintenance
Single cells are printed into microwell slides (µ-slide 18-well flat with ibiTreat; ibidi GmbH, Germany) preloaded with 30 µL of corresponding cell culture medium per well. After printing, the microwell slides with single cells are put on top of a socket into a Petri dish filled with 10 mL of double-distilled, sterile filtered water. Subsequently, the Petri dish is covered with a lid to prevent the microwells from drying. Cell medium is not completely exchanged during culture, because in most previous experiments, a huge loss of already adherent single cells during medium extraction was observed. Instead, every 48 h, 5 µL of fresh culture medium is added to each well to compensate for the lack of nutrients. Alternating with this, 5 µL of double-distilled, sterile filtered water is added to prevent enrichment of culture medium ingredients due to evaporation every 48 h. This protocol was found to be best suitable for single-cell maintenance in microwell slides so far.
Live/Dead Staining of Multiple Printed Cells
To evaluate the suitability of the SCP prototype instrument to print cells alive, primary experiments were performed with different cell types suspended in PBS according to the predescribed procedure. The objective here was to determine if cells are somehow negatively influenced or in the worst case damaged by the printing process itself. To establish a quick and handy procedure to test the compatibility of cell types with the system before actually entering single-cell experiments, it was decided to use commercial live/dead staining kits. The idea behind this was not a quantitative analysis of cell viability but to get an indication as to whether certain cells will survive the printing process with acceptable amounts.
HeLa, H-FIBD, H-KER, and NIH-3T3 cells were chosen to cover a preferably wide range of different cell types. The cells have been printed and inspected for postprinting viability by fluorescent staining with a live/dead staining kit (Calcein AM/ethidium-homodimer-3, Live/Dead Cell Staining Kit II; PromoCell GmbH, Germany). Within the experiments, each cell type was randomly printed separately in a 96-well plate (NUNC 96-Well Edge Plate Cell Culture treated; Thermo Fisher Scientific Inc., Waltham, MA). Plates were preloaded with 100 µL of corresponding cell culture medium per well, and 1000 droplets with ~106 cells/mL were randomly printed into each well, resulting in cell numbers of about 100 cells per well on average. In addition, three hand-pipetted positive (1 µL at ~106 cells/mL) and negative controls (blank medium) were added to each plate, respectively. Cells were stored under culture conditions for 4 h after printing because adhesion was mandatory due to washing steps required for the protocol. Cells were subsequently stained according to the vendor’s protocol. After staining, the wells were imaged using a fluorescence microscope with 38HE filter (Ex. 470/40 nm, Em. 525/50 nm) for Calcein AM and 43HE filter (Ex. 525/50 nm, Em. 605/70 nm) for ethidium-homodimer-3. All experiments were repeated three times under identical conditions. Exemplary results are shown in Figure 8 .
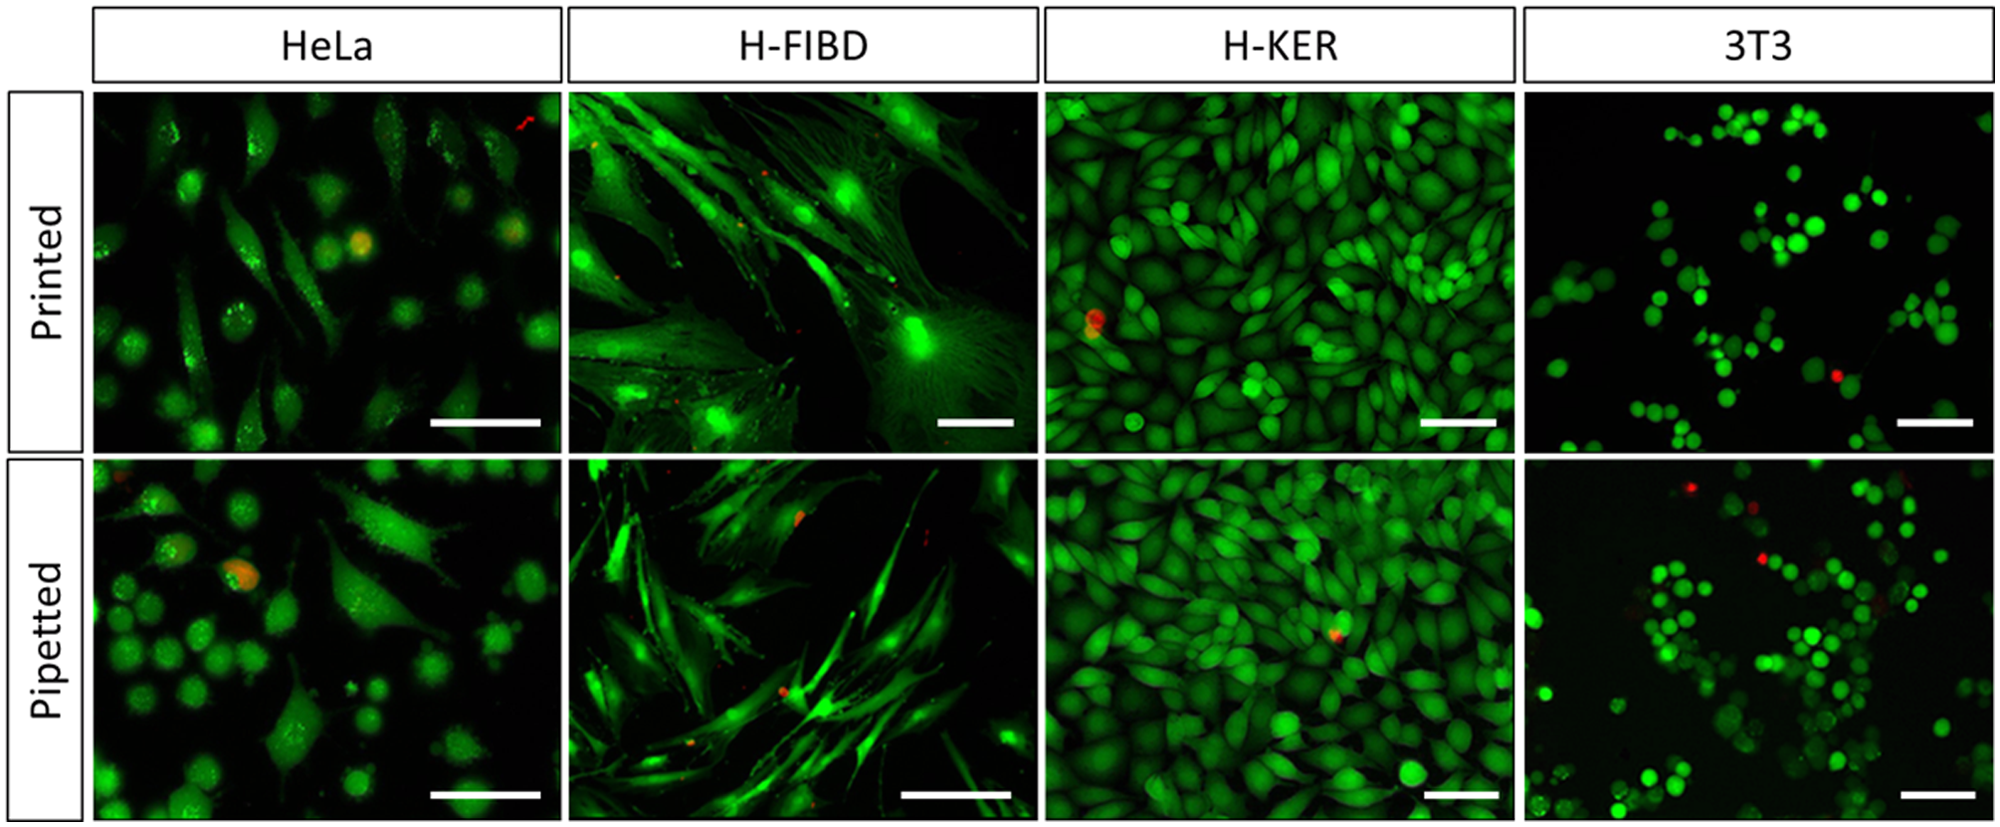
Microscope images from cell lines being processed with live/dead staining kit. Representative for each cell line, a printed and a pipetted control is shown. Scale bars in all images are 50 µm. As “life” indicator, Calcein AM is marking cell cytoplasm in green, as “dead” indicator, ethidium homodimer 3 is staining cell nucleus in red.
Printing of Single Cells: Efficiency and Viability
Having successfully demonstrated the prototype instrument’s general capability to process cells alive, the performance on the single-cell level was thoroughly evaluated with HeLa and H-FIBD cells in subsequent experiments. The primary focus of these experiments was to determine the printing efficiency of single cells, which is defined as the number of successfully printed single cells in relation to the number of droplets printed in total. The second priority is on the viability rates of printed single cells. With regard to the facts, that live/dead staining provides only a “snapshot” view on a cell’s life state and staining of single cells is a rather complicated issue, due to frequent loss of cells during the washing steps, viability in this section is determined in terms of successful adhesion and verified proliferation under culture conditions.
HeLa and H-FIBD cells were suspended in PBS at concentrations between 105 and 106 cells per milliliter. The dispensing chip was loaded with 20 µL of cell suspension and mounted on the instrument. Droplet quality was checked, and printing parameters were adjusted using the stroboscopic camera system to ensure constant droplet volume of 150 pL. Cells were then printed individually into microwell slides (µ-slide 18-well flat with ibiTreat, ibidi GmbH, Germany) and cultured afterward along the described procedures. Postprinting cell culture (37 °C, 5% CO2) was monitored for 7 days. Every day, images of each well were taken, and the viability state of the (single) cells were documented. For HeLa cells, eight slides (18 single cells each) were filled in three independent experiments summing up to 144 single-cell wells in total. For H-FIBD cells, seven slides were filled in two independent experiments with a sum of 126 single-cell wells.
Further, to evaluate the instrument’s performance in terms of overall time consumption and operation times for standard single-cell applications, a commercially available, stable transfected turboGFP human osteosarcoma U2OS cell line (LINTERNA U2OS, P20116, Innoprot, Derio, Spain) was also printed into ibidi microwell slides. Eight slides were filled subsequently with a total of 144 single-cell wells, printing with a concentration of 1.7 × 10⁵ cells per milliliter. Postprinting control and observation were performed with a fluorescence microscope. Figure 9 exemplarily shows microscope images of single U2OS cells directly after being printed into a microwell slide.
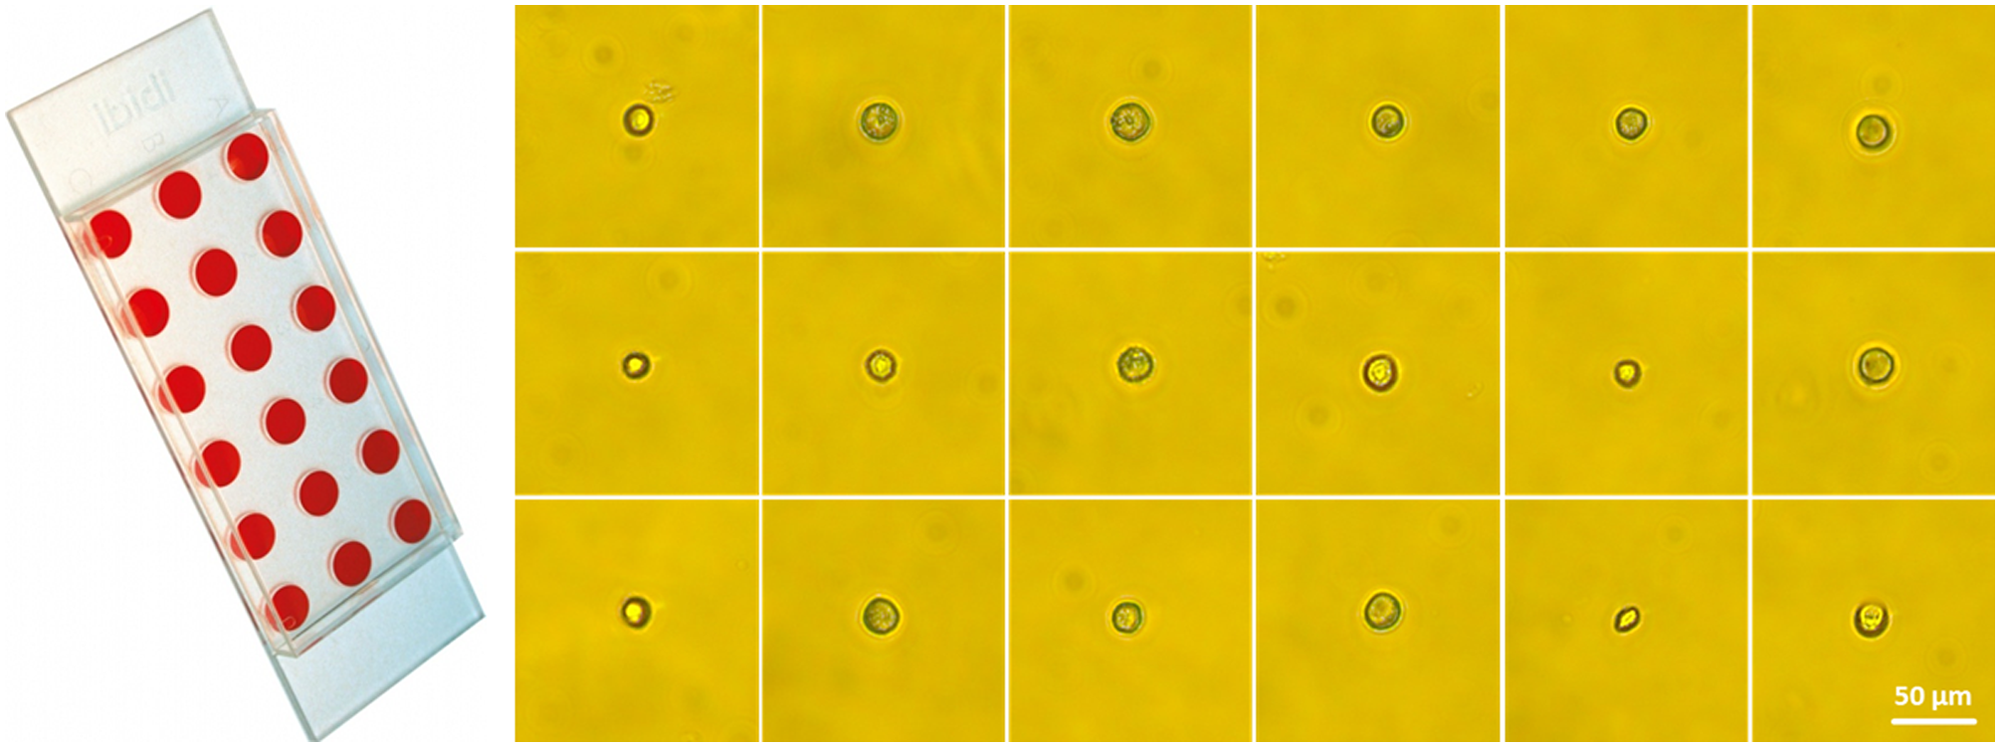
Picture of an ibidi 18-well microwell slide flat (picture by ibidi GmbH, Germany) and microscope images of single printed U2OS cells 2 h after printing in each well of the microwell slide at 10× magnification. This is representative for a typical single-cell experiment.
Results
Bead Printing
For random printing of polystyrene microbeads, a Poisson distribution was found to describe the number of beads per droplet at certain concentrations in a reasonable way. Comparing random printing with controlled single-bead printing, a significant increase in single-bead droplets could be observed. The proposed single-bead printing approach does significantly increase the yield of single beads and also reduces the variability (i.e., the CV) between the experiments. Although random printing yields in average 21.5% of droplets containing single beads (CV = 44%), controlled printing results in 80.9% of droplets containing single beads (CV = 3%; cf. Fig. 4 ).
Further, dependency between single-bead printing efficiency and sample concentration has been evaluated. According to the results shown in Figure 5 , there is only a weak dependency between concentration and efficiency up to 6 × 10⁶ beads per milliliter. At 1 × 10⁷ beads per milliliter, a stronger influence becomes evident. Here, the appearance of droplets with two or three cells is increasing, whereas the number of void droplets stays constant. Also, the CV is rising. A strong dependency between bead loss and sample concentration is given according to Figure 6 . Although for low concentrations (4 × 10⁴ beads/mL), the bead loss could be reduced to 16% (CV = 25%) on average, for higher concentrations (>1 × 10⁶ beads/mL), it is constantly greater than 90% (CV <1%). Processing times range from 6.5 s for a single bead on average (4 × 10⁴ beads/mL) to 4.5 s (1 × 10⁷ beads/mL) with a local minimum of 2 s (6 × 10⁵ beads/mL).
Finally, the characterization of different runs and different chips (cf. Fig. 7 ) revealed a maximum deviation in printing efficiency of 4% (best vs worst chip) and a general CV of 2.2% between different chips. The standard deviation between different runs with one and the same chip results in 2% on average.
Cell Printing
The general ability of the drop-on-demand technology to print cells alive and without significantly affecting their postprinting life state could be demonstrated with several cell types using a live/dead staining kit. All presented cell lines were found to show similar viability as the hand-pipetted positive controls. Figure 8 exemplarily shows microscope images from each printed cell type stained with the live/dead staining kit. For comparison, positive, hand-pipetted controls are also shown. It could be stated that both samples look identical respectively. Thus, it can be concluded that the printing process is not visibly harming cells and compromising their natural adhesion behavior within the first hours after printing compared with pipetting.
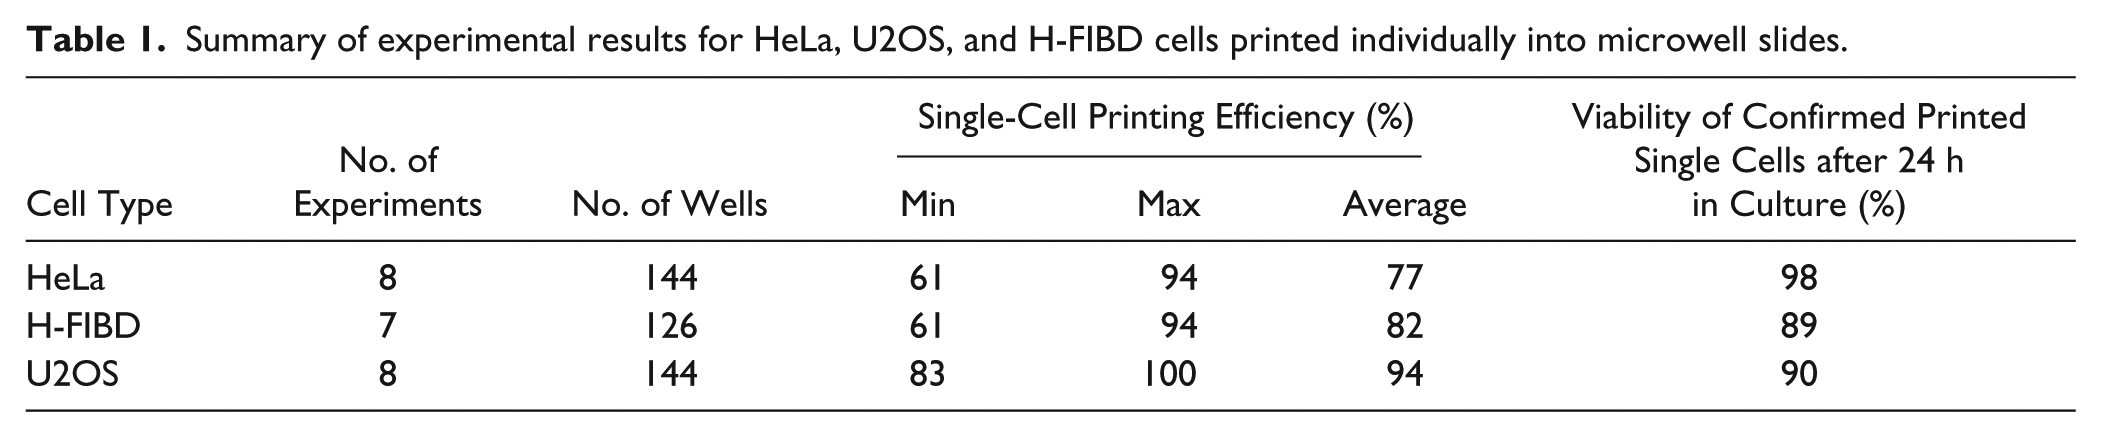
Table 1 summarizes the results of single-cell printing experiments with HeLa, H-FIBD, and U2OS cells. Between 77% and 94% of all wells actually contained single cells. Viability rates of 89% to 98% were determined by observation of successful adhesion within the first 24 h after printing.
Summary of experimental results for HeLa, U2OS, and H-FIBD cells printed individually into microwell slides.
The average proliferation rate of all single HeLa cells (cf. Fig. 10 ) approximately follows a fourth-degree polynomial curve, whereas H-FIBD cells are adherent but do not proliferate at all. Figure 11 shows the proliferation curves of 18 individual HeLa cells inside an ibidi microwell slide. Here, a wide range of duplication times of less than 24 h up to only one cell division within 7 days could be observed on the same microwell slide, indicating a significant heterogeneity of the cell culture. Figure 12 and Figure 13 exemplarily show a single HeLa cell and a single fibroblast observed for 7 days in culture. Figure 14 compares proliferation of printed and pipetted H-FIBD cells under culture condition observed for 7 days.
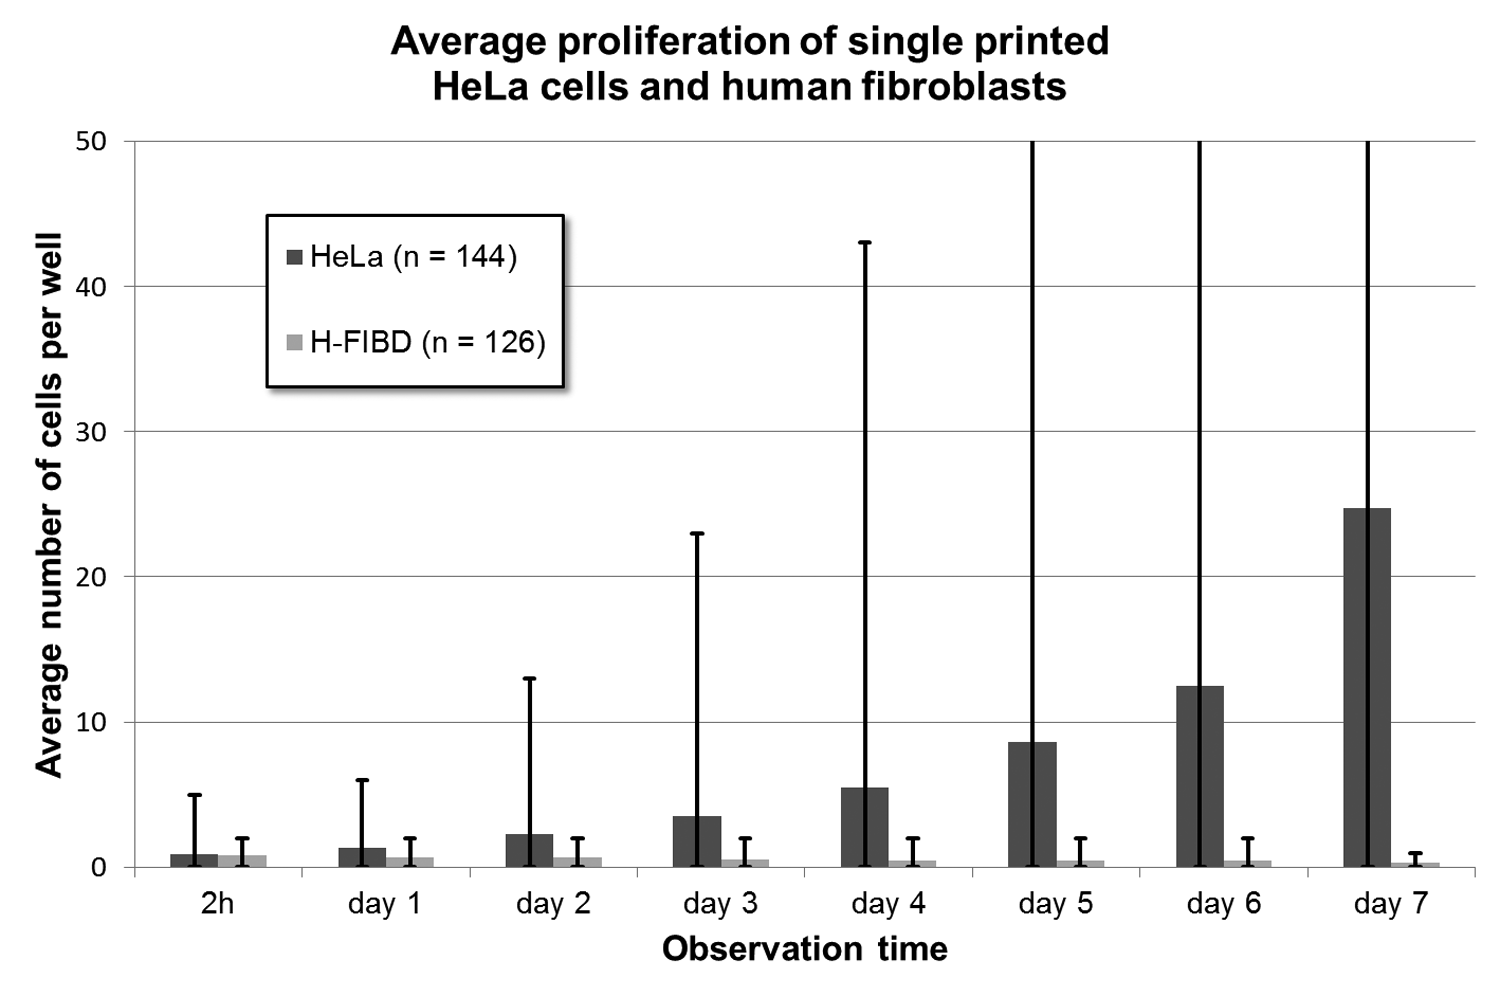
Proliferation of all single HeLa cells and single H-FIBD cells printed in microwell slides on average with standard deviation as error bars.
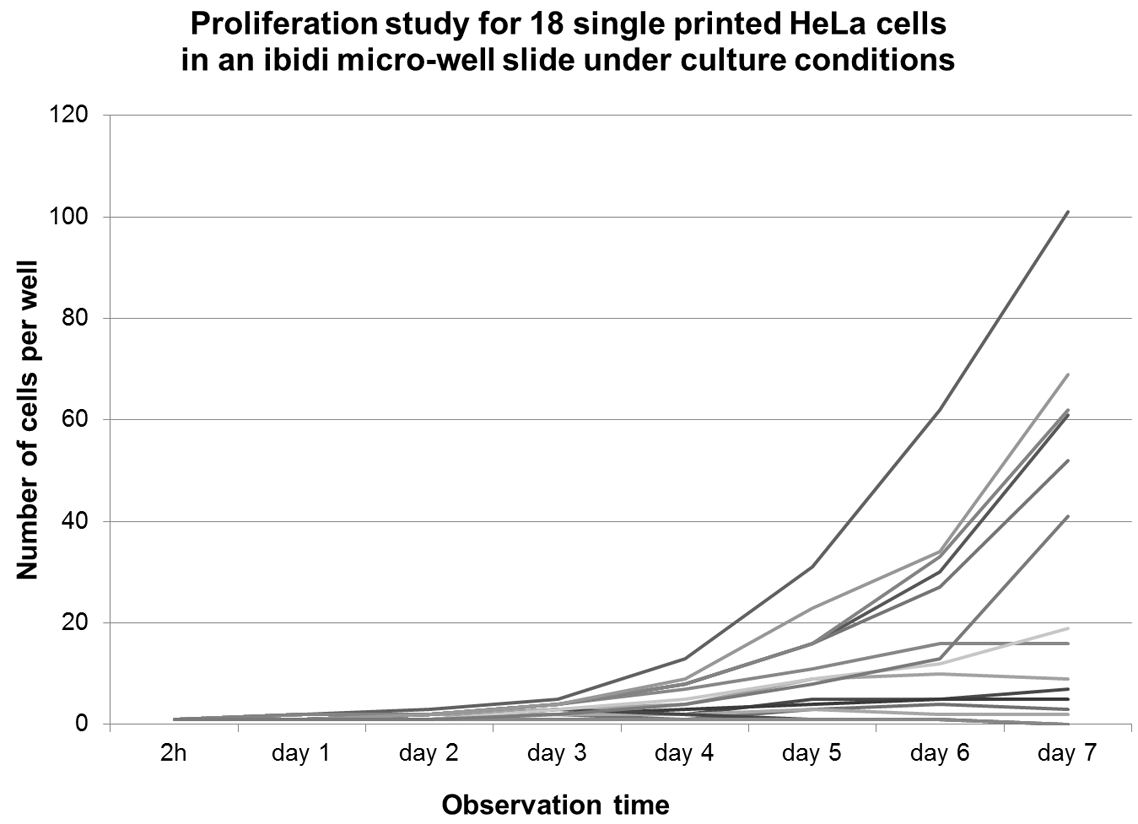
Proliferation curves of all 18 single HeLa cells from a micro-well slide over an observation period of seven days.
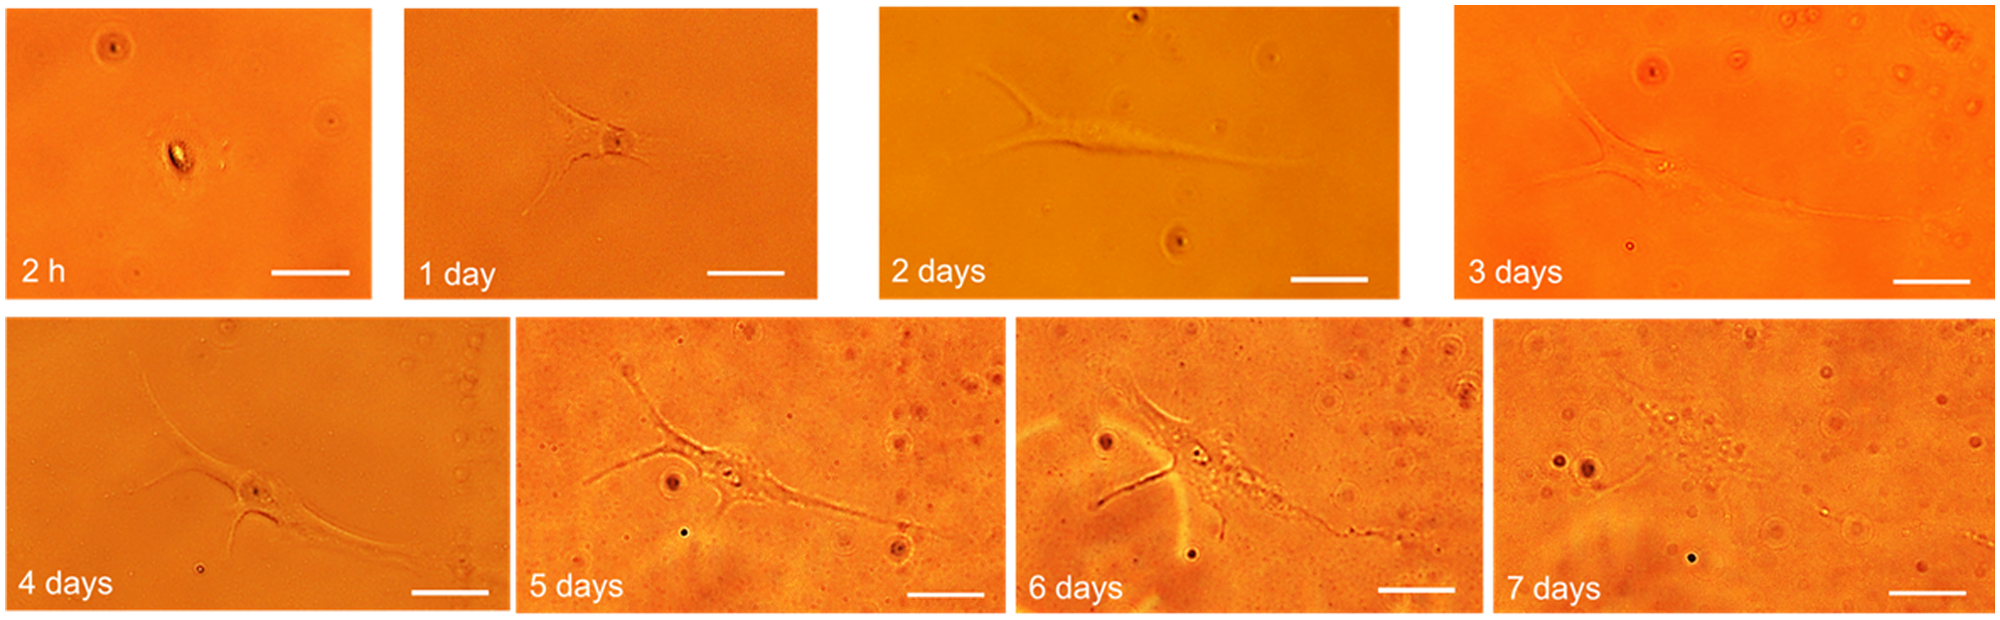
Microscope images from a single printed fibroblast (H-FIBD) observed for 7 days postprinting under culture conditions. Scale bars in all images are 20 µm. From the first image taken 2 h postprint, the cell is adherent and spreads out to the full extent on day 4. From day 5 on, a slow retraction and degeneration starts.
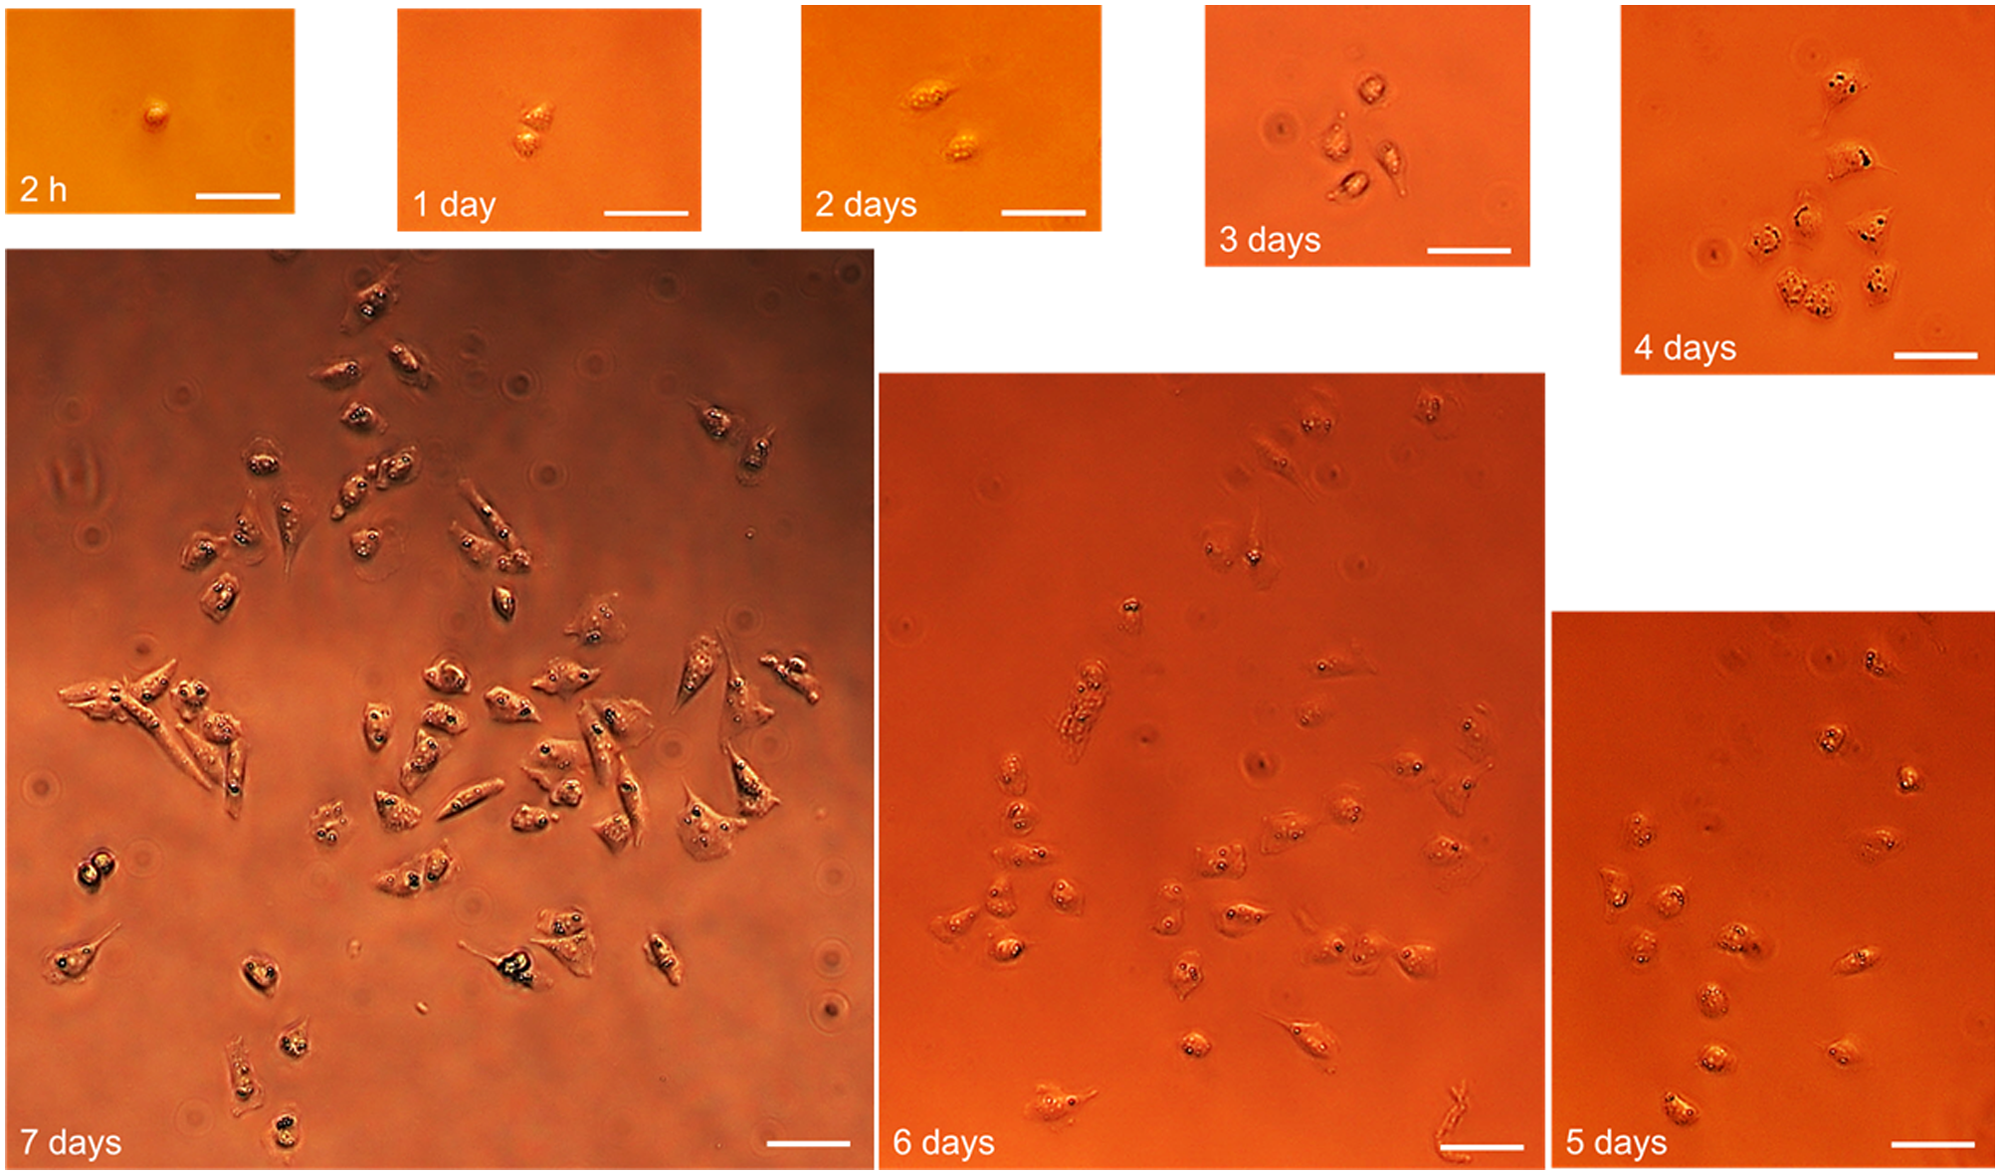
Microscope images from single printed HeLa cells observed for 7 days postprinting under culture conditions. Scale bars in all images are 50 µm. From 2 h postprint, the cell adheres and even divides within the first 24 h in culture. Until day 7, the cells have undergone six division cycles and have proliferated to 59 in total.
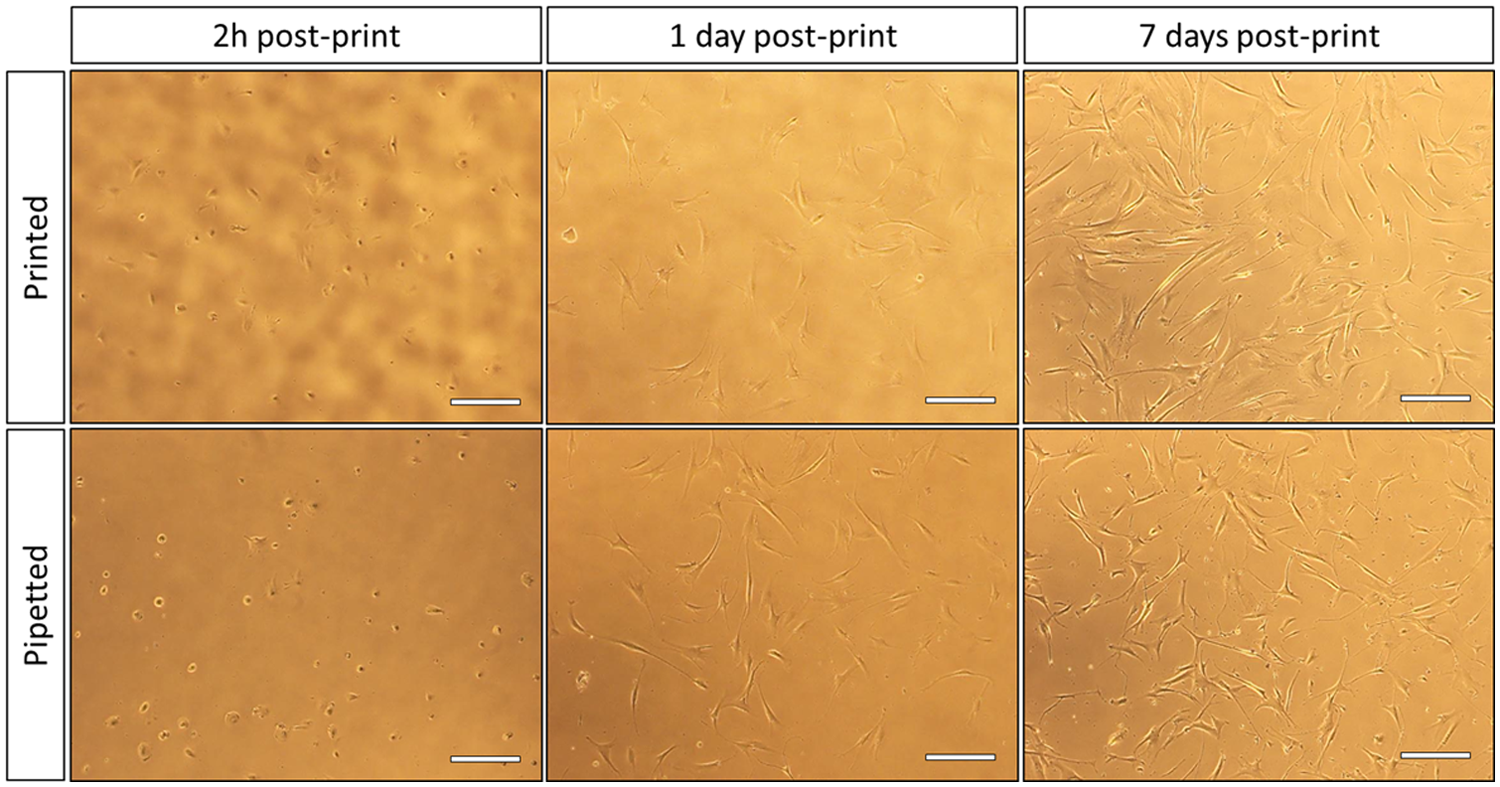
Microscope images of printed and pipetted fibroblasts (H-FIBD) observed for 7 days under culture conditions. In both cases, cell sample concentration was 1 × 10⁶ cells per milliliter. Printing control: 6500 droplets (at 150 pL per droplet) printed randomly. Pipetted control: 1 µL. Scale bars in all images are 100 µm.
Instrument Performance
To determine the instrument’s performance alongside the U2OS cell experiments, the time consumed for process steps was measured individually. Printing in total 144 single cells into eight microwell slides took 45 min, including setup time, cleaning, and slide medium preparation. Each slide was processed by the instrument for 3 min on average; thus, approximately every 10 s, a single cell was printed. The printing yield was determined to be 83% to 100%, with an average of 94%. After 24 h of incubation, 90% of all single cells were still adherent and showed fluorescent signals under the microscope (cf. Table 1 ; Fig. 9 ).
Discussion
In this work, a piezoelectric drop-on-demand system featuring a transparent dispenser chip, a high-magnifying camera system, a high-speed pneumatic shutter, and a three-axes robot stage was set up for controlled printing of single living cells onto various substrates.
The system was evaluated with cell-sized microbeads, which proved to be a good equivalent for cells in terms of technical characterization. The statistical appearance of single beads per droplet (random printing) follows Poisson’s law in a reasonable way. Controlled printing efficiency, other than random printing, can be considered independent from sample concentration within a wide range (cf. Fig. 5 ). Processing speed has an optimum range between 2 × 10⁵ and 2 × 10⁶ beads per milliliter, where on average, a single bead was printed every 2 s. Bead loss could be decreased to 16% at bead concentrations of 4 × 10⁴ per milliliter (cf. Fig. 6 ). It could be estimated that at lower concentrations, the loss can further be decreased but at the expense of process time. The small deviations between different runs and different chips demonstrate high stability and reproducibility on the part of technology. Suitable working concentrations for experiments have been found to be between 105 and 106 beads per milliliter. Poisson distribution, range of droplet volumes, and working concentrations match well with findings in the literature (cf. Table 2 ), where researchers randomly printed cells with inkjet systems.
Summary of cell-printing technologies and their performance in the literature. a
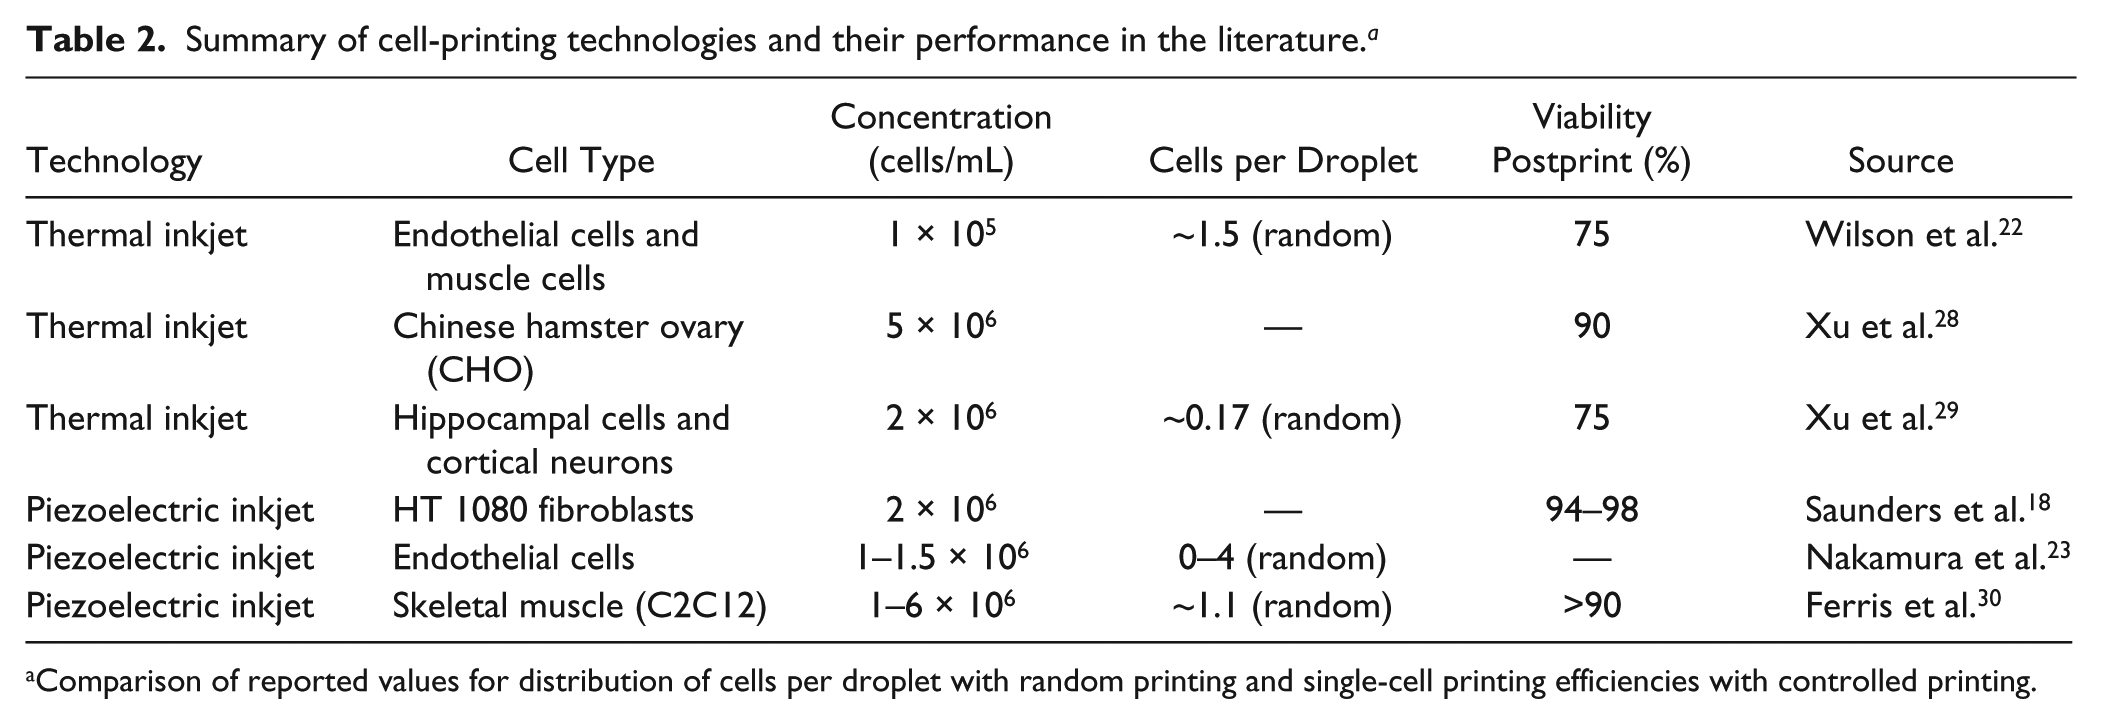
Comparison of reported values for distribution of cells per droplet with random printing and single-cell printing efficiencies with controlled printing.
Beyond this, it was shown that certain cell lines (HeLa, H-FIBD, H-KER, NIH-3T3) could be successfully randomly printed into standard microwell plates without veritably affecting their life state. Successful deposition of single living HeLa, H-FIBD, and U2OS cells into microwell slides could be demonstrated. Postprinting viability was tested by microscopic observation where either successful adherence or proliferation of cells was monitored (cf.
Figs. 12
By comparing the individual growth rates of single HeLa cells to the average total growth rate of all printed HeLa cells, the decisive difference between an individual cell and a cell population could be identified (cf.
Figs. 10
H-FIBD cells in larger numbers (>100 cells) show growth rates similar to HeLa cells, but on the single-cell level, isolated in wells, H-FIBD do not proliferate at all, although they are viable and adherent for several days. In postprinting culture, they adhered and demonstrated morphological changes, mostly a clear tendency to flatten and widely spread out, and building multiple large dendritic extensions (cf. Fig. 12 ). Typically after being adherent in such shape for 4 to 6 days in culture, single H-FIBD start to retract and either form rounder shapes again or even degenerate directly. More than 80% died between day 7 and day 14.
H-FIBD cells being printed in large numbers in further experiments (cf. Fig. 14 ) showed no significant difference compared with hand-pipetted positive controls, and because proliferation was also observed, it is not very likely that the printing process itself is responsible for nonproliferation at the single-cell level. Rather, there are biological or environmental factors that may affect single cells, whereas multiple cells are able to compensate for them.
According to the literature, there is considerable evidence that it is very demanding to grow colonies derived from single isolated fibroblasts. Korn et al., 31 Whiteside et al., 32 and Falanga and Kirsner 33 reported on their attempts to stimulate proliferation of single fibroblasts. According to Frisch and Francis, 34 a special form of programmed cell death—so called Anoikis—could generally be an influencing factor on the proliferation behavior of single, isolated cells. Puck et al. 35 reported on an initial lag in proliferation rates of single HeLa cells before actually forming colonies. Altogether, similar behavior was also observed with printed single HeLa and H-FIBD cells in this work. Most single HeLa cells divide the first time during days 1 and 3 and afterward tend to divide once a day. Growing colonies from single fibroblasts could not be demonstrated while cells proliferate regularly at larger numbers.
To further investigate the striking variation in proliferation rates, HeLa and H-FIBD cells were printed in multiples of 5, 10, and 15 (H-FIBD only) into ibidi microwell slides under the same conditions as previously mentioned. Figure 15 illustrates the proliferation behavior observed over 5 days under culture conditions. HeLa cells tend to grow faster when being in the presence of neighbors. In contrast to this, multiple H-FIBD cells demonstrate no dependency between proliferation and starting cell numbers. Cells do not proliferate at all. However, the number of multiple H-FIBD printing experiments is very low and thus might not be very representative. Especially in the experiments with 10 and 15 cells per well, only a single slide was printed respectively. Pipetted controls with low concentration (114 wells, 1–24 cells per well, average 9 cells per well) showed similar behavior.
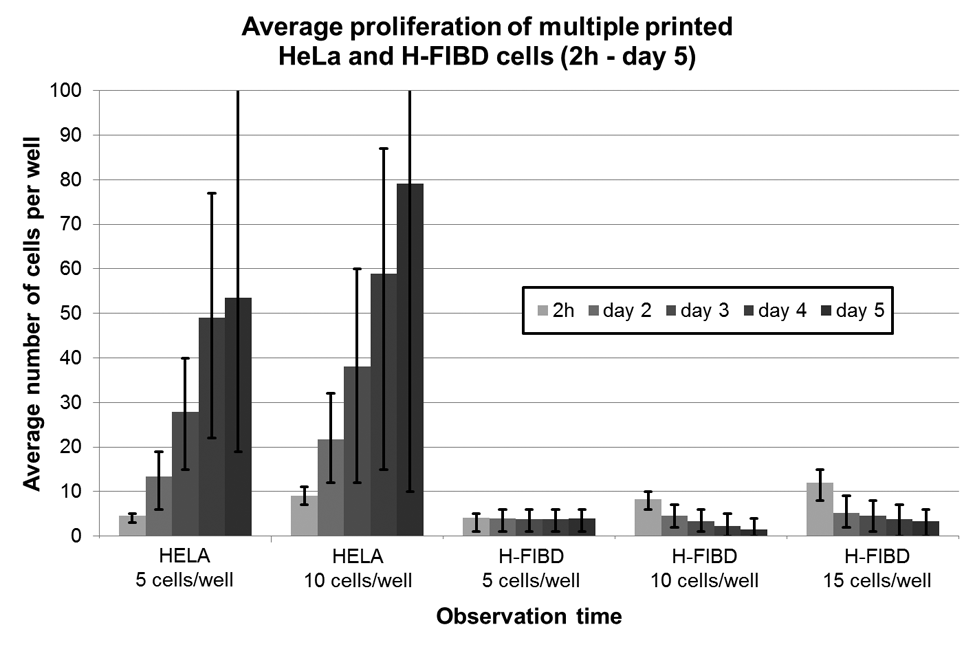
Comparison of postprinting viability rates of printed single and multiple HeLa and H-FIBD cells with standard deviation as error bars.
A final explanation for the observed results cannot be given at present or within the framework of this article. Nevertheless, there are tendencies indicating that proliferation depends both on cell number/density and present cell media volume in a well. Thus, further printing tests to evaluate different substrates, influence of cell medium volume, and larger number of cells per well (20–100) are currently in progress.
Conclusion
With regard to single-cell applications, requiring a certain minimum performance concerning speed and efficiency of deposited cells, the presented instrument seeks to provide a tradeoff solution supplying single cells label-free with a reasonable efficiency within an acceptable time frame. The SCP instrument provides a highly automated general method for single-cell separation and deposition from a cell suspension by digital noncontact, drop-on-demand printing.
Cells were processed without special upfront treatment (e.g., fluorescent labeling) suspended in their respective culture medium. Typical sample volumes had been 20 µL per experiment, although the system actually requires a minimum volume of 5 µL. A dead volume of only 1 µL allows for processing almost the complete sample and also helps to reduce cell loss, as compared with conventional flow cytometry methods (e.g., FACS), which typically operate with >300 µL samples and >50 µL dead volume. Compared with noncommercial methods, the highly efficient and reproducible nature of controlled single-cell printing and its independence from sample concentration are its most beneficial key features.
With the SCP instrument, a flexible, highly automated, and easy-to-use device becomes available to prepare cells for downstream single-cell analysis. Its performance range covers a large variety of cell types, cell media, cell concentrations, and especially low volumes. Virtually any substrate can be processed, and the SCP can be adapted to the specific needs of end-user applications, be that a high-throughput, a rare cell, or any other.
Outlook
Research on cancer and human primary cell lines is the subject of the PASCA project; thus, this article focused on cell lines used in this project. Cancer cells such as HeLa and U2OS as well as H-FIBD cells are known to be quite robust, which make them useful candidates for a first system characterization. In the future, it will certainly be of interest to evaluate the system with more sensitive cell types, such as epithelial or neural cells. Special attention should be paid to cell types that are of great interest in research or diagnostics and that can nowadays not or with only very limited efficiency be individualized by state-of-the-art technology (e.g., neural cells or circulating tumor cells).
Footnotes
Acknowledgements
We appreciate the contribution and valuable suggestions of all PASCA consortium members regarding specification, development, intense testing, and evaluation of the prototype system. We also thank Serhiy Melnykovskyy, who performed the live/dead staining tests. Financial support was provided from the European Commission within the seventh framework program under grant agreement No. GA 257073, which is gratefully acknowledged.
Declaration of Conflicting Interests
The authors declared no potential conflicts of interest with respect to the research, authorship, and/or publication of this article.
Funding
The authors disclosed receipt of the following financial support for the research, authorship, and/or publication of this article: Financial support was provided from the European Commission within the seventh framework program under grant agreement No. GA 257073, which is gratefully acknowledged.