
Abstract
The primary goal of bioprocess cell line development is to obtain high product yields from robustly growing and well-defined clonal cell lines in timelines measured in weeks rather than months. Likewise, high-throughput screening of B cells and hybridomas is required for most cell line engineering workflows. A substantial bottleneck in these processes is detecting and isolating rare clonal cells with the required characteristics. Traditionally, this was achieved by the resource-intensive method of limiting dilution cloning, and more recently aided by semiautomated technologies such as cell sorting (e.g., fluorescence-activated cell sorting) and colony picking. In this paper we report on our novel Cyto-Mine Single Cell Analysis and Monoclonality Assurance System, which overcomes the limitations of current technologies by screening hundreds of thousands of individual cells for secreted target proteins, and then isolating and dispensing the highest producers into microtiter plate wells (MTP). The Cyto-Mine system performs this workflow using a fully integrated, microfluidic Cyto-Cartridge. Critically, all reagents and Cyto-Cartridges used are animal component-free (ACF) and sterile, thus allowing fast, robust, and safe isolation of desired cells.
Keywords
Introduction
Antibody-derived biologics have become a major class of modern medicine, particularly in the fight against cancer and autoimmune diseases.1,2 Efficient antibody discovery and cell line development pipelines 3 are crucial for the successful translation of antibodies into therapies. Several main challenges in antibody discovery and cell line development include the ability to screen large cell populations for productivity, 4 antigen specificity,5,6 or other parameters, and then isolate rare cells with ensured clonality.7–9
In cell line development, the main challenge is to screen large cell populations for their productivity. 4 After the antibody sequence has been defined, a pool of cells is transfected and, after selection, the clones with the higher titer and better yield must be selected and isolated. Historically, this was achieved by the resource-intensive method of limiting dilution cloning (LDC) and, more recently, was aided by semiautomated technologies such as fluorescence-activated cell sorting,7,8 colony picking, 10 and cell-in-well imagers, 11 but these offer only partial solutions for automated workflows. High-throughput cell-sorting methods cannot readily measure the specific productivity of secreted protein over time, and current secreted protein screening methods (e.g., ClonePix) are limited in their ability to handle large numbers of cells.
Due to its nature, LDC will generate a high number of empty wells over the occupied ones; moreover, the possibility of ghost wells (i.e., when a colony arises from a well where no cell has been detected upon plate imaging at day 0) needs to be considered. As a result, biologics developed using LDC often require an extremely high number of seeded plates and more than one cloning round to reach the required probability of monoclonality.
The transfection pool generated contains a high number of clones that need to be expanded and screened; the conventional approach consists of a two-round screening, where mini-pools (consisting of a few thousand cells) are generated from the initial transfection pool and then expanded and screened individually for stability and titer. The chosen mini-pools are then seeded using LCD, cell sorting, or colony pickers, and hundreds to thousands of clones are in turn expanded, screened, and banked. As a result, this intricate workflow usually requires several months and a considerable amount of manual intervention at each stage, creating substantial bottlenecks and a high cost.
The antibody discovery approach usually lies upstream to cell line development, whereby antibody-secreting B cells from immunized animals are isolated and consequentially sequenced to obtain specific sequences of antibodies against the antigen of interest. Here the main challenge is to identify and isolate these cells in a specific manner, as they represent a very rare subpopulation of secreting cells. Given that downstream processing of such a sample is very laborious and costly, the specificity of the signal and ability to screen through a large cell population are crucial.
Alternatively, antibody-secreting clonal cells can also be obtained using the powerful hybridoma technology, whereby primary B cells from immunized animals are fused with an immortalized B-cell line to produce antibody-secreting cells capable of indefinite growth in cell culture. The identification and isolation of such a clonal cell postfusion requires multiple rounds of screening and is usually done with methods also used in the cell line development workflow (such as LDC, cell sorting, and colony pickers).
Picodroplet technology applied to single-cell analysis is a unique approach that can address many of these bottlenecks while decreasing timelines, and delivering at the same time high single-cell screening throughputs, rapid yet gentle cell processing, and high-sensitivity quantitative assays.12–16 The picodroplet format allows accurate manipulation of millions of picoliter-volume reservoirs, in which cells can undergo measurements individually. These picodroplets allow for the encapsulation and maintenance of the viability of single cells, 13 and the capture and detection of accumulated secreted proteins from these individual cells. Novel assays enable the quantification of secretion levels and subsequent sorting of “positive hits” for the dispensing of target cells into microtiter plates (MTPs). This is all accomplished in an automated manner by combining a fully integrated microfluidic Cyto-Cartridge with a suitable software and hardware control system.
In this paper we report on the Cyto-Mine Single Cell Analysis and Monoclonality Assurance System. This is the first integrated device with the potential to automatically perform the entire biopharma discovery workflow and a large portion of the cell line development workflow in a single compact system. This high-throughput instrument uses picodroplet technology and microfluidics to automatically process up to 2 million picodroplets in a few hours and allow for the screening of hundreds of thousands of individual cells, or up to ~40 million cells in pools. By allowing a semiquantitative titer measurement prior to dispensing, Cyto-Mine enables single-cell dispensing based on levels of actual secreted molecules. This approach can provide a direct titer measurement for hundreds of thousands of individual cells directly from a transfection pool, thus bypassing the need for a mini-pool stage in the cell line development workflow. In addition, the instrument provides an additional proof of monoclonality by taking five images just prior to dispensing, thus increasing the monoclonality assurance of the workflow and eliminating the need for multiple LDC rounds.
With regards to the antibody discovery workflow, Cyto-Mine is capable of screening millions of cells for antigen specificity and identifying and isolating the very rare (sometimes only few hundred) B cells secreting the antibody of interest. As the assay used by Cyto-Mine is diverse yet highly specific, it can be used to identify unique secretors against a broad range of antigens.
The Cyto-Mine workflow integrates the encapsulation, screening, sorting, isolation, and verification of high-secreting clones in a fully automated process. The workflow is shown in Figure 1 , which outlines the main steps.
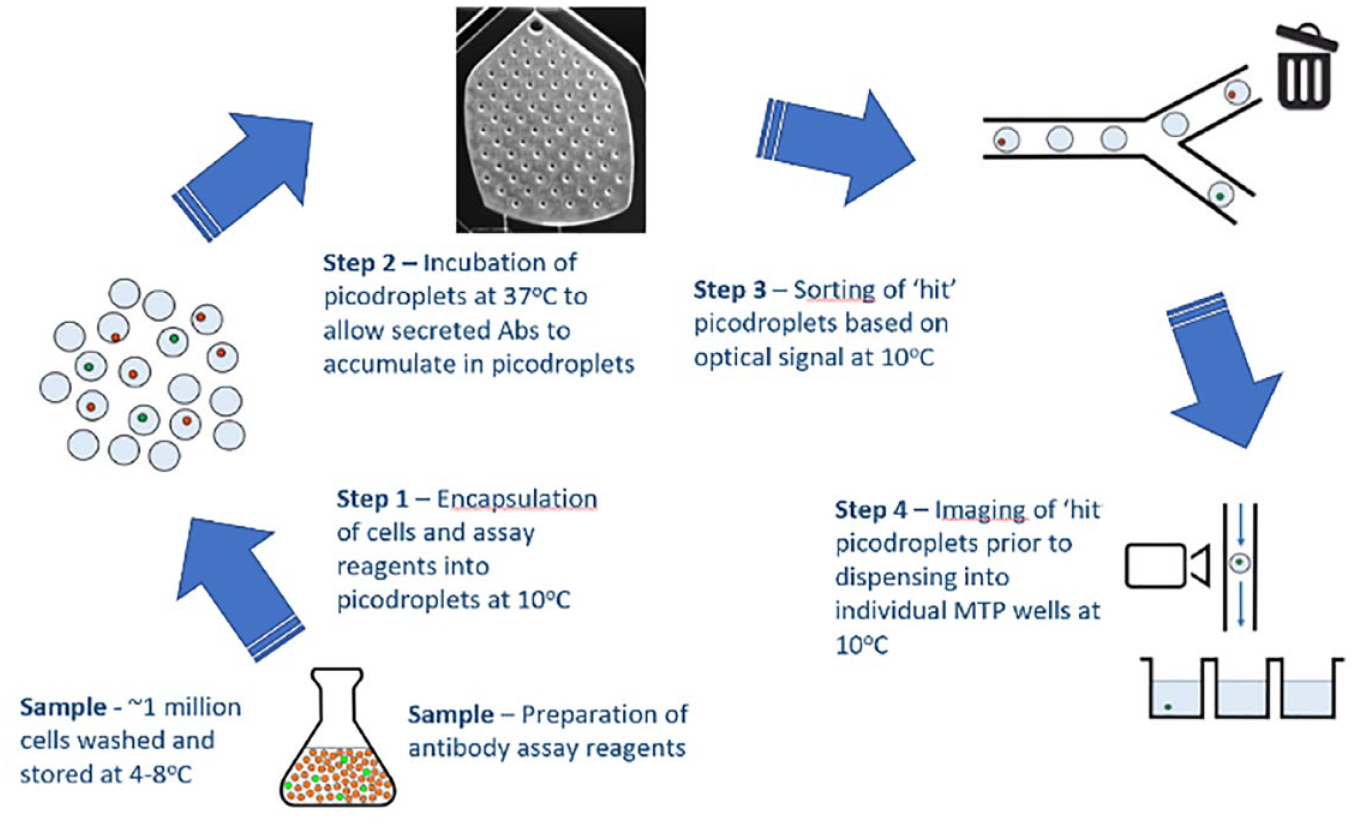
The Cyto-Mine workflow integrates the encapsulation, screening, sorting, isolation, and verification of high-secreting clones in a fully automated process. Apart from during incubation (37 °C), the entire workflow is carried out at ~10 °C to ensure that the cells do not divide and are not actively secreting during the various steps in the process.
Cells and assay reagents are prepared and loaded onto the Cyto-Cartridge, which is then loaded into the Cyto-Mine instrument. Once loaded onto the instrument, the workflow is composed of four main steps that run sequentially:
Cell encapsulation into picodroplets: The cell sample is prepared in the preferred culture medium, together with the animal component-free (ACF) assay reagents. The cell suspension is then gently pumped through the microfluidic channels and mixed with a biocompatible surfactant, which encapsulates single cells (or pools of cells) in 450 pL picodroplets of culture medium.
Incubation and measurement of secreted protein: Approximately 2 million generated picodroplets are collected into a chamber and incubated in situ at 37 °C, allowing the secretion of proteins from the encapsulated single cells.
Sorting of positive cells: The fluorescence of each picodroplet is detected, and in a similar manner to flow cytometry, gating is used to select the desired picodroplets, which are actively channeled for collection. The population of cells selected for collection can be defined and adjusted according to each specific experiment. Selected positive picodroplets are stored in a chilled microchamber prior to dispensing. Negative or empty picodroplets are diverted to waste.
Visual verification and dispensing: After sorting, fluorescence is detected a second time, and picodroplets can again be selected through gating, imaged, and dispensed into individual wells of 96- or 384-well MTPs prefilled with the preferred culture medium. The imaging process uses a brightfield camera to acquire sequential images of each picodroplet, providing visual evidence of a single-cell progenitor.
Cyto-Mine Instrument and Software
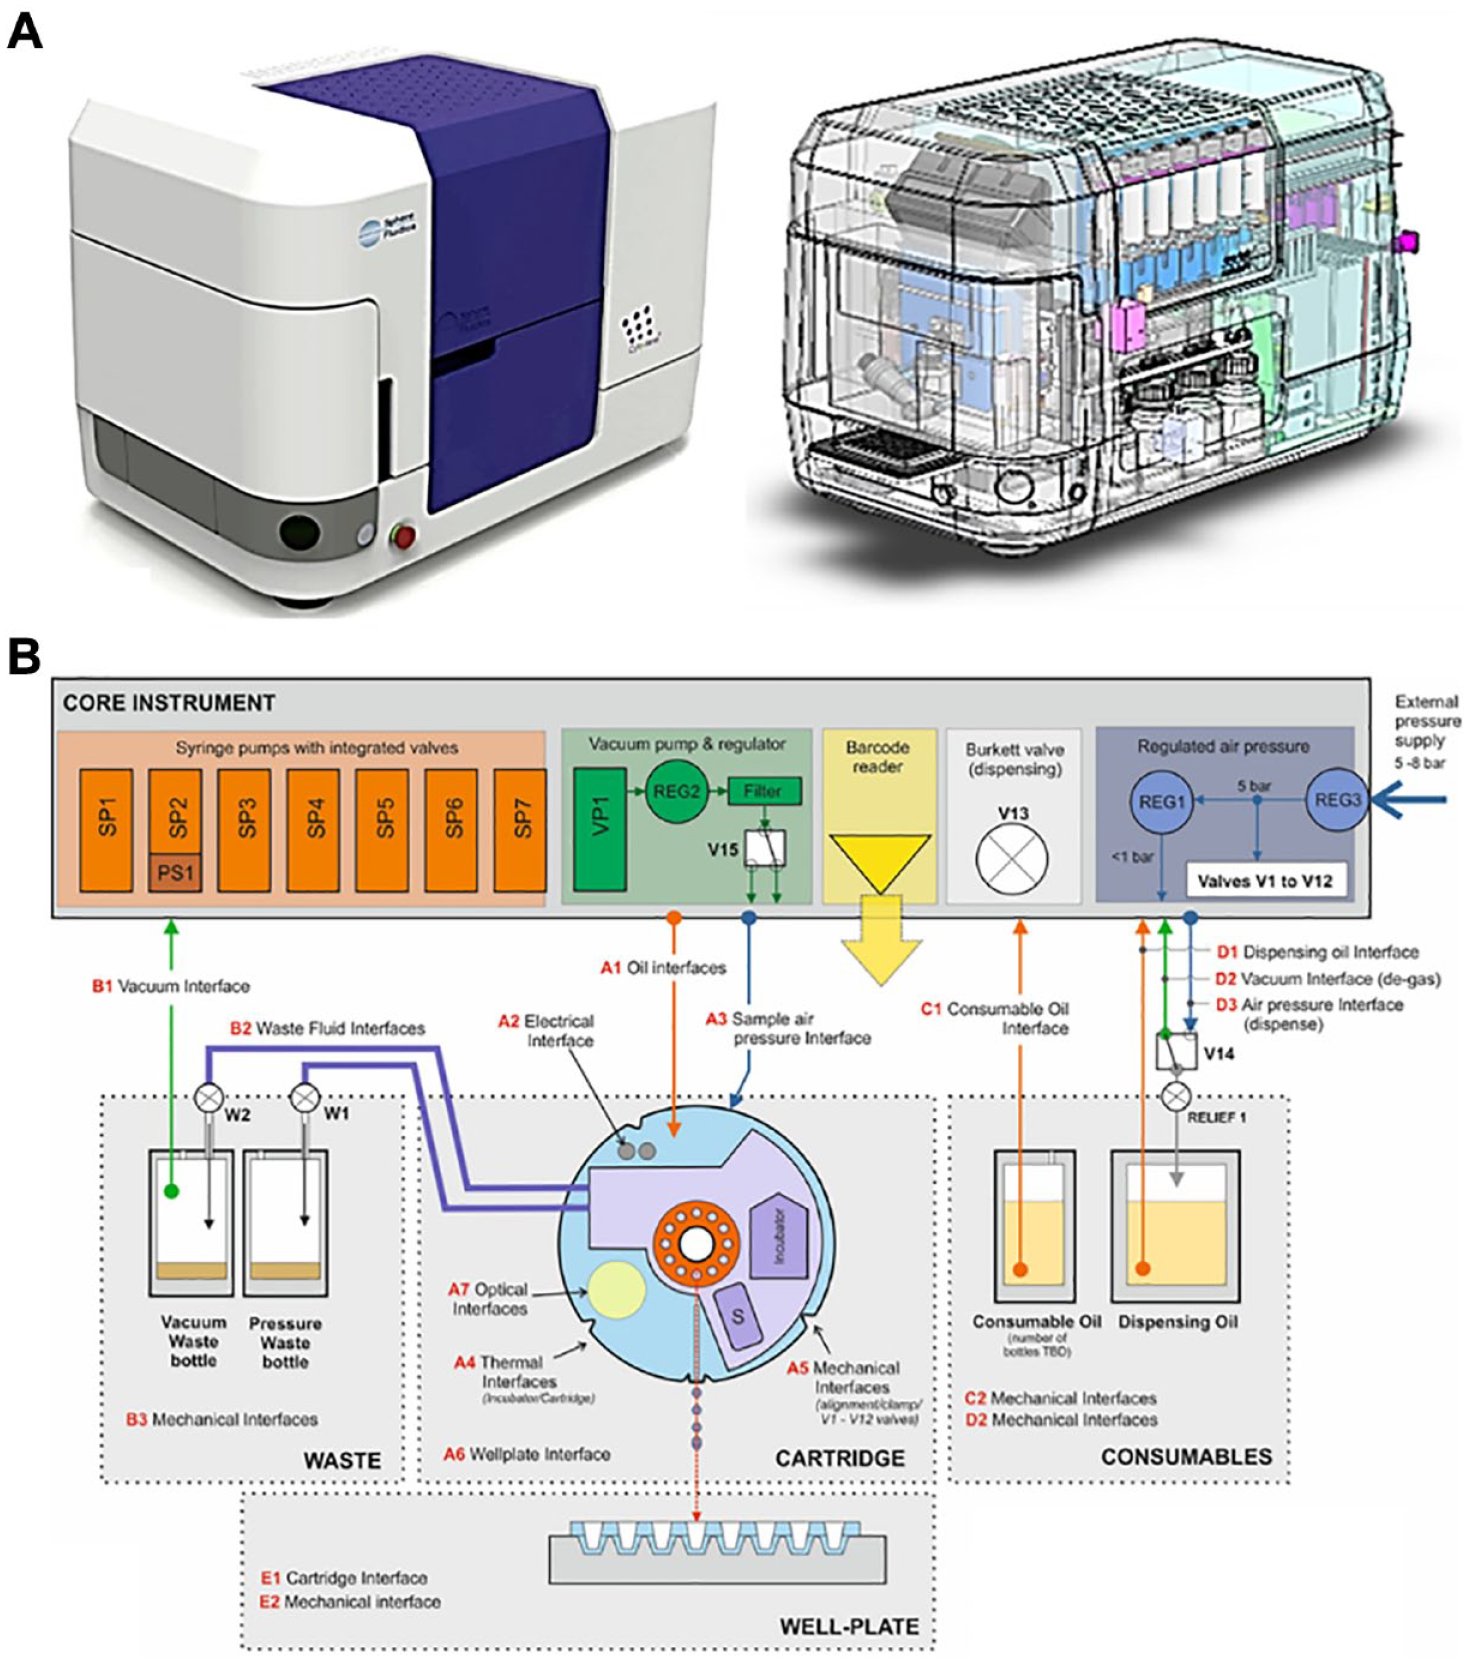
The Cyto-Mine instrument controls and automates the complex workflow, accepting individual Cyto-Cartridges, processing the sample, and dispensing antibody-secreting cells into identified wells of 96- and 384-well MTPs.
Figure 2A shows an external view of the Cyto-Mine instrument and with the outer casing removed to illustrate the internal layout of the instrument. The Cyto-Cartridge is loaded into the instrument manually and clamped in place with the inner door. This securely holds the Cyto-Cartridge in place with the optical, electrical, thermal, pneumatic, and mechanical interfaces correctly established. Figure 2B outlines the main system interfaces between the Cyto-Cartridge and the Cyto-Mine instrument.
(
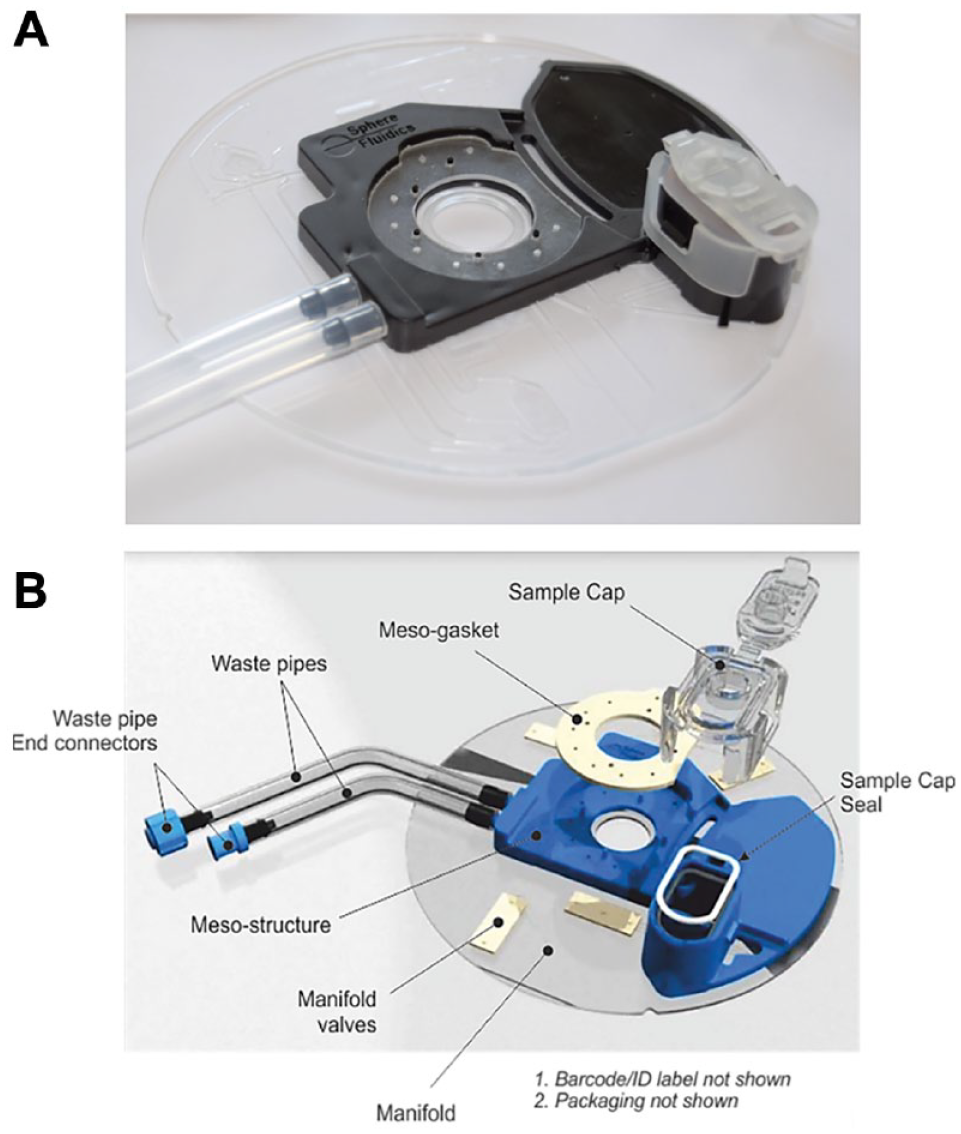
Cyto-Cartridge
The Cyto-Cartridge (
(
Materials and Methods
Cyto-Cartridge Fabrication
Cyto-Cartridges were fabricated from a transparent polymer and elastomer using injection molding and polymer casting techniques, respectively. All materials used in the manufacturing of the Cyto-Cartridges are ACF. The manufacturing was carried out by Stratec Consumables GmbH (Salzburg, Austria). The Cyto-Cartridge comprises two injection-molded discs in which the microfluidic channels and fluidic vias are defined; these disc layers are bonded together, using a proprietary solvent-assisted bonding technique. The mesostructure was injection molded in relevant polymer and laser welded to the bonded discs. The mesoseal and valve clusters were cast in elastomer. The mesogasket was applied to the mesostructure and held in place via short pillar-like protrusions on the mesostructure. To reduce handling, valves were arranged in clusters of three, with four three-cluster valves per Cyto-Cartridge. The individual valve clusters were then aligned relative to vias in the disc, brought into contact with the disk, and thermally bonded to form a fluidic seal. The sample cap was molded in polypropylene and sealed with an O-ring and held in place via an integrated mechanical clip formed as part of the molding. Finally, waste tubes and connectors were attached.
Postmanufacture, each Cyto-Cartridge undergoes full visual inspection to identify any imperfections and a leak test to ensure the quality of the final product. The Cyto-Cartridges that pass quality control are then vacuum packaged in foil pouches and labeling is applied. The final packaged Cyto-Cartridges are then gamma irradiated (25 kGy).
Beads for Dispensing Experiments
Beads (20 µm diameter, 19096-2; Polysciences, Warrington, PA, USA) were washed and suspended at a concentration of 3 × 10⁶ beads/mL in CD-CHO medium (cat no. 10743011; Gibco, Thermo Fisher, Waltham, Massachusetts, USA), containing 13% (v/v) OptiPrep (cat no. D1556; Sigma-Aldrich, St. Louis, Missouri, USA) and 0.1% (v/v) Pluronic F-68 (cat no. 24040032, 10% v/v; Gibco).
Culture of CHO Cells
The DG44 IP-free Chinese hamster ovary (CHO) suspension mini-pool (UCB, Slough, UK) was kept in culture using 125 mL Erlenmeyer flasks in the shaking incubator at 120 rpm, 37 °C, 6% CO2, and 95% humidity. Cells were maintained using CD-CHO medium, 4 mM
Sample Preparation
Cells were counted and the desired number of cells was harvested from the culture flask and centrifuged at 300g for 5 min at room temperature. To minimize assay background and remove the presecreted IgG present in the sample, the cell pellet was then washed once with fresh culture medium and centrifuged again at the same conditions. The supernatant was then discarded, and the pellet resuspended thoroughly in 1 mL of encapsulation medium (83% culture medium, 16% v/v OptiPrep, and 1% of Pluronic-F68 10%). The Förster resonance energy transfer (FRET) assay reagents were then added to the sample. The suspension was then filtered through a 30 µm cell strainer to remove cell clumps and debris. The cell suspension was kept on ice until loaded into the Cyto-Cartridge.
Three different input cell concentrations were used to demonstrate the impact of cell concentration on monoclonality. Cells and FRET assay reagents were encapsulated into 450 pL picodroplets and incubated for 1 h before assay reading and sorting. Sorted positives were dispensed into 96-well MTPs containing 50 µL of medium and 0.4 µg/mL acridine orange in each well. After dispensing, the MTPs were centrifuged at 200g for 5 min and the number of cells in each well were then manually counted under a fluorescent microscope.
Cell Staining
CellTracker Deep Red
A total of 1 × 10⁶ cells were centrifuged at 200 rpm for 5 min. The supernatant was discarded and resuspended in 1 mL of fresh medium containing 5 µM CellTracker Deep Red (Invitrogen), and this was transferred to 1 well of a 24-well tissue culture plate. The plate was incubated in a static incubator for 30 min under standard conditions. All cells were centrifuged at 200g for 5 min, the supernatant discarded, and cells resuspended in 1 mL of fresh medium, ready for sample preparation.
CellTrace Violet
A total of 1 × 10⁶ cells were centrifuged at 200 rpm for 5 min. The supernatant was discarded and resuspended in 1 mL of fresh medium containing 10 µM CellTrace Violet (Invitrogen), and this was transferred to 1 well of a 24-well tissue culture plate. The plate was incubated in a static incubator for 30 min under standard conditions. All cells were centrifuged at 200g for 5 min, the supernatant discarded, and cells resuspended in 1 mL of fresh medium, ready for sample preparation.
Cell Outgrowth Postdispensing
For cell outgrowth experiments, the input cell concentration used was 0.1 × 10⁶ cells/mL. After dispensing from the Cyto-Mine, cells were cultured in 96-well MTPs. MTPs were prefilled with 30 µL of cloning medium prior to dispensing and topped up to 150 µL after dispensing. This helped creating a uniform oil layer at the bottom of the well, instead of multiple oil macrodroplets that would interfere with plate imaging. Plates were kept in a static incubator at 37 °C and 6% CO2 and colony growth was observed after 3 weeks.
Limiting Dilution Cloning
LDC was performed on the same day of each Cyto-Mine run, harvesting cells from the same cell culture flask. Cells were counted and diluted at a final concentration of 0.5 cells/well and then seeded in 96 MTPs in cloning medium, kept in a static incubator at 37 °C and 6% CO2, and colony growth was observed after 3 weeks. As cell distribution for LDC follows the Poisson distribution, 0.5 cells/well results in 39.3% of the predicted occupied wells. Thus, 39.3% is considered to correspond to 100% when qualifying outgrowth.
Results and Discussion
Picodroplet Generation and Cell Encapsulation
Picodroplet generation and cell encapsulation are achieved using a “flow-focusing” picodroplet generator geometry. 17 Approximately 600–1,000 μL of a cell suspension at concentrations between 0.1 × 10⁶ cells/mL and 40 × 106 cells/mL is loaded onto the Cyto-Cartridge via the sample port. Assay components are added to the sample prior to loading onto the Cyto-Cartridge (see Sample Preparation for further details). The encapsulation oil phase is a fluorocarbon oil (Novec 7500; 3M, Maplewood, Minnesota, USA) containing Cyto-Surf surfactant (Sphere Fluidics Ltd., Cambridge, UK). The sample flow rate is controlled by applied pressure (100–200 mbar) to the sample chamber. The oil phase flow rate is controlled via a syringe drive.
Image processing of the picodroplets being generated allows for size determination and closed-loop feedback control of the sample and oil flow rates. This closed-loop control of the system allows for the generation of a tightly monodispersed picodroplet population. A picodroplet volume of 450 pL is used. The size variations of picodroplets are less than 3% at a generation rate of circa 1,000 picodroplets/s.
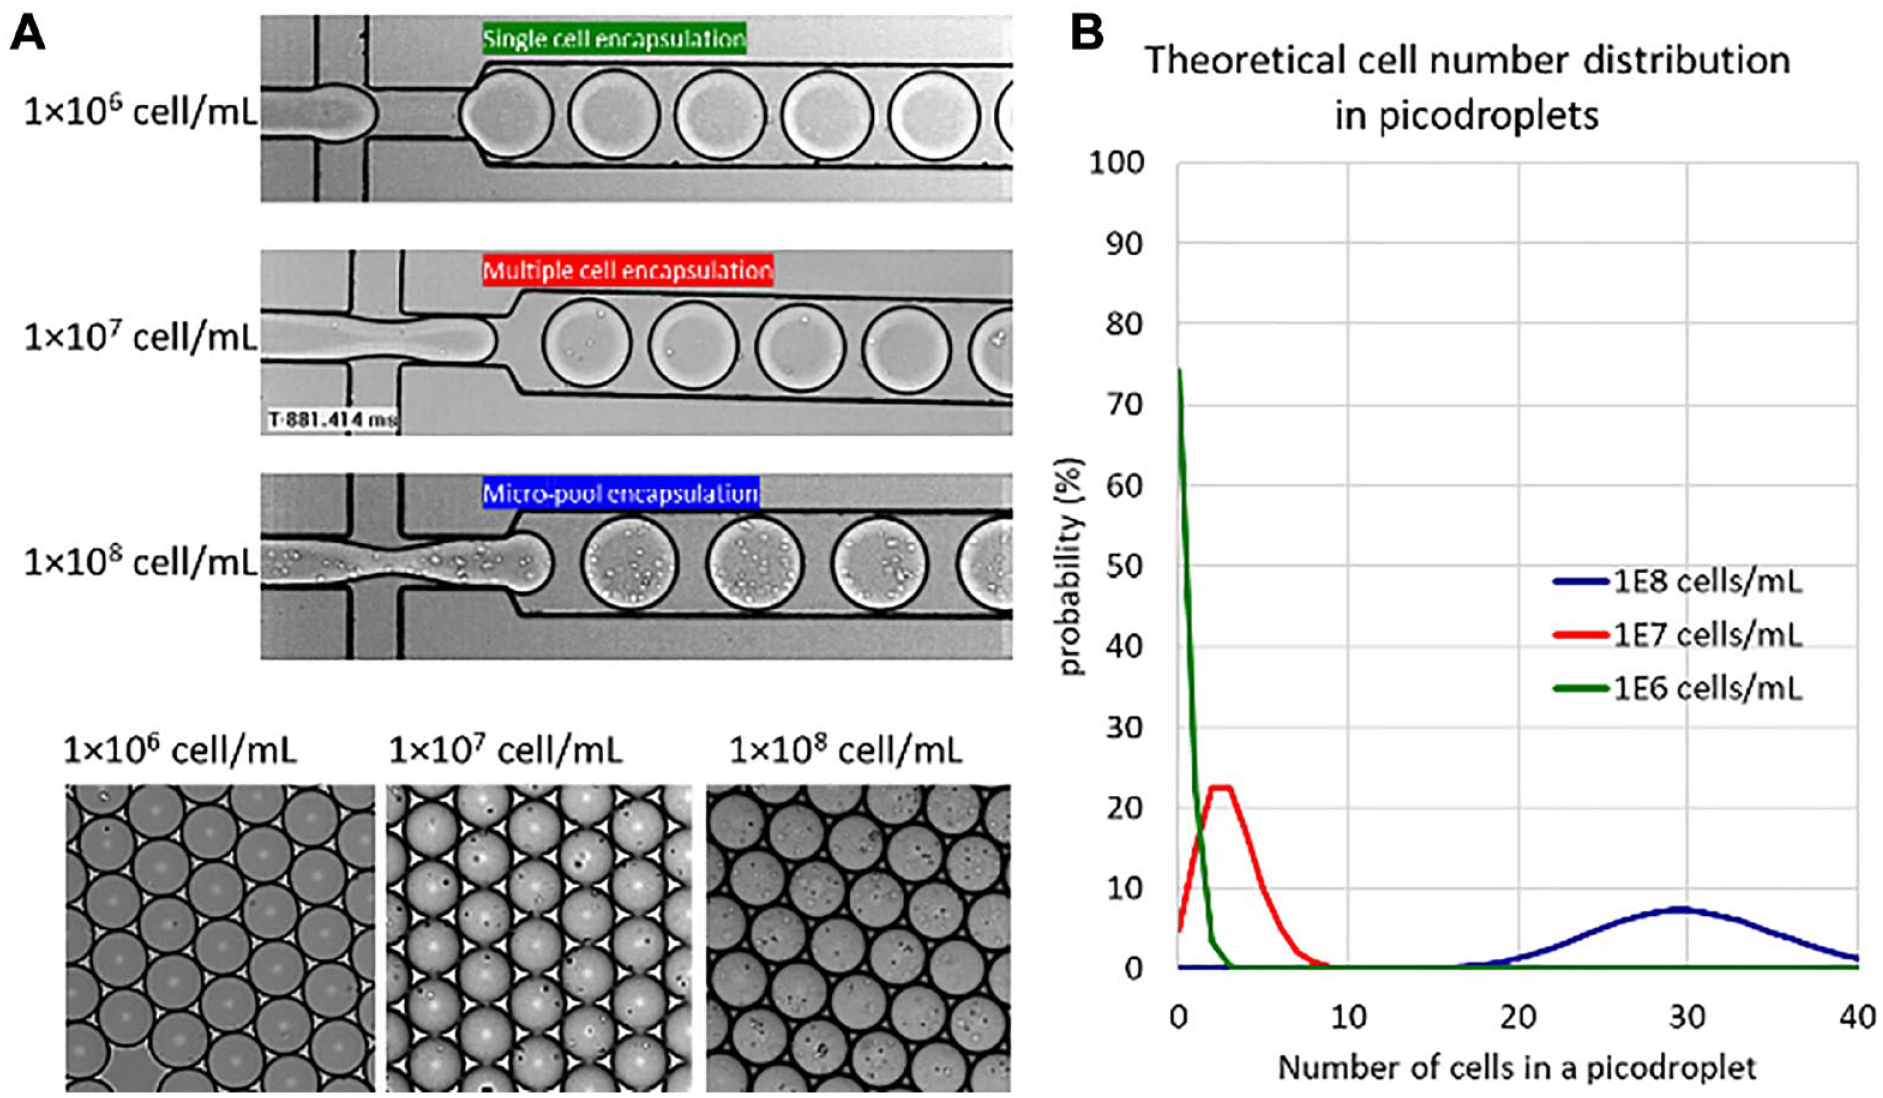
The cell number distribution in picodroplets has a large impact on both assay throughput and probability of monoclonality. The sample cell concentration has a large impact on the total number of occupied picodroplets available for sorting versus the percentage of picodroplets containing only single cells. High-quality cell encapsulation is achieved by (1) accurately counting and adjusting the input cell concentration and (2) minimizing cell sedimentation during the encapsulation process. The latter is achieved by adding the density-matching agent OptiPrep (typically 16% v/v). Pluronic F-68 is also added, to a final concentration of 0.1%–1% (w/v), as a shear protectant to protect the cells from hydrodynamic damage. Such culture medium containing OptiPrep and Pluronic F-68 is called encapsulation medium.
In an ideal scenario, the cell number distribution follows the Poisson distribution, as shown in the formula below:
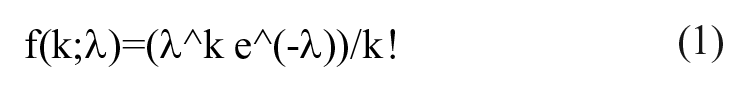
where f is the frequency of occurrence, λ is the average number of cells over the number of picodroplets, and k is the number of cells per picodroplet.
From this we can predict the frequency of occurrence f of picodroplets containing 0, 1, 2, 3, . . ., cells (k = 0, 1, 2, 3, . . .) in a population. The probability encapsulation λ can be calculated by multiplying the cell concentration of the sample by the single picodroplet volume. For example, for a cell sample containing 1 × 10⁶ cells/mL encapsulated in 450 pL picodroplets, λ = 1 × 106 × 450 × 10−9 = 0.45.
Figure 4 shows the predicted occupancy for different sample concentrations ranging from 1 × 10⁶ cells/mL to 1 × 10⁸ cells/mL. Figure 4A shows images at generation and following the collection of picrodroplets generated using these different sample concentrations. Figure 4B shows the theoretical cell number distribution as calculated using eq 1 for the three concentrations.
(
Picodroplet Incubation and Fluorescent Analysis: FRET-Based Protein Secretion Assays
Following picodroplet generation, the cell-occupied droplets and empty picodroplets are held in the incubation chamber within the Cyto-Cartridge. The temperature of the incubation chamber is controlled by a Peltier heating element and a thermal control unit within the instrument. After generation, the temperature within the incubation chamber is held at 37 °C (or other user-specified temperature for optimal expression of the protein of interest) for the desired incubation duration.
FRET-based assays were developed to detect protein secreted by the encapsulated cells. The assay can be customized by the selection of appropriate detection probes specific for the protein of interest, such as IgG (e.g., for productivity screening) or antigen-specific IgG (e.g., for hybridoma fusion screening or B-cell mining). When the secreted protein is recognized by the detection probes, a three-body complex is formed, which induces a FRET-mediated shift in fluorescence. This signal is used to determine the quantity of secreted protein and select picodroplets for collection.
In the case of cells producing antibodies, the incubation step allows the single cells to produce and secrete antibody molecules that are retained within the picodroplets. Incubation periods between 15 min and 4 h generally allow the accumulation of enough antibody to generate a detectable FRET signal change inside each picodroplet. This signal change is gated on and the relevant picodroplets sorted. Our data and the data of others12,13,16 demonstrate the ability to retain viable cells in picodroplets for extended periods of time (i.e., several hours or days).
Figure 5
shows an assay used to measure the IgG production of single cells in picodroplets, using a customized pair of IgG-specific fluorescent probes.
Figure 5A
shows the schematic of the IgG-binding assay.
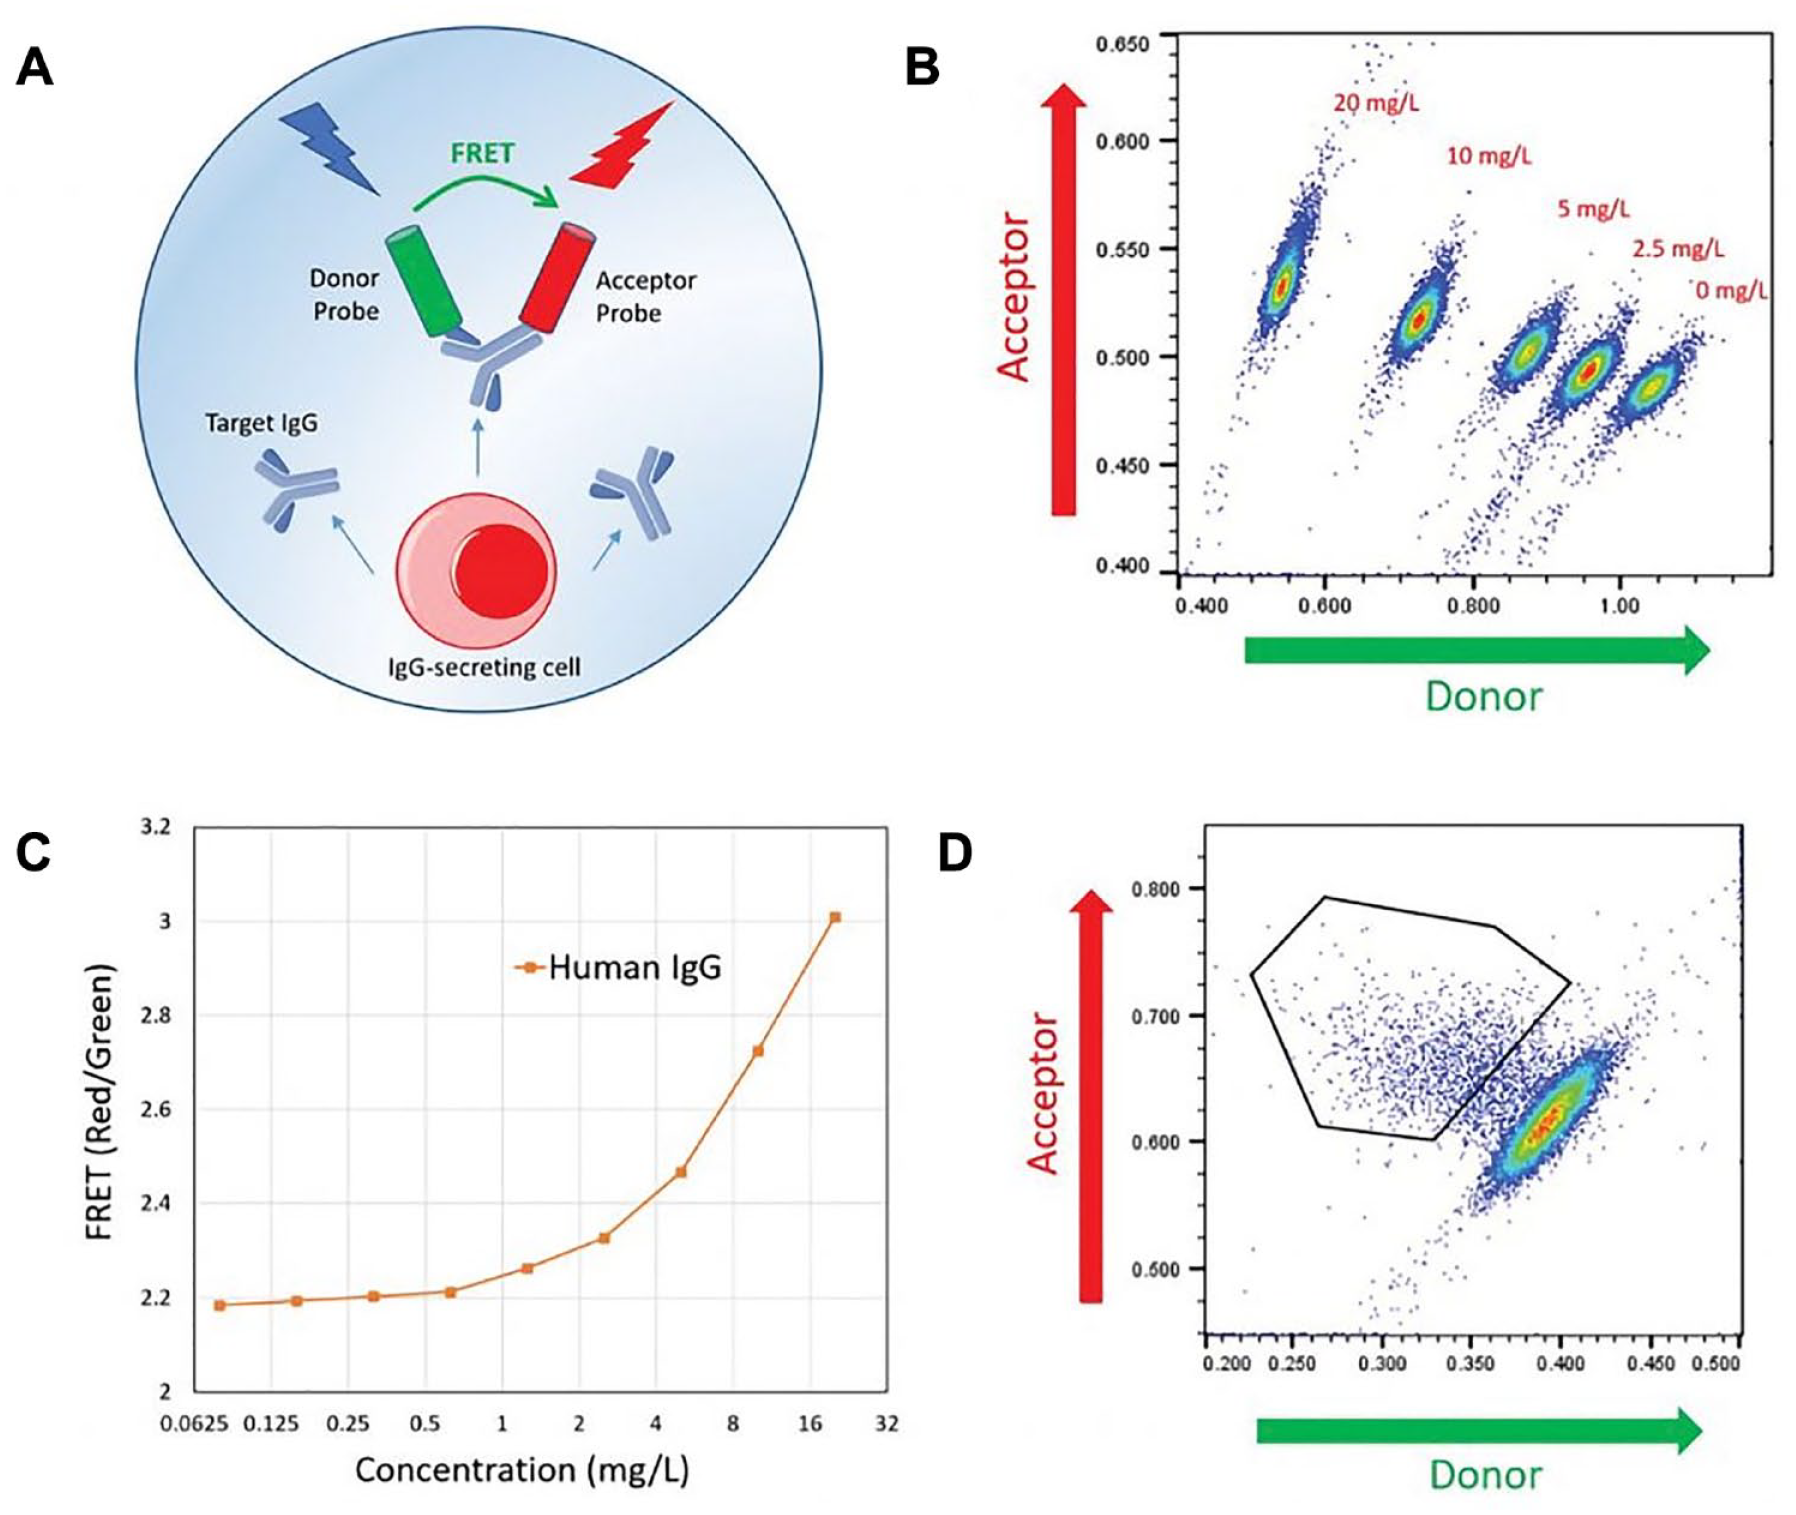
Cyto-Mine IgG secretion assay. (
Screening IgG-Expressing CHO Cell Line Pool
An industry-relevant DG44 CHO cell pool expressing IgG4 in the gram per liter range in a fed-batch bioreactor was used. The cell pool was derived from a stable mini-pool and was not clonal prior to being sorted on the Cyto-Mine.
The IgG secretion assay was then used to screen this heterogeneous cell pool to identify and isolate the highest antibody-producing clones. The population of picodroplets to the upper left of the scatterplot (
Antigen-Specific Assay for Antibody Discovery
We show here an example of the system’s capabilities—screening of hybridomas for antigen-specific clones generated from a mouse immunized with human tumor necrosis factor-α (TNF-α). The detection probes comprised human TNF-α and an anti-mouse IgG-Fc conjugated, respectively, with FRET donor and acceptor, enabling specific detection of mouse IgG recognizing human TNF-α (
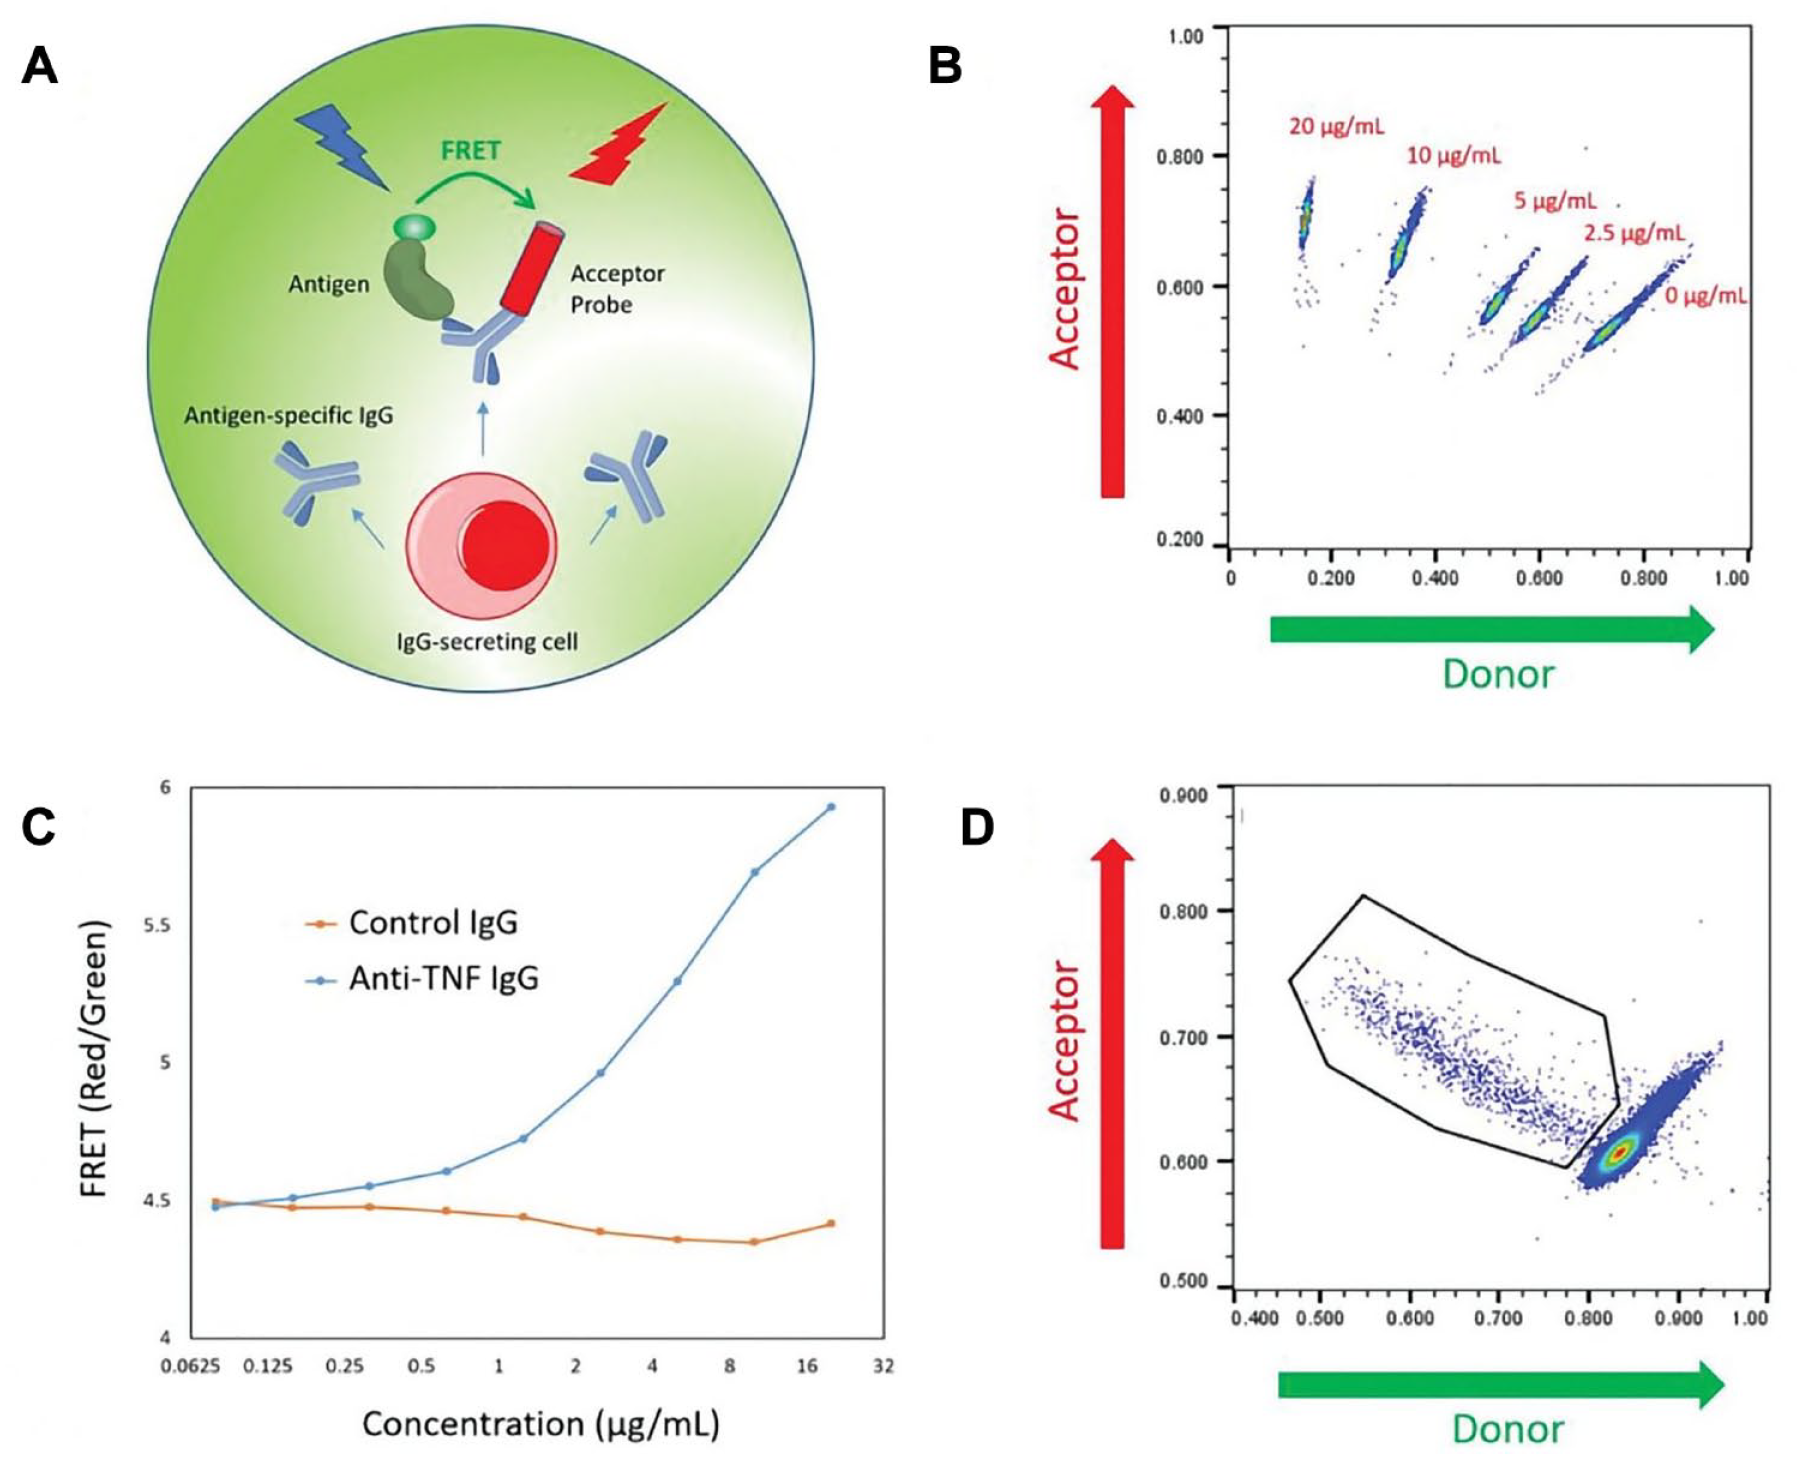
Cyto-Mine antigen-specific assay. (
A population of hybridoma cells was analyzed with the validated detection probes to find TNF-α-specific, IgG-producing clones. A subpopulation of cells with a high acceptor-to-donor fluorescence ratio, indicating secretion of human TNF-α-specific IgG, was gated for collection, while the majority of picodroplets were diverted to waste (
Picodroplet Sorting
Sorting is based on the measurement of the relative fluorescence from donor and acceptor. Picodroplets are flowed at ~300 picodroplets/s through the detection channel, where they are interrogated by a laser and their fluorescence emission is measured at dual wavelength. Based on this measurement, the user can gate a subpopulation of picodroplets by manually drawing a region of interest on the scatterplot. The gated population is sorted and held in a holding chamber downstream of the sorting junction. Sorting is achieved via dielectrophoresis:18,19 by applying high-voltage pulses to a pair of electrodes embedded in the Cyto-Cartridge, positive hits flow toward the holding chamber, while negative ones flow by default into the waste channel. The holding chamber is approximately 20 μL in volume, which allows sorting of up to 40,000 positive picodroplets. These positive hits are held in the holding chamber prior to dispensing.
Picodroplet Dispensing
Following sorting, the system proceeds to dispense picodroplets into individual wells of 96- or 384-well MTPs.
The fluorescence signal (indicative of secretion level) and brightfield images (determination of monoclonality) of the picodroplets are captured for each picodroplet at a point immediately upstream of the dispenser nozzle, and these data are kept linked with the well into which the picodroplet is dispensed. These data are used for full traceability and to allow for utilization by other software packages or devices.
Prior to a picodroplet being dispensed, the system takes five sequential images of the picodroplet. Figure 7A shows the five images taken a few milliseconds apart for a picodroplet containing two cells. The time delay between images is sufficient to ensure that the cells inside the picodroplets will move respective to each other, reducing the possibility of a cell obscuring another cell if only a single image was captured. The Cyto-Mine software uses a deep learning algorithm to identify the number of cells inside each picodroplet. Direct correlation of assay readout, image-based monoclonality assurance, and well address is shown in Figure 7B . No reduction in cell viability is observed after the Cyto-Mine process (data not shown), and the CHO cells dispensed into wells are still viable and proliferate into colonies. Figure 8 shows the results of CHO cell outgrowth after dispensing into 96-well plates. Limiting dilution with the same cell samples was carried out as a control. From all the experiments shown, there was no apparent difference in cell outgrowth rate between Cyto-Mine and manual LDC. These data suggest that Cyto-Mine is a gentle and cell-friendly cloning technology.
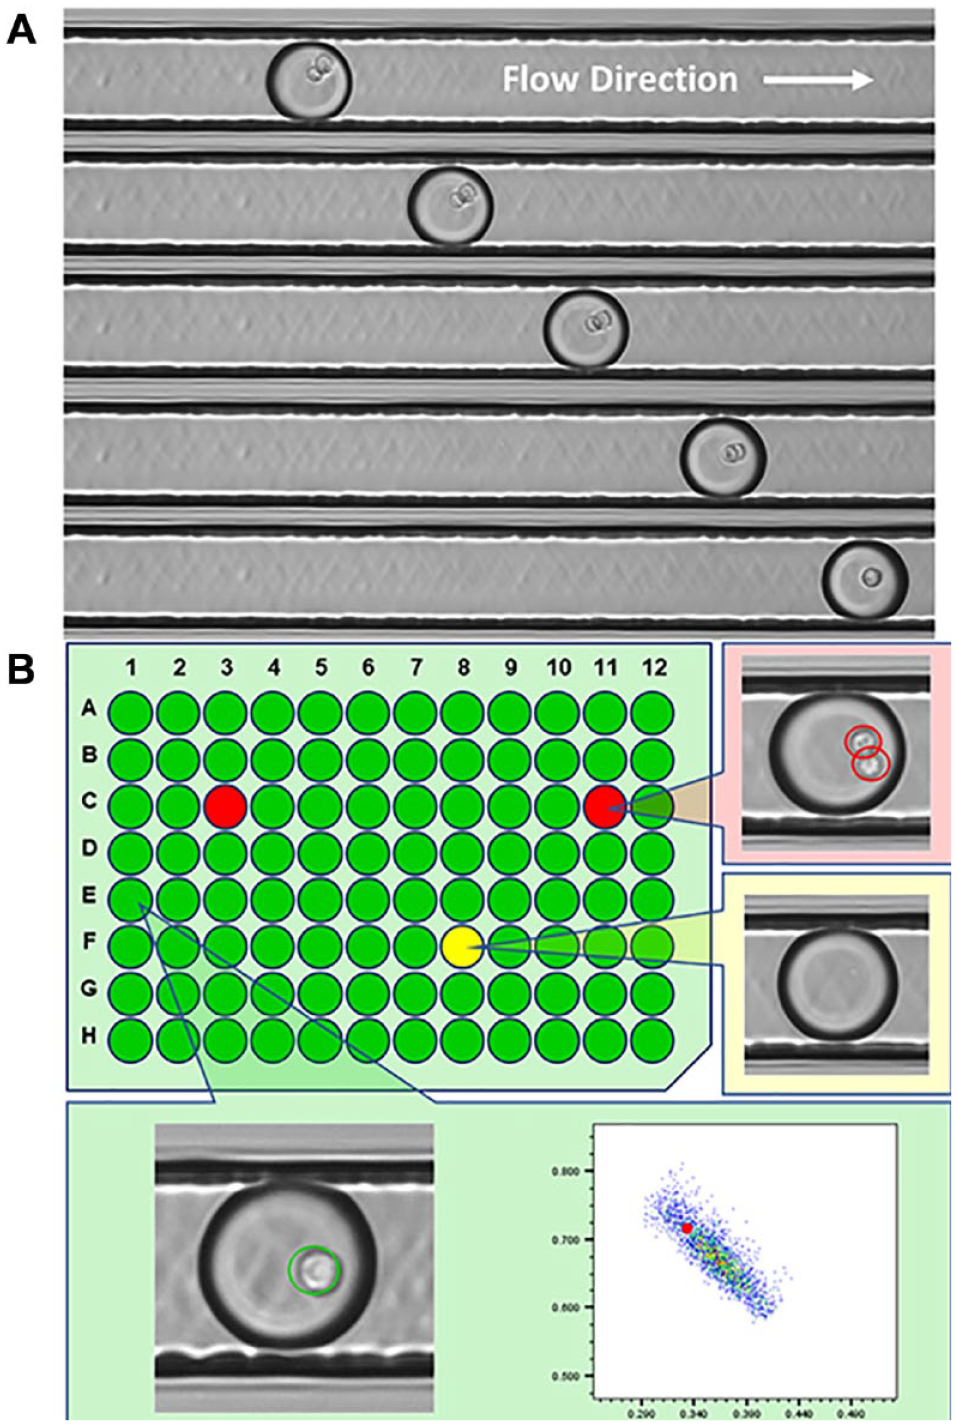
Imaging of picodroplets. (
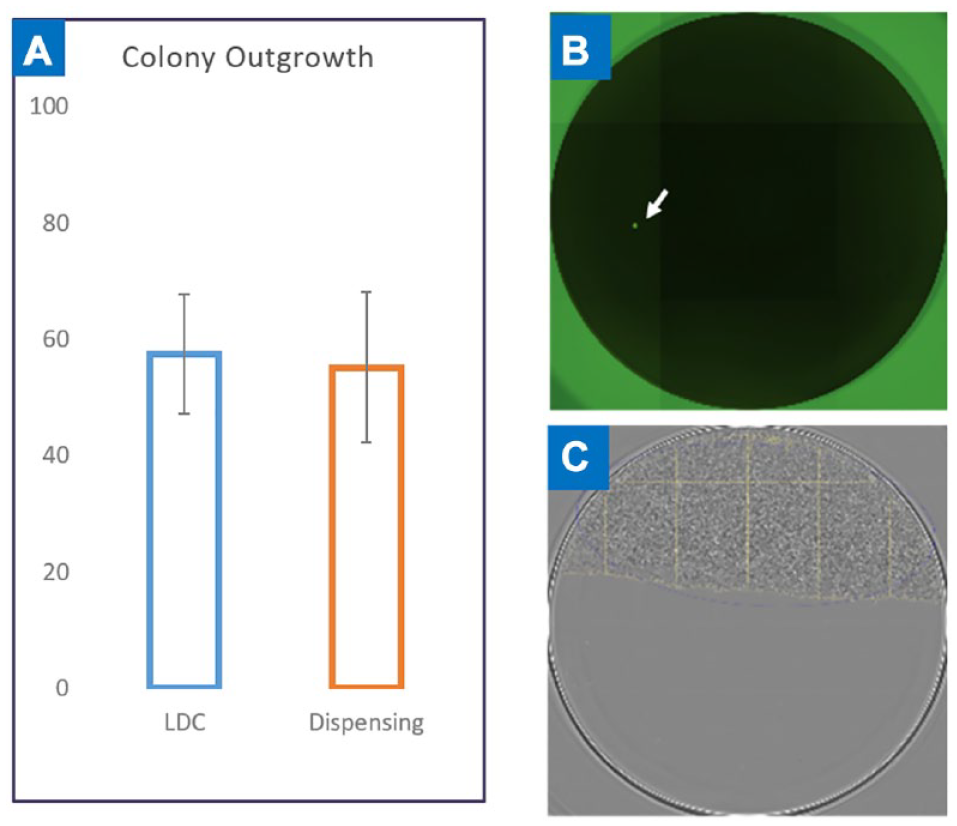
Colony outgrowth. (
Dispensing Fidelity
Reliable and efficient dispensing is a critical performance criterion to prove Cyto-Mine as a tool for single-cell cloning. Dispensing accuracy was tested by comparing the number of beads or cells in each picodroplet from the images taken by Cyto-Mine prior to dispensing with the number of cells in the corresponding well into which the picodroplet was dispensed (
Dispensing Accuracy of Beads.
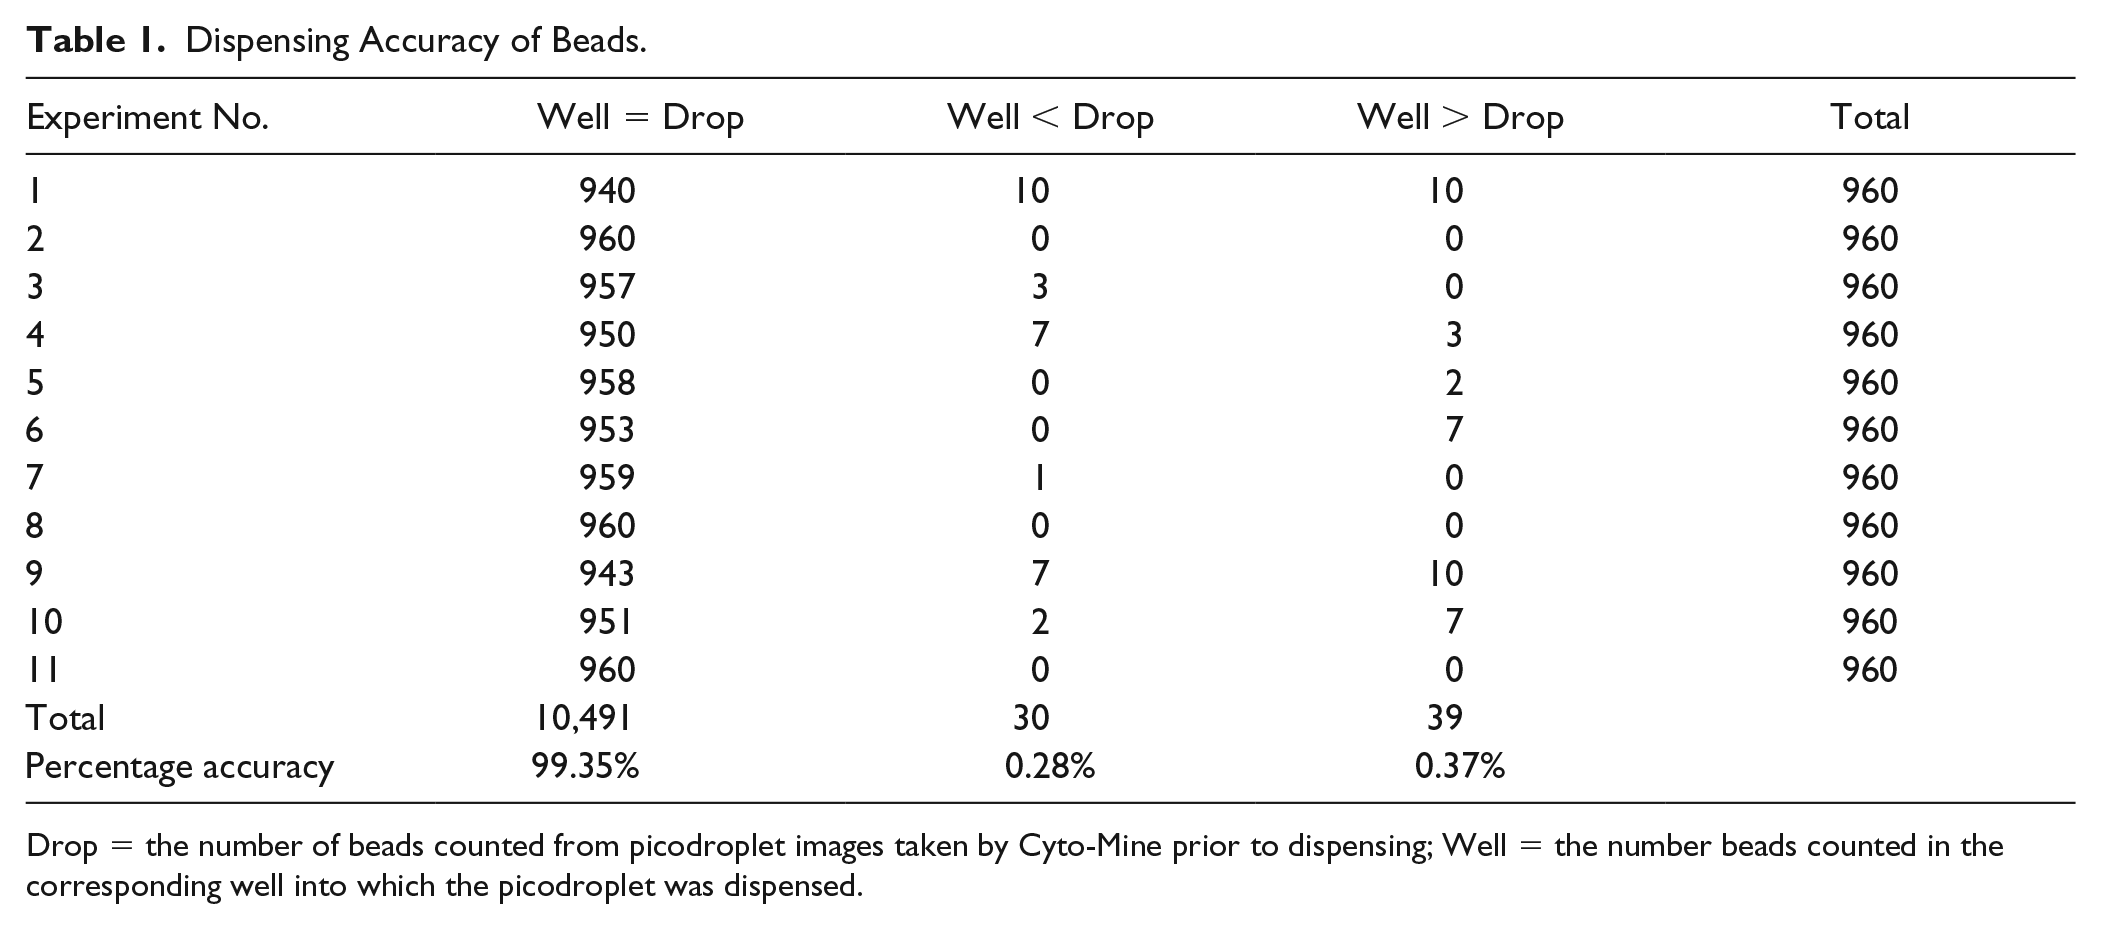
Drop = the number of beads counted from picodroplet images taken by Cyto-Mine prior to dispensing; Well = the number beads counted in the corresponding well into which the picodroplet was dispensed.
Dispensing Accuracy of Cells.
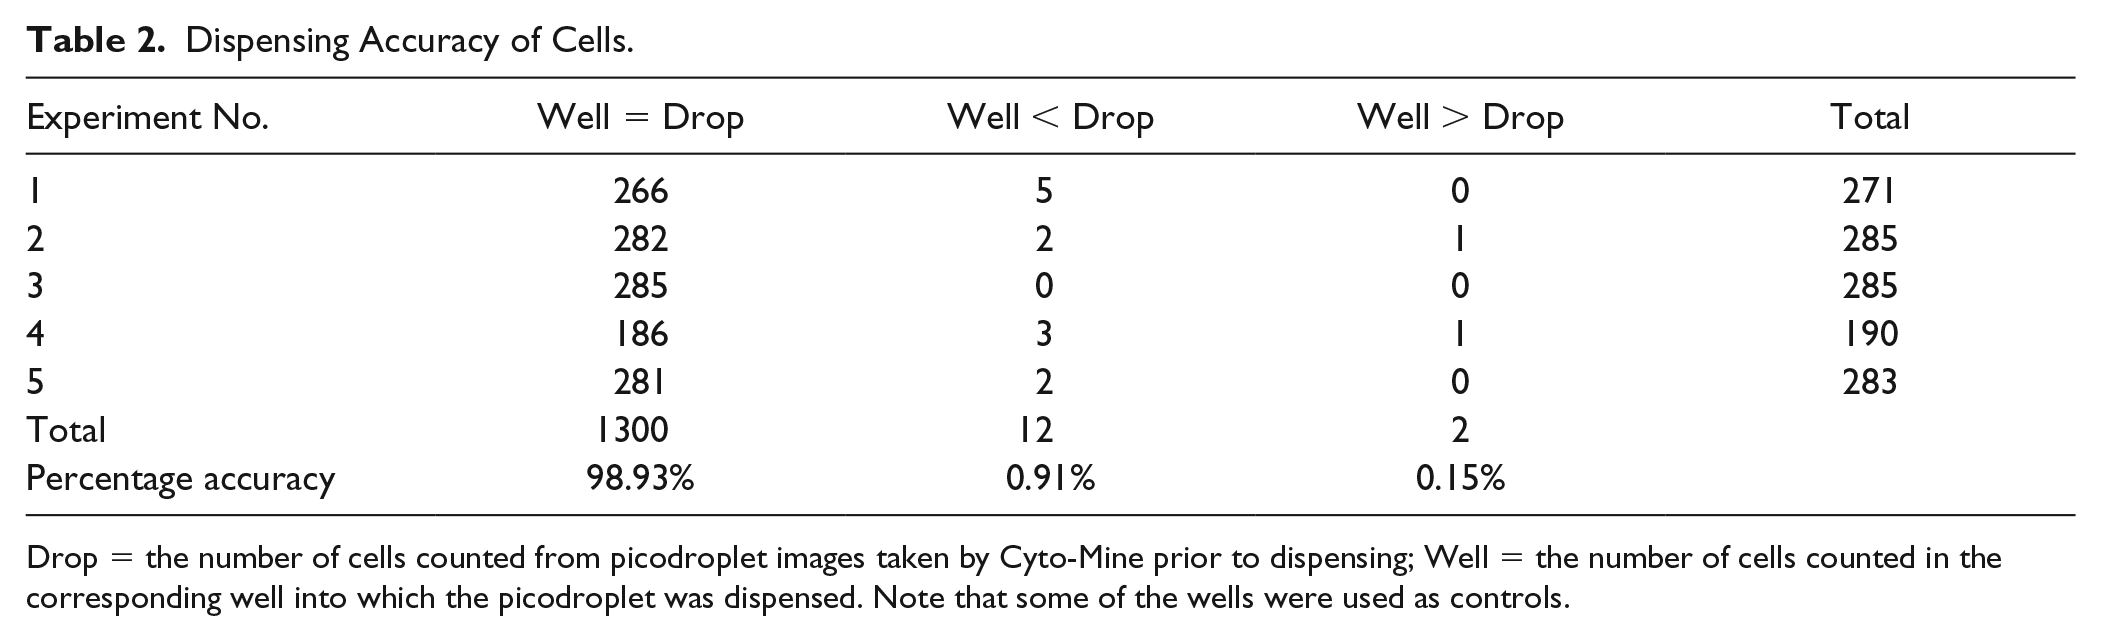
Drop = the number of cells counted from picodroplet images taken by Cyto-Mine prior to dispensing; Well = the number of cells counted in the corresponding well into which the picodroplet was dispensed. Note that some of the wells were used as controls.
Monodispersed, fluorescent polystyrene beads were used at first to exclude potential artifacts and variations brought about by using cells (e.g., cell aggregation, cell division, and mechanical damage during operations). Eleven separate experiments were carried out to assess the dispensing fidelity of fluorescent beads using a high input concentration (3 × 10⁶/mL) for all tests. This resulted in λ = 0.9 in Poisson distribution, which maximizes the diversity of bead occupancy, to allow easy comparison of the counts in picodroplets and wells. On average, the Cyto-Mine bead dispensing accuracy was 99.35% ( Table 1 ).
After the confirmation of accurate dispensing of fluorescent beads, a CHO cell line was used to assess the cell dispensing accuracy of Cyto-Mine. Fidelity was assessed over five independent experiments with CHO cells dispensed into 96-well MTPs per experiment ( Table 2 ). The results showed that Cyto-Mine dispensed the expected number of cells with 98.93% accuracy.
The number of beads or cells in both picodroplets and the well were counted manually, as this was believed to be the most reliable way of counting, rather than plate scanning and/or image recognition-assisted counting.
Cell Line Development Proof-of-Concept Experiment: Identification of High- and Low-Productivity CHO Cells
A proof-of-concept experiment was developed to evaluate the Cyto-Mine’s capability to identify, sort, and single-cell dispense cells based only on their IgG productivity.
DG44 CHO suspension cells expressing a human IgG4 full-length antibody were used for this study. Two cell lines were selected based on their productivity, measured in picograms per cell per day (PCD) in batch culture and product concentration in a 10-day overgrow batch culture. A high-productivity 30.5 PCD cell line was chosen with a product concentration of 482 mg/L in batch culture. A low-productivity 4.4 PCD cell line was chosen with a product concentration of 75 mg/L in batch culture.
To rapidly identify which originating cell line each dispensed single cell came from, the high-productivity cells and low-productivity cells were each fluorescently stained with a different color (CellTracker Deep Red or CellTrace Violet, respectively, as described in Materials and Methods). These cell stains were specifically chosen so as not to interfere with the FRET pair fluorescence emissions. Immediately prior to sample preparation the colored high and low producers were mixed at 2% high-productivity cells (Deep Red) and 98% low-productivity cells (Violet). The cell mixture was prepared using the sample preparation protocol (as described in Materials and Methods) and resuspended in encapsulation medium containing a FRET assay (developed by Sphere Fluidics) for the detection of human IgG in supernatant, at a final cell density of 1 × 10⁶ viable cells/mL. This was loaded onto the Cyto-Mine and incubated for 30 min. During the assay analysis a gate was drawn on the scatterplot around the population farthest away from the picodroplets containing no cells (droplets with the greatest FRET readout), and these gated picodroplets were sorted (
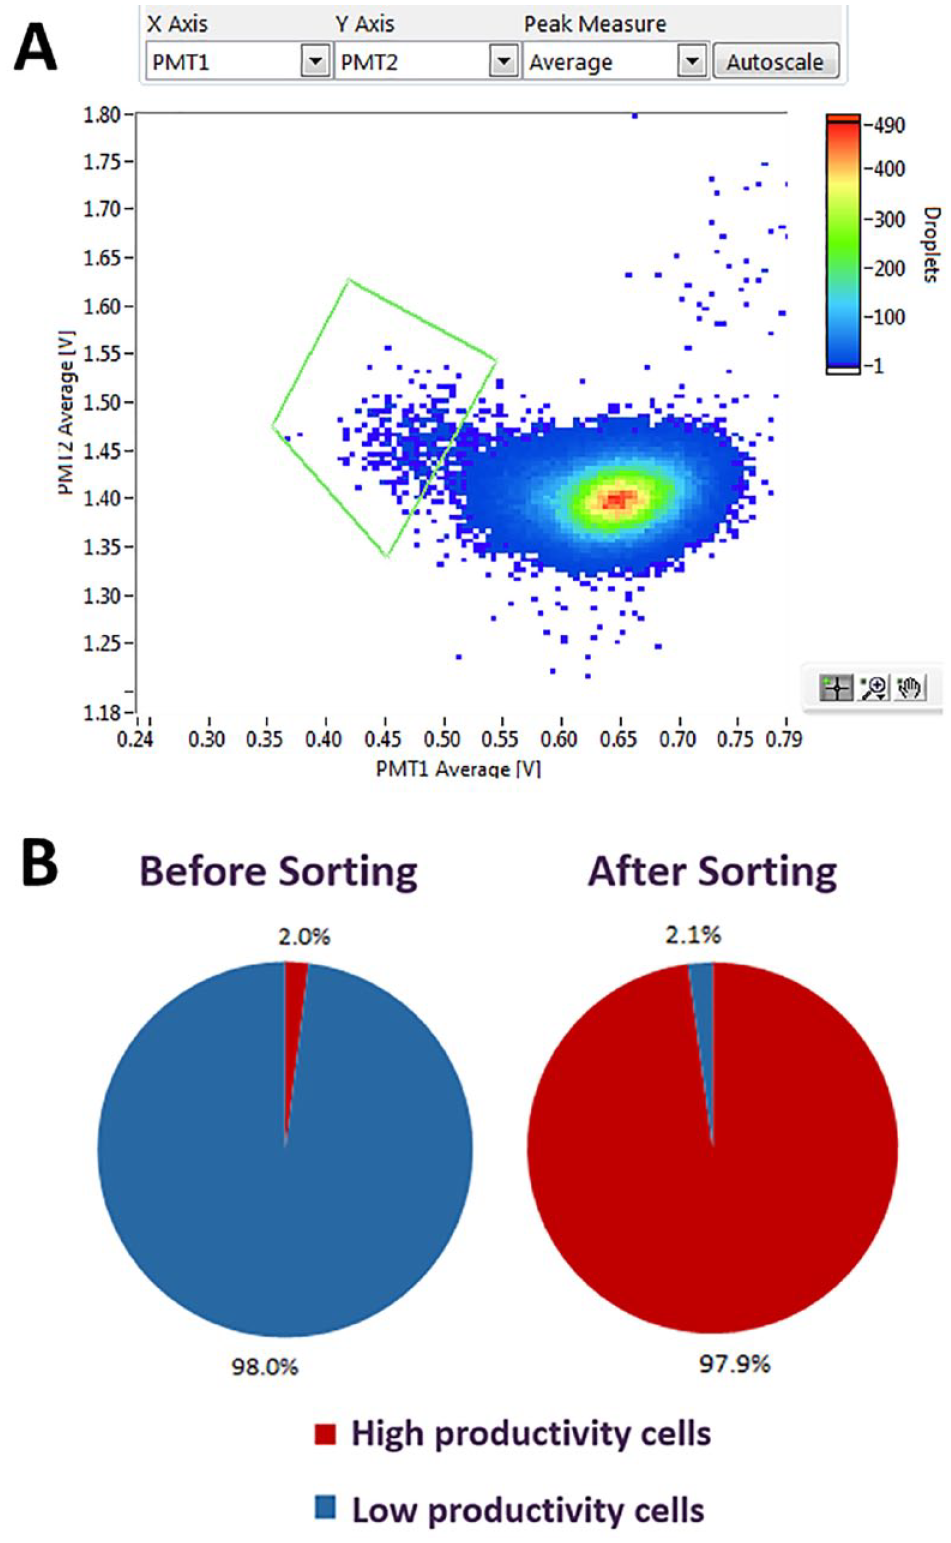
Identification and enrichment of a cell population.
Immediately after centrifugation, the plates were imaged in brightfield and suitable fluorescent channels on a NyOne imaging device (Synentec, Elmshorn, Germany). The NyOne images were manually viewed to determine whether each well contained a single cell; those that did not were excluded from the results. The wells containing a single cell were manually viewed and the number with either a high-productivity cell (CellTracker Deep Red-stained cells) or a low-productivity cell (CellTrace Violet-stained cells) was recorded.
Analysis of the data determined that sorting and dispensing on the Cyto-Mine enriched the mixed cells from 2% high-productivity cells to 97.9% high-productivity cells (
Upon observing the distribution of the picodroplets, we repeated the experiment to see whether we could separate the different populations further to achieve clearly defined picodroplet populations. This is important because cell cultures that would typically be sorted on the Cyto-Mine will likely contain a population of cells with very mixed-expression capabilities; therefore, it will be advantageous to maximize the spread of the FRET readout between picodroplets containing the lowest-producing cells and picodroplets containing the highest-producing cells, so that the desired population can be clearly gated. Figure 10 shows the assay scatterplot of this repeat experiment using the same cell lines and protocols but with an incubation time of 1 h instead of 30 min. The picodroplet population marked x consists of picodroplets containing no cells, the population marked y consists of picodroplets containing low-productivity cells, and the population marked z consists of picodroplets containing high-productivity cells. We clearly demonstrated that picodroplet populations containing cells with different expression capabilities can be clearly separated, and with further optimization, this separation can likely be increased further.
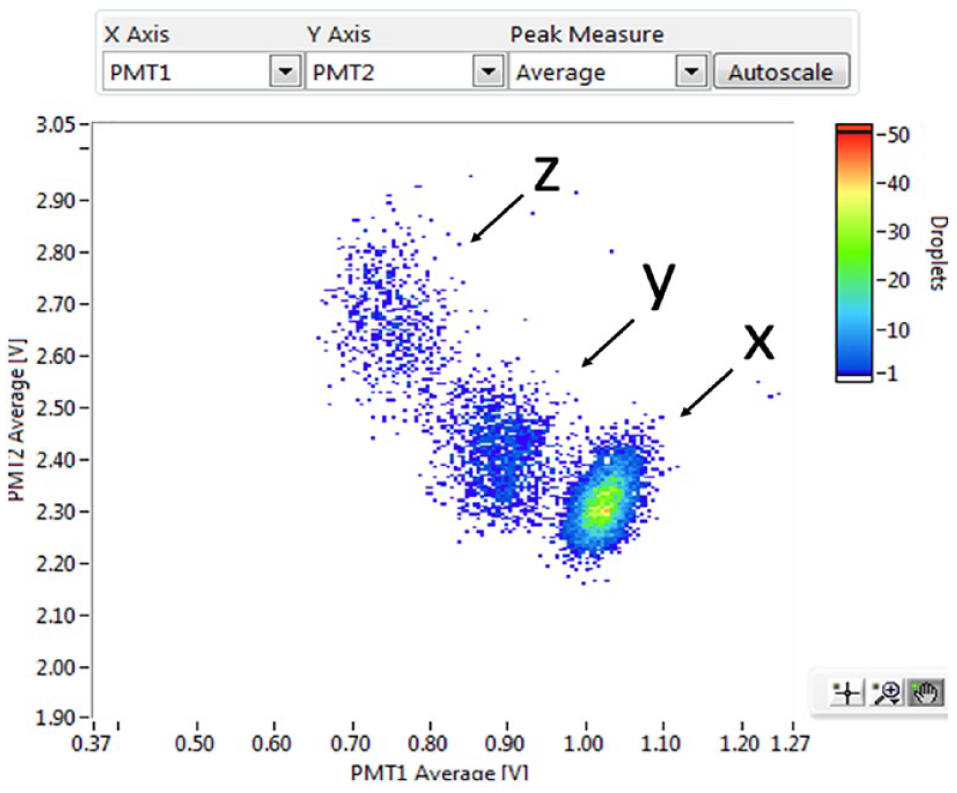
Identification of low-producing (y) and high-producing (z) cells. Empty picodroplets are labeled x.
Conclusions
Biopharmaceutical organizations are under increasing pressure to streamline their antibody discovery and cell line development processes, with unmet needs for increased throughput, shortened timelines, reduced costs, and improved proof of monoclonality. Next-generation, single-cell analysis platforms like the Cyto-Mine allow researchers to screen hundreds of thousands of individual cells, or up to 40 million cells (in pools) for the secreted target protein, to isolate high-value cells or pools of interest, and to dispense with high viability into MTP wells. These tasks can also be accomplished more efficiently by using one integrated and automated system. Cyto-Mine can be tailored to a range of requirements and workflows in bioproduction and other areas, such as genome editing, synthetic biology, single-cell diagnostics, and metagenomics. All could benefit from the improved efficiencies that are achieved by harnessing picodroplet technology.
In this work, we demonstrated a novel system that allows for the screening of more cells in less time, enables the discovery of unique candidates for biotherapeutic research (e.g., the best clones for bioproduction and rare antibody-secreting cells for research, diagnostics, and biotherapeutic development), and enables comparable cell survival. Conventionally, single-cell cloning is carried out by LDC. In LDC, the probability of a well containing a single cell is calculated by Poisson statistics.9,20 To achieve high monoclonality, a very diluted cell suspension has to be used, and this results in a very high number of wells containing no cells and very few wells on a plate containing single cells. This limitation has several consequences:
a. High redundancy in occupancy of the wells results in substantial waste of resources (e.g., reagents, media, and plasticware).
b. A very high number of plates must be processed to obtain the desired number of single-cell clones.
c. Two rounds of cloning must be performed to maximize the probability of monoclonality. This results in extended timelines for single-cell cloning and cell line generation.
In Cyto-Mine, limiting dilution is carried out by compartmentalization of the sample into picoliter-volume droplets, and the cell number distribution in picodroplets follows the Poisson distribution. Due to the small picodroplet volume, the reagent loss from the empty picodroplets is minimal and the picodroplets containing cells can be enriched in a very high-throughput manner; that is, within 2–8 h up to tens of thousands of picodroplets containing (single) cells can be individually dispensed into separate wells of 96- or 384-well MTPs.
The size of the picodroplets generated in Cyto-Mine is only several hundreds of picoliters in volume, about 5–6 orders of magnitude lower than the volumes used in conventional assays. This means that in the same time, the concentration of secreted antibodies from a single cell can be 5–6 orders of magnitude higher in picodroplets than in conventional vessels. In a typical Cyto-Mine instrument run, between 10,000 and 2 million picodroplets can be screened.
We are now evaluating adaptation of Cyto-Mine technology for single-cell therapy engineering and precision genome editing by CRISPR techniques.
Footnotes
Acknowledgements
We thank The Technology Partnership (Royston, UK) and Stratec Consumables, GmbH (Salzburg, Austria) for assistance.
Declaration of Conflicting Interests
The authors declared the following potential conflicts of interest with respect to the research, authorship, and/or publication of this article: All authors are employed by Sphere Fluidics or UCB, and their research and authorship of this article was completed within the scope of their employment with Sphere Fluidics or UCB.
Funding
The authors disclosed receipt of the following financial support for the research, authorship, and/or publication of this article: This work was partly funded by the UK Government Advanced Manufacturing Supply Chain 2014 Initiative as part of the BioStreamline Project (project no. 14020) to develop new approaches for the more efficient development and manufacture of next-generation biologics.