
Abstract
Recording the data necessary to assess the kinetics of a reaction can be labor-intensive. In this technology brief, we show a method to automate this task by utilizing parts of an ÄKTApurifier chromatography system to automatically take samples from a reaction vessel at predefined time intervals and place them in 96-well plates and also enable correlating the samples with in-line spectral data of the reaction solution. Automatic sampling can reduce experimental bottlenecks by enabling overnight reactions or a higher degree of parallelization. To demonstrate the feasibility of the method, we performed batch-PEGylation of lysozyme with varying conditions by changing the molar excess of the PEG reagent. We used analytical cation-exchange chromatography to analyze the samples taken during the batch reaction, determining the concentrations of the individual species present at each time step. Subsequently, we fitted a kinetic model on these data. Fitting the model to four different reaction conditions simultaneously yielded a regression coefficient of R2 = 0.871.
Keywords
Introduction
The acquisition of experimental data to assess reaction kinetics can be tedious work, especially if sampling is done manually or for long periods of time. Manual sampling is limited by working hours and liquid handling stations are limited by volume constraints. Examples for repurposed hardware to facilitate this kind of task can be found in the literature.1–3 Direct coupling of the reaction vessel to gas chromatography/mass spectrometry (GC/MS) 4 and thermal conductivity detectors 5 was reported for gaseous samples, along with manual sampling of the solid residue for Fourier transform infrared spectroscopy (FTIR) and x-ray diffraction (XRD) analyses. 4 Manual sampling by pipette can also be an option for reactions in the liquid phase in open systems. 6 Switching a valve to redirect circulating fluid to another instrument for analysis reduces the required manual labor. 7 For closed systems, use of an injection plug for sampling liquids by syringe was also reported. 8 Some reactions are performed under pressure, which allows for sample removal by sampling line, using the pressure difference compared with the environment as a driving force.9,10 Reactions that cause a color change can be followed in 96-well plates in a spectroscopic plate reader. 11 Instead of sampling a bulk reaction repeatedly, starting the reaction at different times in 96-well plates on a liquid handling station also yields time-resolved data. 12 Generally, the problem to solve is acquiring samples in a time-resolved manner and immediately analyzing these samples or stopping the reaction in the sample for later analysis. Here we introduce a modification to an ÄKTApurifier system that enables the automatic acquisition of samples from a batch reaction vessel by modifying the flow path of the fractionator using custom 3D-printed parts. We chose the PEGylation reaction of a model protein as a proof-of-concept example, as the PEGylation of proteins is highly relevant for the biopharmaceutical industry.13,14 Additionally, the possibility of acquiring spectral data correlating to the reaction is outlined using the Aux signals from the chromatography system in conjunction with a USB-6008 device from National Instruments (Austin, TX). The monitoring of chemical reactions by in situ spectroscopy has been utilized before15,16 and could be a useful tool for process analytical technologies, where even miniscule changes in the absorption profile of a batch reaction can be used to determine its progress. 17
Materials and Methods
Experimental Setup
We conducted all batch-PEGylation experiments in a standard 50 mL reaction vessel. To enable the automatic circulation of the reaction solution through the Tensor 27 FTIR instrument with the BioATRCell II flow cell controlled by OPUS 7 (all Bruker Optics, Ettlingen, Germany), we attached the reaction vessel to a P-960 sample pump and P-950 fraction collector (both GE Healthcare, Little Chalfort, UK) with a custom-made 3D-printed adapter, adapted from an existing project. 18 The reaction vessel was connected to the adapter using the threads for the lid. Using the adapter, we attached the reaction vessel to the autosampler’s waste port, so that the reaction solution circulated back into the vessel when the autosampler was in the waste position. Additionally, we fitted the autosampler with an additional 3D-printed adapter to hold a magnetic stirrer (IKA Topolino; IKA-Werke GmbH, Staufen, Germany) next to the reaction vessel without interfering with the movements of the sampling arm. Both adapters were printed using an Ultimaker Original+ (Ultimaker, Geldermalsen, Netherlands) 3D printer using polylactic acid (PLA) filament. Thus, the sample pump aspirated liquid from the reaction vessel, routed it through the FTIR instrument, and then into the autosampler. Depending on the current position of the autosampler arm, the liquid dropped back into either the reaction vessel through the adapter or a 96-well plate on the sampling platform. The sample pump and autosampler were controlled by Unicorn (GE Healthcare). We included a schematic representation of the experimental setup in Figure 1 and a photo in Figure 2 . The delay volume in Unicorn can be defined as the total volume between the reaction vessel and the outlet of the fractionator so that the sampling time correlates to either the reaction time in the batch vessel or the delay from the spectrophotometer. We determined the delay volumes by weighing the water required to fill the tubing. The pump was calibrated using buffer and we assumed the density to be constant. FTIR spectra were recorded using the chromatography mode in OPUS, repeatedly recording single spectra at a resolution of 2 cm–1. To correlate offline analytics to recorded spectra, we also determined the delay volume from the measuring chamber to the fractionator gravimetrically. For all experiments, we set the thermostat for the BioATRCell II flow cell to 22 °C.
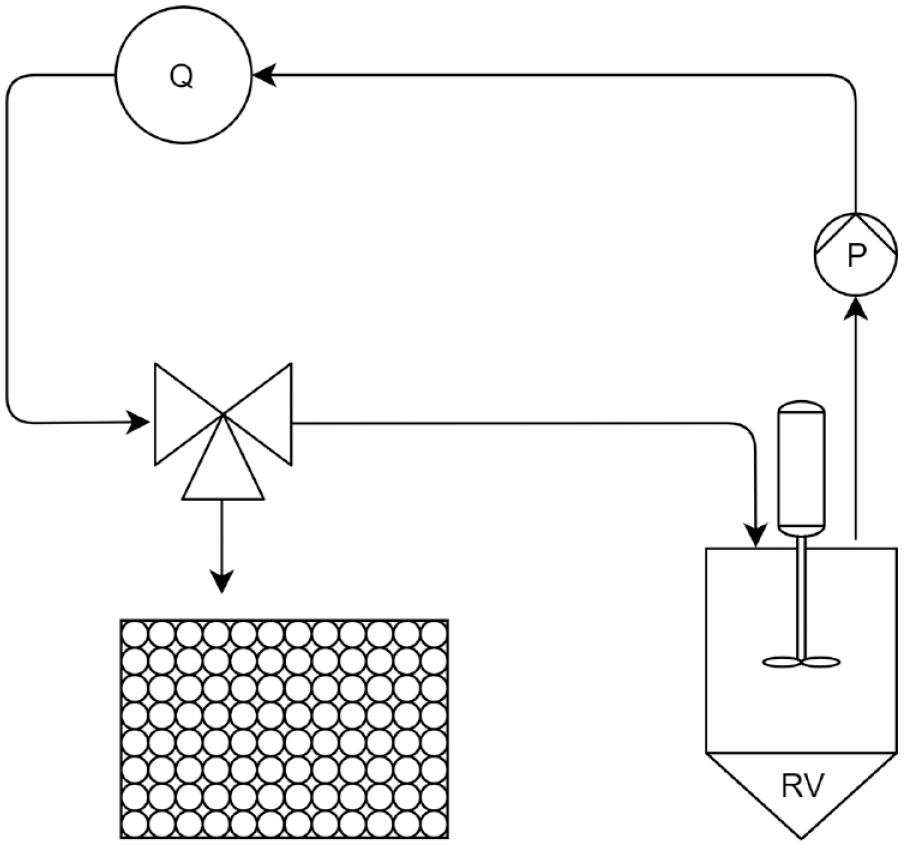
Schematic representation of the experimental setup. The reaction happens in the reaction vessel and the liquid is circulated through the attached spectroscopy device. The fractionator is represented as an automatic three-way valve, the measurement point Q is the in-line spectroscopy instrument, P is the pump, and RV is the reaction vessel.
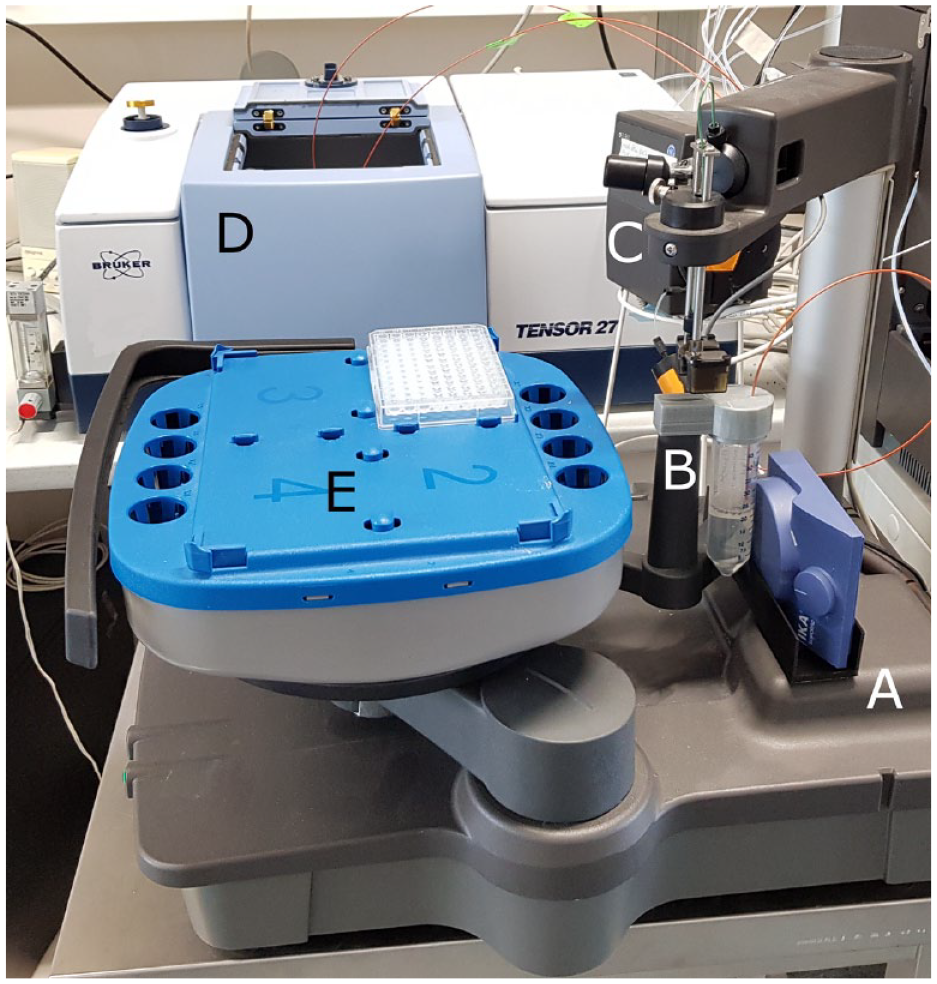
Experimental setup for supervision of the batch-PEGylation experiments. (
Proteins and Buffers
Purified water from a PURELAB Ultra water purification system (ELGA Labwater, High Wycombe, UK) was the base for all solutions. Before use, we filtered all buffers using 0.2 µm filters from Sartorius (Göttingen, Germany) and additionally degassed chromatography buffers in a sonification bath for 30 min before use. All pH adjustments were done using 32% HCl.
For all experiments, we used lysozyme from Hampton Research (Aliso Viejo, CA); sodium cyanoborohydride, lysine, and sodium citrate were purchased from Sigma-Aldrich (St. Louis, MO). We ran all PEGylation experiments in 25 mM sodium citrate buffer at pH 6.8 with a concentration of cyanoborohydride of 25 mM. We obtained the activated 5 kDa PEG from NOF Corporation (Tokyo, Japan) in the form of methoxy-PEG-propionaldehyde (mPEG-aldehyde, SUNBRIGHT ME-050 AL).
We carried out offline analytics using analytical cation-exchange chromatography with 20 mM Tris at pH 8.0 as the low-salt buffer and with an additional 700 mM NaCl for the elution buffer (both Merck, Darmstadt, Germany).
PEGylation of Lysozyme
We adapted the PEGylation protocol from work previously published by our group. 19 Briefly, we dissolved activated 5 kDa PEG and lysozyme in citrate buffer without sodium cyanoborohydride. Immediately before the beginning of the experiment, we filtered the solution through a 0.45 µm syringe filter and added it to 50 mM sodium cyanoborohydride in citrate buffer, to achieve a final concentration of 25 mM cyanoborohydride. We set the mPEG-aldehyde concentrations to nominal molar PEG-to-protein ratios of 2, 4, 6, and 8, with the target initial concentration of lysozyme set to 5 mg/mL for all experiments. All batch-PEGylation experiments ran for 320 min. The entire laboratory was air-conditioned at 22 °C. The reaction solution circulated at 1 mL/min and we set the system up to automatically collect 200 µL samples every 4 min. Samples were collected by the fraction collector into a 96-well plate containing 100 µL of a 600 mM solution of lysine to stop the reaction according to Ottow et al. 20
Analytical CEX Chromatography
Analytical chromatography was used to analyze reactions in a similar way before, 21 and we conducted the method previously published by our group. 22 We ran all analytics using a Vanquish UHPLC system with a ProSwift SCX-1S 4.6 × 50 mm column (both Thermo Fisher Scientific, Waltham, MA). The Vanquish UHPLC system consisted of a diode array detector (DAD) HL, binary pump F, column compartment H with integrated preheater and postcolumn cooler, and split sampler FT. Prior to all analytics, the column was equilibrated with low-salt buffer. Five microliters of sample was injected from each time step of the reaction and the column was washed for half a minute with low-salt buffer to flush out unbound compounds. Subsequently, a bilinear gradient ran from 0% to 50% elution buffer over 5 min and from 50% to 100% elution buffer over 1.75 min. After the elution, a high-salt strip for 1 min at 100% followed. Finally, the column was reequilibrated with low-salt buffer for 2 min before the next injection. We based the quantification of all species on a dilution series of pure lysozyme, while relying on the previously published peak identification.22,23
Data Analysis and Kinetic Reaction Model
We used MATLAB R2019b (The MathWorks, Natick, MA) for all data analysis to fit the data from the offline analytics to a kinetic reaction model adapted from Moosmann et al. 21 Specifically, we used the model including the inactivation reaction of the PEG reagent, omitting the reaction from di-PEGylated to tri-PEGylated lysozyme. The system of differential equations was solved numerically with the ode45 solver and lsqnonlin to minimize the difference to the experimental data. The Jacobian matrix calculated with lsqnonlin was used to calculate the 95% confidence intervals with nlparci. Based on irregularities in the pump rate, we excluded certain samples, which resulted in undefined dilution with stop solution.
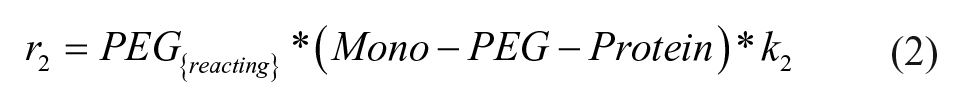
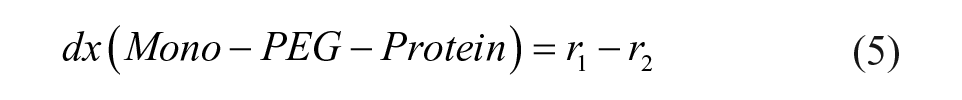
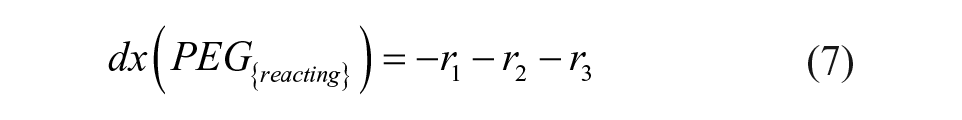
The definitions of reaction rates and the set of differential equations for the kinetic model lead to eqs 1–7. The initial conditions for the determination of the rate constants were the measured initial concentrations of protein and the set point for the PEGylation reagent.


Results and Discussion
Kinetic Modeling of the PEGylation Reaction
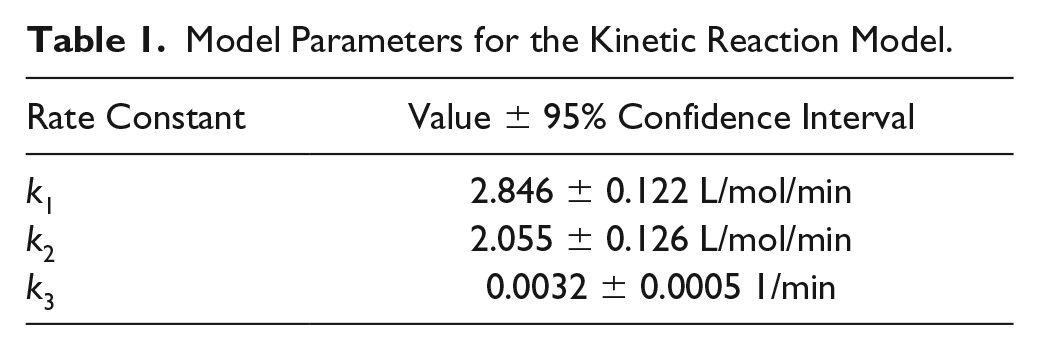
We fitted the data for the PEGylation reaction to the reaction model shown in eqs 1–7, yielding a regression coefficient of R2 = 0.871 across the four data sets. Table 1 shows the calculated rate constants. The 95% confidence intervals correspond to 4.3%, 6.1%, and 15.6% of the parameter value, respectively. As previously reported for the utilized kinetic model, k1 is larger than k2. A possible explanation for this observation may be that the di-PEGylated species originates from the mono-PEGylated species, and thus access to the surface of the lysozyme molecule is sterically hindered by the attached PEG molecule. 24 Rate constant k1 being larger than rate constant k2 is in line with previously published findings as well. Both are orders of magnitude larger than k3. We summarized these results in Figure 3 .
Model Parameters for the Kinetic Reaction Model.
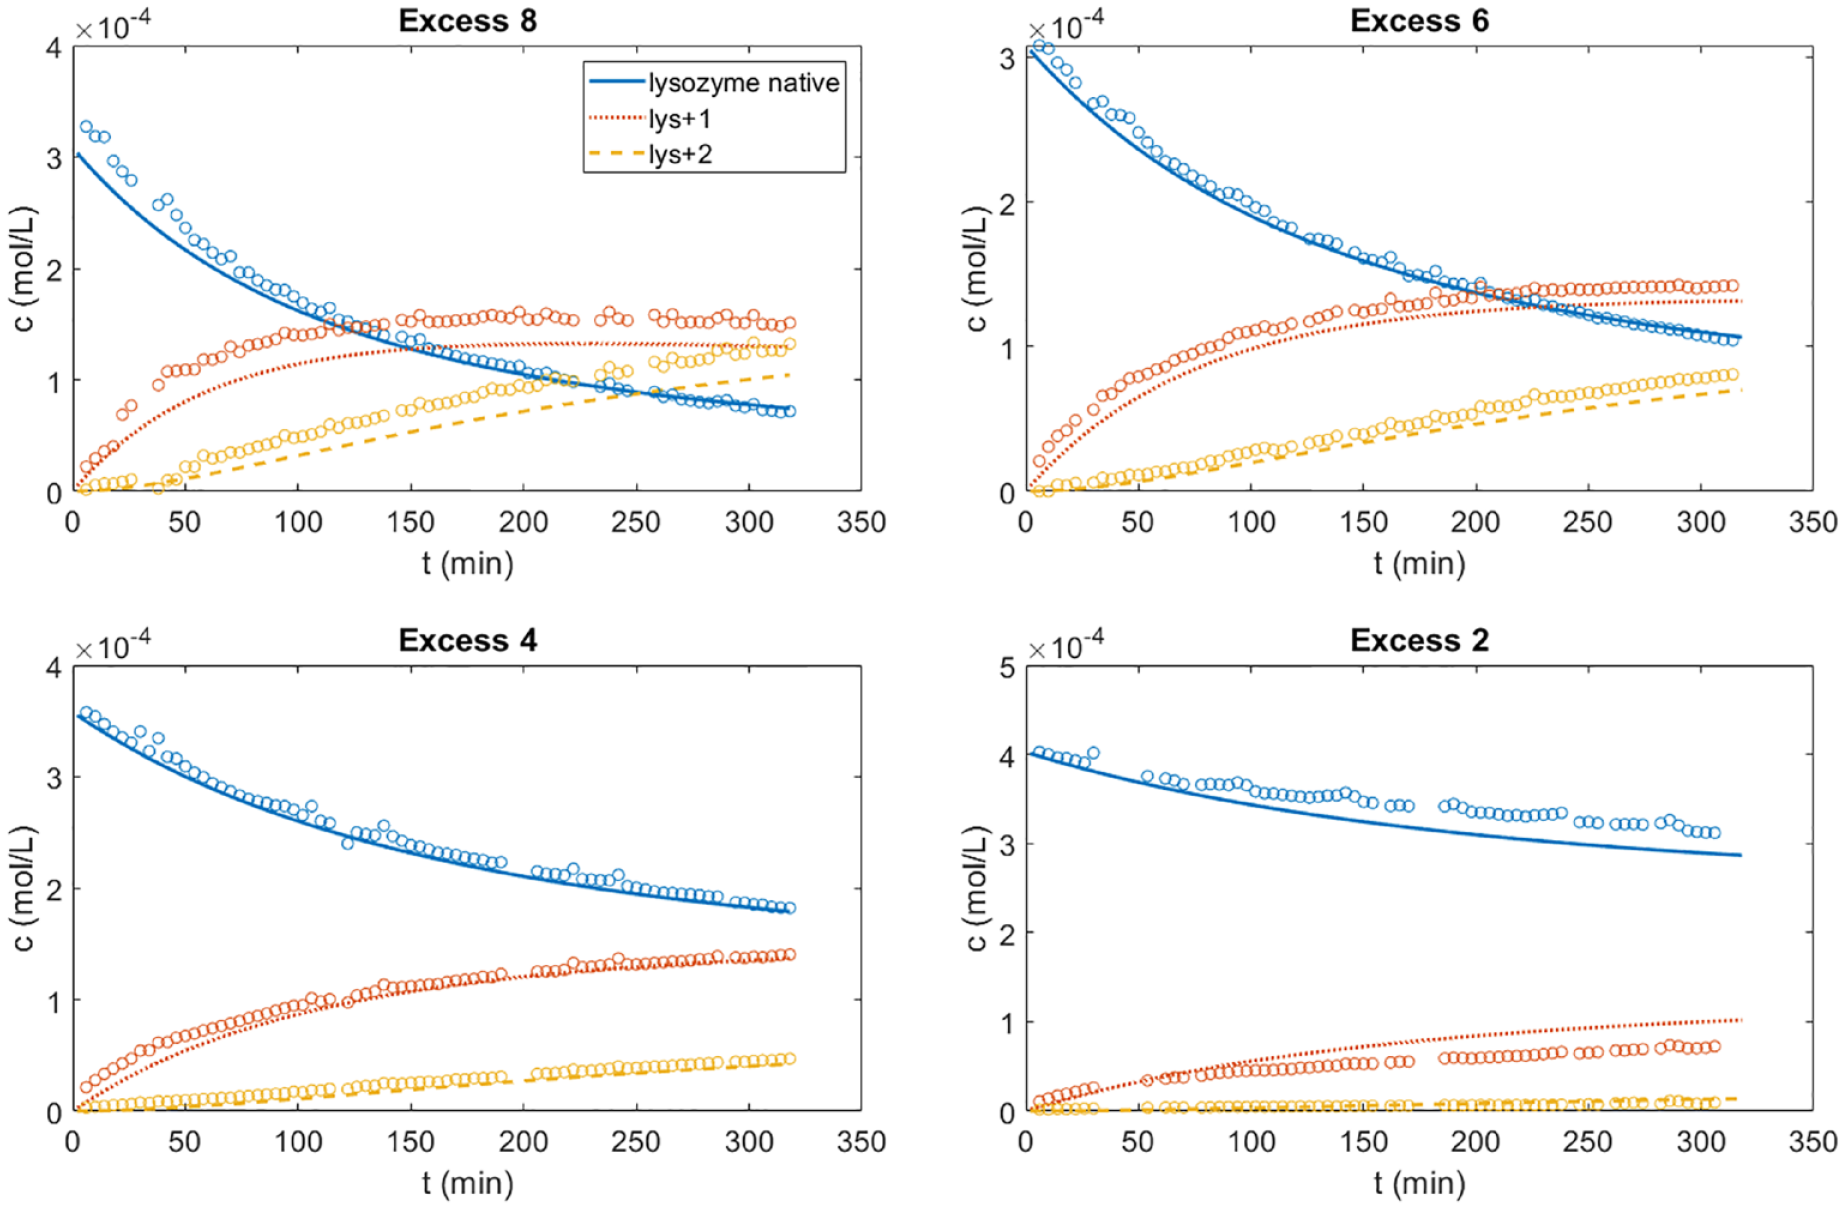
Results of the kinetic model. Shown in a comparison between the model response (solid, dotted, and dashed lines) and offline data (hollow circles) without excluded data points for the four calibration runs. The lines for lys+1 and lys+2 refer to mono- and di-PEGylated lysozyme, respectively.
Conclusion and Outlook
We were able to show that the proposed experimental setup enables the automation of sample acquisition from a batch reaction process. Depending on the limitations of pump accuracy and total reaction time, most reactions can be monitored using this setup, if the stop solution is stable at room temperature. Depending on the reaction at hand, it might also be of interest to change the instrument method in the chromatography setup to have the sampling frequency change over the course of the reaction under the assumption that the initial time steps will contain the most rapid changes in conditions. With modifications to the reaction vessel, it would also be possible to monitor heterogeneously catalyzed reactions by placing the catalyst in the reaction vessel. However, proper mixing of the solution needs to be ensured in this case. If the reaction at hand utilizes reactants that are more stable in solution, preparing the reaction solution from stock solutions might decrease errors associated with weighing small quantities.
Supplemental Material
Sanden_technology_brief_supplemental – Supplemental material for Modifying an ÄKTApurifier System for the Automated Acquisition of Samples for Kinetic Modeling of Batch Reactions
Supplemental material, Sanden_technology_brief_supplemental for Modifying an ÄKTApurifier System for the Automated Acquisition of Samples for Kinetic Modeling of Batch Reactions by Adrian Sanden, Sandra Haas and Jürgen Hubbuch in SLAS Technology
Footnotes
Acknowledgements
I would like to thank Sandra Haas for her assistance with the experimental work. I would also like to thank Sebastian Andris for his insights into implementing the reaction kinetics.
Supplemental material is available online with this article.
Declaration of Conflicting Interests
The authors declared no potential conflicts of interest with respect to the research, authorship, and/or publication of this article.
Funding
The authors received no financial support for the research, authorship, and/or publication of this article.
References
Supplementary Material
Please find the following supplemental material available below.
For Open Access articles published under a Creative Commons License, all supplemental material carries the same license as the article it is associated with.
For non-Open Access articles published, all supplemental material carries a non-exclusive license, and permission requests for re-use of supplemental material or any part of supplemental material shall be sent directly to the copyright owner as specified in the copyright notice associated with the article.