
Abstract
SpectroML, a markup language for ultraviolet-visible spectroscopy data, has been developed as a “Web-aware” mechanism for instrument-to-instrument, instrument-to-application, and application-to-application data interchange and archiving. This article documents the application of SpectroML to the interchange and archiving of measurement data from three spectrophotometers that are used in the NIST optical filter standards program. It describes how result data from the NIST national reference spectrophotometer and two commercial spectrophotometers are converted into SpectroML format and how SpectroML-formatted data and metadata are imported into the optical filter standards database.
Keywords
Ultraviolet/Visible Data Transfer Background and Problem
For several years, NIST has produced optical filter Standard Reference Materials (SRMs) for calibrating the wavelength and verifying the accuracy of the absorbance and transmittance scales of ultraviolet/visible (UV/Vis) chemical spectrophotometers. SRMs are materials that have been well characterized by using technologies or methods for specific chemical composition or physical properties. At the present, three absorbance filter SRMs are provided by NIST: SRMs 930, 1930, and 2031. SRMs 930 and 1930 are sets consisting of neutral-density glass filters. They are intended for use in the verification of the absorbance and transmittance of spectrophotometers in the visible spectral region. SRM 2031 is a set of metal-on-fused-silica neutral-density filters that are used in the ultraviolet as well as the visible spectral region. (More information about SRMs can be found on the NIST Website, http://www.nist.gov/srm; enter the SRM number in the SRM/RM Number text field and then click the “Go” button.)
Recently, NIST saw increasing needs for reference materials with well-defined traceability to national standards. To alleviate the workload at NIST, the NIST Traceable Reference Materials (NTRM) program has been developed to assist commercial vendors in offering certified reference materials. These reference materials must be traceable to the existing NIST measurement standards; therefore, NTRM vendors must send their calibration and certification data to NIST for evaluation.
Three spectrophotometers are used in the NIST optical filters program for certification and related measurements. All data from the certification and recertification measurements are preserved in both permanent hard copy and in electronic form. The electronic data are archived in the optical filters database to maintain the measurement history of all SRM filters.
In the past, instrument hardware provided result data in a stream of bits or bytes. The instrument application acquired and assembled this data stream and stored the result data by using its own internal proprietary format. The use of proprietary data formats often caused compatibility issues because it was difficult to share data with other applications. To store and interchange result data between applications, several common interchange and archiving formats such as JCAMP-DX, 1 –5 GRAMS SPC, 6 and ANDI/NetCDF 7 –12 have been developed. These formats enable the interchange process, but this requires instrument software or other software tools to support import and export functions. However, such interchange and archiving mechanisms have several drawbacks for the representation of data and their associated metadata. Some of these limitations are as follows: new data elements cannot be easily added, elements must have a precise order, and information may be lost during the conversion between different formats. The need to use a standard format that can handle data from a variety of instruments and applications has increased. This standard format must accommodate not only the result data but also their accompanying metadata and specific information about the measurement and the sample. 13,14
Concept of a Solution
To meet our needs for interchanging UV/Vis result data, we created SpectroML—an Extensible Markup Language (XML)-based markup language for instrument-to-instrument, instrument-to-application, and application-to-application interchange and archiving of UV/Vis molecular spectroscopy data and metadata. SpectroML improves the exchanging, processing, maintaining, and storing of measurement and sample data. It also satisfies the following requirements:
Extensibility: simple addition of new elements.
Flexibility: the structure satisfies manifold needs.
Usability: easy utilization of format in applications.
Acceptability: easy integration by standard mechanisms.
The vocabulary of SpectroML is based on standard chemistry and spectroscopy terminology and provides a way of expressing spectrochemical metadata and data. The SpectroML design approach builds on existing standards, instrument software, and data interchange formats. 13,14
SpectroML is a flexible, hierarchical, and extensible language for molecular spectrometry data objects. The entire data object is represented in a file, with both metadata and data tied through a powerful linking mechanism. Metadata describe the structure of the data set. They are identified in the file as string literals (or
The tags describe the specific data content. Named attributes are found in the tags that provide additional data about the element. The above example describes an instrument in terms of its wavelength range coverage. The instrument's minimum and maximum wavelength ranges are described with the name tags
More detailed information about SpectroML can be found in NISTIR 6821. 14
To facilitate the conversion of native instrument data formats into SpectroML, a set of Application Program Interfaces (APIs) was developed. Our internal application called for transferring result data from three spectrophotometers to a result database. Converter programs to transform the native data from each model of spectrophotometer (the NIST-built High Accuracy Spectrophotometer [HAS II] and commercially built instruments: PerkinElmer Lambda 900 and Agilent 8453) to SpectroML were written. Finally, a single routine to import SpectroML data into the result database was created.
The following sections show how spectrometric native data from various spectrophotometer instruments have been transformed into SpectroML files, which configuration parameters and maintenance information are required for the converting process, how a SpectroML file is created, and how the transformation is technically implemented. Also, the process of transferring SpectroML data into the optical filters database is described. See Fig. 1 for a graphic depiction of this outline.
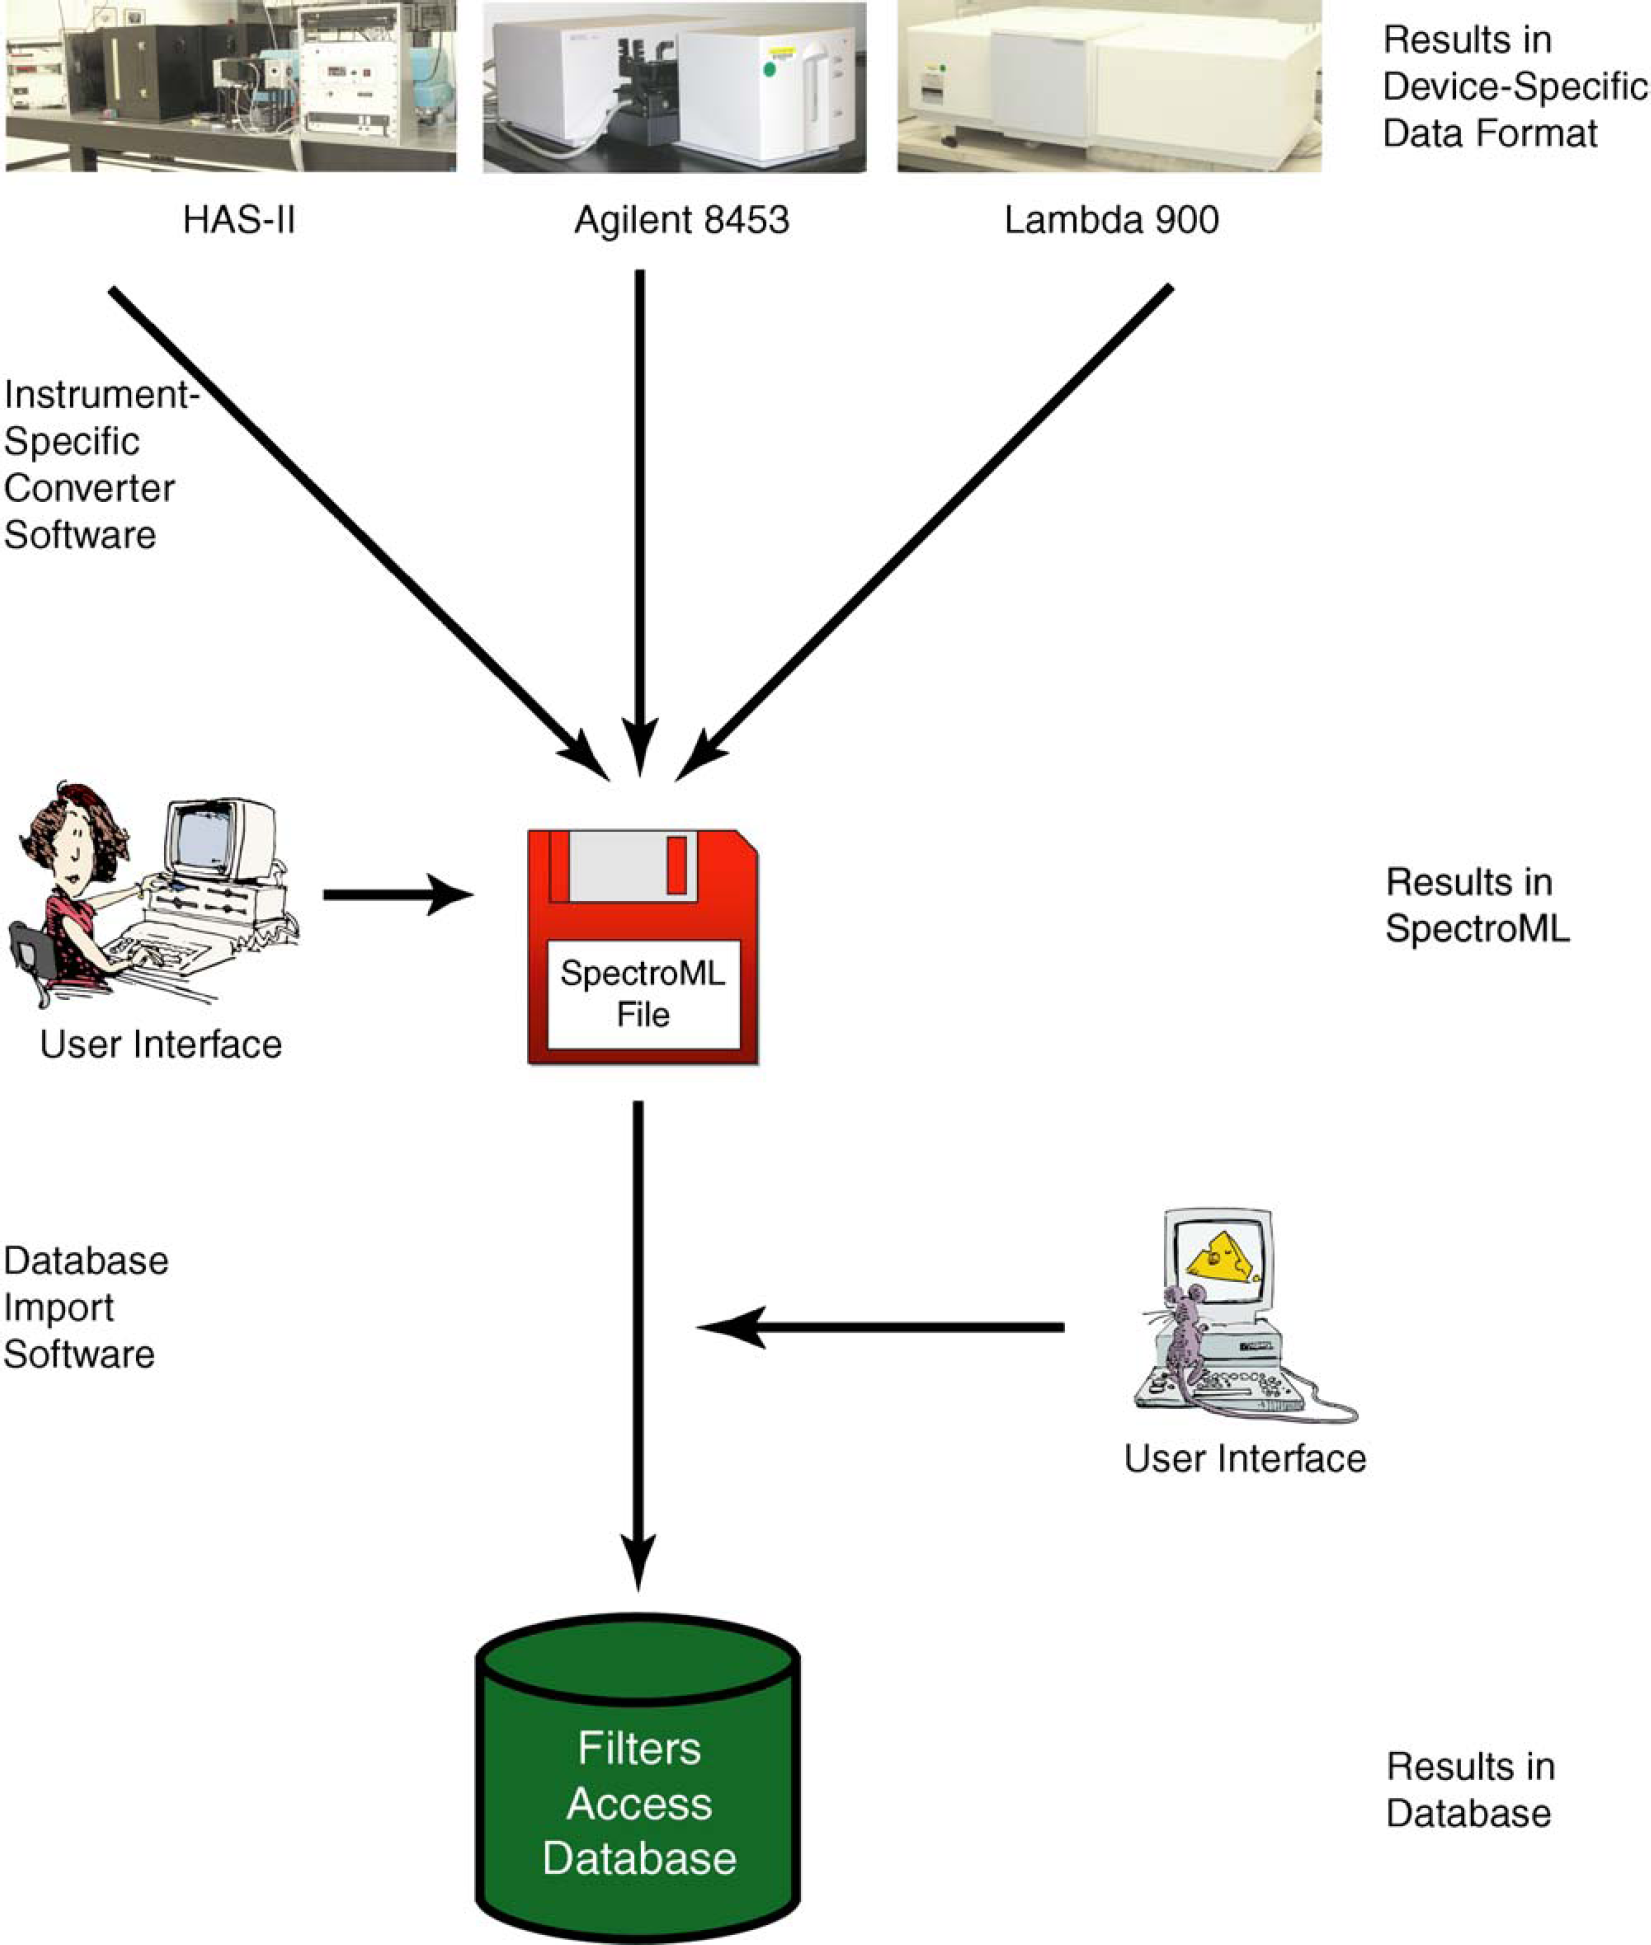
Concept: structural overview.
High-Accuracy Spectrophotometer
The high-accuracy spectrophotometer (HAS II) is a single-beam instrument. It contains several components: a selectable radiation source, a monochromator, a sample holder, a system to verify the accuracy of the transmittance measurements, an integrating sphere-photomultiplier unit connected to a digital voltmeter, and a data acquisition and display system.
The implementation of the HAS software is based on a set of LabView subroutines. Before a test operation is conducted, a description script containing parameters (e.g., information about wavelength set, transmittance set, number of repeat samplings, and so on) must be created. 15
Generally, each transmittance measurement is repeated three times within a run. After a measurement run is completed, a report will be created to record all data describing the apparatus and experiment. The high-accuracy spectrophotometer is supported by a Microsoft Access database to archive all transactions and measurements. Reports (or at least one report) will be stored in tables—Configuration, WavelengthSets, and ResultsResults—in the Access database. The Configuration table contains configuration information for the operation of the HAS II apparatus.
The WavelengthSets table contains the set of wavelengths used for each type of sample (SRM, calibration lamp, and so on). The Results table contains experimental data collected by the HAS apparatus. These three tables are assembled in the Access database,
An archived database file can contain one or more sets of experiments. Each experiment is identified with the time stamp of the performed measurement. Certain data needed for generating a SpectroML file from the archived database file can be extracted through Java Database Connectivity (JDBC). These are SRM filter set type, identification of the sample, date and time of the performed measurement, information about wavelengths, and the measured transmittance values.
Most, but not all, of the data describing the measurement environment are available in the archived database; some of the metadata are entered through the user interface (Fig. 2).
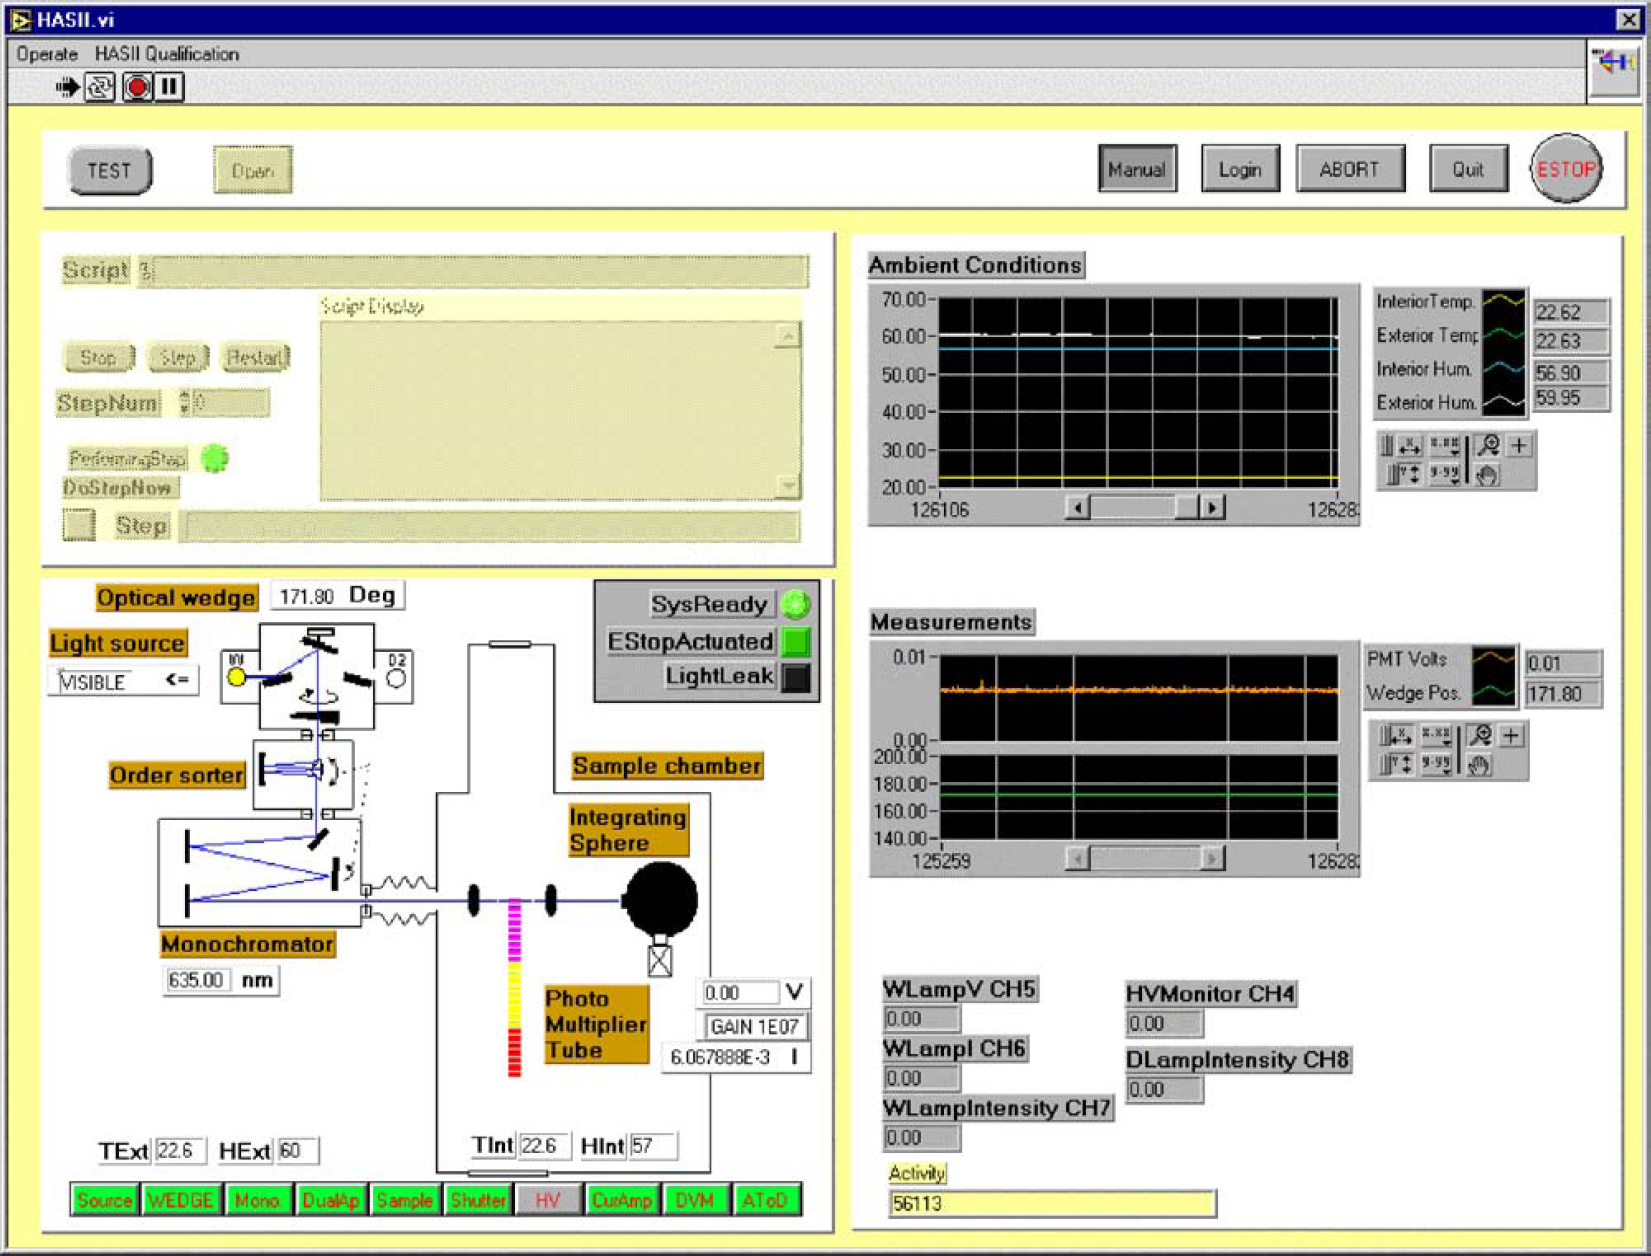
Control panel containing the user interface to the HAS.
To effect the transformation from native spectrophotometry data formats to SpectroML files, a set of NIST-built SpectroML-Application Program Interfaces and the Sun One Studio IDE (Integrated Development Environment) are used. Sun One Studio IDE provides tools to develop and deploy components and applications for Java technology. Java, developed by Sun Microsystems, Inc., is an object-oriented language that includes a set of libraries that facilitates cross-platform development. 16
Agilent Spectrophotometer
The Agilent 8453 is a single-beam, diode-array spectrophotometer. 17,18 It uses two light sources—deuterium and tungsten lamps—and a 1024-element diode array. Currently, UV-Visible ChemStation A.09.01(76) is the instrument control software that is provided by the manufacturer. To perform a sample measurement, first a method must be set up for the software system. A method is a set of parameters that defines the analysis of a sample. Its definition includes a description of the method, instrument, and acquisition parameters and the data analysis parameters. In the Standard mode, after the method page (Fixed Wavelengths Parameters dialog) is opened, the wavelengths of interest are entered (Fig. 3). The wavelength range for spectral display is also entered. In the Data Type section,
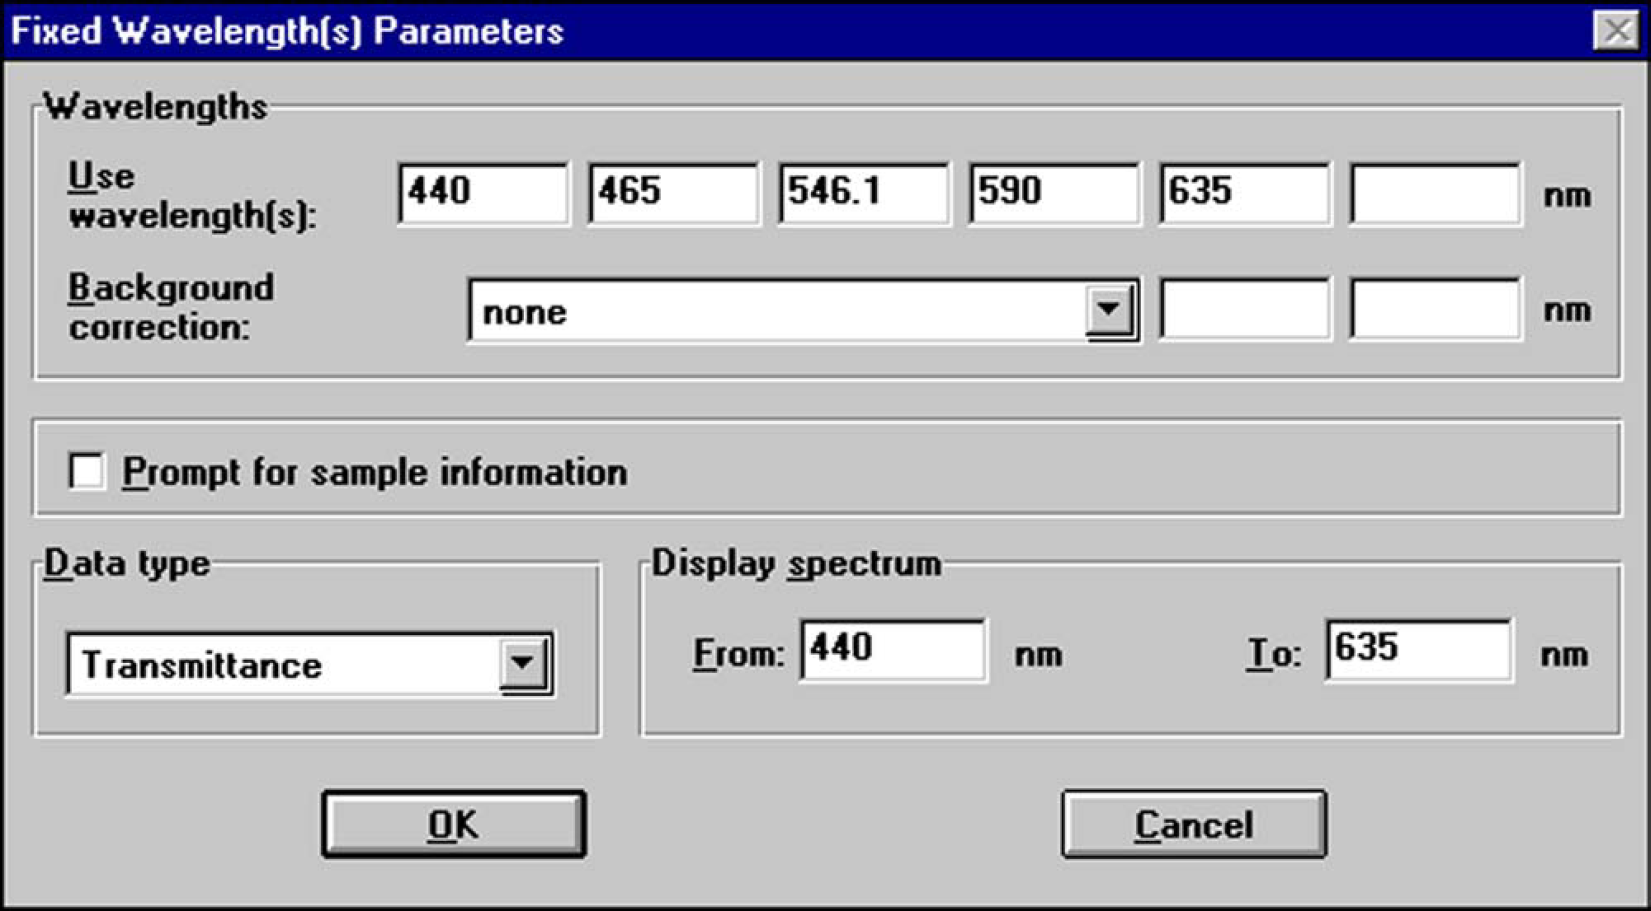
Method window.
To be able to repeat an analysis, parameters can be stored permanently to disk. The parameters are stored as a method file with the extension.
Use of a method alone allows measurements from just one sample to be obtained. To run automatic analyses of a series of samples, an automation table is launched. The automation table (Fig. 4) is a program defining the order of the procedures that will take place during the analysis. To use the automation table, the advanced module must be in use. When the advanced software is started, the default automation table is loaded into memory; this table is initially empty. However, completed automation tables can be saved to disk and recalled for reuse. The current automation table is held in a register called Automation that contains the following information about the automation table:
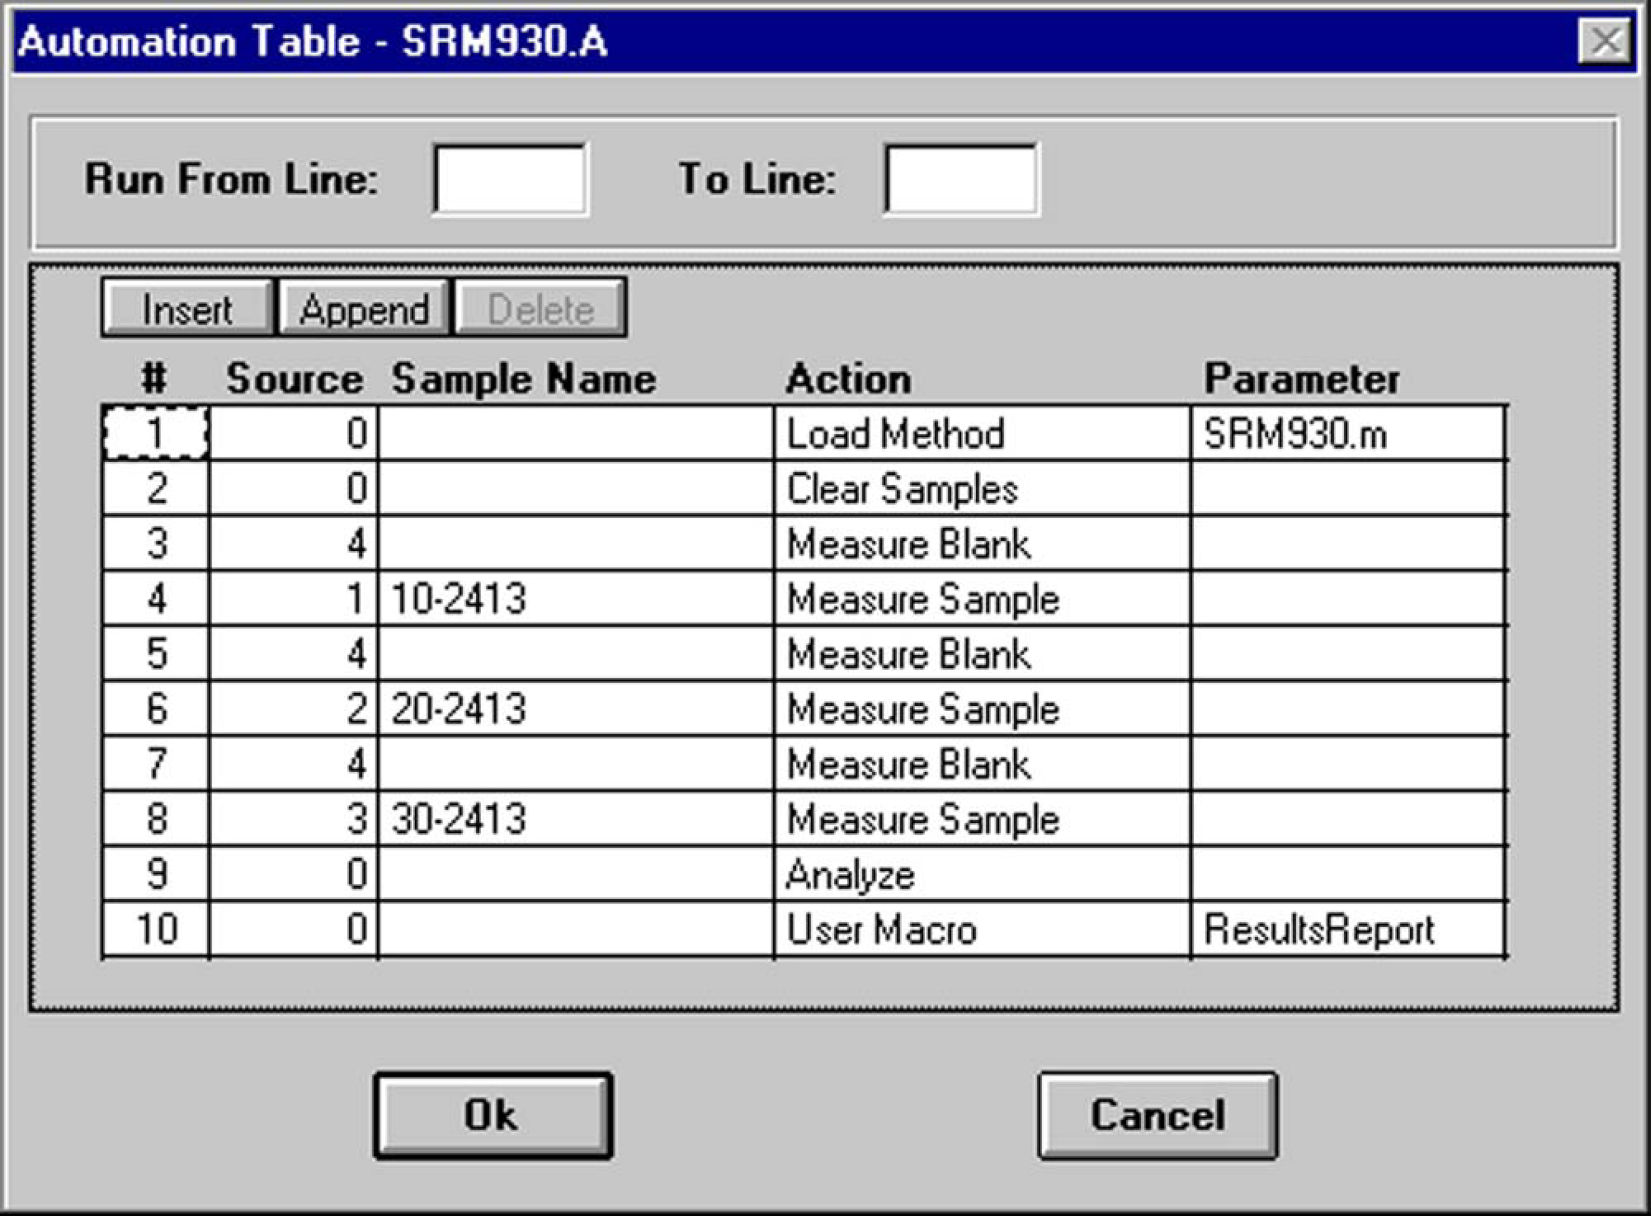
Automation table.
The
The
The
The parameter column of the automation table must contain the names of the method file and the macro that enables the results report text file to be printed.
To achieve accurate transmittance data values, multiple measurements of one sample are conducted. Typically, three cycles of sample measurements will be performed. Every sample name must be entered in the automation table for each measurement cycle needed. We have developed a macro to avoid typing sample names several times. This macro propagates the user-entered sample names as desired.
All standard files associated with the Agilent ChemStation, both software and data, are in binary format and therefore cannot be accessed (neither viewed nor edited) by using standard text editing programs. Therefore, it is necessary to find a tool to acquire desired data in ASCII format that are needed for creating a SpectroML file. The
After a measurement has been completed, the results report file is automatically created. The report file contains information about instrument, sample, date, time, and wavelength and the analysis values for the sample, and so on.
Unlike the case with the HAS instrument, only some metadata are available through the results report; the remainder must be added by using a user interface. The implementation of the converter program is supported by the set of NIST SpectroML APIs and the Sun One Studio IDE.
PerkinElmer Spectrophotometer
The Lambda 900 is a research-grade spectrophotometer operating in the ultraviolet (UV), visible (Vis), and near-infrared (NIR) spectral ranges. 19,20 The spectrometer features a double-beam, double-monochromator, ratio-recording optical system. PerkinElmer's UV WinLab 3.00.03 is a Windows-based software application used currently to control the spectrometer and manage, process, and extract information from the spectra collected.
Like the Agilent UV-Visible ChemStation, the Perkin-Elmer UV WinLab software is operated by using methods and supports multiple types of methods. When the UV WinLab software starts, the Methods window is displayed. To create a new method, the required method type is selected from the Application menu. Although spectral scans and discrete wavelength data can be used, and both are compatible with SpectroML, the Wavelength Program type is used here to produce data for the SRM database. The appropriate Method Editor window is displayed for the required type of method. After the various parameters needed (instrument parameters, sample parameters, and so on) have been set, the method is stored on the hard disk for reuse. UV WinLab permits sample names to be entered once, and the number of measurement cycles is then selected as desired. While conducting the sample analysis, the results of the measurement are displayed in the Results window. The software provides a function that enables automatic printing of these measurement data to a file in ASCII format with the extension
The procedure used to create a SpectroML file in the PerkinElmer spectrophotometer is similar to that for the Agilent instrument. Because the PerkinElmer instrument does not provide all information needed for the generation of a SpectroML file, some metadata about the instrument, sample, and measurement information are entered in through a user interface. Unlike the approach for the Agilent, the parameters that have been entered on the method page (Fig. 5) are stored in a separate file with the suffix
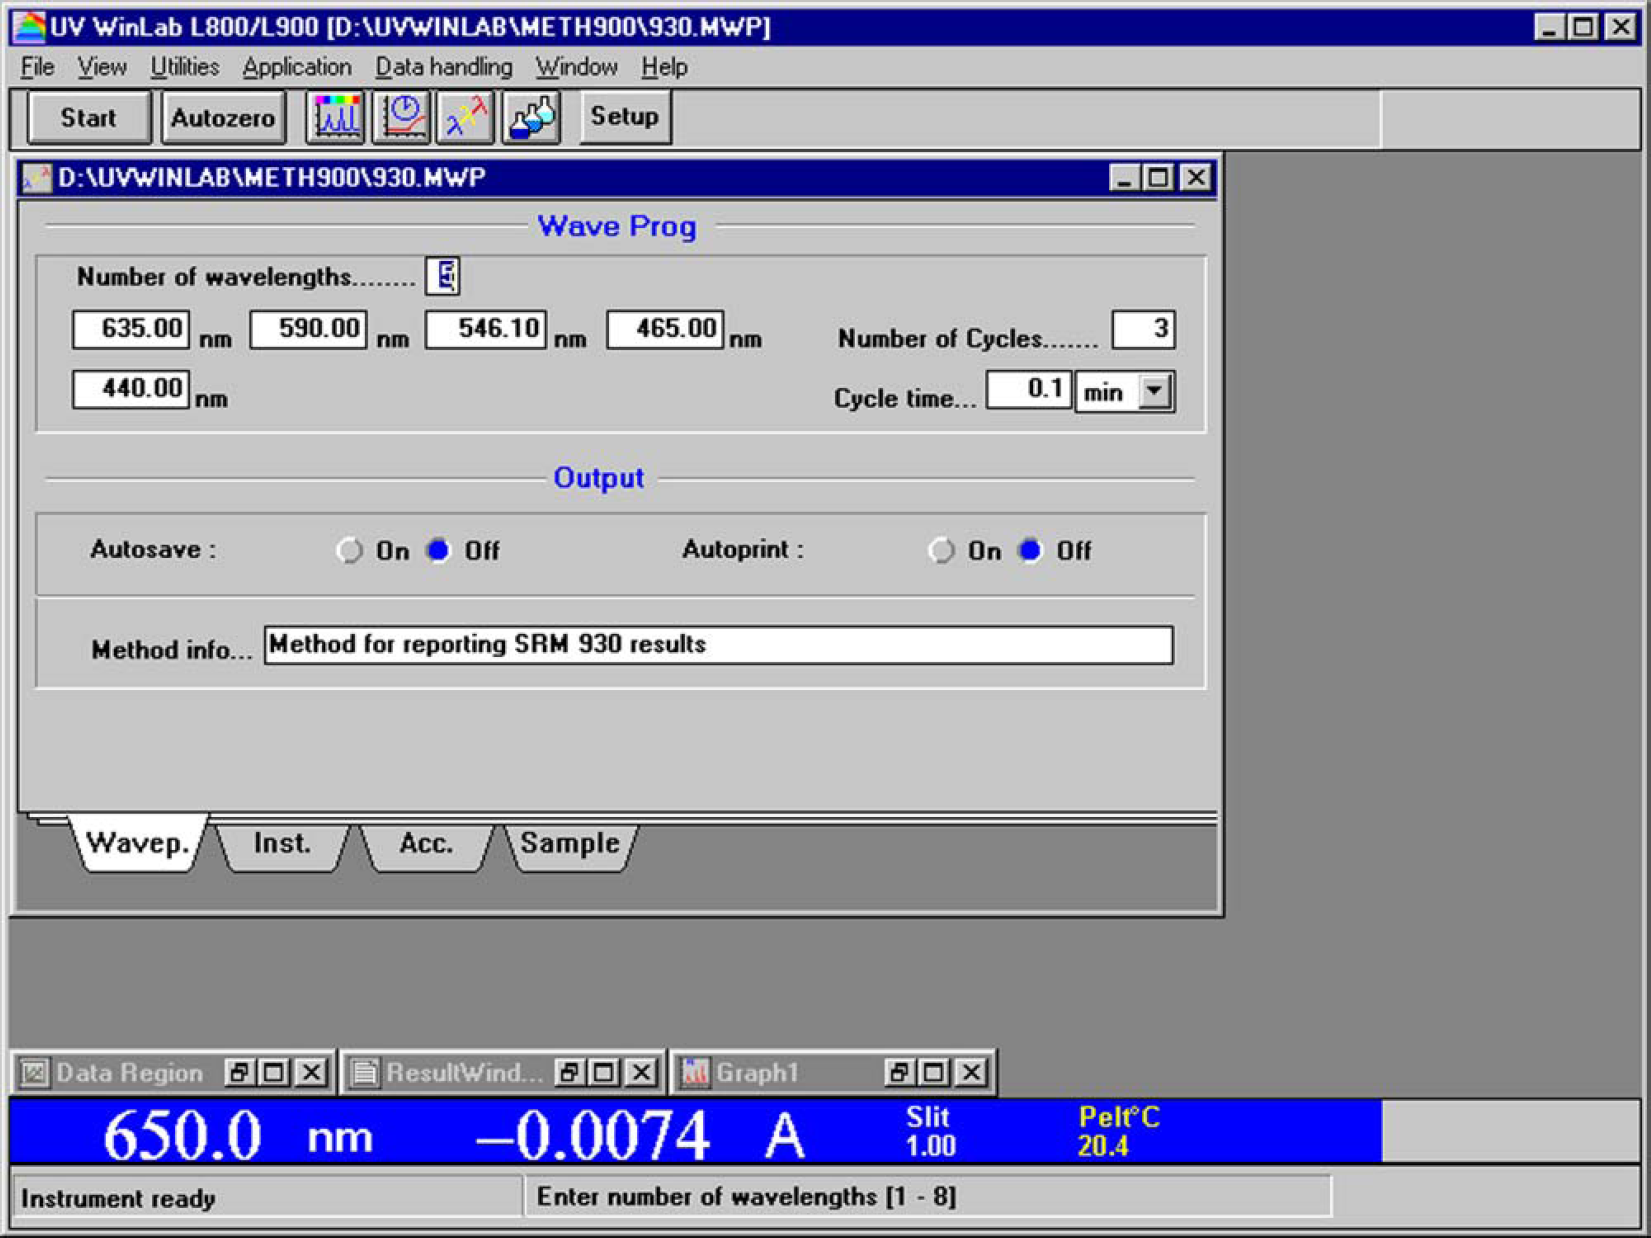
Method page.
It should be mentioned that the measurement of the neutral-density filter type SRM 2031 must be conducted in two stages. Because SRM 2031 requires calibrating the wavelength in the ultraviolet as well as in the visible, 10 wavelengths are certified. However, with the
The technical implementation of the converter program for the PerkinElmer instrument is analogous to the one for the Agilent, including a set of NIST-created SpectroML APIs and the Sun One Studio IDE.
Importing Spectroml Data into an Access Database
Over the years before the SpectroML launch, the procedure for entering experimental data into the optical filters database required a patchwork of macros, floppy disk transfers, and even a Fortran-based converter. By using NIST's new technique, metadata and result data from spectrophotometric instruments are converted into SpectroML files, and then the SpectroML file is imported into the database. This approach to transferring measurement data in the optical filters database is more simple. Most of the data needed for the certification and recertification report are extracted from the SpectroML file. These data elements are as follows: instrument name, filter SRMs, nominal transmittances, filter set identifier, certified wavelengths, transmittance values, customer information, and measurement types. Information about the first six data elements is obtained from the SpectroML file. The remainder is created through the user interface.
The instrument name is obtained from the instrument group. It is found in the “model” element of the SpectroML file. The name of the instrument is called HAS II, Lambda 900 UV/VIS/NIR, or HP 8453.
SRM designations are obtained from the sample group in which the
The SRM 930 and 1930 filters are certified at five visible wavelengths: 440 nm, 465 nm, 546.1 nm, 590 nm, and 635 nm. Because SRM 2031 is used for verification both in the UV and the visible, there are 10 wavelengths needed: 250 nm, 280 nm, 340 nm, 360 nm, 400 nm, 465 nm, 500 nm, 546.1 nm, 590 nm, and 635 nm.
A customer is a company or an organization that returns SRM filters to NIST for cleaning and verification of the transmittance density and transmittance values. Customer information is available in the database if the user company has been a NIST customer in the past. Otherwise, it must be entered through the user interface.
In the same way, information about measurement types is obtained from the user interface. There currently are four measurement types defined: precertification, certification, “as-received” for recertification, and “after-cleaning” for recertification. Neutral-density filters are subject to a slow drift in the transmittance or absorbance. It is necessary to conduct spectrophotometric measurements on the filters over a 6-month interval for the aging protocol. Precertification measurements are performed during the mandatory 6-month process to determine the aging and stability acceptance of the filters. Once the drift value at all certified wavelengths has been found to be acceptable, the filter is qualified for the final certification measurement. Filter SRMs must be recertified every 2 years for quality assurance purposes. The recertification process involves two measurements on the filter set. The first measurement is made on the filter set in as-received-for-recertification state. After cleaning, the second measurement is performed in after-cleaning-for-recertification condition.
The filter set identifier is the identification number for a filter set on which a measurement is conducted.
The data of nominal transmittance, filter set identifier, certified wavelengths, as well as transmittance values are obtained from the data group. They are located in the “dataCore” element.
To import SpectroML Data into the optical filters database, a set of NIST SpectroML APIs and JDBC were used. JDBC is the programming interface allowing Java programs to access SQL (Structured Query Language) database manipulation and update commands. It permits the integration of SQL calls into a general programming environment by providing library routines that connect with the database. JDBC has a robust collection of routines that make such an interface simple and intuitive. The interface is both database and platform independent.
specifying the JDBC Driver
establishing a connection
creating a JDBC PreparedStatement object
supplying values for PreparedStatement parameters
executing INSERT statement
disconnecting from the database:
retrieving Exceptions
Application of the System
Once we have the data in the filters Access database, we can check the calibration and verification history of a single filter. These data also are used to look for instrumental problems and possible measurement errors. The stability and the performance evaluation of returned filter sets for recertification can be determined, and the aging of filters, as well as results of the precertification measurements, can be inspected. It is possible to identify and track filters and to compare measurement data over all conditions. Because a standard filter set is measured with every experimental run, the performance of a spectrophotometer may also be monitored. In the future, we can check the performance of NTRM filters, personnel, and instrumentation, as well as compare results from various instruments.
Conclusion and Future
In the past 2 years, NIST's use of SpectroML has advanced from limited applications to a major tool. SpectroML has proven its utility in effecting molecular spectrometry data interchange to help the NIST SRM and NIST Traceable Reference Materials (NTRM) programs by interchanging UV/Vis spectroscopy data with the private sector and other national metrology institutes (NMIs). SpectroML has been applied to solve prior data interchange issues among various instruments and applications. By using SpectroML and the Java programming language, the process of storing measurement data into the optical filters database has been facilitated.
The SpectroML description, definition, and data dictionaries were built on existing standards, instrument software, and data interchange formats. Initially, SpectroML was a markup language that was developed for UV/Vis spectrometry. However, after demonstrations of SpectroML's advantages, ASTM Subcommittee E13.15 has begun creating a new markup language for analytical spectroscopy and chromatography measurement data. This new Web-aware language is being called the Analytical Information Markup Language (AnIML). AnIML is being based on SpectroML and Thermo LabSystems' GAML (Generalized Analytical Markup Language) with ingredients from JCAMP-DX, 1 –5 Andi, 7 –12 and other existing, well-established data dictionaries and ontologies. Information about the AnIML project can be found on the http://animl.sourceforge.net Website.
The hope is that this new markup language for analytical spectroscopy and chromatography data will be developed within a short time. AnIML may provide a powerful Webaware standard format that satisfies the requirements for presenting a wide range of data in a reasonable, useful way. Moreover, AnIML will help ASTM Subcommittee E13 to fulfill its responsibility in defining standards for representing, managing, and interchanging analytical chemistry data.
Disclaimer
Certain commercial equipment, instruments, or materials are identified in this paper to foster understanding. Such identification does not imply recommendation or endorsement by the National Institute of Standards and Technology, nor does it imply that the materials or equipment are necessarily the best available for the purpose.
Acknowledgments
This project is funded (in part) by NIST's Systems Integration for Manufacturing Applications (SIMA) Program. Initiated in 1994 under the federal government's High Performance Computing and Communications effort, SIMA is addressing manufacturing systems integration problems through applications of information technologies and development of standards-based solutions. With technical activities in all of NIST's laboratories covering a broad spectrum of engineering and manufacturing domains, SIMA is making information interpretable among systems and people within and across networked enterprises.