
Abstract
Next-generation sequencing technology requires amplified, short DNA fragments with known end sequences. Samples must undergo processing steps, including extraction and purification of genomic DNA (gDNA), fragmentation, end repair, adapter ligation, and amplification, to prepare a sequencing library. The process of sample preparation requires careful control of temperature and buffer conditions, as well as the stringent removal of contaminants. As a result, library preparation methods are often plagued by sample loss, long protocol times, numerous manual steps, and high cost. We attempt to understand and optimize each step of sample preparation on a microfluidic platform using magnetic bead motion through channels containing immiscible phases. Our platform integrates all steps associated with library preparation with no buffer exchanges and utilizes just 30–60 µL of reagents. Our chip shows a sixfold improvement in yield compared with an affinity spin column when capturing gDNA from samples of ~50 ± 4 MCF-7 cells. Finally, we show whole-genome shotgun sequencing results from 660 pg of human gDNA, in which >93 ± 1% of reads map to a reference genome at or above 99.9% confidence, matching a commercially available sample preparation kit optimized for low-cell-count samples.
Introduction
Rapid sample preparation from low-cell-count tumor samples will enable simple genomic analysis revolutionizing clinical diagnosis, prognosis, and personalized medicine via targeted treatments. Sample processing refers to the series of steps needed to go from cells to molecules fit for sequencing. First, genomic DNA (gDNA) needs to be extracted from cells, which requires disruption of the cellular and nuclear membranes, and exclusion of cellular debris, which can inhibit downstream reactions. Then, by either a mechanical, chemical, or enzymatic process, the gDNA needs to be fragmented into a size range determined by the read length of the sequencer being used. For example, the predominant form of sequencing from Illumina (San Diego, CA) performs a 150-base-pair read from either end of the molecule. After being fragmented, an adapter sequence needs to be attached to the ends of the molecules. These are used for multiplexing, for attachment to the sequencer’s flow cell, and for the next step, amplification. Amplification is performed to improve the yield of sequenceable molecules in order to improve depth of coverage. This is typically done via a limited-cycle PCR.
The use of sequencing, both clinically and in research, is hindered by practical concerns. The current workflow for generating sequencing data is complex, with multiple steps during postsequencing data analysis and presequencing library generation imposing bottlenecks on the workflow. Many strategies are currently being employed to circumvent the rigors of sample preparation. Robotic liquid handlers have been employed by most sequencing centers, but are expensive, use a large volume of reagents, and are difficult to program, setting a high barrier of entry that can be prohibitive for smaller labs. Hands-on library preparation is cheaper, but is labor-intensive and not reproducible. Manual techniques are also dependent on large reagent volumes and are vulnerable to cross-contamination when attempting to multiplex.1,2 A comprehensive comparison of commercially available library preparation kits3,4 has demonstrated a correlation between the overall number of steps and the total amount of hands-on time, overall amount of time, and lower yield due to the additional number of wash steps. Kits like Qiagen’s REPLI-g Single Cell kit (Qiagen, Hilden, Germany) and the GenomePlex single-cell kits have been shown to work well with single cells, but take 4 and 16 h, respectively, to generate their libraries. 5 Recently, the use of modified transposases has integrated the steps involved in gDNA fragmentation and adapter ligation into a single step. This has reduced the total number of steps from ~20 to ~8. However, yields remain low when dealing with smaller DNA inputs from lower-cell-count samples.
Microfluidic DNA extraction has enabled an alternate means of automating library preparation, but still requires specialized training and equipment.6,7 Digital microfluidics 8 has emerged as a popular means of manipulating microfluidic volumes but limits the buffer compositions that can be used and is dependent on a complex array of electrodes, making it difficult to use and integrate multiple sequential reactions. Furthermore, it can typically only manipulate volumes in the range of a couple microliters or lower. Droplet-based microfluidics suffer from other limitations imposed by their design. The small droplet size and resulting high surface area to volume ratio limit the volumes of reagents used and can result in the adsorption of reagents onto the oil–water interface. This is of particular concern for proteins, such as enzymatic reagents, due to their amphiphilic structure. Furthermore, because droplet formation kinetics are so sensitive, flow rates must be tuned on a chip-by-chip basis, making their use complex. Active-valve microfluidic chips are reliant on complex fabrication and operation. Even chips with easier-to-fabricate valve systems are still reliant on infrastructure like syringe pumps, multiport and pinch valves, and resistors. 7
Microfluidics has also been applied to sample preparation from low-cell-count samples for chromatin immunoprecipitation sequencing. However, these methods utilized oscillating microfluidic liquid flow over magnetically parked bead aggregates for cleanup steps. Hence, they requires large quantities of liquid for efficient cleanup of beads.9–11
In this work, we introduce a new microfluidics workflow as shown in Figure 1 . The microfluidics chip consists of three passages of oil-filled channels separating four fluid reservoirs consisting of aqueous buffer. The microchannels are filled with oil to provide a phase separation of different fluid contents in the reservoirs.12–15 A magnet external to the chip is used to manipulate the paramagnetic beads in the chip that transport targeted molecules. The magnetic particles are driven from one reservoir to next to provide a single-motion separation between bound (target) and unbound (undesired) molecules. The oil channels serve as interfacial barriers separating sequential steps and as a means of washing samples as a side effect of surface tension. The reaction chemistries are loaded in the reservoirs and, upon completion of those reaction steps, the desired molecules are immobilized on paramagnetic particles through addition of binding buffers. The whole chip is placed on a constant-temperature heat block. The platform does not require any membranes, external pumps, voltage gradients, or valves. The platform can be adapted to automation for ultrahigh throughput.
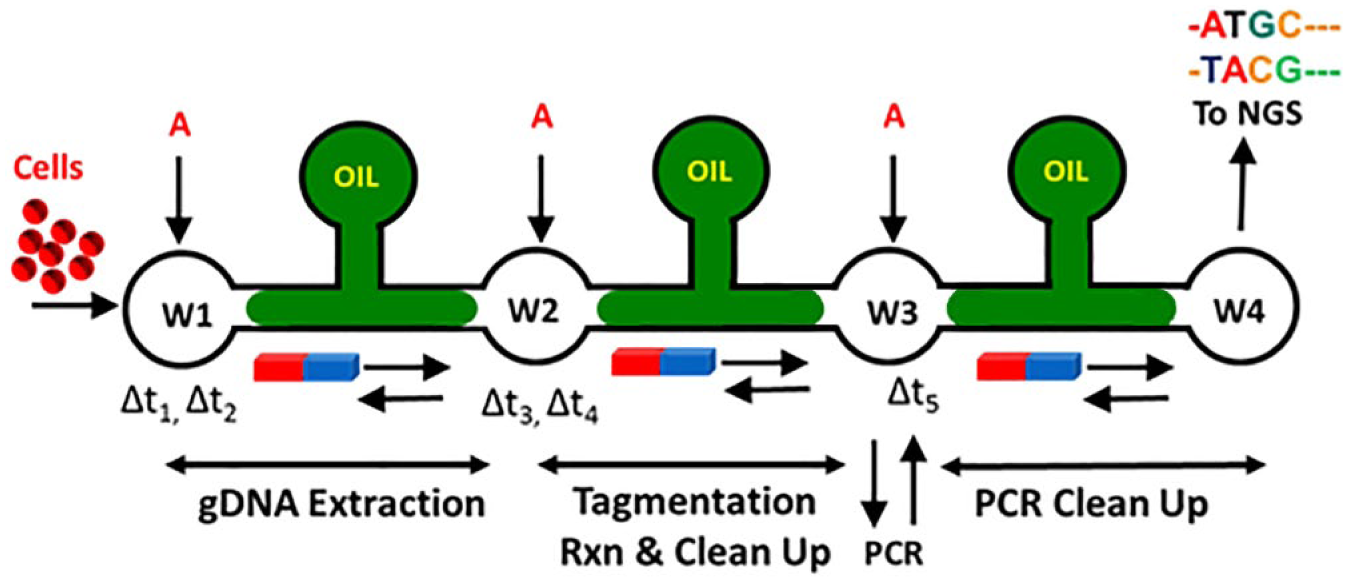
Schematic of microfluidic workflow. Reservoirs contain 5 µL of water or aqueous buffer (W1–W4). Cells are added to W1 and incubated for Δt1 = 5 min. A total of 11 µL of reagent A (magnetic beads and binding buffer) is added and incubated for Δt2 = 5 min. The beads are moved to W2. DNA elutes from the beads in reaction buffer. DNA fragmentation and adapter ligation during Δt3 = 5 min at 55 °C. A total of 11 µL of reagent A is added and incubated for Δt4 = 5 min. The beads are moved to W3. DNA elutes from the beads into water. DNA is moved out of the chip for PCR amplification and then moved back to W3. A total of 15 µL of reagent A is added and incubated for Δt5 = 5 min. The beads are moved to W4. DNA elutes into water in W4 and the beads are moved back to W3. The DNA library is ready for sequencing. Oil channels separating wells are 11 mm long × 1 mm wide ×100 μm deep; wells are 2 mm in diameter. The total dimensions of the chip are 44 × 15 mm.
Materials and Methods
Polydimethylsiloxane Chip Fabrication
An AutoCAD-designed master mold was used to create polydimethylsiloxane (PDMS) microfluidic platforms ( Fig. 1 ). Sylgard 184 elastomer base was vigorously mixed at a 1:10 ratio with curing agent and then degassed for 1 h in a vacuum chamber. The mixture was then poured into the mold and incubated at 70 °C for 1 h. The PDMS was removed from the mold and a 3 mm internal diameter hole punch was used to make holes in the reactor to form the reservoirs. Subsequently, a 1 mm thick glass slide and the PDMS were cleaned with methanol, dried with nitrogen, and treated with a plasma wand at high radiofrequency for bonding. The slide and PDMS circuit were pressed together, forming an irreversible bond between the two. Finally, the microchip was incubated for 30 min at 70 °C. The fluid reservoirs and microfluidic channels were then cleaned by flushing the channels with nuclease-free water and drying the channels with dry nitrogen gas. The flushing and drying process was repeated three times. An oil–water interface was then created by pipetting 10 µL of castor oil in the central well. As the oil diffused through the channel and reached the edge of the two side wells, 10 µL of priming solution (17:2:1 nuclease-free H2O/0.1% Tween 20/bovine serum albumin [BSA]) was quickly pipetted into each well. The primed chip was then covered in parafilm to prevent contamination and evaporation and incubated overnight at 4 °C. It was observed that, once primed, the interface has a shelf life of about 2 days before the interfaces begin collapsing. We found optimal concentrations of 0.01% Tween 20 and 1 mg/mL BSA, but the chip tolerated onefold increases or decreases in BSA. Cylindrical nickel-coated neodymium magnets, 10.05 mm (diameter) x 25.40 mm (height), rated at a 32.749 pull force, were used to manipulate the beads on the chip (part Cyl0751, Super Magnet Man, Pelham, AL).
Oils Used
Several types of commercially available oils were tested: castor oil (part 259853-250ML, Sigma Life Science, St. Louis, MO), Filippo Berio extra-light tasting olive oil, and a surfactant-enriched fluorocarbon oil, Spheri Fluidics Pico-Surf 1 (2% in FC-40).
Cell Culture
MCF-7 (ATCC HTB-22) cells were expanded in Dulbecco’s modified Eagle’s medium (DMEM)–high glucose (Thermo Fisher Scientific, Waltham, MA) supplemented with 10% fetal bovine serum (FBS) (GE Healthcare, Little Chalfont, UK) and 1% penicillin/streptomycin. MCF-7 cells were used between passages 12 and 16 and cultured at 37 °C and 10% CO2.
Quantifying Cell Samples
Low-cell-count samples of MCF-7 were used to assess chip performance. Cell cultures were diluted serially in culture media. Samples of approximately 10, 20, and 50 cells were created (N = 40). Twenty of the samples were counted via bright field cytometry. The accepted figure of 6 pg of gDNA per cell was used to generate expected yields from each sample. There was a distribution of cell counts for each of the samples, which was factored into the expected yield from each sample.
Design of Beads and DNA Binding Buffer
Critical to the function of the chip was the ability to rapidly immobilize and release DNA of various molecular weights from the paramagnetic beads, thereby allowing transport through the oil phase. Carboxyl functionalized polystyrene/iron particles with diameters around 1 ± 0.2 µm were purchased from Beckman Coulter (Agencourt AMPure XP, Brea, CA). These paramagnetic beads were suspended in a high-salt, polyethylene glycol (PEG) buffer. Varying the concentration of PEG in the DNA binding reaction allowed tuning of the molecular weight range of DNA adsorbed onto the bead’s surface.
Affinity Column DNA Extraction
A Qiagen gDNA clean and concentrator kit was used as the gold standard affinity column for DNA extraction. A 2:1 ratio of the provided binding buffer was used for gDNA capture, and a 5:1 ratio was used for PCR cleanup. Two 200 µL wash steps were performed with Qiagen wash buffer. DNA was eluted into molecular biology grade water.
Design of Library Preparation Reagents
To integrate DNA fragmentation and adapter ligation into a single enzymatic reaction, a modified Tn5 transposase was used (Illumina). The transposase was modified to be hyperactive and to integrate an adapter sequence into both ends of the DNA fragments generated. Conventional PCR was used to amplify the purified and adapter-ligated DNA fragments. A thermocycler was used to perform a limited-cycle amplification (seven cycles). Note that Tn5 transposase is the naturally occurring 53.3 kDa enzyme that catalyzes the cut-and-paste movement of the Tn5 transposon through the genome in vivo. 16 The mechanism is reliant upon a 19 bp inverted terminal repeat DNA sequence, which becomes integrated into the targeted DNA. To make the Tn5 transposase usable for this application, it must be modified to become hyperactive. To do this, the 19 bp mosaic end sequence (ME) is replaced with the barcode/adapter sequence needed for sequencing, and three missense mutations are made to Tn5, E54K, M56A, and L372P, dramatically speeding up the transposition. 17 The transposon complex DNA ends are free, thereby fragmenting the targeted DNA after transposon insertion. In the system used in this project, two separate transposon–DNA complexes were added in equimolar ratios, each containing either a forward or reverse primer.
gDNA Used
The cancer cells used were suspected to have an abnormal karyotype. In order to have a good reference sequence, to which to compare coverage, normal human gDNA was purchased (Promega, Madison, WI). This gDNA was verified to be intact through conventional agarose gel electrophoresis with ethidium bromide staining, and its concentration was verified through a fluorescent intercalating dye (PicoGreen, Thermo Fisher).
DNA Quantitation
DNA yield was assessed using the Thermo Fisher Quant-iT PicoGreen assay. This kit was chosen due to its lower limit of detection (25 pg/mL) and increased specificity to dsDNA when compared with UV absorbance readings. The limit of detection was confirmed by consistent standard curves with R2 values of >0.99 down to 5 pg/µL. We then confirmed the specificity of both the PicoGreen and RiboGreen assays by adding RNA and DNA spikes to each and noted < 20% cross talk. PicoGreen blanks, standard curves, and samples were run in replicate (N = 3) on a Pherastar plate reader with a 480 nm excitation and a 520 nm emission. Commercial lambda phage DNA was used to construct the standard curve. Other means of analysis were also considered. The quantities of DNA we were capturing were too low for conventional gel electrophoresis. Automated capillary electrophoresis, such as the PerkinElmer Labchip Systems, was used later on. Spectrographic methods of DNA yield quantification were used, but their results were discounted compared with the PicoGreen assay because they are often unable to distinguish between dsDNA, ssDNA, RNA, and other contaminants.
Optimized Off-Chip Library Preparation
It was important to have a positive control library preparation technique for comparison. We chose to use the Illumina Nextera Library Prep kit, but found that its use of an affinity spin column to clean up the transposon reaction led to insufficient yield with low-cell-count samples. Therefore, we replaced this wash with a 1.8× volumetric ratio solid-phase reversible immobilization (SPRI) cleanup with two 50 µL 80% ethanol washes. This wash procedure was also used for the PCR cleanup.
Next-Generation Sequencing Data
The quality of nucleic acids obtained using sample preparation methods was tested on an Illumina Hi-seq instrument (PerkinElmer facility in Shelton, CT) with paired-end 150 bp reads. The samples were prepared using our on-chip method and off-chip Illumina Nextera hands-on standard operating procedure (SOP). Both preparations were from 6 ng of human normal gDNA from Promega and included limited-cycle PCR amplification. Normal human DNA was used rather than cultured cells due to the chance of genomic rearrangement in MCF-7 breast cancer cells. It was imperative that a normal genome accurate to the reference was used.
Results and Discussion
The microfluidic workflow, as shown in Figure 1 , performs gDNA extraction from cells, separation of DNA from cellular debris, fragmentation of gDNA, annealing of sequencing and amplification adapters to fragmented DNA, and then separation of prepared DNA fragments from PCR contaminants, such as free primers. Development of the microfluidic device took place on two fronts. The first was the development of the chip function, such as the geometry of the device, type and number of beads used, and optimization of the interface. The second front was the development of the sequencing assay and its adaptation onto the microfluidic setting.
Optimization of Chip Fluidics and Interfacial Forces for Magnetic Bead Motion
Magnetic bead transport motion through castor oil (interfacial tension
To evaluate the optimal bead count, we performed the force analysis for our system ( Fig. 2 ) in a manner similar to that of our previous study. 13 The magnetic force is the limiting factor when finding the minimum number of beads that could be used. The amount of surface tension acting on a single bead is too large for it to pass through the interface; beads needed to pass in aggregate. The optimal condition for minimum bead count was approximately ~50,000 beads to overcome interfacial forces.
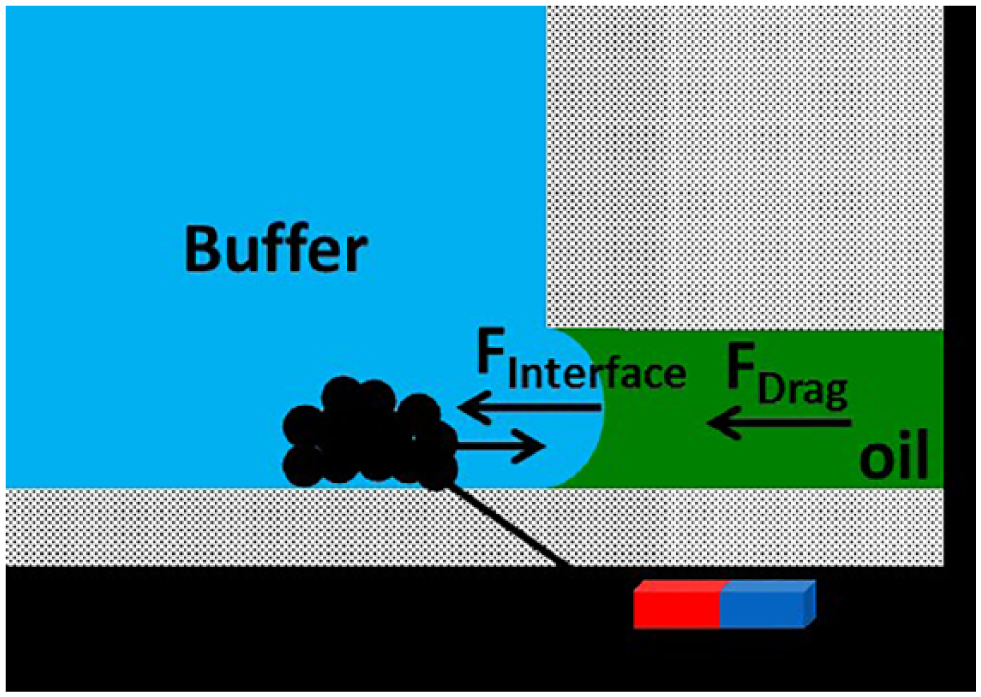
Overview of the resultant forces acting on the magnetic beads and oil–water interface.
The planar design of our platform allows the motion of the permanent magnet to be restricted to a 2D plane. Two magnet motion types were optimized in the operation of the chip. First, slow rotation of the magnet under the reservoir with a radius of 1 ± 0.5 mm was applied for 5 s to aggregate the paramagnetic particles into a single clump at the bottom of the reservoir. In the second motion type, the magnet was moved in a vector toward the next reservoir, which drove the bead clump through the oil–water interface. After testing various magnet motion profiles, we found that a 1 ± 0.5 s pause as the beads reached the interface maximized bead yield. The required pause at the interface is consistent with the literature, which describes the magnetic force needed to pass the pellet through the interface as being higher than the force needed to move the bead pellet through the aqueous reservoir or oil-filled channel. 18 The magnet was subsequently moved at an optimized velocity of 1 ± 0.5 mm/s through the channel from reservoir 1 to reservoir 2. During transport in the oil phase, the bead pellet experiences drag, approximated via Stokes’ law, and friction along the bottom of the chip proportional to the magnetic force acting on each bead. 13 Blocking the chip with a 0.01% Tween 20 and 1 mg/mL BSA solution was found to lower the attractive forces between the bead pellet and bottom of the chip, enabling faster bead pellet aggregation. Bright field microscopy of reservoir 1 and the oil channel after DNA extraction and separation showed less than 1 ± 0.25% of beads remaining, and liquid carryover was determined to be very small in our previous work. 12
Optimal Bead Type and Binding Buffer Composition
Choice of the type of beads used was another critical aspect to design of the workflow. Several factors were of high importance: binding capacity, size selection, magnetic force, and ability to quickly release the DNA. We compared a variety of bead sizes (1–5 µm), compositions, and surface modifications, including Agencourt Ampure XP beads, Spherotech Carboxyl beads, Magnamedics Mag-Si DNA COOH beads, Biodone Inc. 5 µm BcMag Silica beads, Lifetech Dynabeads MyOne Silane, Invitrogen Dynabeads MyOne COOH, and M-280 Streptavidinated beads. The protein-coated streptavidinated beads served as a negative control as we would not expect there to be significant DNA–streptavidin interaction. Si surface functionalization performed best with chaotropic buffers, and carboxyl surface functionalization performed best with PEG/salt buffers. Additionally, the smaller 1 µm beads performed better than their larger counterparts, perhaps due to the additional surface area per unit of bead mass, which is discussed in the next section.
We ultimately chose the carboxyl functionalized beads and a PEG and sodium chloride binding buffer due to their high yield and ability to tune the molecular weight range of binding. Lowering the concentration of PEG in the binding buffer from 40% to 20% allowed lower-molecular-weight DNA, <50 bp, to be excluded. We also observed a 10%–20% increase in yield when using PEG-8000 in the binding buffer rather than PEG-300. It is believed that the COOH/DNA interaction is driven by PEG acting as a crowding agent in buffer, forcing the DNA to precipitate onto the negatively charged COOH-functionalized surface despite the DNA’s own negatively charged phosphodiester backbone. A high salt concentration helps reduce electrostatic repulsion.
Analysis of Bead Binding Capacity
Based on optimal bead count analysis, described in the previous section, we use 11–15 µL of 10,000 beads/µL solution. Combined with a mean diameter of 1 µm and a roughly spherical shape, the total amount of binding surface area in the DNA capture reactions was A = 6.6 × 105 µm2 in the 11 µL condition and 9.0 × 105 µm2 in the 15 µL condition. It was important that the beads were able to bind two very different populations of DNA. The first was the high-molecular-weight gDNA (>50 kb) fragments after the lysis of cells, and the second was the population of low-molecular-weight (200–600 bp) DNA fragments after the fragmentation and PCR steps. For an unamplified and unfragmented gDNA sample with an average size of >50 kbp from a five-cell sample, we estimated there to be 30 pg of gDNA, from the established value of 6 pg gDNA per eukarytic cell. This is about 5.5 × 10⁵ molecules of gDNA in the sample. Approximating the DNA as a flexible cylinder with a diameter of 23.7 Å, this population of DNA corresponds to an approximate surface area of 1.4 × 105 µm2. As an approximation, we divided this number by 2 as half the molecule would face a bead’s surface and the other half the aqueous environment. Comparing 7 × 104 µm2 to 6 × 105 µm2 reveals a significant excess of bead binding capacity versus DNA to capture. In fact, this works out to an average of 2.7 gDNA molecules per bead. We assume the relationship between binding capacity and DNA surface area does not change by fragmentation. Even though the number of molecules per bead increased from 2.7 to 340, the amount of surface area required on the bead was assumed to be the same. This is due to the long aspect ratio of DNA; even at low molecular weights, the ends of the DNA molecules do not contribute significantly to the DNA molecule’s total surface area.
The postamplification DNA population, however, is significantly different. Ideally, each round of PCR amplification should double the size of the DNA population. With a total of nine cycles of amplification, this would increase the surface area requirement of target DNA by 2. 9 Additionally, the PCR components add additional surface area in the form of free nucleotides and primers. This leads to an excess of DNA surface area required to available bead surface area. Yet, there does not appear to be an issue with sample loss. We attribute this to two factors. First, the actual topography of the beads used is not smooth; this dramatically increases the available surface area for DNA to bind. Second, the binding conditions used are designed to size select only the DNA fragments in the 200–600 bp range. The removal of low-molecular-weight DNA frees up space on the beads to bind the target higher-molecular-weight DNA, consistent with previous observations of SPRI in a microfluidic setting 19 and in conventional, nonmicrofluidic use. 20
Microfluidic gDNA Capture and Separation
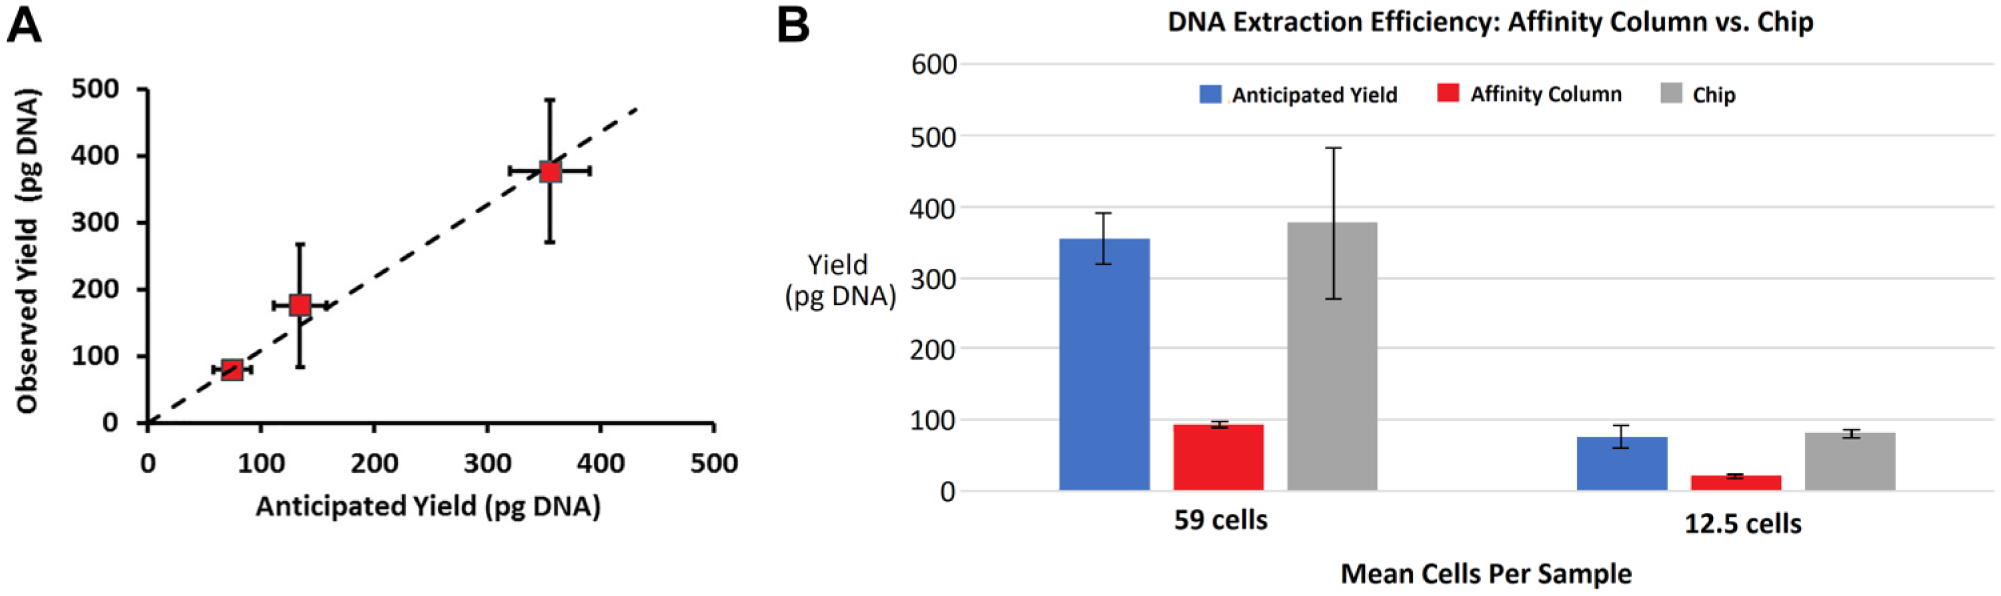
We focused our experimental investigation on a low number of MCF-7 cell count samples. The first parameter investigated was the ability to capture gDNA from different cell populations in reservoir 1 of the chip ( Fig. 1 ). Ten-microliter samples of 10 ± 1, 20 ± 1.5, or 50 ± 5 cells were combined with 5 µL of an optimized lysis and binding buffer, as described in Materials and Methods, and then incubated for 10 min at room temperature (23 ± 1 °C) to ensure complete lysis. We also tested 1 ± 1 cell samples, but as expected, the yields were below the limit of detection of our DNA quantification assay. Microscopy was used to verify that all cells had been lysed. Lysis time can also be reduced from 5 to 2 min in applications for high-throughput next-generation sequencing sample preparation. While 2 min at room temperature provides adequate lysis, 5 min at room temperature was used to ensure complete lysis for the low-cell-count samples. We added 11 µL of paramagnetic particles suspended in a NaCl/PEG binding buffer to reservoir 1 and incubated at room temperature for 5 min. The molecular weight of PEG used in the binding buffer was found to be critical to the gDNA yield. Using PEG-8000 rather than PEG-300 improved the yield by 30 ± 5%. In the DNA/bead binding reaction known to be a precipitation reaction in which PEG serves as a crowding agent, high-molecular-weight PEG is better at crowding the DNA onto the surface of the beads. Next, the magnetic beads carrying the gDNA were moved from W1 to W2 using the method described earlier. Figure 3A shows expected yield, based on the accepted value of 6 pg of gDNA per cell on the x axis versus the measured yield on the chip using a dsDNA intercalating dye. Variance in x-axis values is caused by a Poisson distribution-based variance of the number of cells per sample, as discussed in the Materials and Methods. Comparing the expected and achieved values shows near 100% yield at 50-cell-count samples and >80% yield at 10-cell-count samples. Note that a recent microfluidic sample study was capable of performing DNA extraction from 10,000 cells for whole-genome shotgun (WGS) sequencing of Mycobacterium tuberculosis. 7 DNA extraction performance compares favorably to a hands-on-based SPRI technique in terms of time and difficulty, and performs better than an affinity-based column in terms of yield ( Fig. 3B ). It appears that the affinity column protocols are not optimized for use with low-volume or low-cell-count samples.
(
We also investigated the possibility of RNA carryover during gDNA extraction and separation. We performed 10-cell gDNA extraction with and without RNase and then assayed the purified DNA using a DNA-specific PicoGreen intercalating dye and an RNA-specific RiboGreen dye. If RNA was present in the purified sample, the RNase-free condition would show higher RiboGreen signal than the RNase-containing condition. The results, shown in Figure 4B , demonstrate no difference, indicating the absence of RNA. Furthermore, if there had been cross talk between RNA and the PicoGreen assay, we would have expected the RNase-free extraction condition to show higher signal than the RNase-containing condition. The results, shown in Figure 4A , indicate no difference in signal between the conditions, further confirming the absence of RNA affecting the experimental results.
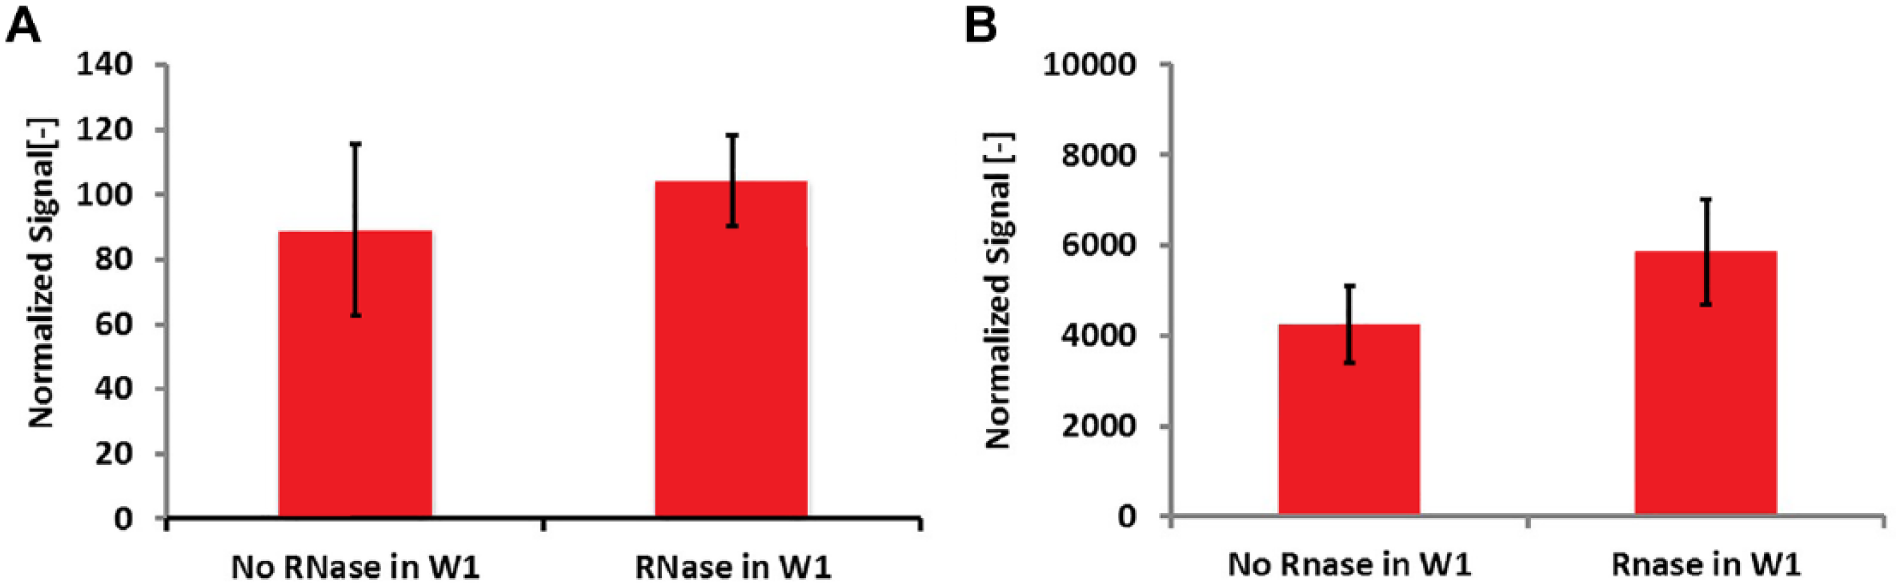
DNA extraction from 10 cells. (
Development of Positive Control Assay
The suboptimal performance of the affinity column-based procedure for low-cell-count samples necessitated the development of an all-SPRI bead-based lab bench (no-chip) library preparation technique to serve as a positive control. The Illumina Nextera kit standard procedure has two wash steps, a column-based cleanup after the tagmentation reaction and a carboxylated bead-based PCR cleanup step. We used the bead cleanup procedure from the PCR cleanup step to replace the first column wash.
Optimization of Library Preparation Chemistry
Translating the library prep assay from the lab bench scale to the microfluidic scale required a significant reduction in reaction volume. Some of the reactions taking place at the lab bench scale were more than 50 µL and required further dilution with binding buffer to capture the DNA after the reaction. Reduction in volume for similar chemistry has been covered in the literature, 21 which has shown that the scale-down does not affect library quality postamplification, as measured by sequencing coverage. Lamble et al. 21 compared 1/8-scale fragmentation/ligations with full-volume PCRs as well as 1/4-scale PCR amplifications and found that the reduced volume amplification yielded more concentrated libraries. Our findings confirmed that a proportional scale-down of the fragmentation and amplification reactions was successful, and in fact showed improved yield at smaller scale when starting with 1 ng human gDNA samples ( Fig. 5 ). We adapted these scaled-down reactions, including a lower than SOP elution volume of 5 μL for post-fragmentation/ligation cleanup and 5 μL of elution for post-PCR amplification. The success of these parameters was confirmed both on-chip and off-chip using conventional hands-on SPRI cleanups with 80% ethanol washes. We can also report that using a conventional spin column rather than SPRI cleanup for the hands-on protocol at this scale drastically reduced library yield.
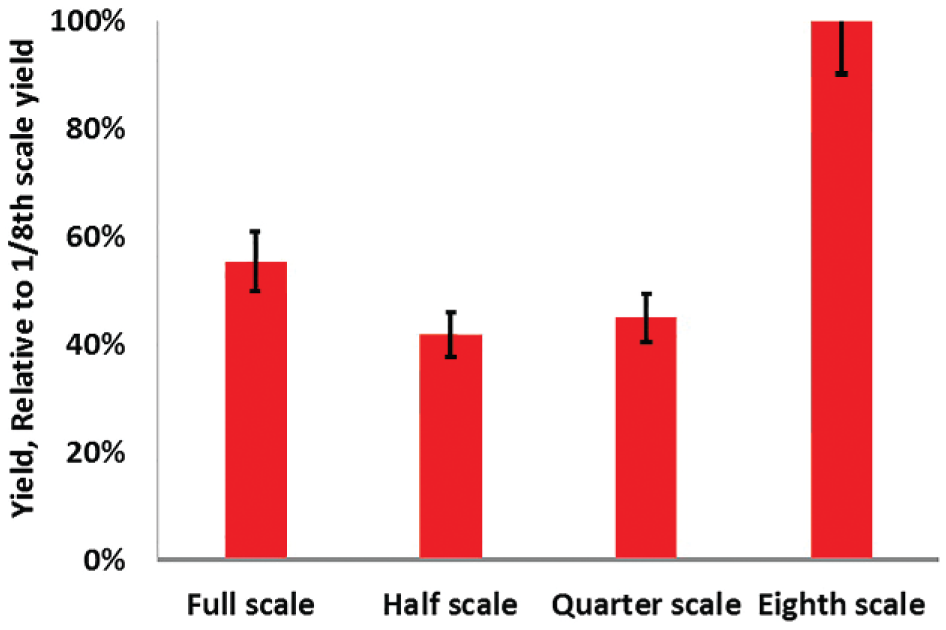
Reducing the volume of the fragmentation, adapter integration, and amplification steps was critical to adapting the library preparation chemistry to a microfluidic format. Library preparation, performed off-chip at full and reduced scales, revealed an improved yield relative to DNA input mass in the 1/8-scale reaction that would be implemented in the microfluidic format.
After isolating gDNA in reservoir 2, we used single-reaction Tn5 transposase chemistry to execute fragmentation and adapter ligation. Five microliters of fragmentation/ligation reaction mixture (see Materials and Methods) was added to reservoir 2. The temperature of reservoir 2 was kept at 55 ± 1 °C using heat bock with feedback control. After incubating for 5 min, the 11 µL binding solution was added. After incubating for 5 min, the magnetic beads were moved to reservoir 3 using a permanent magnet. The efficiency of the fragmentation/ligation reaction was found to be a function of time of incubation, temperature, and concentration of gDNA. Following previous studies, we set the fragmentation/ligation enzyme in molar excess of target gDNA. The time of reaction was varied between 1 and 10 min. An incubation time of 5 min was determined to permit the reaction to reach to its maximum yield. Elevated temperature (>65 °C) slowed the reaction, possibly by dissociating Tn5 from the DNA template. Lowering the reaction to room temperature (22 ± 1 °C) lowered yield by slowing reaction kinetics.
After transport, the adapter-ligated DNA was eluted into 5 µL of diH2O in W3 for 5 min at room temperature. The sample was removed from the chip and placed into a 7.5 µL mixture consisting of PCR buffer, polymerase. Short-cycle PCR was performed using a thermocycler (PikoReal, Thermo Fisher). We tested from 5 to 15 cycles of amplification and determined 9 to be the ideal number of cycles to send for sequencing. Fewer than nine cycles diminished yield, and more cycles may have added to amplification bias-based errors in sequencing coverage. We tested several sets of 8 bp index sequences (Illumina) and found no effect on yield or library quality from the change in index sequence.
Effect of Beads on Reaction Efficiency
To investigate the effect of the beads on fragmentation/ligation reactions and/or PCR, we performed four permutations of off-chip library preparations: (A) no beads in fragmentation/ligation reaction and no beads in PCR, (B) no beads in fragmentation/ligation reaction but beads in PCR, (C) beads in fragmentation/ligation reaction but no beads in PCR, and (D) beads in both fragmentation/ligation reaction and PCR. Condition A resulted in maximum yield (as shown in Fig. 6 ); however, experiment C suggests a 30%–40% decrease in yield due to the presence of beads in the fragmentation/ligation reaction. Evidently, experiments B and D resulted in undetectable yields, demonstrating the inhibitory effect of paramagnetic particles on the PCR ( Fig. 6 ). Therefore, after elution into reservoir W2, beads were transported back to W1, and similarly from reservoir W3 to W2 after elution in W3, in order to avoid all bead-induced inhibition of fragmentation and adapter ligation and PCR.
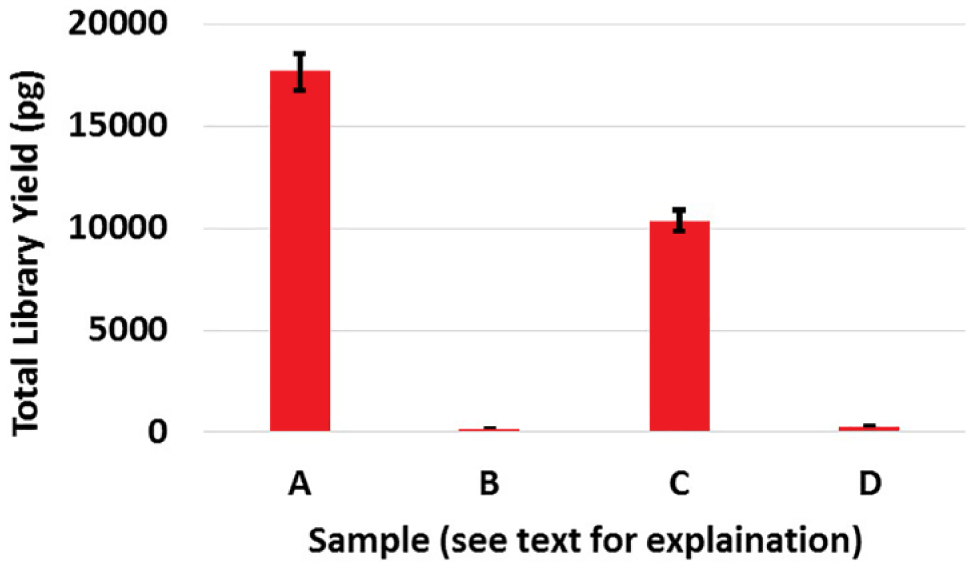
Effect on yield of presence of paramagnetic beads in reaction volume. Four permutations of off-chip library preparations were performed, and the resulting libraries were assessed via bioanalyzer: (
Buffer Effects on DNA Elution
In order to minimize total number of pipetting steps, we investigated whether DNA would rapidly enter solution from the surface of the beads into either the buffer used for DNA fragmentation and adapter ligation or the buffer used for PCR. DNA adsorption onto the bead’s surface is driven by the use of PEG as a crowding agent and high salt to mitigate the electrostatic repulsion of the negatively charged DNA backbone and negatively charged COOH– groups on the bead’s surface. In the absence of these molecules, a polar solvent, such as water, will spontaneously dissolve the DNA. Both the fragmentation/adapter ligation buffer and PCR buffer are aqueous but contain salts and glycerol from enzyme storage buffers that could interfere with suspension of the DNA. Efficient elution into a reaction buffer rather than water would save a step, simplifying device operation.
We found that DNA readily dissolves into the fragmentation and adapter ligation buffer but tends to stay bound to beads in the PCR buffer for at least 5 min at room temperature (23 ± 1 °C). Figure 7 shows quantitation of total double-stranded DNA yield after PCR cleanup for four samples: (A) libraries eluted into water after cell lysis and DNA extraction, and then eluted into water after fragmentation and adapter ligation; (B) libraries eluted directly into fragmentation and adapter ligation buffer after cell lysis and DNA extraction, and then eluted into water after fragmentation and adapter ligation; (C) libraries eluted into water after cell lysis and DNA extraction, and then directly eluted into PCR buffer after fragmentation and adapter ligation; and (D) libraries eluted directly into fragmentation and adapter ligation buffer after cell lysis and DNA extraction, and then directly eluted into PCR buffer after fragmentation and adapter ligation. Samples eluted into water had the buffer added via pipette after 5 min of DNA elution, thus adding an additional step to library preparation. Sample A, resulting in 90 ± 9% relative yield, was similar to sample B with a 100 ± 10% relative yield. Elution directly into the PCR buffer instead of water resulted in much lower yields, as seen in sample C, with a 26 ± 3% relative yield, and sample D, with a 19 ± 2% relative yield. We hypothesize that it is the glycerol from the polymerase storage buffer that is serving as a crowding agent, slowing the rate of DNA de-adsorption in the PCR buffer. Based on these findings, we proceeded with the following elution approaches: elute directly into fragmentation and adapter ligation buffer after extraction of gDNA from cells, elute into water after the post-fragmentation/adapter ligation reaction, and manually add the PCR buffer and reagents with a pipetting step.
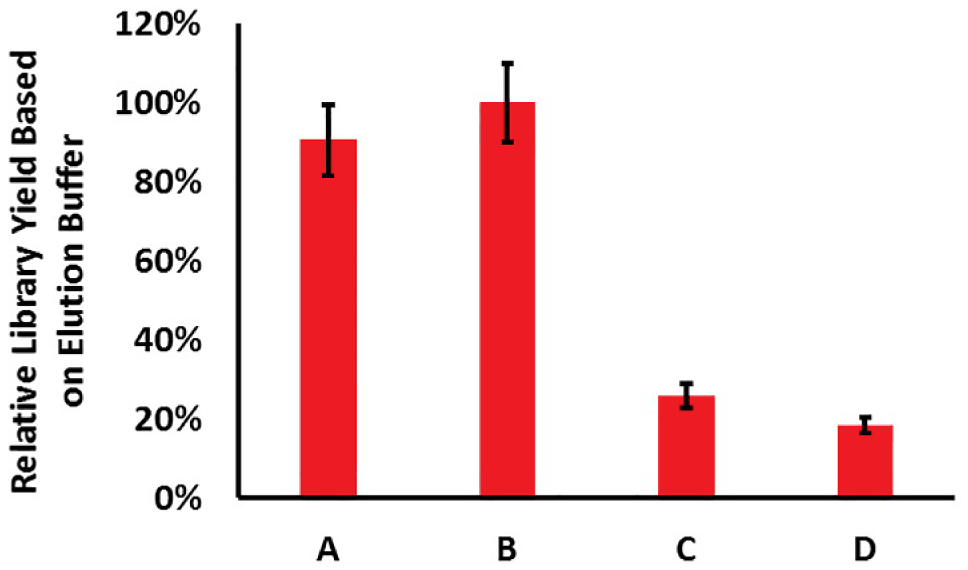
Elution into water versus reaction buffer. Four permutations of library preparation were performed in which the DNA was eluted off the surface of the beads into either water or the reaction buffer, in order to test elution efficiency. Library yield was measured via bioanalyzer. The permutations, as seen on the x axis, are as follows: (
Analysis of Chip Function
In order to optimize sequencing quality, three postamplification metrics were considered: total library yield, library molecular weight range, and contamination of primers from the amplification reaction. We investigated these parameters by comparing on-chip performance and our modified, positive control, hands-on SOP (see Materials and Methods) by characterizing library concentration and molecular weight range.
The desired molecular weight range of a next-generation sequencing library is bounded by the read length of the sequencing instrument. The Illumina Hi-Seq device used in this project performs 150 bp paired-end reads. Ideally, a uniform library of 300 bp fragments would be generated during library preparation. Practically, a sharp Gaussian distribution with a ~400 bp median value is optimal. This is because slightly more utility is derived from a 300–400 bp fragment compared with a 200–300 bp fragment as the lower-molecular-weight fragment would not maximize novel read length. The molecular weight range of the resulting library is a product of transposase reaction conditions such as enzyme concentration, reaction temperature, buffer composition, and reaction time, as well as the parameters of both post-fragmentation/ligation reaction and PCR cleanup. Transposase remains bound to the DNA after catalyzing its cleavage and ligation reaction. In our chip, transposase is melted off by a heating step at the beginning of the PCR. Increasing transposase concentration produces a library with a lower mean molecular weight. It would be possible to speed up the reaction by adding additional transposase and not allowing the reaction to go to completion by reducing the time of reaction. However, this could make the assay more sensitive to user error, such as mistiming the transposase step.
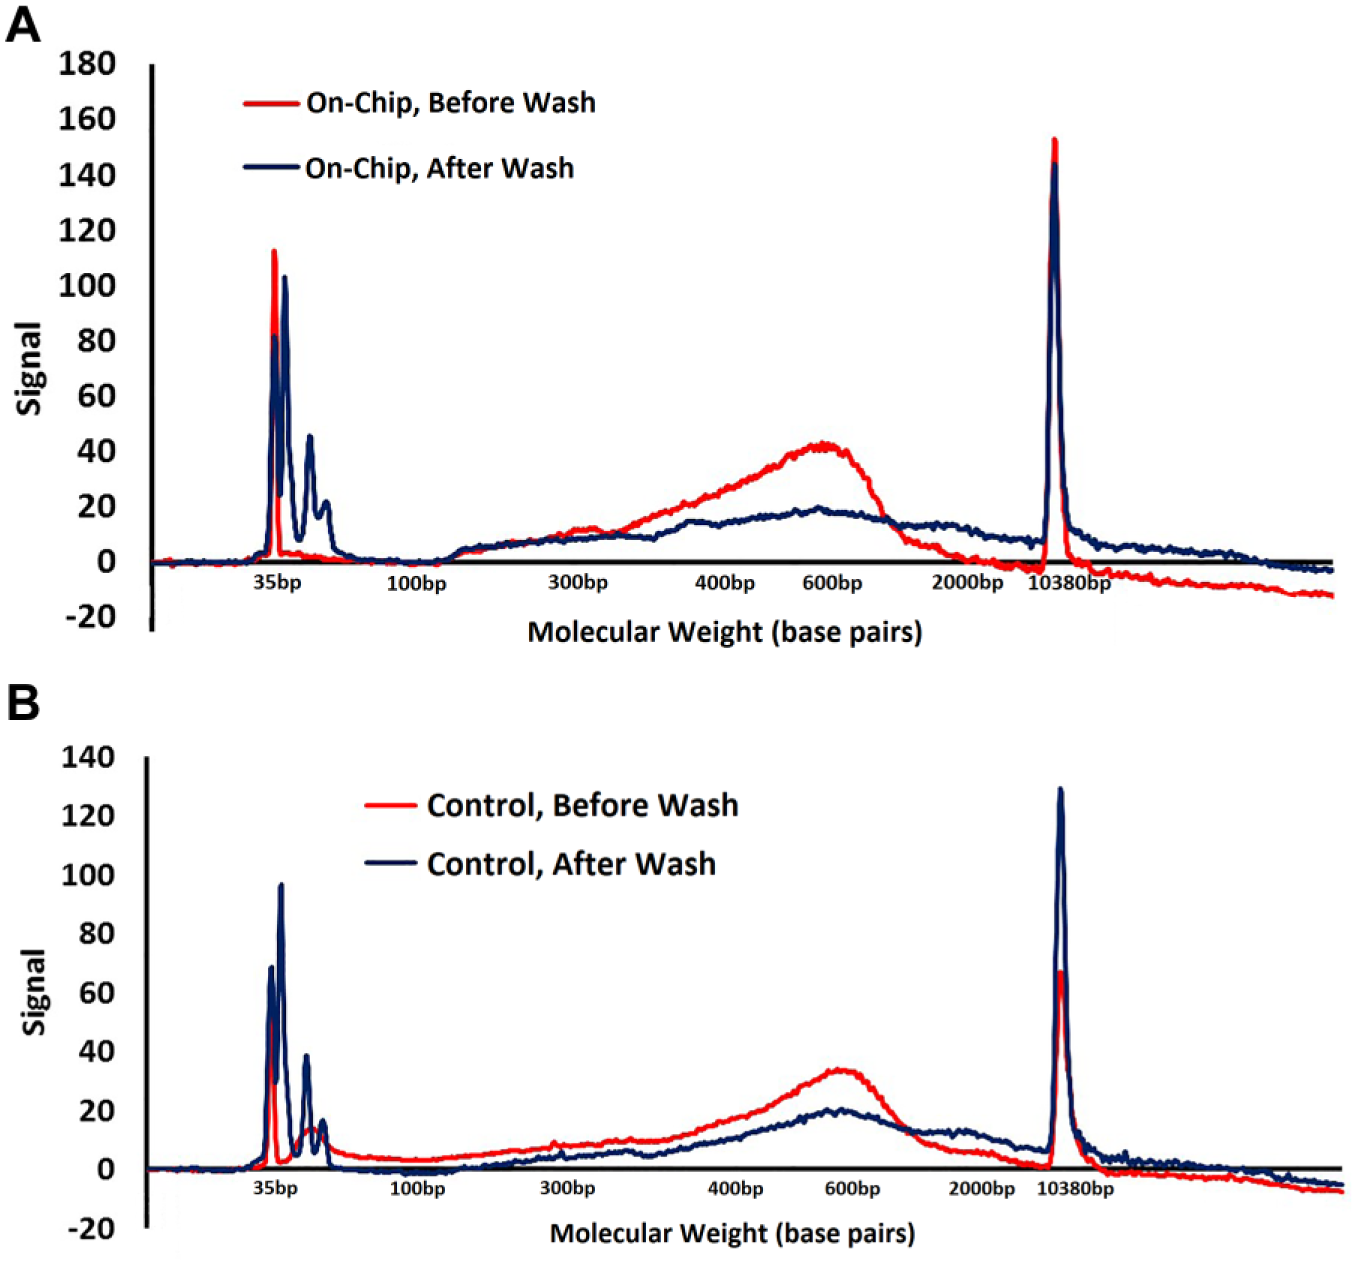
Carboxyl-functionalized SPRI allows us to tune the molecular weight binding of the DNA onto the beads by increasing the concentration of PEG in the bead/DNA binding buffer. Increasing the concentration of PEG in the precipitation reaction allows for the adsorption of lower-molecular-weight DNA molecules. This phenomenon was used in tandem with fragmentation kinetics to tune the library molecular weight range. Increasing the final concentration of PEG-8000 in the DNA adsorption reaction from 7% to 15% changed 0% recovery of a 100 bp DNA to 80% recovery of a 100 bp DNA fragment. As shown in Figure 8 , the on-chip library showed better yield of fragments from 250 to 500 bp than the off-chip control.
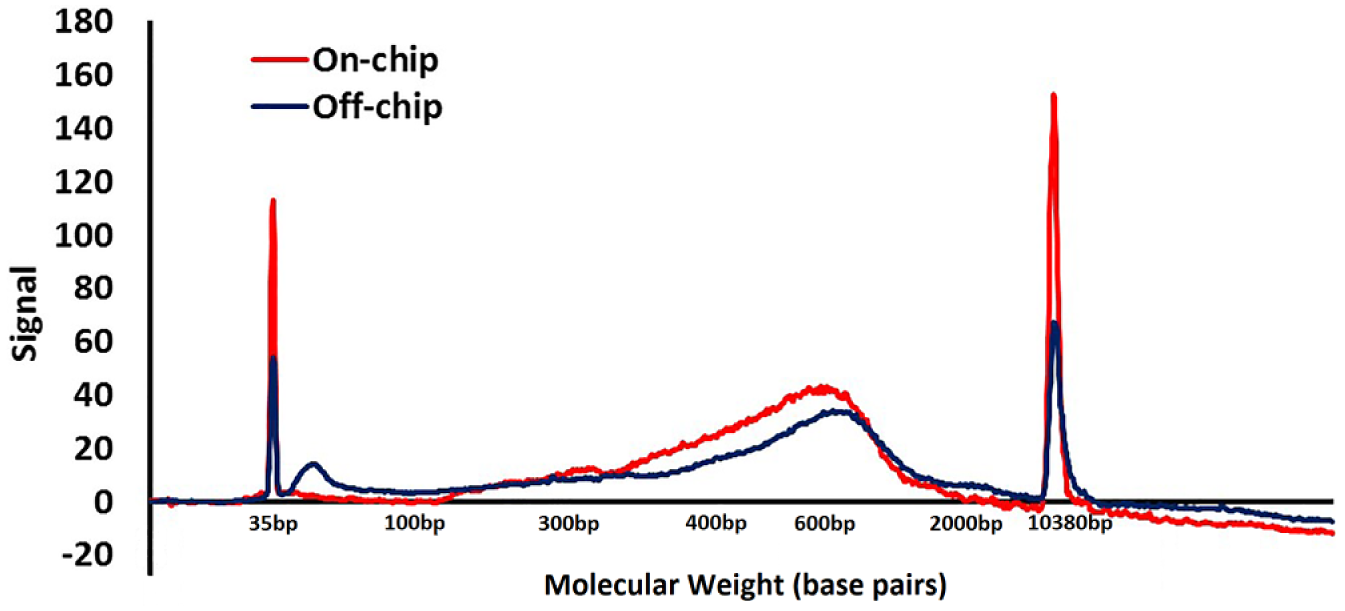
On-chip vs. off-chip molecular weight range and yield.
Removal of PCR Primers
Assessing the degree to which leftover low-molecular-weight PCR primers were removed by passage through the oil–water interface was performed by comparing the contents of reservoir 4 to the commercial protocols for sequencing library preparation. Each of the two primers was present in vast stoichiometric abundance to target during the PCR, 100 nM each. PCR primers are short synthetic single-stranded DNA oligos. The aforementioned effect of PEG concentration on DNA adsorption to carboxyl beads can be used to impart a high-pass-molecular-weight screen.
The PCR primers used in this library preparation chemistry achieve several roles; they bind to adapter sequences, and are therefore universal to all fragments prepared during the fragmentation and adapter ligation reaction, and also contain two indices for multiplexing and another sequence to bind the sequencing flow cell. Free primers are 20–25 bp long, compared with 250–500 bp long for the sequencing library. The lower molecular weight enables free primers to preferentially bind, via hybridization, the sequencing flow cell, compared with the bulkier library DNA fragments. Binding is required for sequencing; therefore, the presence of free primers is inhibitory.
(
Sequencing Results
DNA libraries prepared from 660 pg of Promega human gDNA using a commercial library kit and the device described in this paper were analyzed using an Illumina Hi-seq instrument with paired-end 150 bp reads. While we previously demonstrated library quality from whole cells based on size range, yield, and primer removal, it was important that the sequencing be done from DNA of known sequence, in this case commercial human normal DNA as opposed to the highly mutagenic DNA from the cancer cell lines we had been using. We chose 660 pg of starting material to approximate using a 100-cell sample, and measured the molecular weight range of the starting material to ensure that it was similar to what we had achieved from whole cells.
In the resulting sequencing data, >94 ± 1% of reads map to a reference genome at or above 99.9% confidence, compared with 92 ± 1% of reads from the positive control ( Fig. 10 ). Phred quality scores (Q scores) are a means of representing accuracy during sequencing. The resulting Q score represents a mean probability of an individual base pair being miscalled. A Q score of 30 represents 99.9% accuracy and a score of 40 is equivalent to 99.99% accuracy. 22
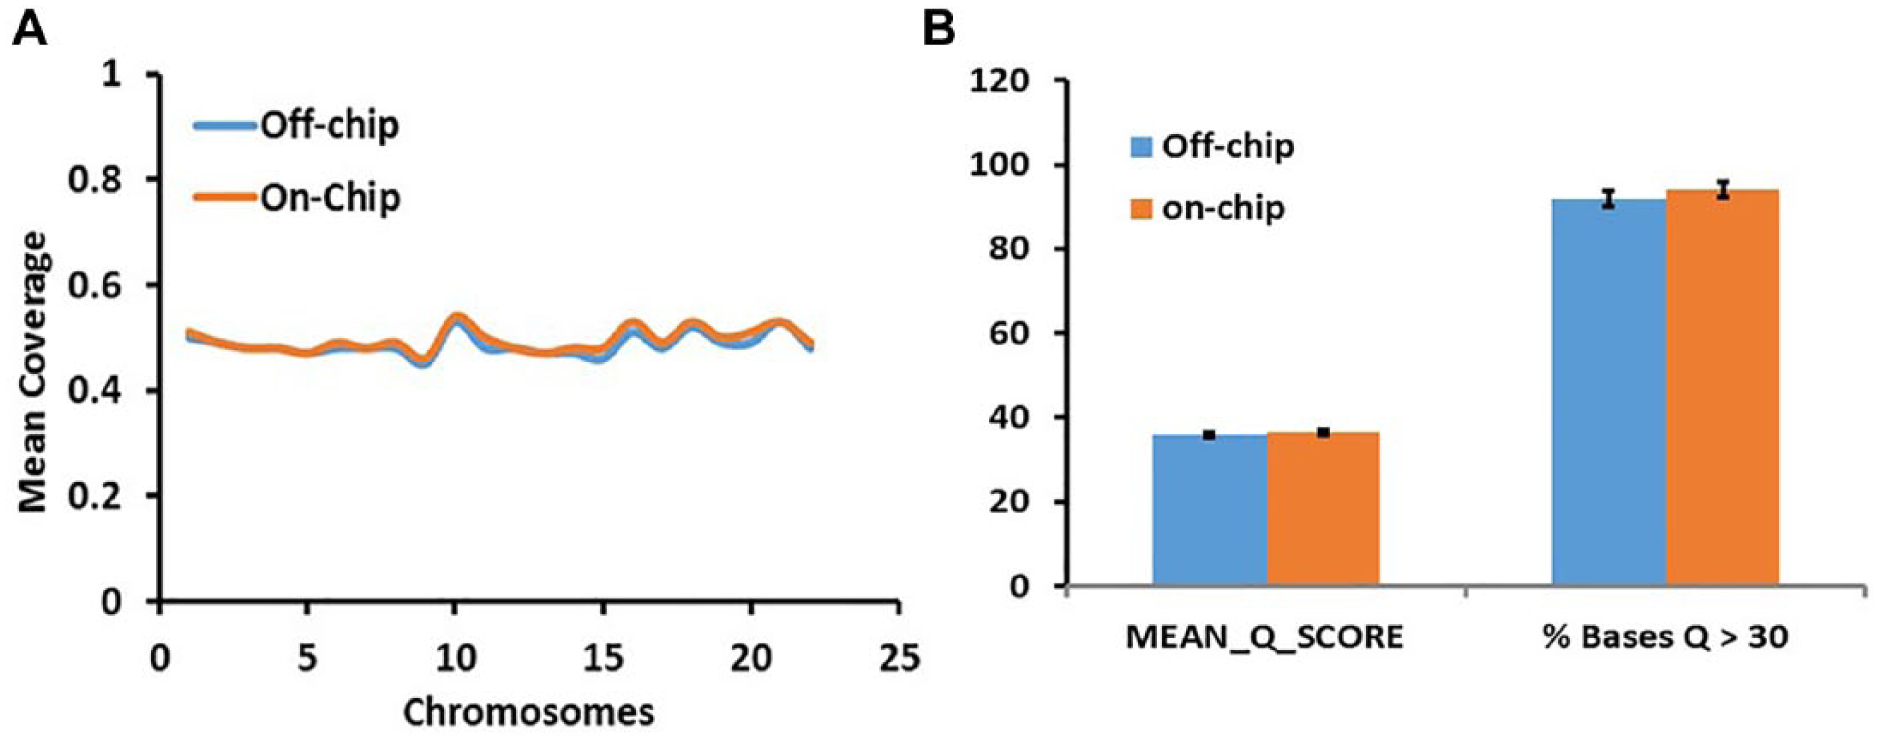
Microfluidics sequencing metrics.
We then compared coverage against a reference normal human male genome. On 16 out of 24 chromosomes (22 autosomes plus an X and a Y sex chromosome), the on-chip results generated marginally superior coverage than the off-chip library. We performed a two-tailed T test comparing the control and on-chip coverage data for 24 chromosomes and found that the difference in coverage was statistically significant, with the p value being less than 0.0001.
The on-chip library tended to bias coverage toward the same chromosomes as the control library ( Fig. 11 ). The control results were binned into four groups based on mean chromosomal coverage, and the on-chip data largely fell into the same bins, with the only differences occurring toward the median coverage values, which showed little difference ( Fig. 11 ).
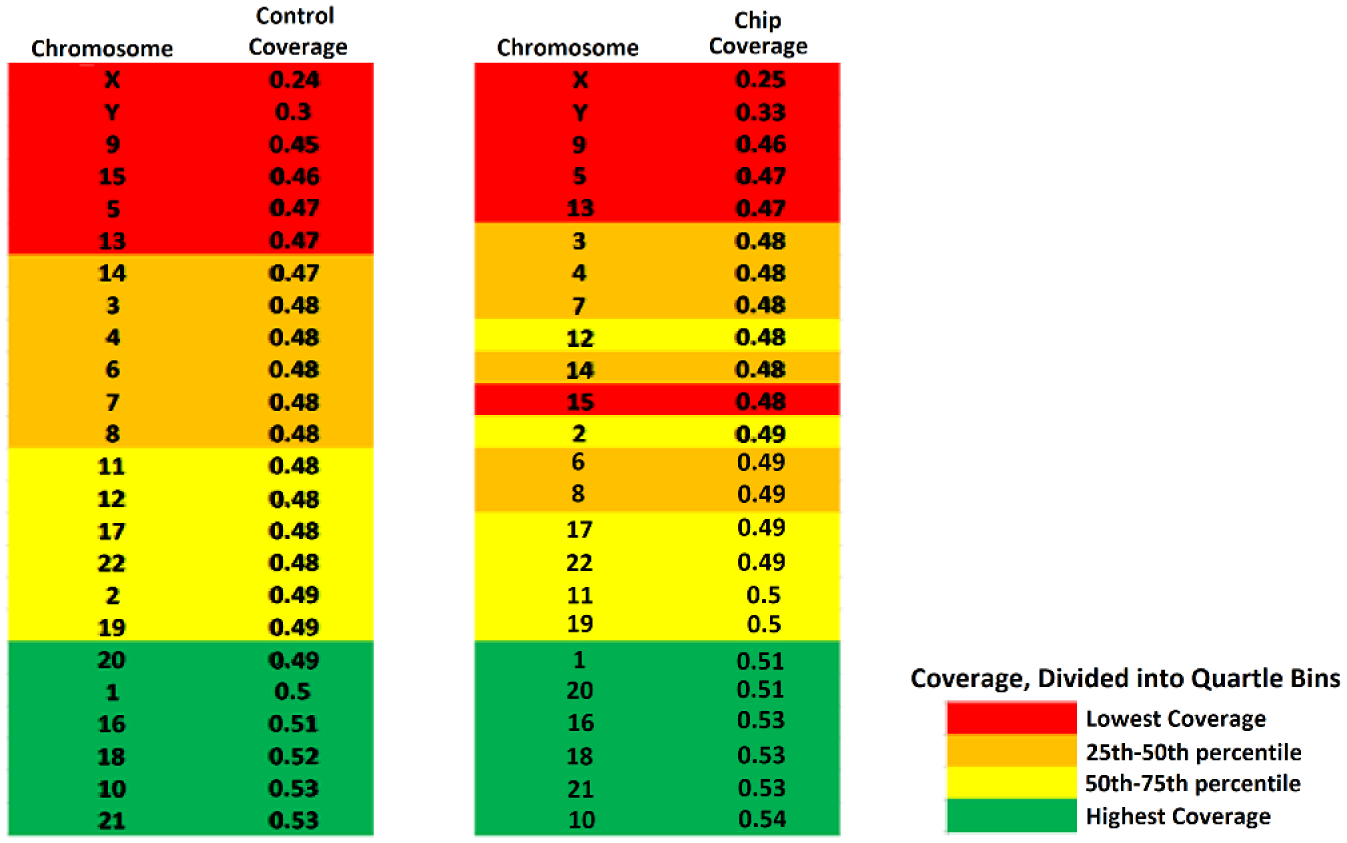
Chromosome-to-chromosome biases in coverage. Control and on-chip data were divided into quartile bins consisting of six chromosomes each.
Both the off-chip control and on-chip samples averaged 148 ± 1 bp per read. The superior coverage of the on-chip samples was achieved despite the chip sequencing run having 1.18 × 10⁷ total reads compared with 1.20 × 10⁷ reads in the positive control. The added coverage from fewer reads can be attributed to the better molecular weight distribution of DNA molecules, allowing less overlap from the paired-end reads ( Fig. 8 ). Both the map rate and duplication rate of the on-chip and control samples fell within the normal range. We sought out to achieve commensurate coverage compared with the positive control, and were happy to note the slightly superior sequencing metrics.
Here we demonstrate a proof-of-concept platform for a new type of microfluidic workflow for rapid next-generation sequencing library preparation that integrates all the key steps: cell lysis, fragmentation, adaptor ligation, fragment purification, and post-PCR purification, while eliminating the need for inconsistent and difficult wash steps. Our device allows for easy and consistent preparation of high-quality libraries along with a chip that is easier to fabricate, consumes lower volumes of reagents, and is simple to operate. It is noted that the performance of our library preparation approach depends on the microfluidic device as well as the methodology. The true comparison with any approach can only be based on the yield and quality of the results but not on the degree of similarity of the device or methodology. Hence, when performances are similar, relative ease of use, cost, robustness, and time of assay provide additional comparisons between approaches. It is worth highlighting that even if the chip-based wash only matches the yield and purity of a traditional paramagnetic bead-based wash, the chip wash requires significantly fewer reagents and lasts only ~15 s versus ~10 min, and also eliminates the need for skilled pipetting.
Furthermore, we believe that this device will be easy to package in a multiplexed format and to automate using simple magnet motion upon continued study.
Footnotes
Acknowledgements
We would like to thank Gerard Irzyk and Tony Melillo from the PerkinElmer facility in Shelton, Connecticut, for generating sequencing data. A.T. was responsible for project administration and supervision. A.S. conceptualized the project, performed the experiments, and collected and analyzed the data. A.S., M.N., and A.T. wrote the original draft of the manuscript draft. M.T. and M.D. were responsible for editing subsequent drafts of the manuscript.
Declaration of Conflicting Interests
The authors declared no potential conflicts of interest with respect to the research, authorship, and/or publication of this article.
Funding
The authors disclosed receipt of the following financial support for the research, authorship, and/or publication of this article: The funder (PerkinElmer) provided support in the form of salary for author A.S., but did not have any additional role in the study design, data collection and analysis, decision to publish, or preparation of the manuscript.