
Abstract
Liquid helium (LHe) is used as a cryogen in a variety of applications involving superconductivity and is routinely monitored for conducting low-temperature experiments. Thermoacoustic oscillations, which are inevitably present inside closed LHe containers, are utilized for level detection by sensing the vibrations at the warm end of a thin capillary tube inserted into the Dewar. The position of the capillary tube at which a sudden change occurs in these oscillations is manually sensed to identify the liquid level. The present work proposes a novel hardware design to identify the thermoacoustic oscillations in a reliable way using an accelerometer driven by an Arduino microcontroller. Further, an automated approach has been devised to quantify the rate of change of these helium oscillations to measure the LHe level. The proposed method has been tested during several trials on a 120 L and 100 L capacity Dewar using the proposed hardware, and the mean error in measuring the LHe level was calculated to be less than 1 cm in comparison with the gold standard niobium-titanium level sensor. The results encourage the use of the proposed method to evolve as a cost-effective alternative to the widely used superconducting level sensors in measuring LHe level.
Introduction
Monitoring the level of liquid helium (LHe) in the Dewar or cryostat is crucial for conducting cryogenic experiments. Presently, superconductor-based level sensors1–3 are widely used for this purpose. The change in resistance of a portion of a lengthier superconducting wire like Niobium dipped in an LHe Dewar is used as a parameter to estimate the level. While this approach is being widely accepted as a standard method to measure helium level, a simple alternative to this technique is to use a thin capillary tube inserted inside the Dewar to sense thermoacoustic oscillations of LHe. These vibration signals are popularly known as Taconis oscillations4–6 and are inherent to closed LHe containers wherein a gradation of temperature causes helium vapors to move back and forth at the inner walls of the Dewar. These oscillations could be sensed at the warm end of the capillary tube when terminated with a rubber membrane. The magnitude of these oscillations is known to be higher at the verge of the LHe surface. Hence, by advancing the capillary tube inside the Dewar, the position at which a sudden change in the magnitude of these oscillations is felt is taken as a level detection point 7 for LHe. Though this appears to be a less expensive and less complex method, it lacks reproducibility in measuring the level owing to the manual sensing of vibration signals. It is obvious that various factors affect thermoacoustic vibrations in the manual sensing, such as the manner of handling the capillary tube, the velocity of inserting the tube, and applying pressure on the rubber membrane to sense the vibrations, and so vary widely across subjects. Hence, the main objectives of the present work are to propose a novel hardware for a reliable measurement of thermoacoustic vibrations using an accelerometer controlled by an Arduino microcontroller and, second, to automate the detection of the LHe level with a reasonable accuracy compared with that of superconducting level sensors, highlighting the importance of a vibration-based level sensor as a cost-effective alternative. The proposed hardware could be advanced by incorporating wireless enabled features to remotely monitor liquid levels.
Materials and Methods
The hardware design involves an Arduino Mega 2560 microcontroller 8 as the primary processing unit, an accelerometer sensor to sense the vibrations of a rubber membrane on top of the capillary tube, and a stepper motor arrangement to handle the movement of the capillary tube in a linear fashion to advance into and withdraw from the Dewar. Apart from controlling the stepper motor, the Arduino also serves as a data acquisition module to acquire the accelerometer data and send it to a personal computer for processing the vibration signals for algorithmic identification of the LHe level. ADXL 335 (Analog Devices, Norwood, MA), a triaxial accelerometer sensor with a measurement range of ±3g and sensitivity of 300 mV/g, was used to measure the frequencies of the thermoacoustic oscillations in the vertical direction (z axis). A 1.8° step-angle stepper motor (SparkFun Electronics, Niwot, CO) was used to drive the capillary tube. A stainless steel tube with a length of 1000 mm and inner and outer diameter of 2 and 4 mm, respectively, was used as a capillary tube in this hardware design. Figure 1 shows the photograph of the hardware mounted on the protecting ring of a 120 L LHe Dewar. The inset of the figure shows the capillary tube with the accelerometer kept on its top and coupled to the linear actuator with an adjustable plate. The plate allowed fixing the hardware on Dewars with different diameters of protective rings. The following subsections briefly discuss the mechanical arrangements for the accelerometer sensor, the block diagram of the hardware, and the automated algorithm to determine the LHe level.
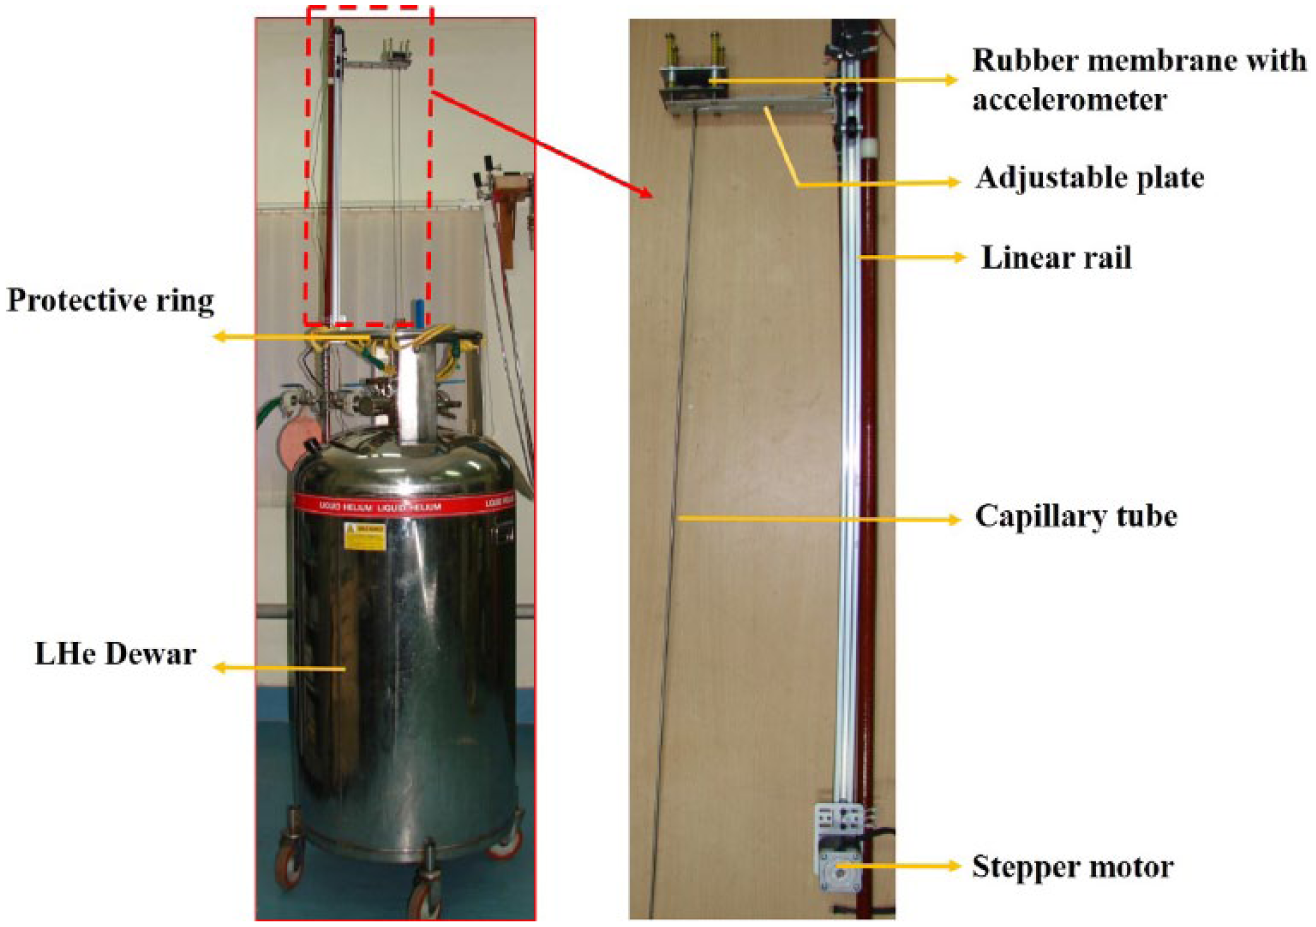
The proposed hardware mounted on the protecting ring of an LHe Dewar. The inset shows a close view of the linear actuator with the capillary tube.
Hardware to Measure Thermoacoustic Vibrations
The capillary tube with the accelerometer fixed on its top is the primary module in this hardware design. The movement of the capillary tube needs to be controlled by the Arduino microcontroller since its position delivers information about the liquid level. A conical brass nozzle was brazed to one of the ends of the capillary tube and was covered tightly with a rubber membrane to sense LHe oscillations, as shown in Figure 2 . The accelerometer sensor was fixed on a square aluminum plate and placed over the rubber membrane supported by lengthier screws on all four sides with a spring mechanism. This arrangement was made to prevent the plate moving out of the assembly while the thermoacoustic vibrations were acting on the rubber membrane. A cushion was fixed on the top of the rubber membrane, which not only allowed a smooth transfer of the vibrations to the accelerometer sensor but also prevented mechanical ruptures to the membrane when the sensor plate was in motion due to thermoacoustic vibrations.
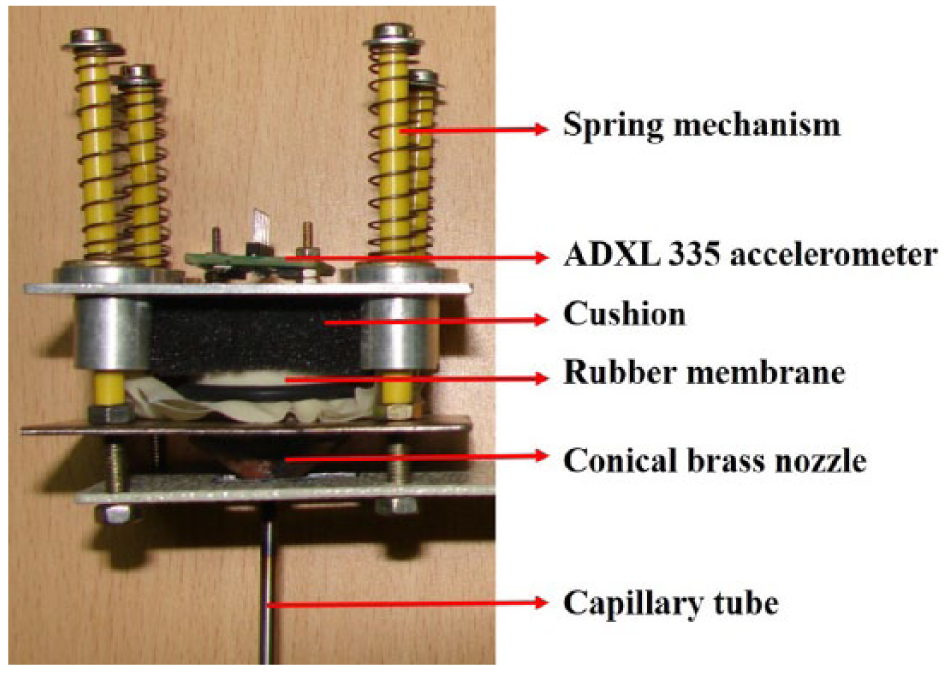
Mechanical arrangement to measure thermoacoustic oscillations in an LHe Dewar.
Block Diagram of the Proposed Hardware
Figure 3 illustrates the block diagram of the control loop of the proposed hardware. The purpose of this control system is to ensure a smooth movement of the capillary tube (which contains the accelerometer) in a linear fashion with a constant velocity. The rotary motion of the stepper motor is converted into linear motion with the help of a conveyer belt arrangement moving on the rail with pulleys at both ends. The motor was controlled through a driver circuit (Big Easy Driver, SparkFun Electronics). The vibration signals sensed by the accelerometer were acquired by Arduino through its 10-bit analog-to-digital pin and are transferred to the PC through serial communication for automated detection of the LHe level. Control signals to start or stop the stepper motor once the capillary tube reaches a predefined length (before the terminal end of the rail, etc.) were programmed in the Arduino microcontroller. The controller was coded in the integrated development environment to complete a set of recordings in the forward and backward directions by continuously collecting the data from the accelerometer. Level measurements have been conducted on two Dewars during several trials by configuring the hardware with the following specifications:
The velocity of the capillary tube motion was set to 0.95 cm/s.
The Arduino microcontroller was programmed to acquire the vibration signals from the accelerometer at a sampling frequency of 200 Hz.
The acquired vibration data were sent to the computer from the microcontroller at a baud rate of 9600 bits/s through serial communication.
The automated algorithm to determine the LHe level was implemented using Python-based open-source software9,10 in a system having a 2 GB RAM, 3 GHz Intel Core 2 Duo CPU.
The whole time axis (in seconds) of the measured vibration signals is calibrated as distance (in centimeters) by multiplying with the velocity of the capillary tube movement. Since the level of the liquid is represented as the distance from the bottom of the Dewar, the distance from the top of the Dewar at which the sudden rate of change in thermoacoustic oscillations occurred is subtracted from the total height of the Dewar.
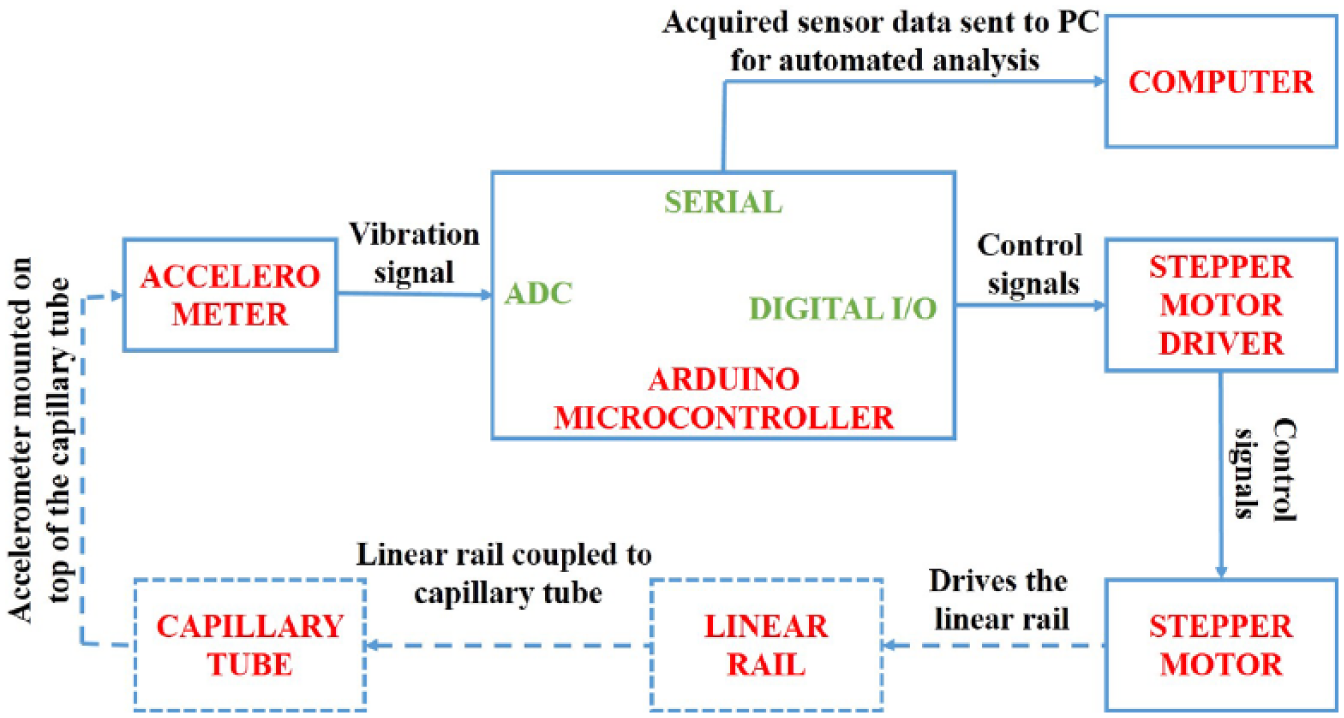
Block diagram of control loop of the proposed hardware.
Algorithmic Identification of LHe Level from Thermoacoustic Vibration Signals
The level of LHe was deduced by measuring the time instant (and so the distance) at which the accelerometer signals exhibited a sudden rate of change in the thermoacoustic vibrations. An automated approach for identifying the onset of the change in vibration signals is similar to those discussed in the literature for determining certain features of the cardiac cycle.11,12 While a detailed description of each of these steps is given in the next section, a brief description of the set of procedures is given below.
The vibration signal recorded by the accelerometer was filtered with a cutoff frequency of 100 Hz using a second-order Butterworth low-pass filter.
The filtered signal was differentiated twice and was squared to represent the trace with positive deflections.
The squared signal was then fitted to a 12th-order polynomial function using least square approximation.
The signal obtained in the previous step was then fitted to a first-order Gaussian function.
A tangent passing through the instant of maximum slope on the Gaussian curve was obtained.
The instant at which the tangent intersects with the x axis was taken to be the onset of the change in thermoacoustic vibration in the recordings done in the forward direction (capillary tube advanced from the top of the Dewar).
The same procedure was followed for the vibration signals measured from the accelerometer when the capillary tube was withdrawn in the reverse direction. A tangent was drawn on the point of the minimum slope for this case to infer the time instants of occurrence of the rate of change in vibrations.
The liquid level was calibrated as distance in centimeters, measured from the top or bottom of the Dewar by multiplying the time instant values with the velocity of motion of the capillary tube.
An average of the liquid levels measured in both the forward and backward motion of the capillary tube was taken as the effective liquid level.
It is a well-known fact that the derivative function eliminates the slow changes and enhances a sudden rate of change in the signal. In similar lines, higher-order polynomial fitting facilitates better approximation of a signal. However, the optimal choice of the second-order differentiation and twelfth-order polynomial fitting has been extensively evaluated for generalizing the automated method by testing it on a number of cases. Since the vibration signals are subjected to the same set of mathematical treatments, the accuracy or bias is expected to be the same, justifying the choice of these parameters.
Results and Discussion
The main objective of this work was to quantitatively measure the rate of change in thermoacoustic vibrations in the LHe Dewar. The proposed approach attempts to refine the detection capability of the method for finding LHe levels by advancing a generality in detecting the well-known thermoacoustic oscillations. The approach takes care of the inevitable ambient noise and other irrelevant fluctuations that interfere with the measurement (and might prevent direct visualization of the change in vibration to infer the liquid level) and selectively highlights only the change in vibrations characterized by their onsets, the region of interest for this study.
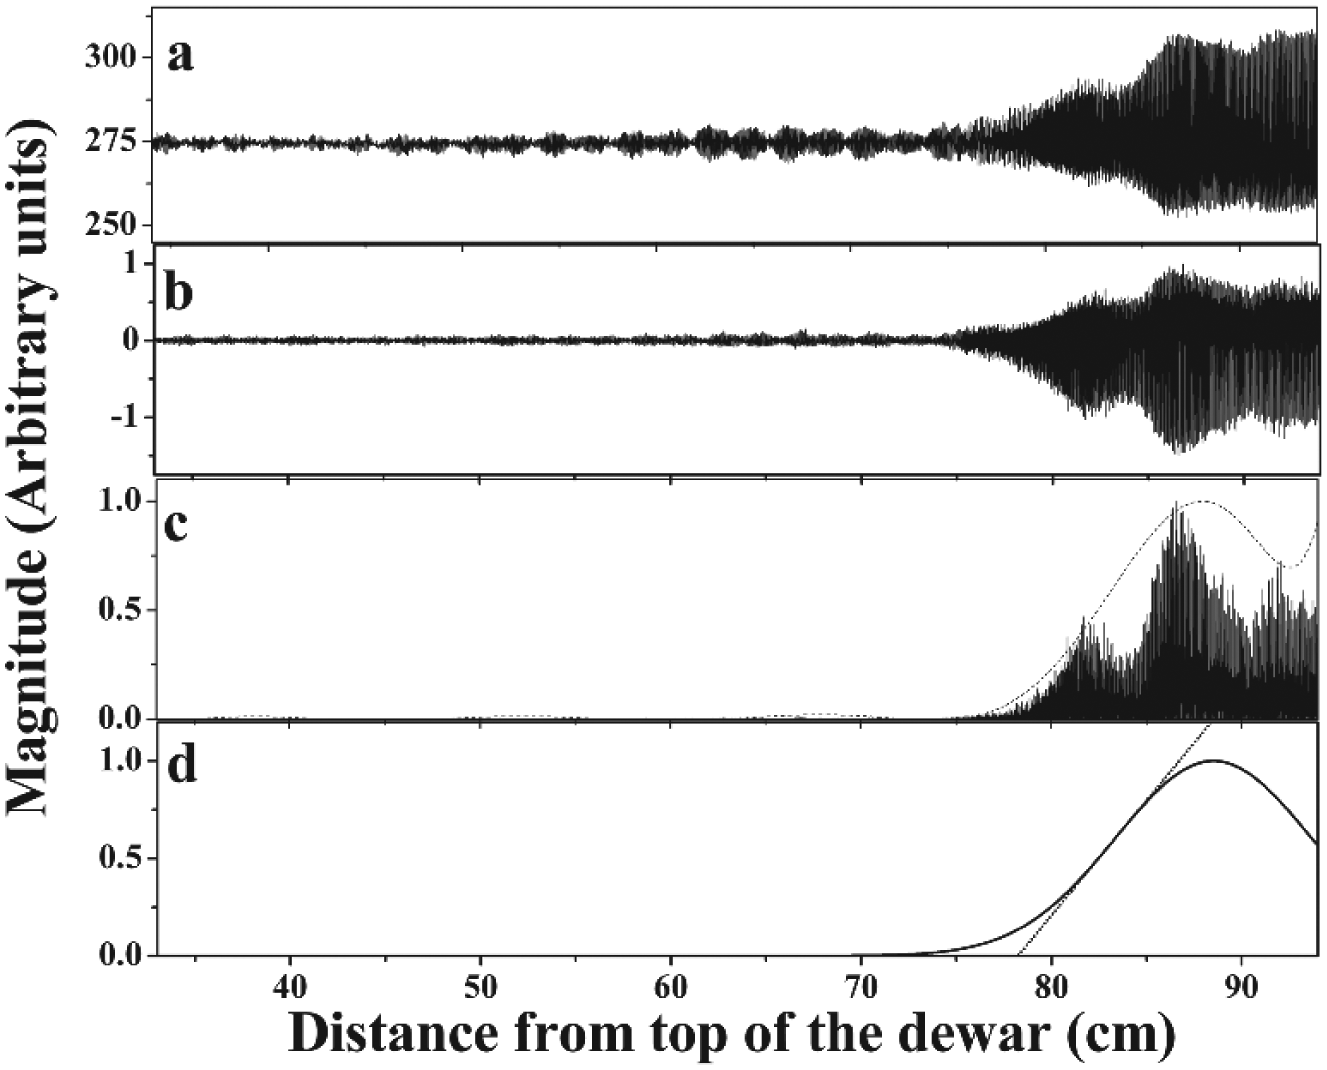
Figure 4 illustrates the step-by-step results of the automated algorithm applied for vibration signals obtained in the forward direction of movement of the capillary tube. It was inferred that the measured signals of the accelerometer contained maximum frequencies in the range of 30–40 Hz, as validated from spectrogram plots generated on the vibration signals (not shown). Hence, the signals were band limited to eliminate frequencies beyond 100 Hz, as shown in Figure 4a . Figure 4b shows the second-order derivative of the filtered signal in Figure 4a , which preserves only the significant changes in the signal by reducing very low-frequency variations in the signal. As seen in Figure 4c , squaring the differentiated signal accumulates the rate of change of all the relevant variations in the signal and attempts to transform it into a bell-shaped trace. The polynomial fitting of the squared signal (shown as a dotted trace in Fig. 4c ) oversmooths irrelevant wiggles and envelops the accumulated variations in the vibration signal. Since the onset of these variations is the parameter to be identified, the slope or gradient is computed on the fitted curve. However, by extensive evaluations it was found that the shape of the vibration signals varied across different trials in the measurement sessions, causing multiple peaks in the polynomial fitted curves, which seriously affected the measurement of the slope; hence, the smooth polynomial-fit curves were fitted to a Gaussian function of first order, as shown in Figure 4d . It was found that this approach also eases the determination of the onset of the variations by drawing a tangent passing through the point of the maximum slope. The x axes of all the plots in Figure 4a are calibrated in distance measured from the top of the Dewar for identification of the level.
(
Figure 5 exhibits the efficacy of the automated approach in converting the vibration signals (measured in both directions of movements of the capillary tube) into representative Gaussian wave shapes. It can be noticed that the wave shapes in both cases are proportional to their as-measured raw signal counterparts by completely encompassing the range of fluctuations that are relevant for determining the onset of the changes in vibrations to measure the level of liquid. The two wave shapes are found to be unbiased, consistent, and reproducible fiducial references to note the rate of change of vibrations in the two directions. This has been validated in a number of trials by repeated measurements. Since the level of the liquid is represented as the distance from the bottom (like for the vibration measurement in the backward direction), the distance from the top of the Dewar is subtracted from the total length of the capillary tube. Further, the accuracy of the level measurement is improved by taking an average of the distances measured in both directions.
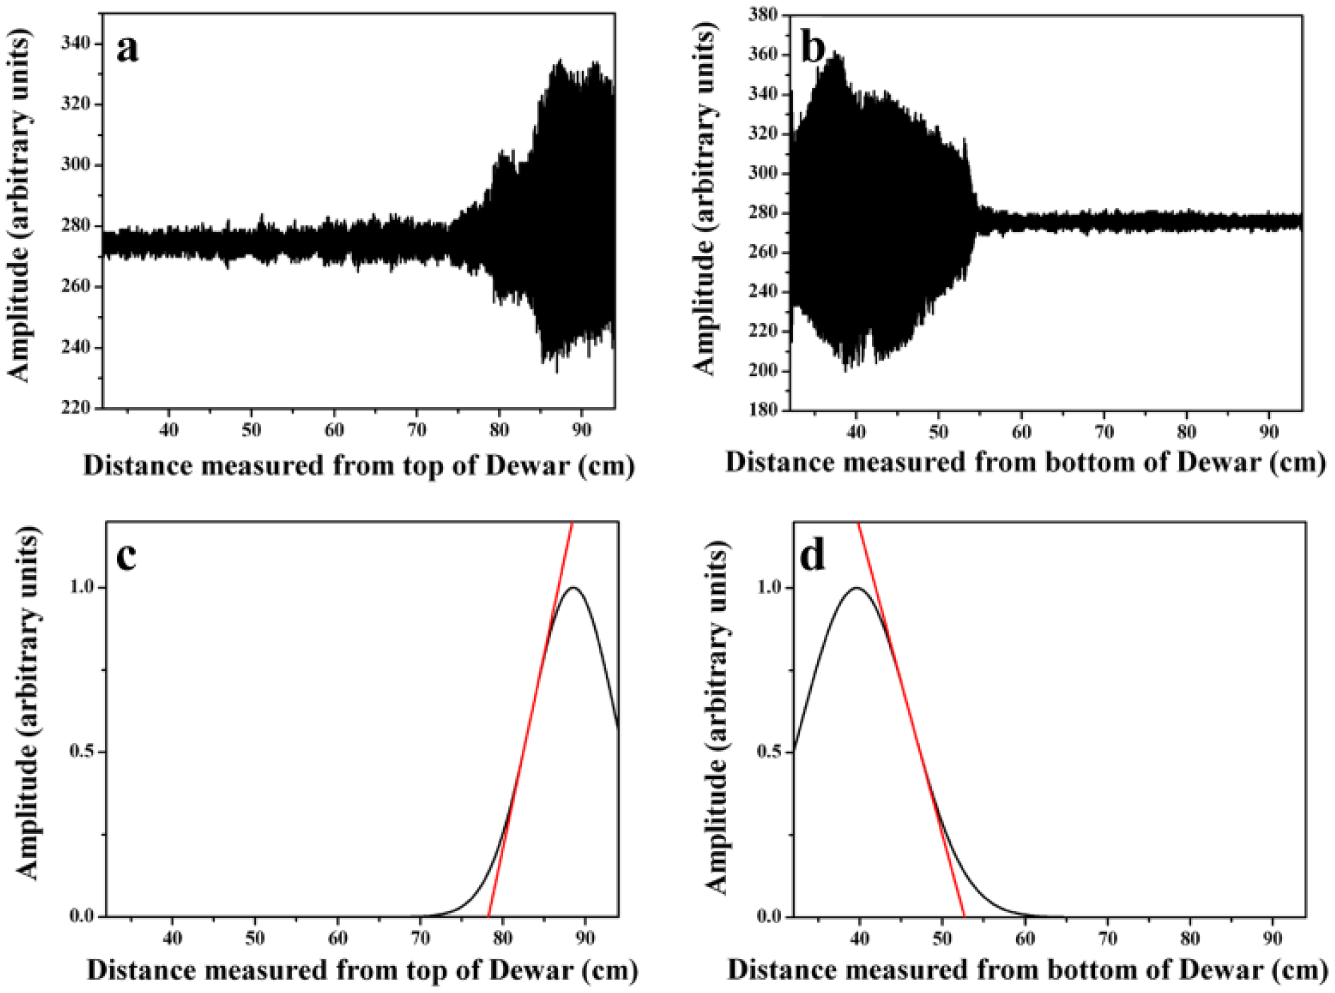
Vibration signals measured during the forward movement of the capillary tube from the top of the Dewar to the bottom (
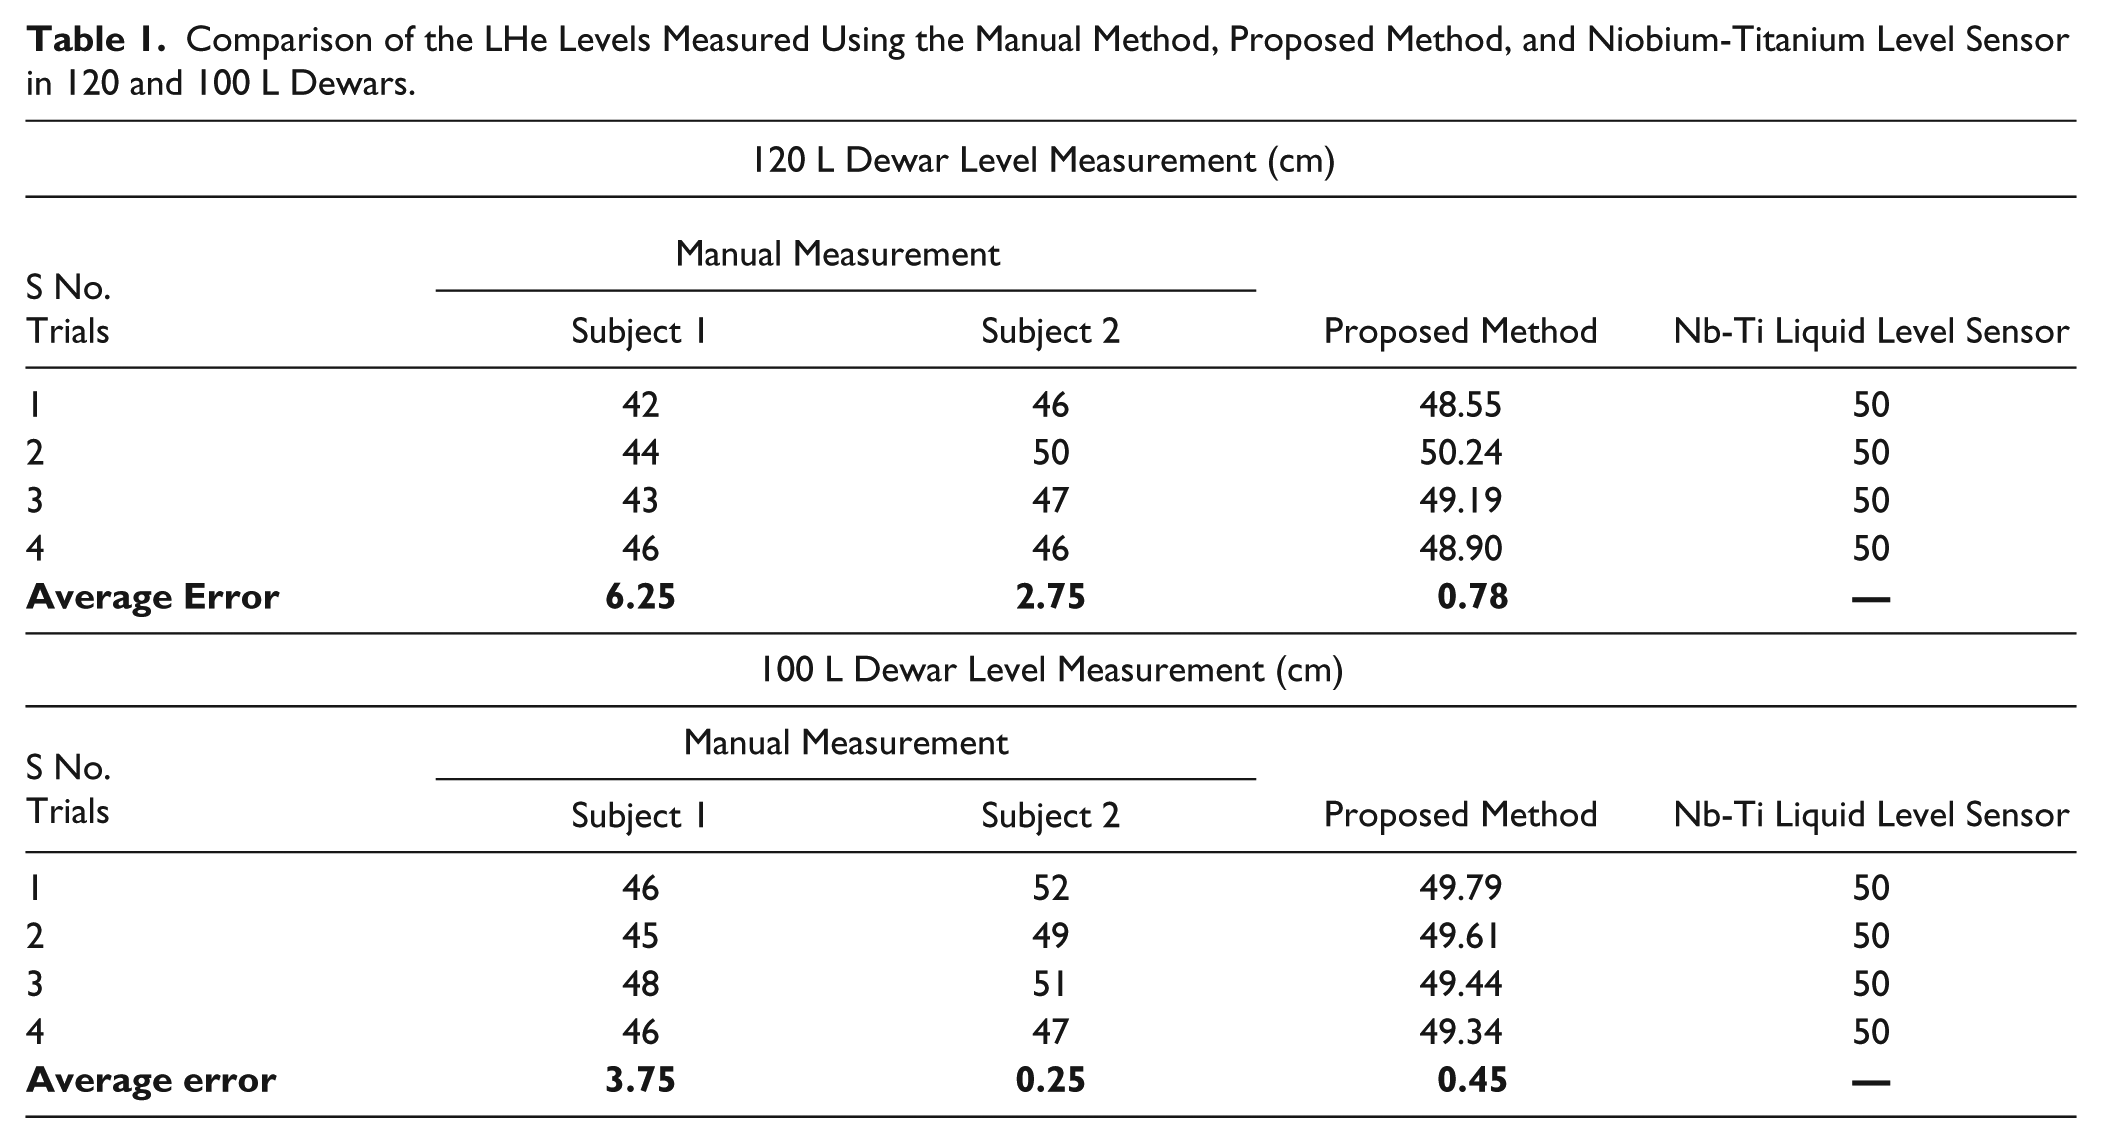
LHe levels in two different Dewars determined using the proposed instrumentation are tabulated in Table 1 . Manual sensing of the thermoacoustic vibrations on the rubber membrane kept on top of the capillary and the levels measured using the gold standard superconducting level sensor based on Nb-Ti wire (American Magnetics Inc. [AMI], Oak Ridge, TN, USA) for both Dewars have also been tabulated for comparison. The average errors, which are calculated by taking the difference between the liquid levels determined from both the proposed and manual methods and the gold standard method, are also tabulated. It can be noticed from Table 1 that the liquid levels measured using the proposed system are in agreement with the superconducting level sensors with a mean error of less than 1 cm. This observation highlights the suitability of this cost-effective approach using an Arduino microcontroller. Another observation from Table 1 is that, as expected, the manual method of sensing the vibrations exhibits a greater degree of errors.
Comparison of the LHe Levels Measured Using the Manual Method, Proposed Method, and Niobium-Titanium Level Sensor in 120 and 100 L Dewars.
Since the vibration signals are in the audio frequency range (less than 40 Hz), a microphone could also be effectively used for detecting their change. However, since ambient noise may easily dominate the audio of interest, the situation might demand the use of multiple microphones around the oscillatory membrane to selectively retrieve the vibration signals of interest. Hence, to avoid complexity in terms of design, computational load, and economy, a simple accelerometer as proposed in this study might be a better choice.
The proposed approach is hence justifiable, first for its design in administering the vibration measurement in a reliable way and second in determining the level in a more quantitative manner. The proposed approach is obvious for its generality in obtaining reproducible results not involving any skilled personal in monitoring the liquid level, and so is suitable as a routine measurement in low-temperature facilities.
Conclusion
The novel idea of using an accelerometer to detect and analyze thermoacoustic vibrations for finding the level of LHe has been demonstrated, and the results obtained are in agreement with those measured using the most widely used superconducting level sensors. The approach discussed in this work enhances the detection capability of sensing the level through vibration signals compared with the manual perception of these vibrations. With the help of carefully designed hardware, the registration of vibration signals is ensured, and since it is fully conducted by a motorized arrangement and a quantitative means of inferring the level by the devised algorithm, human errors are expected to be eliminated, providing a guaranteed reproducibility of the results. By interfacing the proposed hardware with wireless modules, it is possible to realize the system in the Internet of Things (IoT) domain to remotely monitor and control the system for a variety of demanding situations.
Footnotes
Acknowledgements
The authors would like to thank Mr. C. Kumar, Mr. Prasantha Kuanr, Mr. K. C. Arun, Mr. M. Selvam, Mr. M. Vasudevan, and Mr. Janakiraman for their technical assistance during the development of the hardware used in this experimental work. The authors would also like to thank Ms. Pragyna Parimita Swain for her support in conducting the experiments. It is a pleasure to thank our colleagues Mr. R. Baskaran, Dr. N. V. Chandra Shekar, and Dr. G. Amarendra for encouragement and support.
Declaration of Conflicting Interests
The authors declared no potential conflicts of interest with respect to the research, authorship, and/or publication of this article.
Funding
The authors received no financial support for the research, authorship, and/or publication of this article.