
Abstract
This article presents the development of a low-cost microcontroller-based interface for a microbioreactor operation. An Arduino MEGA 2560 board with 54 digital input/outputs, including 15 pulse-width-modulation outputs, has been chosen to perform the acquisition and control of the microbioreactor. The microbioreactor (volume = 800 µL) was made of poly(dimethylsiloxane) and poly(methylmethacrylate) polymers. The reactor was built to be equipped with sensors and actuators for the control of reactor temperature and the mixing speed. The article discusses the circuit of the microcontroller-based platform, describes the signal conditioning steps, and evaluates the capacity of the proposed low-cost microcontroller-based interface in terms of control accuracy and system responses. It is demonstrated that the proposed microcontroller-based platform is able to operate parallel microbioreactor operation with satisfactory performances. Control accuracy at a deviation less than 5% of the set-point values and responses in the range of few seconds have been recorded.
Introduction
Microbial fermentation process development generally demands a high number of well-controlled laboratory-scale cultivations. These experimental works are necessary as they are usually needed for media optimization, cell line selection, and for maximizing process yield and productivity.1,2 To date, most of these experimental works are done in shake flasks and lab-scale bioreactors. 3 In a shake flask, fermentation experiments can be initiated simply by adding the fermentation medium and the necessary culture inoculum at the right volume proportion. When running experiments in shake flasks, smaller volumes (i.e., between 100 mL and 1 L) are normally used with the possibility of parallel experimentation. 3 Indeed, a very handy experimental tool. However, shake flasks do not offer a similar capacity in controlling essential process conditions compared to lab-scale bioreactors. By contrast, lab-scale bioreactors are normally equipped with sensors and actuators for a tight control over important reactor variables such as temperature, pH, dissolved oxygen concentration, and mixing speed.4,5 Clearly, bioreactor systems present better control circumstances for studying fermentation experiments. On the contrary, handling bench-scale bioreactors is not so straightforward. In practice, it usually involves inoculum development (preculture phase), the preparation and sterilization of various solutions (i.e., the acid/base solution, antifoam solution, reactor medium, etc.), setting up the necessary fluidics connections, and extensive cleaning of the reactor at the end of each operation. In addition, relatively larger volume consumption (minimally around 1 L) has hampered its exploitation for multiple reactor operations.
Considering the circumstances, a microbioreactor platform would provide an attractive solution to these shortcomings. A microbioreactor is a very small-scale bioreactor system, fabricated to support biological experiments in sub-milliliter range volume (typically less than 1 mL range). 6 At this reduced scale of operation, (1) medium consumption is significantly lowered, (2) transport processes (i.e., heat and mass transfer rates) are comparatively faster due to a high surface area to volume (S/V) ratio, and (3) parallel operation for higher throughput is feasible because of a much smaller reactor footprint.6,7 Based on the current data, microbioreactor technology for microbial cultivation applications has progressed to a state where process conditions in lab-scale bioreactors can be reproduced and accurately mimicked in such a microbioreactor platform.8–10
In microbial fermentation processes, growth and production rates of the cells are strongly dependent on the process physical parameters—namely, the dissolved oxygen (DO) level, pH, and temperature. 11 Therefore, in order for the microbioreactor to sustain the fermentation process, automated sensing and control of these parameters are imperative.6,12 Table 1 summarizes the typical measured and controlled variables and common data acquisition interface for various microbioreactor systems.9,10,13–23 In microbioreactors, resistance temperature detectors (RTDs) such as thermistors, Pt 100, and so on are generally used for temperature measurement. They are available in very small sizes and can easily be integrated into the reactor.18,20,21 To regulate the temperature, miniature heaters can be employed.18–21 Since microbioreactors are normally not thermally insulated, they are inevitably exposed to a significant heat loss to the surroundings (due to the reactor’s high S/V ratio). 6 This has made temperature control relatively challenging as energy input is needed to balance the heat loss as well as to provide sufficient heat to maintain temperature at the desired set-point values. Sampling is not an option in microbioreactors because of the low working volumes (<1 mL). Thus, monitoring of the fermentation progress is often facilitated by using optical probes. For cells’ optical density, measurement is based on the Beer-Lambert law with optical fibers used as waveguides for transmission and collection of light signals.9,10,13,14,16,17,20–23 As for pH and DO measurements, an optical sensing method is usually applied with the use of a fluorescent sensor spot or “optodes.”9,10,13–17,21–23 pH optode readings are rather linear between pH 5.5 and pH 8 but become insensitive beyond this range. 24 Presently, pH in microbioreactors is maintained either by a buffered med-ium10,13,16–18,21 or through an intermittent addition of acid or base.9,14,15,19 The latter has been reported to be limited by the microbioreactor volume and acid/base molarity.6,9 On contrary, a DO sensor spot can work for the entire saturation values (i.e., from 0% to 100%), and their sensitivity is optimal at low DO levels. Moreover, DO levels can be maintained above the desired level simply by membrane aeration.9,10,13–16,19,20–23 Details on measurement principle and sensing instruments can be found in a review article on microbioreactor technology for fermentation processes by Schäpper et al. 6
Typical Measured and Controlled Variables and Common Data Acquisition Interface for Various Microbioreactor Systems.
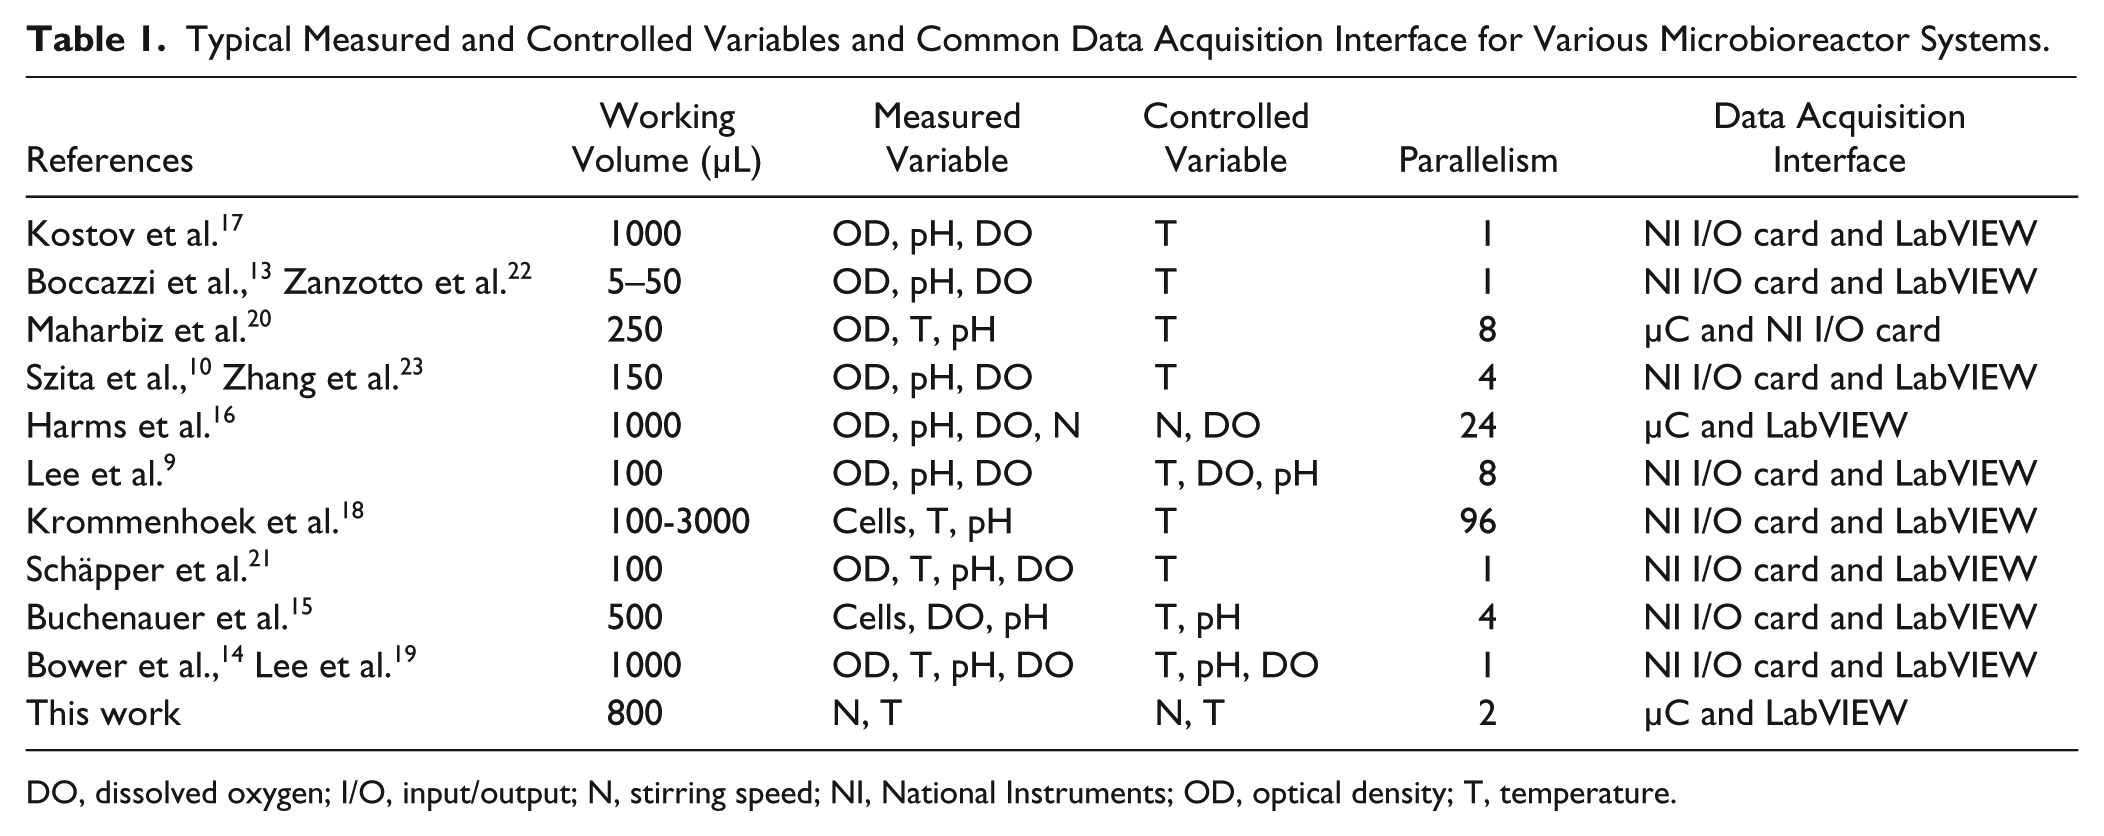
DO, dissolved oxygen; I/O, input/output; N, stirring speed; NI, National Instruments; OD, optical density; T, temperature.
The monitoring and process control tasks in microbioreactor system are normally complex as they involve more than one feedback control loop.6,12 In microbioreactor operation, often sensors and actuators from the microbioreactor system are connected to a data acquisition (DAQ) device (also known as an input/output [I/O] card) for input and output of signals.9,10,13–23 Truly, process data are also readable via oscilloscopes or multimeters, but the use of computers (i.e., through a DAQ device/card) is an added advantage as data can be stored and converted to a format that can be used by spreadsheets (e.g., Excel) or other software packages such as MATLAB for more extensive analysis. 25 Another advantage in particular is the obtainment of real-time data for monitoring and control purposes with possible realization of a fully automated microbioreactor setup. Based on the collected literature ( Table 1 ), it seemed that most microbioreactor operators opted for a readily available data acquisition device (i.e., off-the-shelf boards) to execute the above-mentioned tasks. One of the most widely used data acquisition devices is the National Instruments (NI) DAQ device/card (National Instruments, Austin, TX).9,10,13–23 Program codes for measurement and control can be written in LabVIEW (National Instruments) software and implemented by interfacing the LabVIEW software with a suitable NI DAQ device. Indeed, this is a viable solution and obviously beneficial for process automation and multiplexing of the microbioreactor operation. Another interesting choice that is worth looking at is the use of microcontrollers, where this embedded-based technology offers a more cost-effective solution with flexible design.
A microcontroller is miniaturized computer on a single integrated circuit with a processor core, memory, and configurable peripherals that form the main components of the system. The memory consists of read-only memory (ROM) to store the program code and ready-access memory (RAM) that serves as the temporary data storage such as measurement data or adjustable system parameters. The clock rate running at typically up to 100 MHz in modern microcontroller systems determines the speed of the processing to be executed, which then dictates the sampling time needed for the system under control. Digital I/O serves to interface the microcontroller to the real application in terms of bit control while analog interfacing is done through analog-to-digital (ADC) channels. The number of digital I/O and ADC depends on the type of the microcontrollers used, and for optimal design, the number of I/O and ADC used must be configured according to the need of the application for cost efficiency. Among the most popular microcontrollers are 8-bit, 16-bit, and 32-bit architecture families of programmable interface controllers (PIC) from Microchip (Arizona, USA), Alf and Vegard RISC (AVR)- and Advanced RISC Machines (ARM)-based microcontrollers by ATMEL (San Jose California, USA), and Freescales (Austin, Texas, USA). However, with the increasing trend of adapting the use of microcontrollers as an embedded system in many applications, many manufacturers have created a development board to speed up interfacing microcontrollers to the system. Among the popular is the Arduino board (an open source hardware created at Interaction Design Institute Ivrea, Italy in 2005), which runs on an advantageous open-source platform and features easily configured hardware and software settings. With the ATMEL microcontroller running as its core, it has all the digital I/Os with pulse-width-modulation (PWM) outputs that are necessary for acquisition and control purposes.
In this work, an Arduino MEGA 2560 with 54 digital I/Os, including 15 PWM outputs, was chosen to replace the off-the-shelf DAQ card to perform the acquisition and control of a microbioreactor. The 245 kBytes of flash memory, 8 kBytes of static RAM (SRAM), and 4 kBytes of EEPROM (electrically erasable programmable ROM) have proven to be more than adequate for the designed microbioreactor system, even when interfaced with LabVIEW software residing on the terminal PC. The article first describes the details of the microbioreactor prototype used, the circuit (hardware) of the microcontroller-based interface, and the signal conditioning steps. Second, measurement and control routines written in LabVIEW software and its implementation are discussed. The calculated output of the control algorithm was converted to PWM signals, which were then used to regulate the temperature and mixing speed. Finally, the performance of the proposed low-cost microcontroller-based interface was evaluated in terms of control accuracy and system responses. Mixing quality of the microbioreactor system was also completed. Throughout the work, two microbioreactor prototypes were tested running in parallel where each reactor had been equipped with independent mixing speed and temperature control capacity.
Materials and Methods
Microbioreactor Design and Fabrication
The scheme of the experimental setup for the microbioreactor is illustrated in Figure 1 , which illustrates only the general I/O between the setup and the digital computer (which in this case is the microcontroller). The microbioreactor prototype presented in this work was fabricated with integrated temperature and mixing speed control capacities (i.e., minimum features needed to perform biocatalyst experiments under buffered medium). The prototype was designed to work with constant working volume, with no head space and under bubble-free conditions. It contained a single poly(dimethylsiloxane) (PDMS) layer pressed between two poly(methylmethacrylate) (PMMA) layers. The top PMMA layer consisted of space for insertion of the Pt 100 temperature sensor and through-holes for the fluidics connections where the middle PDMS layer functioned as a gasket layer to ensure water-tight sealing between the middle PDMS layer and the PMMA layers. The bottom PMMA layers consisted of a reaction chamber with a total working volume of approximately 800 µL. A small magnetic stirrer (7 mm [length] × 2 mm [width]) was also placed inside the reaction chamber to provide necessary mixing for the microbioreactor operation. The prototype was fixed on top of an operating platform that contained a microheater and a 12-V direct current (DC) PC mechanical fan for temperature and stirring control, respectively. In this microbioreactor setup, a voltage regulator IC (i.e., a 5-VDC, 1.5-A transistor) was used as the microheater, and small ferrite magnets were glued on top of the PC mechanical fan to give the north and the south pole arrangements for the stirring speed detection by the Hall effect switch. Details of this operating platform have been described elsewhere. 26
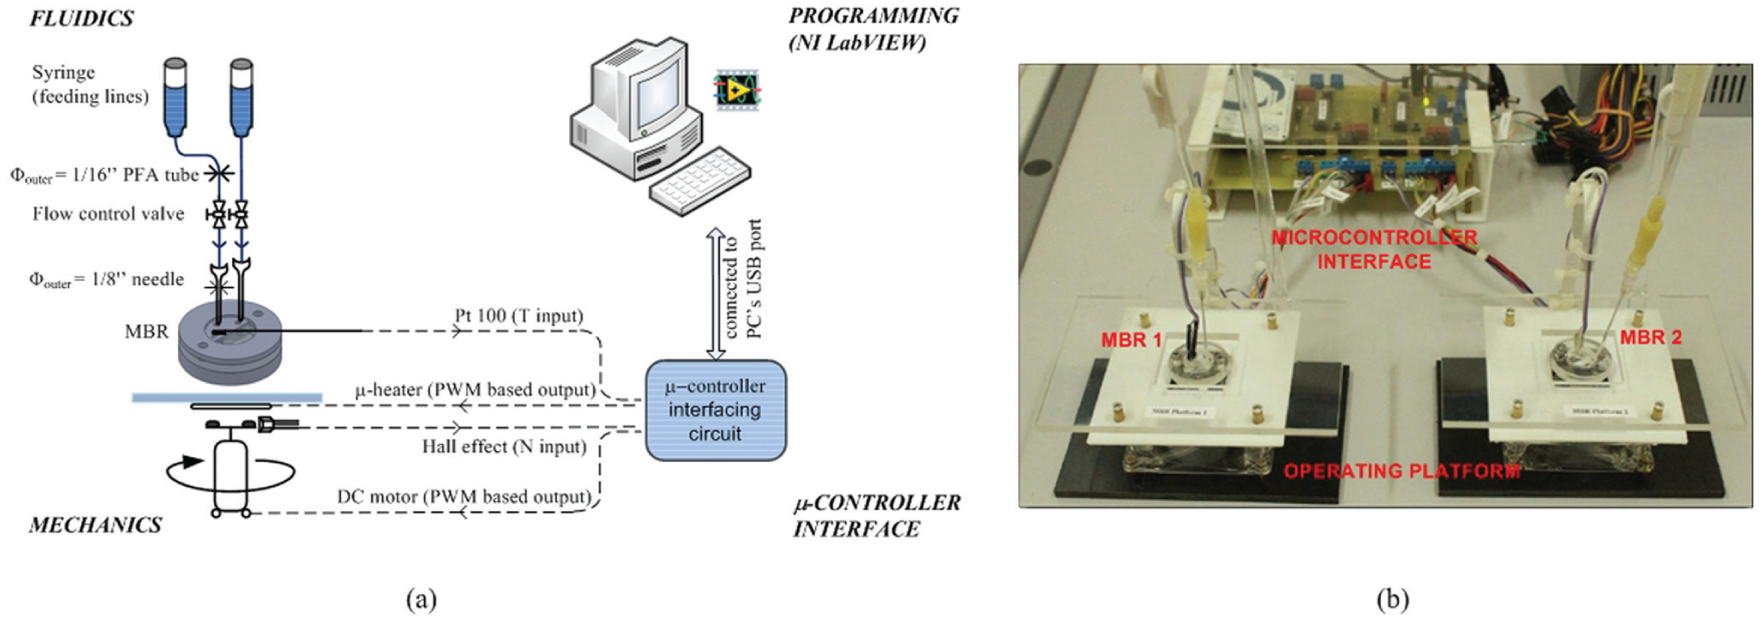
Schematic of the microbioreactor experimental setup. The microbioreactor prototype was fixed on top of an operating platform that contained a microheater and a 12-V PC mechanical fan for temperature and stirring control, respectively. Also, a standard medical fluid infusion set was used to facilitate liquid filling into the microbioreactor where a 1-mL syringe was used as a feed reservoir. The figure illustrates only the general input/output between the setup and the digital computer (which in this case is the microcontroller).
Prototyping of the microbioreactor was done with three-dimensional (3D) computer-aided design (CAD) software, SolidWorks (Dassault Systèmes SolidWorks Corporation, Waltham, MA), and micromachining. Fabrication was all done by using PMMA and PDMS (Dow Corning Sylgard 184 Silicone Elastomer; Dow Corning, Midland, MI) polymers as materials for the fabrication. 27 The microbioreactor setup was duplicated to facilitate parallel reactor operation. Sensors and actuators from both microbioreactors were all linked to a microcontroller-based interface.
Programs for measurement and control routines were written in LabVIEW Academic Premium Suite software (National Instruments) and were implemented by interfacing the LabVIEW program with a microcontroller-based interface for input and output of signals. In the microbioreactor prototype presented here, only the mixing speed and the temperature of the microbioreactor content were measured and controlled. Further analysis of the online measurement data (i.e., the stirring speed frequency and temperature measurement values) was done using MATLAB software v7.0 (The MathWorks, Natick, MA).
Microbioreactor Operation and Experimental Work
In this prototype, a common medical fluid infusion set was used to facilitate liquid filling into the microbioreactor. The tip of the fluid infusion set (i.e., the needle) was inserted into one of the fluidic ports, and water filling was controlled via the roller clamp valve. In addition, a 1-mL syringe was used as a water reservoir for replenishment of evaporated water vapor during the experimentation. The water evaporation rates were measured to be on the order of 170 µL·h–1 at 50 °C. During startup, the reactor content was first filled with water by injecting a known amount of desired working solution. Next, the Pt 100 temperature sensor was connected to the reactor, and both the temperature and the stirring control routines were initiated. In this work, water was used in every experimental work.
Experimentation carried out in this work was to objectively assess the reliability and the performance of the microcontroller-based interface. For this reason, set-point tracking experiments for the proportional (P) – Integral (I) temperature and the mixing speed controllers were performed. The set-point tracking experiments were performed simultaneously for both microbioreactors and were repeated twice to check data reproducibility. Moreover, the mixing quality of the microbioreactor prototype was also assessed by using a simple tracer method. This method was performed by adding a very small amount of concentrated dye using a syringe into the microbioreactor that already had been filled with water. Mixing effects were observed visually, and images of dispersion of the concentrated dye in the reactor were recorded by a digital camera (Nikon D90; Nikon Corporation, Tokyo, Japan). Mixing time was estimated at stirring speed, N of 300 rpm (NRE = 245). Duplicates were made to compare results attained, and the mixing time was recorded as the time needed for the concentrated dye to be completely mixed.
Results and Discussion
Interfacing Microbioreactors to the Microcontroller Platform
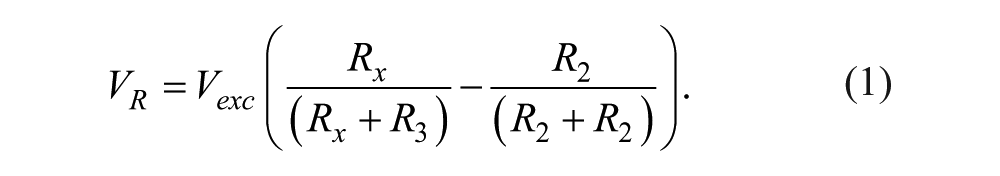
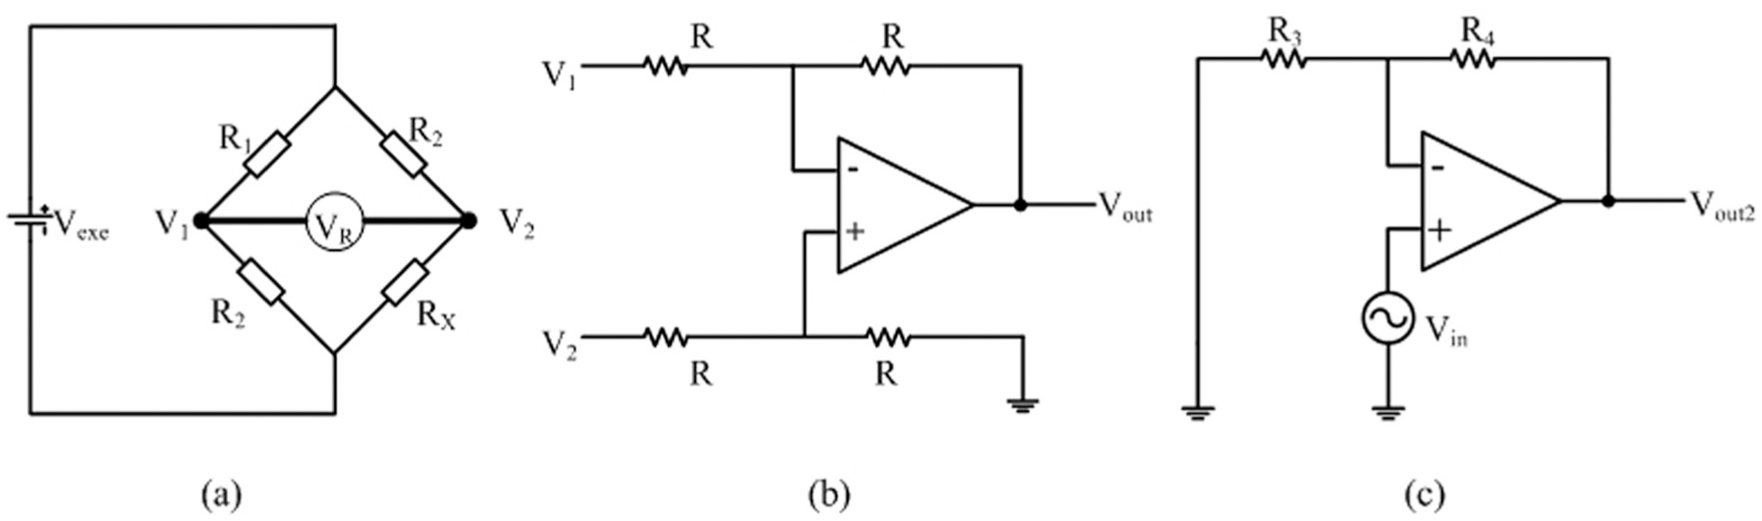
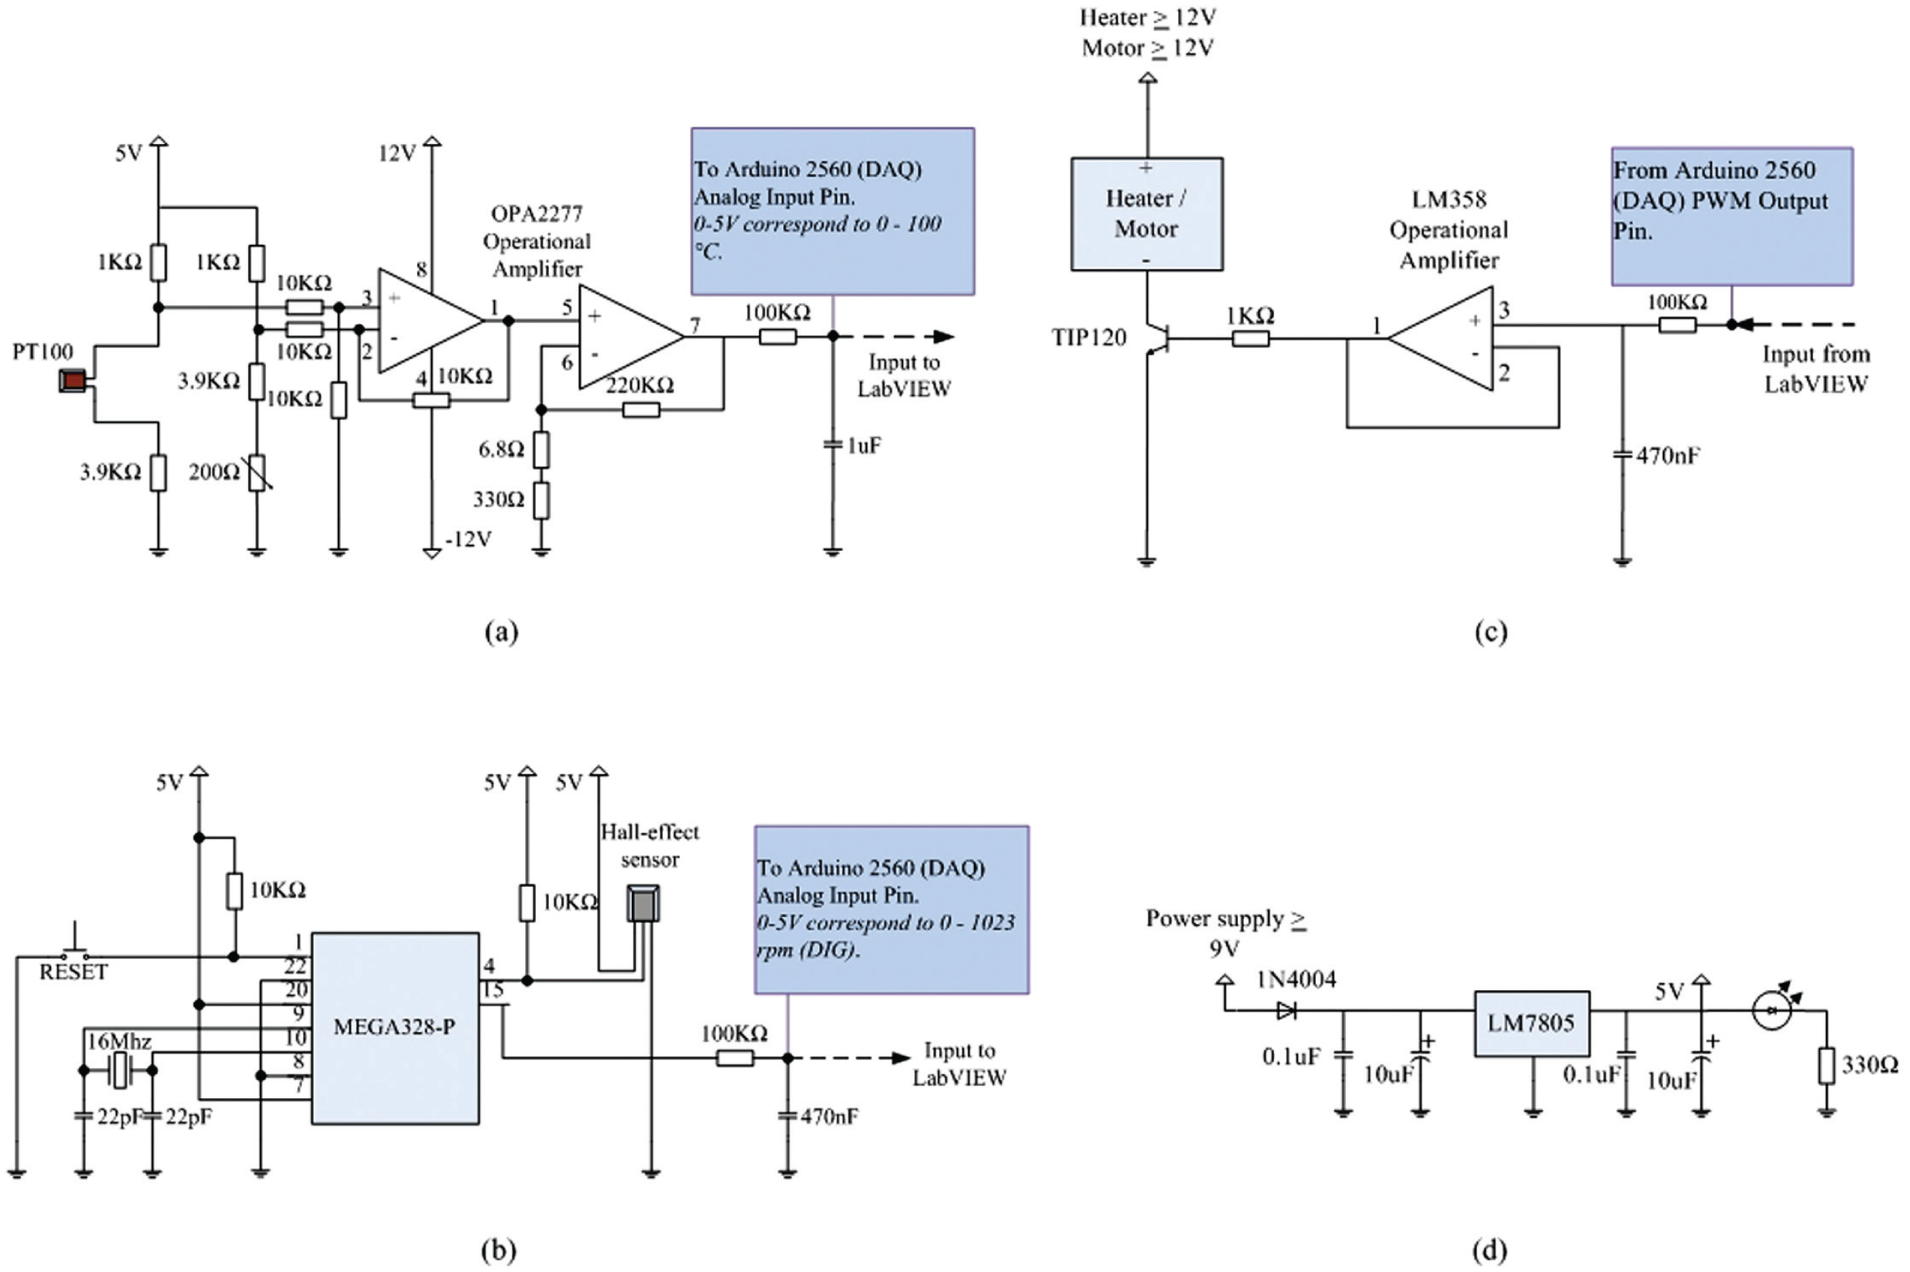
Arduino MEGA 2560 is the embedded microcontroller that serves as the platform to interface the electronic system and personal computer to the microbioreactor. For this specific system, temperature and motor speeds are the input variables captured by the microcontroller while the heaters and DC motors are the actuators to be controlled. Since the LabVIEW program is used as the graphical user interface (GUI) for the system, a firmware—a specialized driver written in Arduino MEGA 2560—is also developed to perform the initialization of the input/output system. The interfacing of Pt 100 used for the temperature sensor to the Arduino MEGA 2560 requires three steps: (1) detection of voltage change, (2) voltage amplification, and (3) high-frequency noise removal. The resistance of Pt 100 varies with temperature where at a temperature of 0 °C and 100 °C, the resistances would be 100.00 Ω and 138.5 Ω, respectively. Although this Pt 100 is capable of operating in a wide temperature range, which is −200 °C to 850 °C, the operational aspect of this microbioreactor only requires a normal 0 °C to 100 °C temperature range, thus avoiding extra signal conditional circuitry for the nonlinear range of the Pt 100. The change in resistance of the Pt 100 is converted into voltage difference through the use of a Wheatstone bridge circuit, as shown in Figure 2a , and the voltage change VR is given by equation (1). The voltage VR is obtained by the difference in voltage at point 1 and point 2, producing Vout, given by equation (2).

(
The full range of voltage value produced by the difference amplifier, Vout ( Fig. 2b ), is only 7.64 mV, which is rather small to be channeled into the ADC input of the Arduino MEGA 2560. To fully use the 10-bit available ADC, the voltage Vout needs further amplification with a gain of 654. This can be achieved by using a noninverting operational amplifier with configuration given in Figure 2c . The input voltage, Vin, coming from the output of the difference voltage will be amplified to produce Vout2, which is given in equation (3). When R3 = 220K Ω and R4 = 6.8 Ω + 330 Ω are selected from the available discrete resistor values, the amplification gain of 654 is obtained.

To remove unnecessary noise such that a more stable signal is fed into the ADC of the microcontroller, a simple resistor-capacitor low-pass filter is attached at the ADC input pin. The complete interfacing circuit for the Pt 100 is shown in Figure 3a . The operational amplifier model OPA2277, which features low offset voltage and low drift, contains two op-amps in a single chip that can be used to obtain the difference voltage at the Wheatstone bridge and signal amplification. All the calculated discrete values of the resistors and capacitor used in the design are included in the figure.
(
In this microbioreactor, the mixing speed control is performed in a closed-loop configuration with the proportional-integral (PI) controller used as the stabilizing algorithm. The Hall effect sensor is used to provide the speed information of the DC motor to the microcontroller system. This sensor works by detecting the presence of magnetic flux where the output voltage will change alternately from high to low and so on. These alternate changes in the output voltage will produce a series of pulses per unit time in which it can be used to determine the current speed of the motor. The sensor is placed around 2 mm from the propeller magnet to perform the activation. The speed measurement will be used for the real-time calculation of the PI controller, and thus the reading should be sampled at a very fast rate. To achieve this requirement, the so-called mini Arduino 328P is used to interface the Hall effect sensor, as shown in Figure 3b . This mini Arduino will capture the pulse produced by the Hall sensor where an interrupt signal is set such that the pulses are counted between the given set time. The number produced will represent the rotational speed of the motor where the calculated value of speed is converted to a 10-bit PWM pulse at pin 15 of the mini Arduino. The analog value of the speed (rpm) is then obtained by averaging the PWM pulses by using a resistor-capacitor low-pass filter in which the average speed values are fed to the ADC channel of the Arduino 2650, which acts as the DAQ board. It should be noted that the mini Arduino is added in this design such that the real-time timeliness of the closed-loop control of the motor can be guaranteed.
For the actuation of the stirrer bar in the microbioreactor, the commonly available 12 VDC PC fan is used with the fan blade removed. PWM signals representing the desired speed of the motor are obtained from the output of the PI controller in which the PWM pulses are averaged by a low-pass filter and amplified by an LM358 operational amplifier to match the 12-V supply voltage. In similar line of design, the driving circuitry for activation of the heater uses the same conditioning and amplification approach, where the circuit is as shown in Figure 3c . Figure 3d , in addition, shows the schematic of the voltage regulator to supply a stable 5-V voltage to the electronic circuit in the system.
LabVIEW Programming
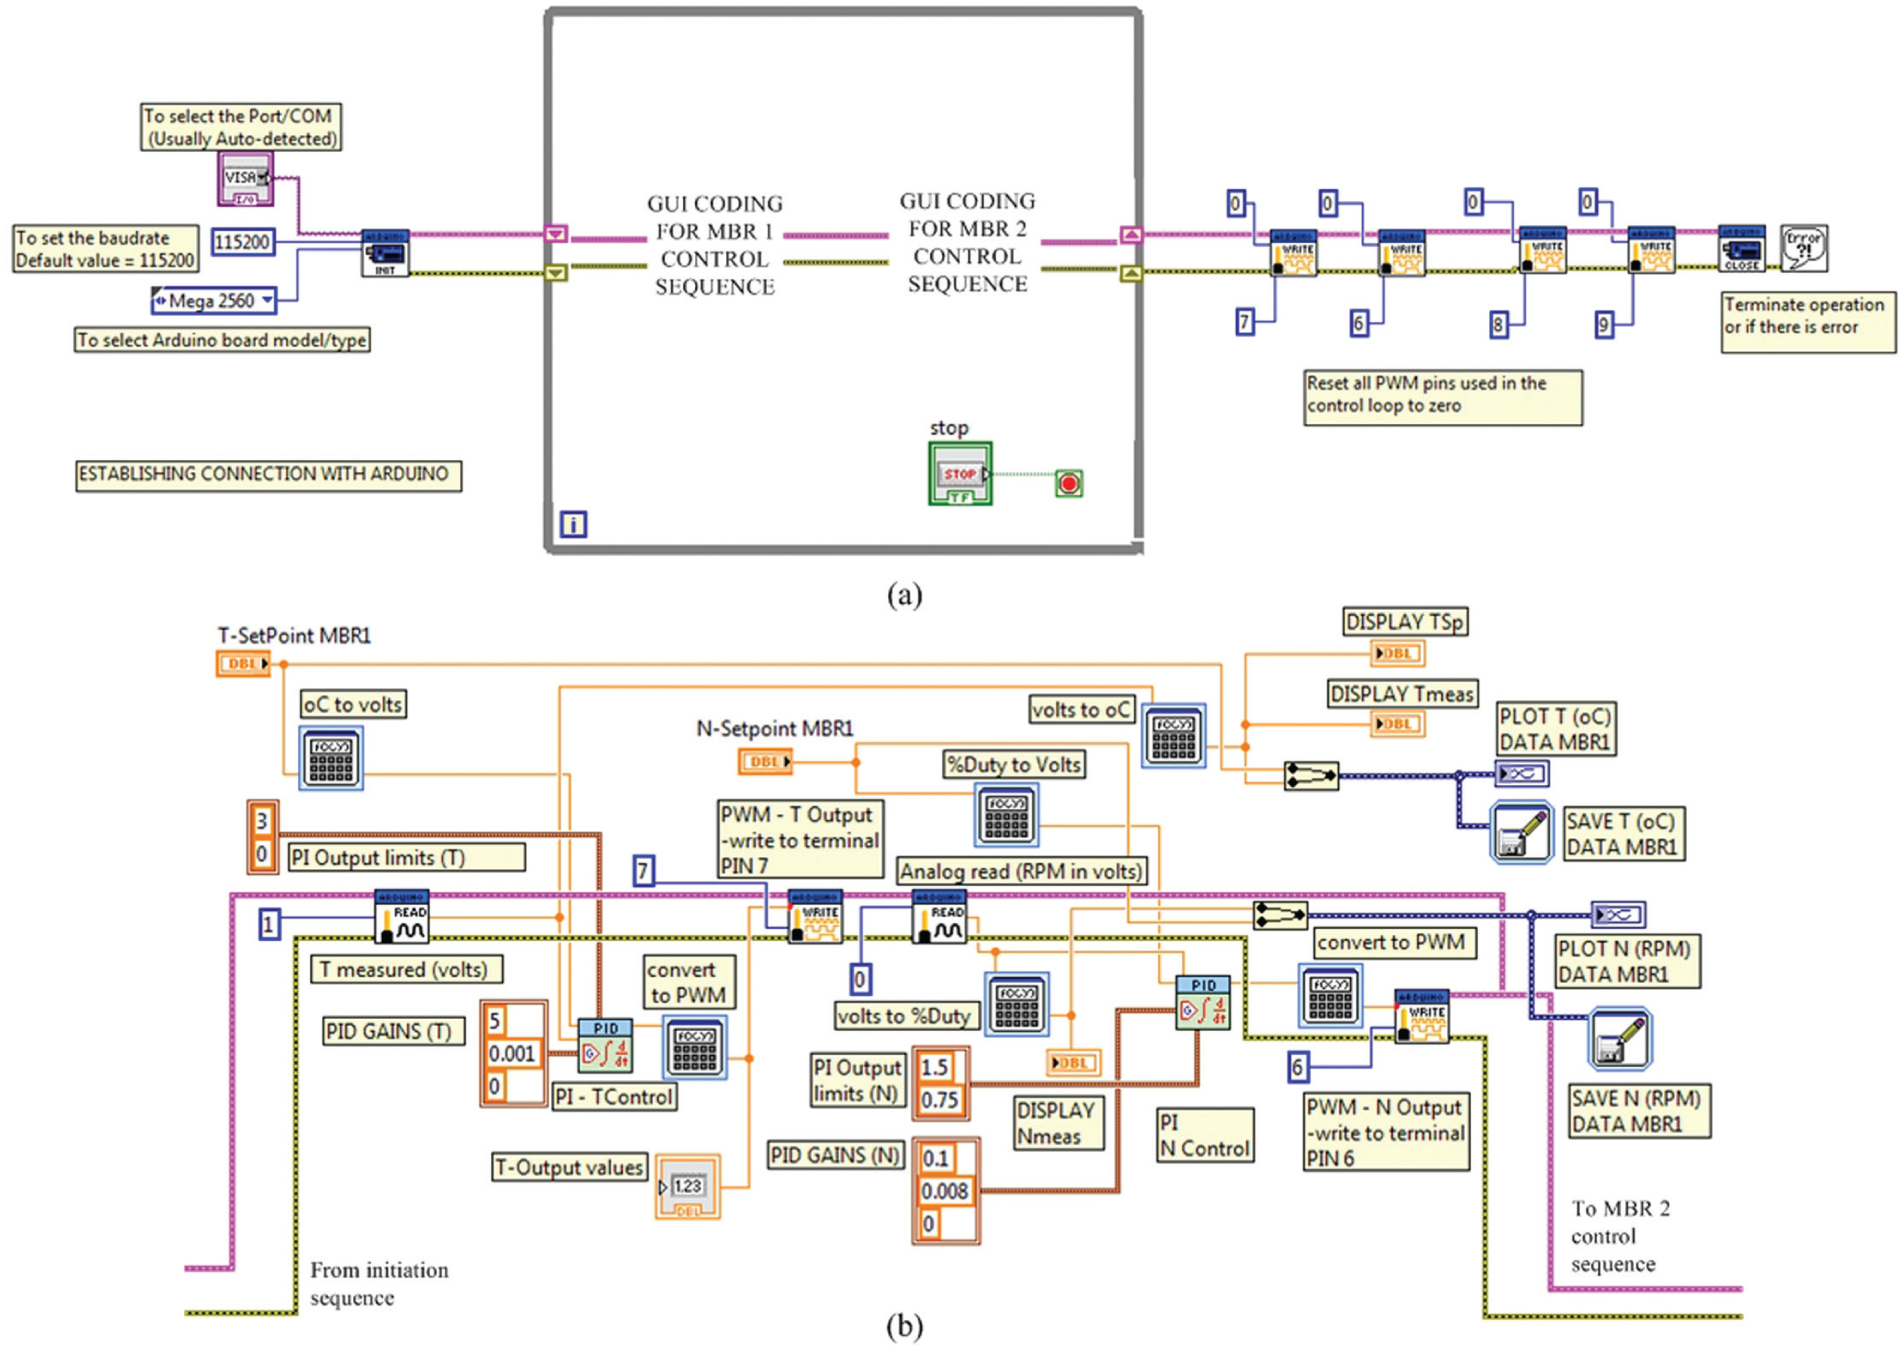
The entire microbioreactor setup was controlled by the LabVIEW programming language software and implemented by interfacing the software to the microcontroller-based interface for the input and output of signals. In the LabVIEW programming environment (VI), data are passed from one node/sub-VIs to another through designated input terminals (usually to the left of each node), and the resulting values are obtained through the node’s output terminal, which is normally to the right side of the node. Wires in the block diagram window represent the flow of data within the VI. 25 For this particular microbioreactor setup, the whole operating scheme was written in series. The VI featured two main aspects: (1) the measurement and control of microbioreactor temperature and mixing speed and (2) subdiagrams to facilitate parallel microbioreactor operation. This is presented in Figure 4a .
(
In the program written, first, a connection to an Arduino I/O card running the LabVIEW interface was initiated. It is important to note here that the baud rate specified must match with the default baud rate defined in the Arduino firmware. For our application, the baud rate has been set to a maximum value of 115,200 bits per second (bps). The Arduino Initiate sub-VI is also linked to a visa resources element. The visa resources element enables the program to automatically identify the resources on which the VI operates (i.e., the I/O physical channels) and distinguish between different sessions of the microbioreactor operation. This is necessary as more than one I/O physical channel was used during the entire microbioreactor operation. Each Arduino sub-VI was linked together through the task in/out terminal to ensure continuous data transfer once the program initiated. Since the error in/out terminal is also wired from one Arduino sub-VI to another, the entire program will automatically stop if an error occurs anywhere within the Arduino sub-VI. In every cycle, all necessary inputs (i.e., the desired physical I/O channels, baud rates, and type of Arduino board used) will be passed through the series of subdiagrams controlling the microbioreactor operation. The entire operation functions repeatedly until the conditional Boolean operator in the while loop is met (i.e., when the stop button is pressed). At the termination sequence ( Fig. 5a ), all PWM signals that were specified to specific digital output pins are reset to zero before the Arduino Close sub-VI deactivates the LabVIEW interface and Arduino I/O card connection. This is essential to avoid any undesirable current flow from any of the digital pins when ending the operation.
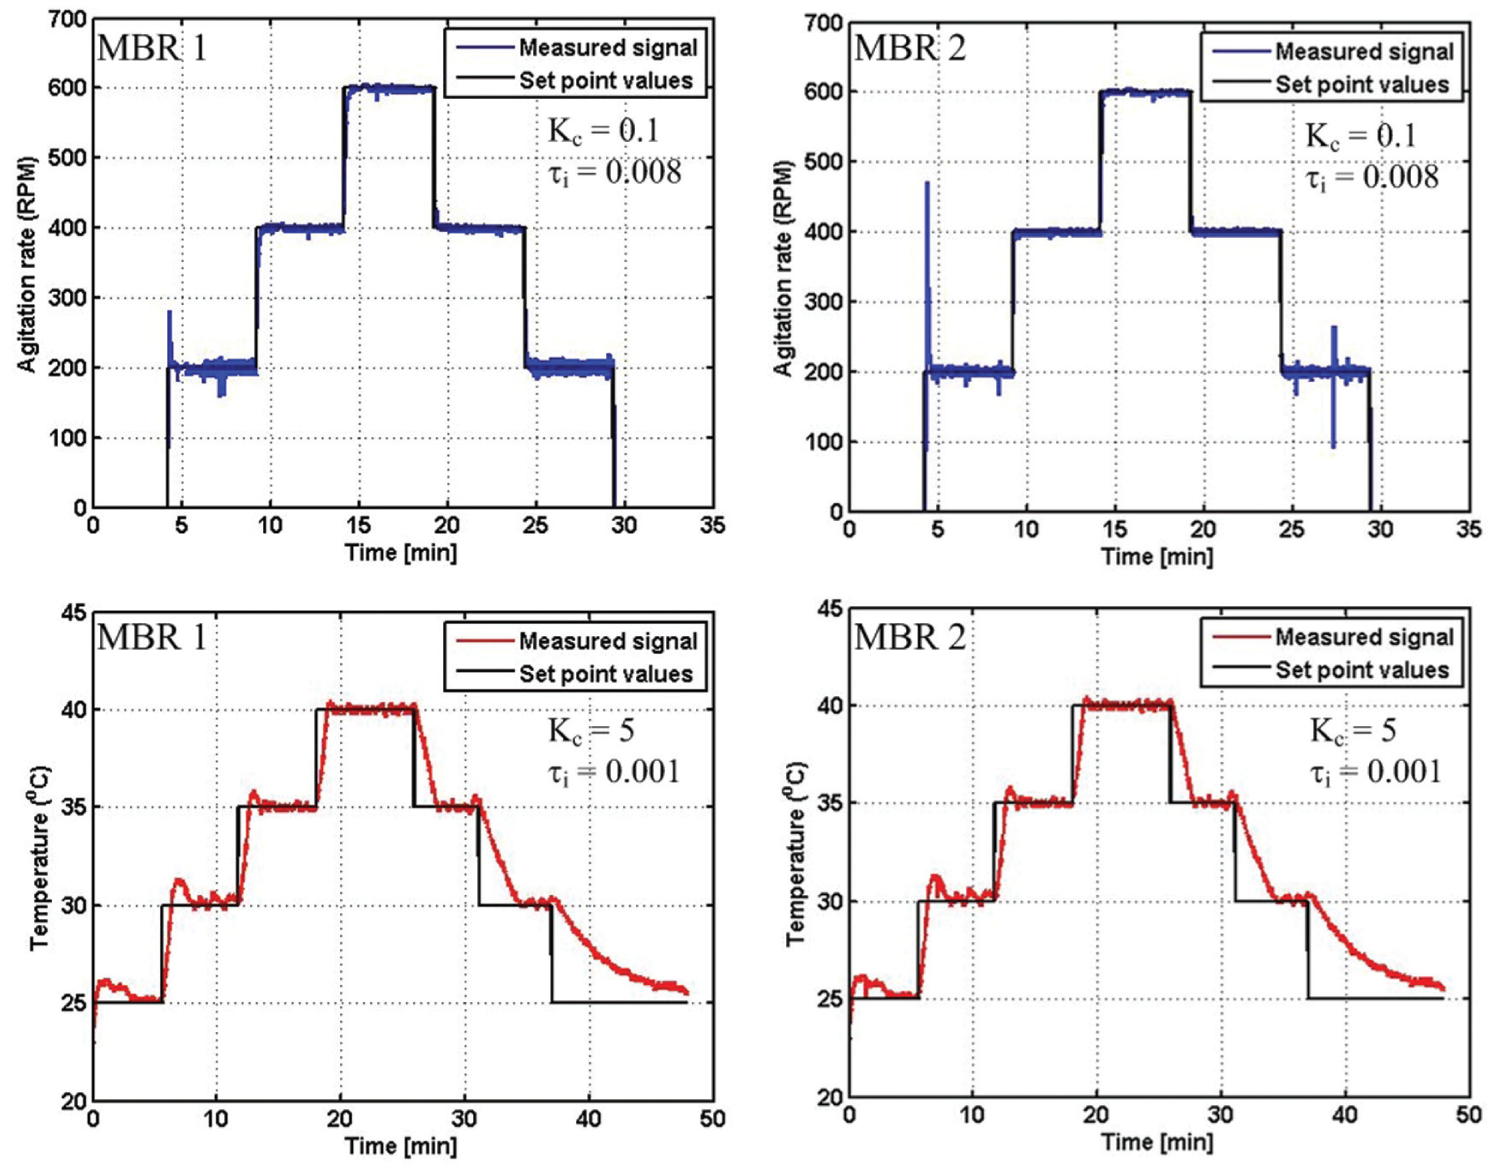
Response of the PI mixing speed (top) and temperature (bottom) controllers for a series of step changes in the agitation and temperature set point values, respectively. Responses of the first microbioreactors are on the left, and the second one is on the right. Duplicates were made to check reproducibility, and data points presented are the average values attained from the two experiments.
Figure 4b illustrates the image of the screenshot of the LabVIEW block diagram for one of the microbioreactor operations, which consists of the sensing and control routines for the microbioreactor temperature and mixing speed variables. For the temperature control, the Arduino Read sub-VI first read the analog voltage signal from the Pt 100 temperature sensor on the selected analog input pin (AI1). The temperature input signal was then fed to the PI controller sub-VI. Next, the PI controller sub-VI computed the deviation (error) between the desired temperature set point value and the measured signal. By using a math function, the temperature set point value (°C) was first converted to voltage signal values before being fed to the PI controller sub-VI. Based on the data specification of the sensing instrument, the voltage signal range of the Pt 100 sensor (i.e., 0–5 VDC) used was found to be in linear relation to the temperature values between the 0 and 100 °C range. With the given reference inputs (i.e., the PI high/low limits and gains), the PID controller sub-VI subsequently estimated the control output values. To minimize heat loss to electronics, the microheater was driven by PWM signals for heating. For the ArduinoAnalogWrite sub-VI, the PWM duty cycle signal ranged between 0 and 255 (i.e., between always off [0 V] and fully on [5 VDC]). This means that a call to analogWrite (255) would give out a 100% duty cycle, analogWrite (127) is a 50% duty cycle, and so on. Therefore, to calculate the proportional PWM duty cycle signals, the formula Duty cycle = [control output values (volts) × 255] / 5 volts was used. The resulting output values were then fed to the digital pin (DIG7) of the Arduino I/O card that was linked to the microheater.
As for the mixing speed control, a similar sensing and control routine was written except that the ArduinoRead sub-VI read the analog voltage signal produced by the Hall effect sensor, and a different output digital pin (DIG6) was used to drive the DC magnetic motor. The Hall effect sensor produces an analog voltage signal that is proportional to the number of pulses for every revolution per second (rps) made by the DC magnetic motor. The analog signals registered range from 0 to 5 VDC, and the corresponding digital values (i.e., the corresponding 10-bit PWM duty cycle signals) range between 0 and 1023. A similar mathematical formula was used to calculate the PWM duty cycle signals for the DC magnetic motor control. It is essential to note here that the DC magnetic motor rotational speed is directly proportional to the value of the applied PWM duty cycle signals. For example, a high duty cycle signal will produce faster rotational speeds and a low duty cycle will produce slower rotational speeds. All measurement signals and set-point values are displayed on the VI front panel and written (saved) to a file together with the current time stamp.
PI Mixing Speed and Temperature Controller Performance
Figure 5 shows the response of the PI mixing speed and temperature controllers for a series of step changes in the agitation and temperature set-point values for both microbioreactors. Both controllers were tuned based on the Ziegler-Nichols tuning method (data not shown), and the tuning parameters attained (i.e., the proportional gain, Kc and the integral time, τ i constants) are included in Figure 5 . The minimal and the maximum PI output values were set such that the actuators (i.e., the microheater and the DC magnetic motor) would operate within the desired range of interest. In our applications, the desired agitation speed limit ranged between 150 and 500 rpm. At this rate, the turbulence condition in the microbioreactor normally varies between the laminar flow condition and the transitional flow regime where the Reynolds number, NRe, is less than 1000 (NRe < 1000). It appears that for this type of microbioreactor design, the mixing time gradually increased at higher agitation rates (indicated by a shorter mixing time, tm).21,26–28 Furthermore, it is seemingly irrelevant to stir the reactor content at a much higher rate than 500 rpm since it may not improve the mixing efficiency by much. Schäpper et al. 21 and Zainal Alam et al. 28 reported that a well-mixed state can be achieved in approximately a second (tm = 1.2 s) at an agitation rate of 500 rpm. In this work, it took about 2.5 s to reach a complete mixing (indicated by a uniform color distribution) at an agitation rate of 300 rpm. Significant concentration difference facilitated the diffusion of the dye while vigorous agitation created a larger molecular interfacial area for mixing. This is shown in Figure 6 . As for the temperature limits, the operating range of interest is between 30 °C and 50 °C. This is because fermentation processes using mesophilic microbes (e.g., Escherichia coli, Saccharomyces cerevisiae, etc.11,29) and biocatalytic processes using industrial enzymes (e.g., amylase, 30 pectinase, 31 etc.) are usually performed within this temperature range.
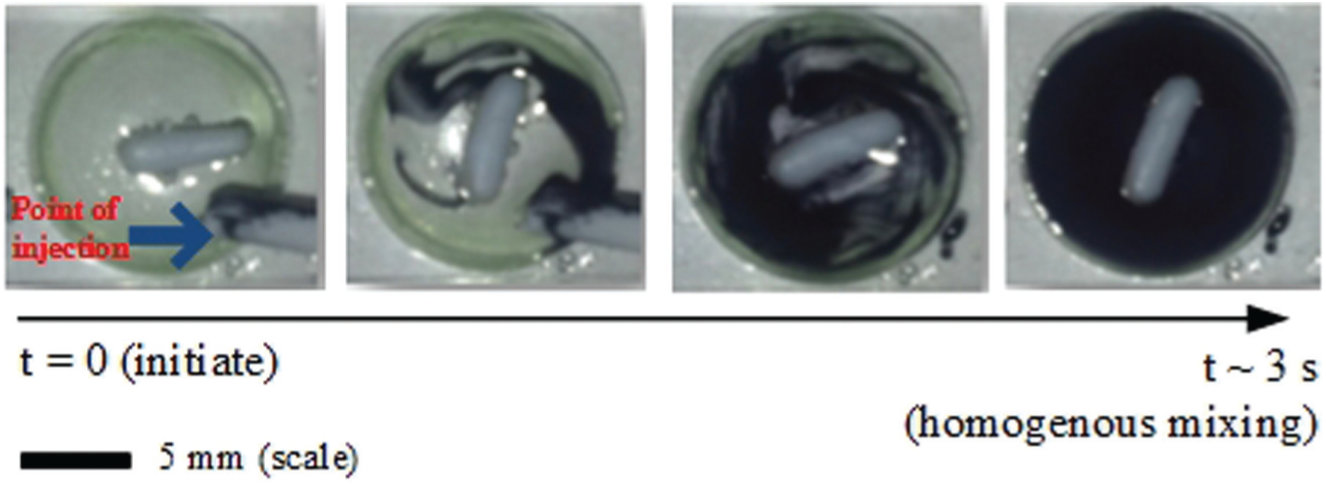
Images of mixing of the concentrated dye solution in the microbioreactor at a mixing speed, N = 300 rpm (NRE = 80). Blue arrow indicates the point of injection.
For the mixing speed control responses, it can be seen from Figure 6 that there were some obvious overshoots, and the measured mixing speed fluctuated within ±10 rpm of the set-point value at an agitation rate of 200 rpm. On contrary, at higher rates (i.e., at N > 300 rpm), much steadier responses (i.e., no apparent overshoot) with settling time on the order of a few seconds were obtained. The controller accuracy at this range was recorded to be about ±3 rpm of the set-point value. The results indicated that under these conditions (i.e., at Kc = 0.1 and τ i = 0.008), better responses are achievable at agitation rates higher than 200 rpm. It should be emphasized here that although the controller did not respond favorably for the entire range tested, the optimal settings and/or the controller constants can always be manually adjusted or determined with a couple of short experimentations to give a better response at the agitation rate of interest.
As for the temperature control, it was observed that there was a slight overshoot (around 3%–4% off the set-point value), and it took only a couple of seconds to reach a new steady state when the set-point values were adjusted from one set point to another. The accuracy of the PI temperature controller was calculated to be within ±0.2 °C of the set-point value. It can also be seen that there was no delay when the microbioreactor temperature was regulated. This is due to the high S/V ratio of the microbioreactor prototype, which facilitated relatively fast heat transfer rates. 6 This behavior was consistent each time the temperature was regulated from one set-point value to another. In our microbioreactor setup, there was no cooling element installed. This was deliberate, and cooling was merely achieved by taking advantage of the significant heat dissipation to the surrounding (natural convection). The cooling step may be slow (i.e., between 0.05 and 0.1 °C·s–1) but still within the acceptable length. This is because in our applications, the control objective is to keep the measured variable as close as possible to the desired set-point value, and it is not necessary to regulate (i.e., heat/cool) the reactor temperature at a very fast rate. The controller capacity in tracking various mixing speeds and the temperature set-point values accurately suggested that the system has a good control performance and is stable.
As the next process to prototype the system, once the system (proof of concept) is working as expected, the electronic circuit with customized printed circuit board (PCB) design and fabrication with dedicated discrete electronic components will be developed. This will enable us to employ a microcontroller-based interface with a very small footprint.
In conclusion, in this work, a low-cost microcontroller-based interface for microbioreactor operation was designed and realized. As proof of concept, two polymer-based microbioreactor prototypes (working volume ~800 µL) were fabricated and tested in parallel. The total cost for the presented system/rig—that is, the microcontroller interface (including all the discrete electronic components and the sensors) and the materials used for the fabrication of a single microbioreactor—was approximately €80. The proposed microcontroller-based interface demonstrated the capacity to (1) acquire real-time experimental data (in this case, online data of reactor temperature and mixing speed) and (2) produce PWM signals to regulate the actuators for the control of the above-mentioned variables. Online data are indeed crucial since they will enable the users to keep track of the dynamic progress of the experiments performed. The sampling rate applied for real-time sampling of experimental data was satisfactory as the actual state of the physical conditions of the reactor content has been accurately translated. The controller accuracy is also within the acceptable limit in which measured variables were very comparable to the set-point values and process responses were on the order of few seconds. Simple yet reliable interfacing circuits for the Pt 100 temperature sensors, Hall effect sensors, heater elements, and DC magnetic motors were designed such that the input and output signals to the periphery of the microcontroller were matched.
The aim of the work in interfacing a microcontroller-based platform for data acquisition and control of the microbioreactor operation has indeed been successful. The success of the project has motivated us, i.e., as future work to further expand the automated measurement and control features of the microbioreactor. The reactor at its current state (i.e., equipped only with temperature, evaporation, and mixing speed control) may have a limited application, e.g., may only be suitable to carry out studies on biocatalysis processes. In order for the microbioreactor system to cater to different bioprocessing operations, e.g., microbial fermentation experiments and/or cell culture applications, additional features such as cell density measurements, DO level, and pH control are imperative. These types of measurements are normally realized by using optical measurement techniques. For example, optical cell density measurement can be done by comparing the amplitude of the sine wave signal (alternating-current signal) at a frequency of 47 Hz. In contrast, pH and DO level measurements use a sine wave (or square wave) with higher frequencies (pH measurement [44 kHz] and DO level [5 kHz]), and measurements are based on the phase difference produced by optical sensor spots (optodes). In practice, higher sampling rates are often needed for measurements (e.g., four to five times higher than the transmitting signal, according to the Nyquist theorem). Nevertheless, the available microcontrollers with a clock speed up to 100 MHz can easily accommodate the sampling rate of these measurement methods. Another added advantage is that the microcontroller-based interface also offers the flexibility for a compact module design for data acquisition and control. All the necessary interfacing circuits, power units, sensors, and actuators, for instance, can be embedded into a confined module, as illustrated in Figure 7 , in modular design.
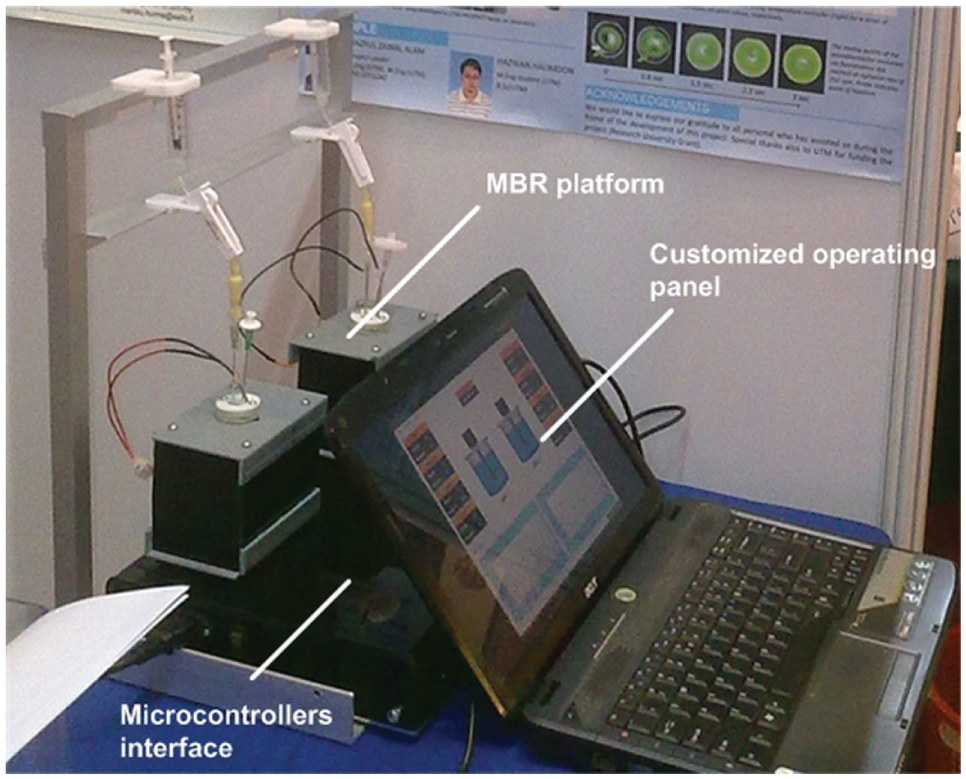
A compact microcontroller-based interface with custom-made user interface for a parallel microbioreactor operation.
Footnotes
Acknowledgements
We express our gratitude to the Malaysia Ministry of Higher Education (MOHE) and Universiti Teknologi Malaysia for funding the project.
Declaration of Conflicting Interests
The authors declared no potential conflicts of interest with respect to the research, authorship, and/or publication of this article.
Funding
The authors disclosed receipt of the following financial support for the research, authorship, and/or publication of this article: The project was funded by Universiti Teknologi Malaysia Research University Grant (vote number, 06J83). It is a general grant for development of an engineering-based prototype that covers mainly materials and fabrication cost. Contributors who received the support include Abdul Rashid Husain, Yaser Hadad, and Muhd Nazrul Hisham Zainal Alam, who are staff and student (Yaser Hadad) of Universiti Teknologi Malaysia, Malaysia. Successful research work that has to be published was the main interest of the supporting body.